Review

UAS for Wetland Mapping and Hydrological Modeling

by
Justyna Jeziorska
Center for Geospatial Analysis, North Carolina State University, Raleigh, NC 27695, USA
Current Address: 2800 Faucette Drive, Raleigh, NC 27695, USA.
Remote Sens. 2019, 11(17), 1997; https://doi.org/10.3390/rs11171997
Submission received: 16 July 2019 / Revised: 17 August 2019 / Accepted: 20 August 2019 / Published: 24 August 2019

Abstract

:
The miniaturization and affordable production of integrated microelectronics have improved in recent years, making unmanned aerial systems (UAS) accessible to consumers and igniting their interest. Researchers have proposed UAS-based solutions for almost any conceivable problem, but the greatest impact will likely be in applications that exploit the unique advantages of the technology: work in dangerous or difficult-to-access areas, high spatial resolution and/or frequent measurements of environmental phenomena, and deployment of novel sensing technology over small to moderate spatial scales. Examples of such applications may be the identification of wetland areas and use of high-resolution spatial data for hydrological modeling. However, because of the large—and growing—assortment of aircraft and sensors available on the market, an evolving regulatory environment, and limited practical guidance or examples of wetland mapping with UAS, it has been difficult to confidently devise or recommend UAS-based monitoring strategies for these applications. This paper provides a comprehensive review of UAS hardware, software, regulations, scientific applications, and data collection/post-processing procedures that are relevant for wetland monitoring and hydrological modeling.

Graphical Abstract

1. Introduction

The past decade has seen rapid progress in the miniaturization and affordable production of integrated microelectronics. These developments have made unmanned aircraft systems (UAS) accessible to consumers, and piqued interest in their application to a wide variety of problems. Concurrent advances in sensor technology and data processing have enabled a diverse array of highly accurate measurements to be made with UAS. Regulators have been challenged to keep pace with rapid commercial development and emerging practices, but have responded with clear guidance that preserves a niche for UAS use in commercial and research endeavors. UAS-based solutions have been proposed for almost any conceivable problem, but the greatest impact will be realized for applications that exploit the unique advantages of the technology, namely: work in dangerous or difficult to access areas, high spatial resolution and/or frequent measurements of environmental phenomenon, and deployment of novel sensing technology over small to moderate spatial scales. Collecting spatial data with very high resolution, perhaps frequently, and, with unique sensors, creates many opportunities for environmental monitoring. Without UAS, most environmental monitoring applications resort to time and resource intensive manual collection of highly detailed information, and/or rely on much coarser scale but more extensive airborne or satellite observations. UAS-based observations offer a middle-ground between these scales of measurement, and so will be most useful when applications require very detailed information of areas too large for manual data collection, but somewhat smaller than is offered by manned aircraft. The identification of jurisdictional wetland areas for road planning purposes is potentially one such application. However, because there is a large and growing assortment of aircraft and sensors available on the market, an evolving regulatory environment, and limited practical guidance or examples of wetland mapping with UAS, it has been difficult to confidently devise or recommend UAS-based monitoring strategies.
This paper provides comprehensive review of UAS hardware, software, regulations, scientific applications, and data collection/post-processing procedures that are relevant for wetland monitoring. Section 2 provides an overview of the wetland mapping problem and identifies areas that UAS-based observation can provide unique and helpful information. Section 3 provides an overview and technical details for a wide variety of commercially available flight platforms and UAS-mountable sensors. Section 4 gives a detailed account of the UAS data collection procedure including flight planning and post-processing, as well as regulatory information. Finally, Section 5 summarizes the scientific literature on mapping of wetlands from remote sensors and other closely-related topics.

2. Background

The challenge in mapping wetlands lies in their delineation from the ground [1]. The diversity and density of the vegetation as well as the presence of saturated and unstable areas that are impossible to reach by surveyors call for an alternative mapping solution. Therefore, since the advent of aerial photography, in the second half of the 18th century, mapping wetland extents from a “birds eye” perspective has been the goal of many aerial surveys. The past several decades have seen a proliferation of imagery from orbital and airborne platforms with a wide range of spatial and spectral resolutions [2,3]. Still, the delineation of wetlands has remained challenging. Until recently, there has been a lack of orbital satellites with the ability to produce the very high spatial resolution imagery that might enable the delineation of small wetlands. Even now, with a relatively high number of commercial satellites collecting very high spatial resolution multispectral imagery, the data remain mostly inaccessible due to the high cost, and there have been very few successful wetland mapping efforts [4,5]. Traditional aerial photography from manned aircraft offers an alternative, but this sensing technology is also constrained by cost, operational complexity, and logistical considerations. In terms of spatial scale of measurement and mapping, there has been a void between large to medium sized areas that are the domain of manned aerial surveys, and very small, fine scale terrestrial measurements collected at individual points or for small plots. Advances in unmanned aerial technology promise to fill this gap and provide the types of highly detailed measurements previously only possible with laborious ground measurements, but at much broader spatial scales. UAS provide an alternative platform for capturing data with versatility, adaptability and much greater flexibility than manned airborne systems and satellites, and can offer spatial and spectral resolutions comparable to terrestrial surveys at a fraction of the cost [6]. Additionally, thanks to the ease of use and flexibility of deployment, information can be kept up-to-date more practically and efficiently.
While satellites are still the leading source of large coverage data, UAS are irreplaceable when it comes to affordability and spatial resolution. The ability of UAS to provide sub-centimeter resolution imagery (and frequently) is unmatched by satellite alternatives (see Figure 1). Manfreda et al. [5] provide a cost comparison between satellite imagery and UAS data. They indicate that satellite provision of high resolution natural color imagery (50 cm/pix) can cost up to $3000, whereas UAS not only provide higher resolution (even to couple cm/pix) but for less than $1000. Unlike satellite or airborne alternatives, the operation of UAS typically requires an initial investment in a UAS platform and the processing software. However, Manfreda et al. [5] argue that, after the purchase, the temporal resolution is limited only by the number of flights (and power supply/battery capacity), so any cost equivalence is quickly overcome due to repeatability. Data storage, man power, field expenses and incidental maintenance are additional, but usually minor costs.
An additional comparison of the cost of data acquisition and processing by UAS, manned aircraft and satellite by Matese et al. [7] shows that UAS are the most cost-effective solution for areas 20 ha or smaller. Their quantitative analyses show that the approximate total cost of a UAS-derived normalized difference vegetation index (NDVI) map over a 5 ha field is equal to $450/ha, while similar satellite products may cost about 30% more. Another example of a cost benefit of using UAS can be found in Dustin [8]. The cost of purchasing a UAS platform for the purpose of mapping a park area with an extent of approximately 10 ha is 20% lower than the starting price of hiring a manned aircraft to collect data one time. The cost effectiveness would increase significantly for data collection on a regular basis since the initial cost of a platform will not contribute to the expenses. More information of the cost and time effectiveness of UAS can be found in Section 4.3.
The advantages of UAS for environmental applications such as wetland monitoring go far beyond their cost effectiveness and ability to obtain very high spatial and temporal resolution data. For instance, the rapidity of UAS-based data collection offers near real time spatial information, whereas there is often a lag associated with alternative methods. The flexibility of deployment, especially for the case of rotary-wing UAS solutions (see Section 3.1), solves a number of accessibility and safety issues in dangerous or hard to reach areas (e.g., in wetlands) [9]. Although UAS operation depends on weather conditions, van der Wal et al. [10] calculated that satellite-based remote sensing has a 20% probability of producing an adequate image, while the probability of a usable image from a light-weight, weather sensitive UAS is 45% and rises to over 70% if an all-weather UAS is used. Unlike the sun-synchronous satellite sensors, collecting data with UAS is not limited to certain hours, and with adherence to legal procedures (see Section 4.4) enables near continuous environmental monitoring [5].
These aforementioned capabilities, together with the increasing variety and affordability of UAS and sensor technologies, and the rapid development of processing solutions, have resulted in booming interest in UAS utilization from researchers across various environmental domains.

3. UAS Platforms

Remote sensing platforms have been used as a tool for acquiring spatial data even before the invention of the airplane. The need of a bird’s-eye view of the Earth surface was pushing the photography pioneers to place cameras in hot air balloons, kites, and even mount them on the breasts of pigeons. With the invention of the airplane, manned airborne aerial photographs started to revolutionize military reconnaissance and surveillance. Analog photographs became the first form of remote sensing used within geography. The next pivotal moment for the development of photogrammetry as a science and technology of making measurements from pictures was the invention of digital photography coupled with advances in computer science during the last decades of the 20th century. In the same time period, UAS technology was widely used in the military context, but its potential for spatial data acquisition was recognized early by geospatial researchers [11]. Their early experiments initiated the use of UAS in photogrammetry and remote sensing. Twenty-first century advances in computer science, imaging sensors, autonomous and remote control techniques, miniaturization of electronic components and the increasing accuracy of global navigation satellite system (GNSS) and inertial measurement units (IMU) paved the way to the rapid development of UAS technology and forever changed the field of photogrammetry and remote sensing, and created endless possibilities for research and business applications.
These most recent developments have occurred at an incredible pace, so the intent of this section is to make sense of the wide variety of currently available platforms and sensors that comprise a UAS.

3.1. The System

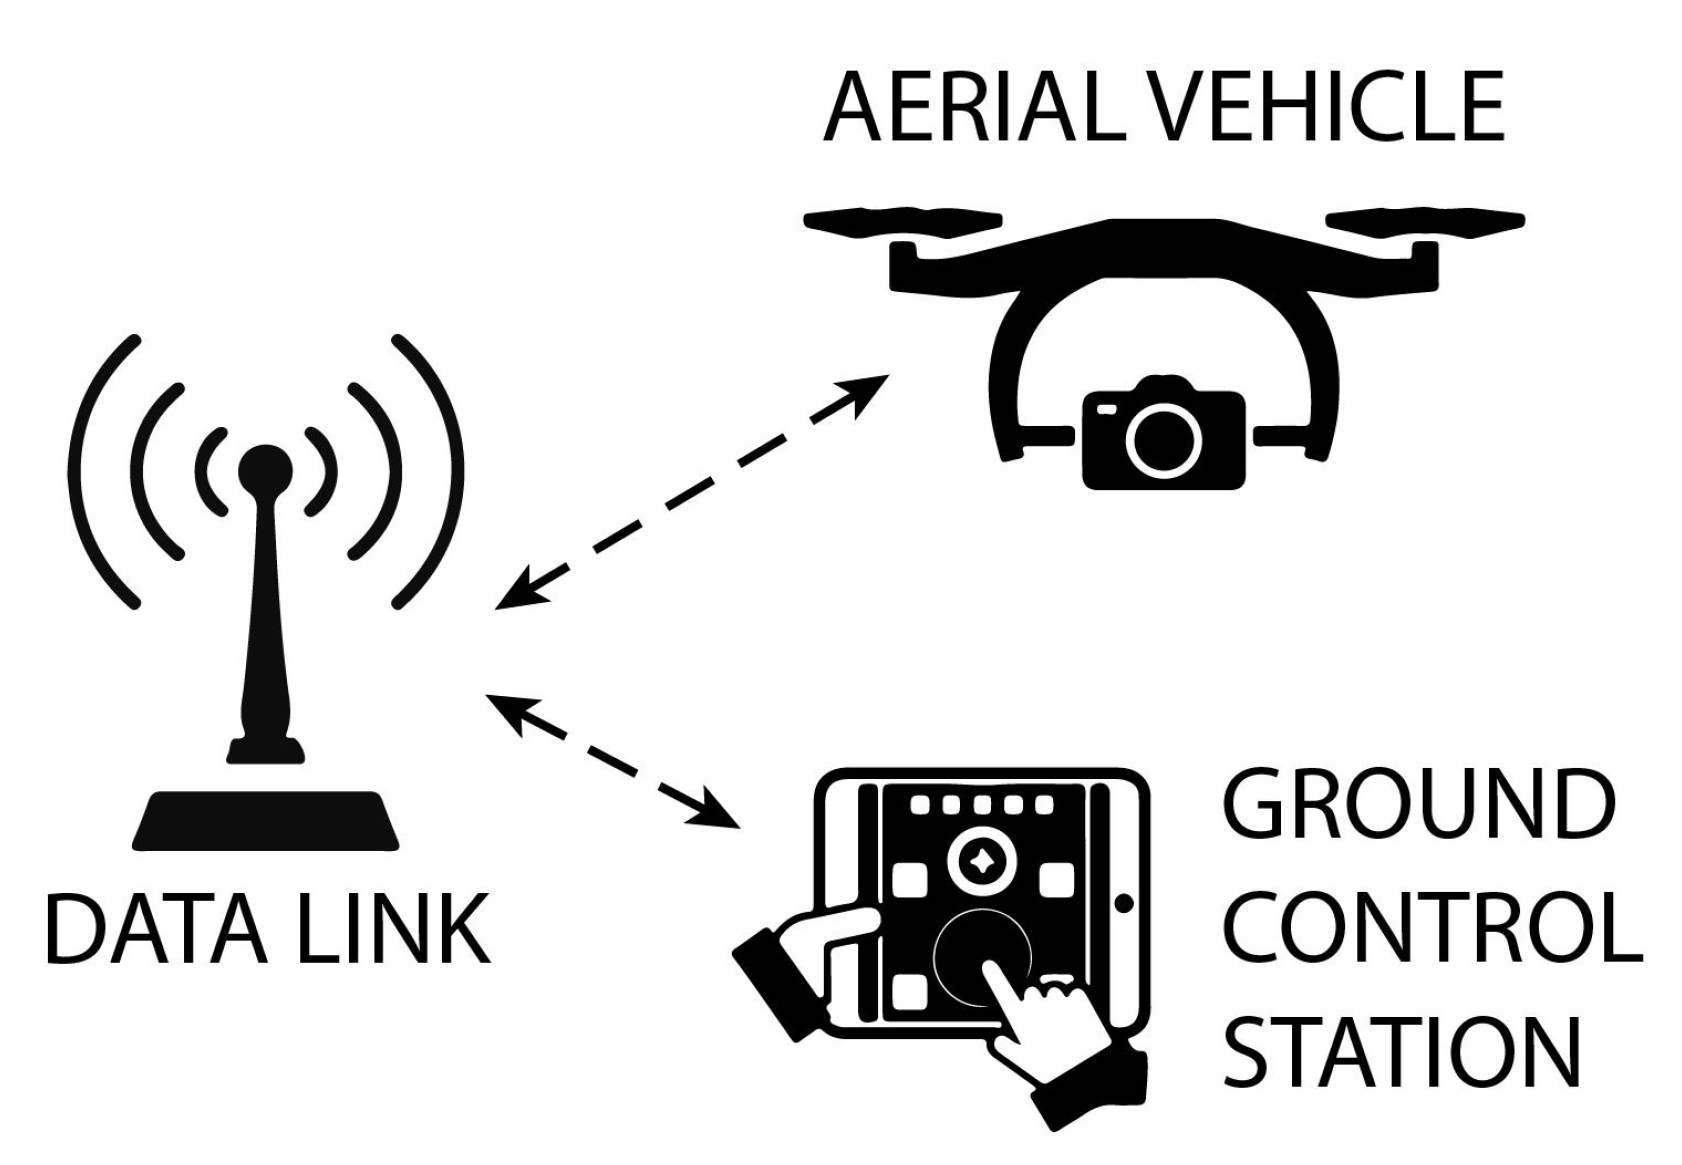
The reader can easily be lost with the multitude of names describing UAS. The media popularized term “drone” can be misleading, pointing out only the flying vehicle itself. Unmanned aerial vehicle, or UAV, has been used interchangeably with the term UAS, but most recently the latter gained more popularity since including the word system best describes the complexity of the technology. In particular, the term UAS better captures the fact that the aerial vehicle is just one of the components in a much larger system (Figure 2).
A UAS aircraft’s flight trajectory can be preprogrammed to fly autonomously or manually controlled by a remote pilot. In both cases, the ground control station (tablet, laptop, remote control, etc.) is a critical component of the system. The data link enabling the communication between aircraft and ground control station is the third essential element of a generic UAS. Depending on the technology and applications, various UAS models differ not only in size and design but also in included system components. To the most important belong: autopilots, navigating sensors, mechanical steering components, and payloads (typically data acquisition sensors).
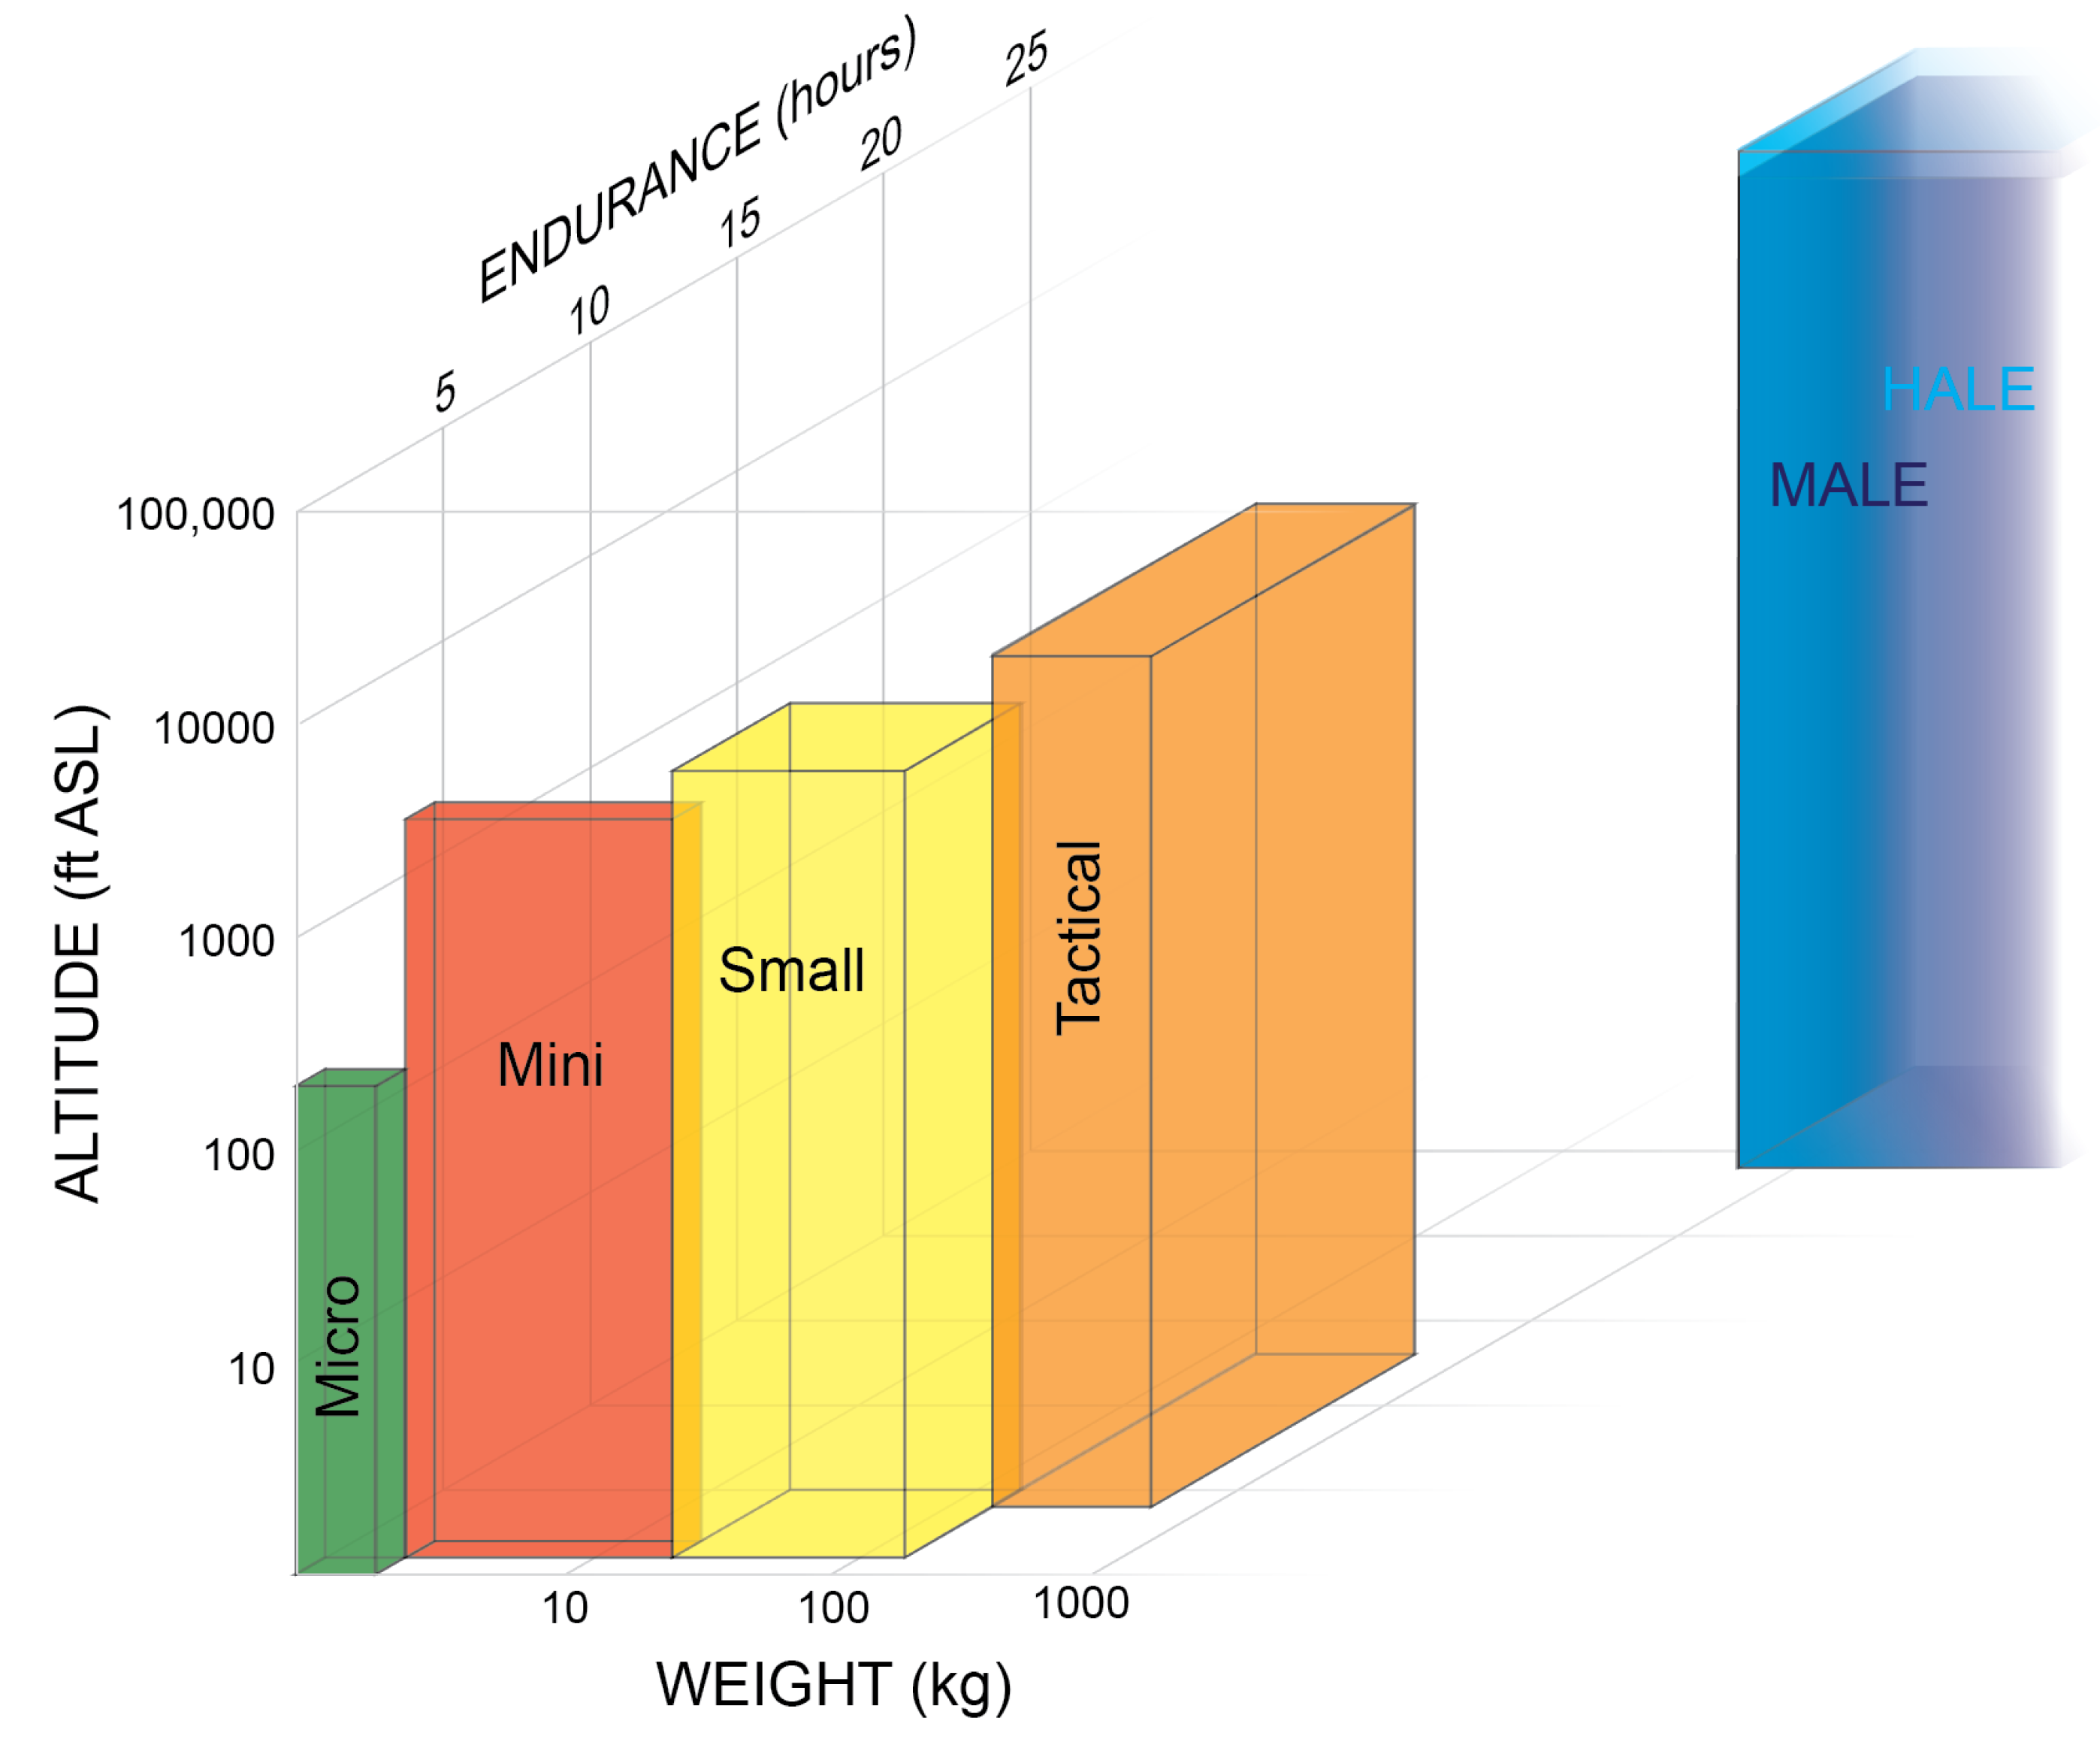
The multitude of solutions and systems has invited extensive categorization efforts. Moreover, the diverse and changing nomenclature is amplified by constant innovations and shifts in technology. The extensive study on UAS typology presented by [12] covers a variety of classifications, but there is no consistent and commonly accepted schemed of categorizing UAS. Multiple factors (size, weight, flying altitude, endurance, range, etc.) and their combinations create endless ways of grouping UAS into categories (see Figure 3). These characteristics influence the payload carrying capacity, as well as operating altitude and range [13]. Examples of such classifications can be found in Nex and Remondino [14], Fahlstrom and Gleason [15], Austin [16], Watts et al. [9] and Zhang and Kovacs [17]. The U.S. Department of Defense has proposed five groups (with group 1 having micro and mini subdivisions), presented in Table 1 and depicted in Figure 3. There is an inconsistency in the naming of these groups (Department of Defense officially uses only numbers), but, after Qi et al. [18], we present the nomenclature commonly used in the field. The use of large (HALE, MALE) and medium sized (tactical) UAS are very restricted (almost exclusively to the military) because of high cost and regulatory burdens. Therefore, the focus of this review is narrowed to systems up to 55 lbs. (~25 kg) that can be legally used in the United States for civilian purposes.
Recent legislative changes (see Section 4.4), coupled with technological advances and miniaturization of electronic components, including the sensors, has precipitated a proliferation in the market of small, lightweight, off-the-shelf devices that belong to the “micro”, “mini”, or “small UAS” categories. Although their diversity in capabilities and designs is ever increasing, two main types can be recognized: fixed wing and multi-rotor UAS (though hybrid systems do exist).
In the context of hydrological applications and wetland mapping, the initial choice of the type of platform depends on the scope of the particular project. While the nature of the acquired data depends largely on the onboard sensors (described in Section 3.2), the platform itself plays a critical role in the success of the remote sensing mission and constrains the types of sensors that may be deployed and flight planning. Fixed wing aircraft has a distinct advantage for wetland mapping because their substantially higher endurance affords the ability to cover much large areas than the average multi-rotor UAS. Fixed wing UAS have been extensively used in land surveying (especially in rural areas), agriculture and environmental management [19,20,21]. The higher endurance of fixed wing aircraft is a consequence of their greater aerodynamic efficiency and higher flight speed. In many applications, these characteristics also make the aircraft more stable and allows for greater control over the resulting image quality. Fixed wing UAS have several advantages over the multi rotor UAS (see Table 2), but rotary wing (or multi-rotor) aircraft still have distinct applications within wetland mapping.
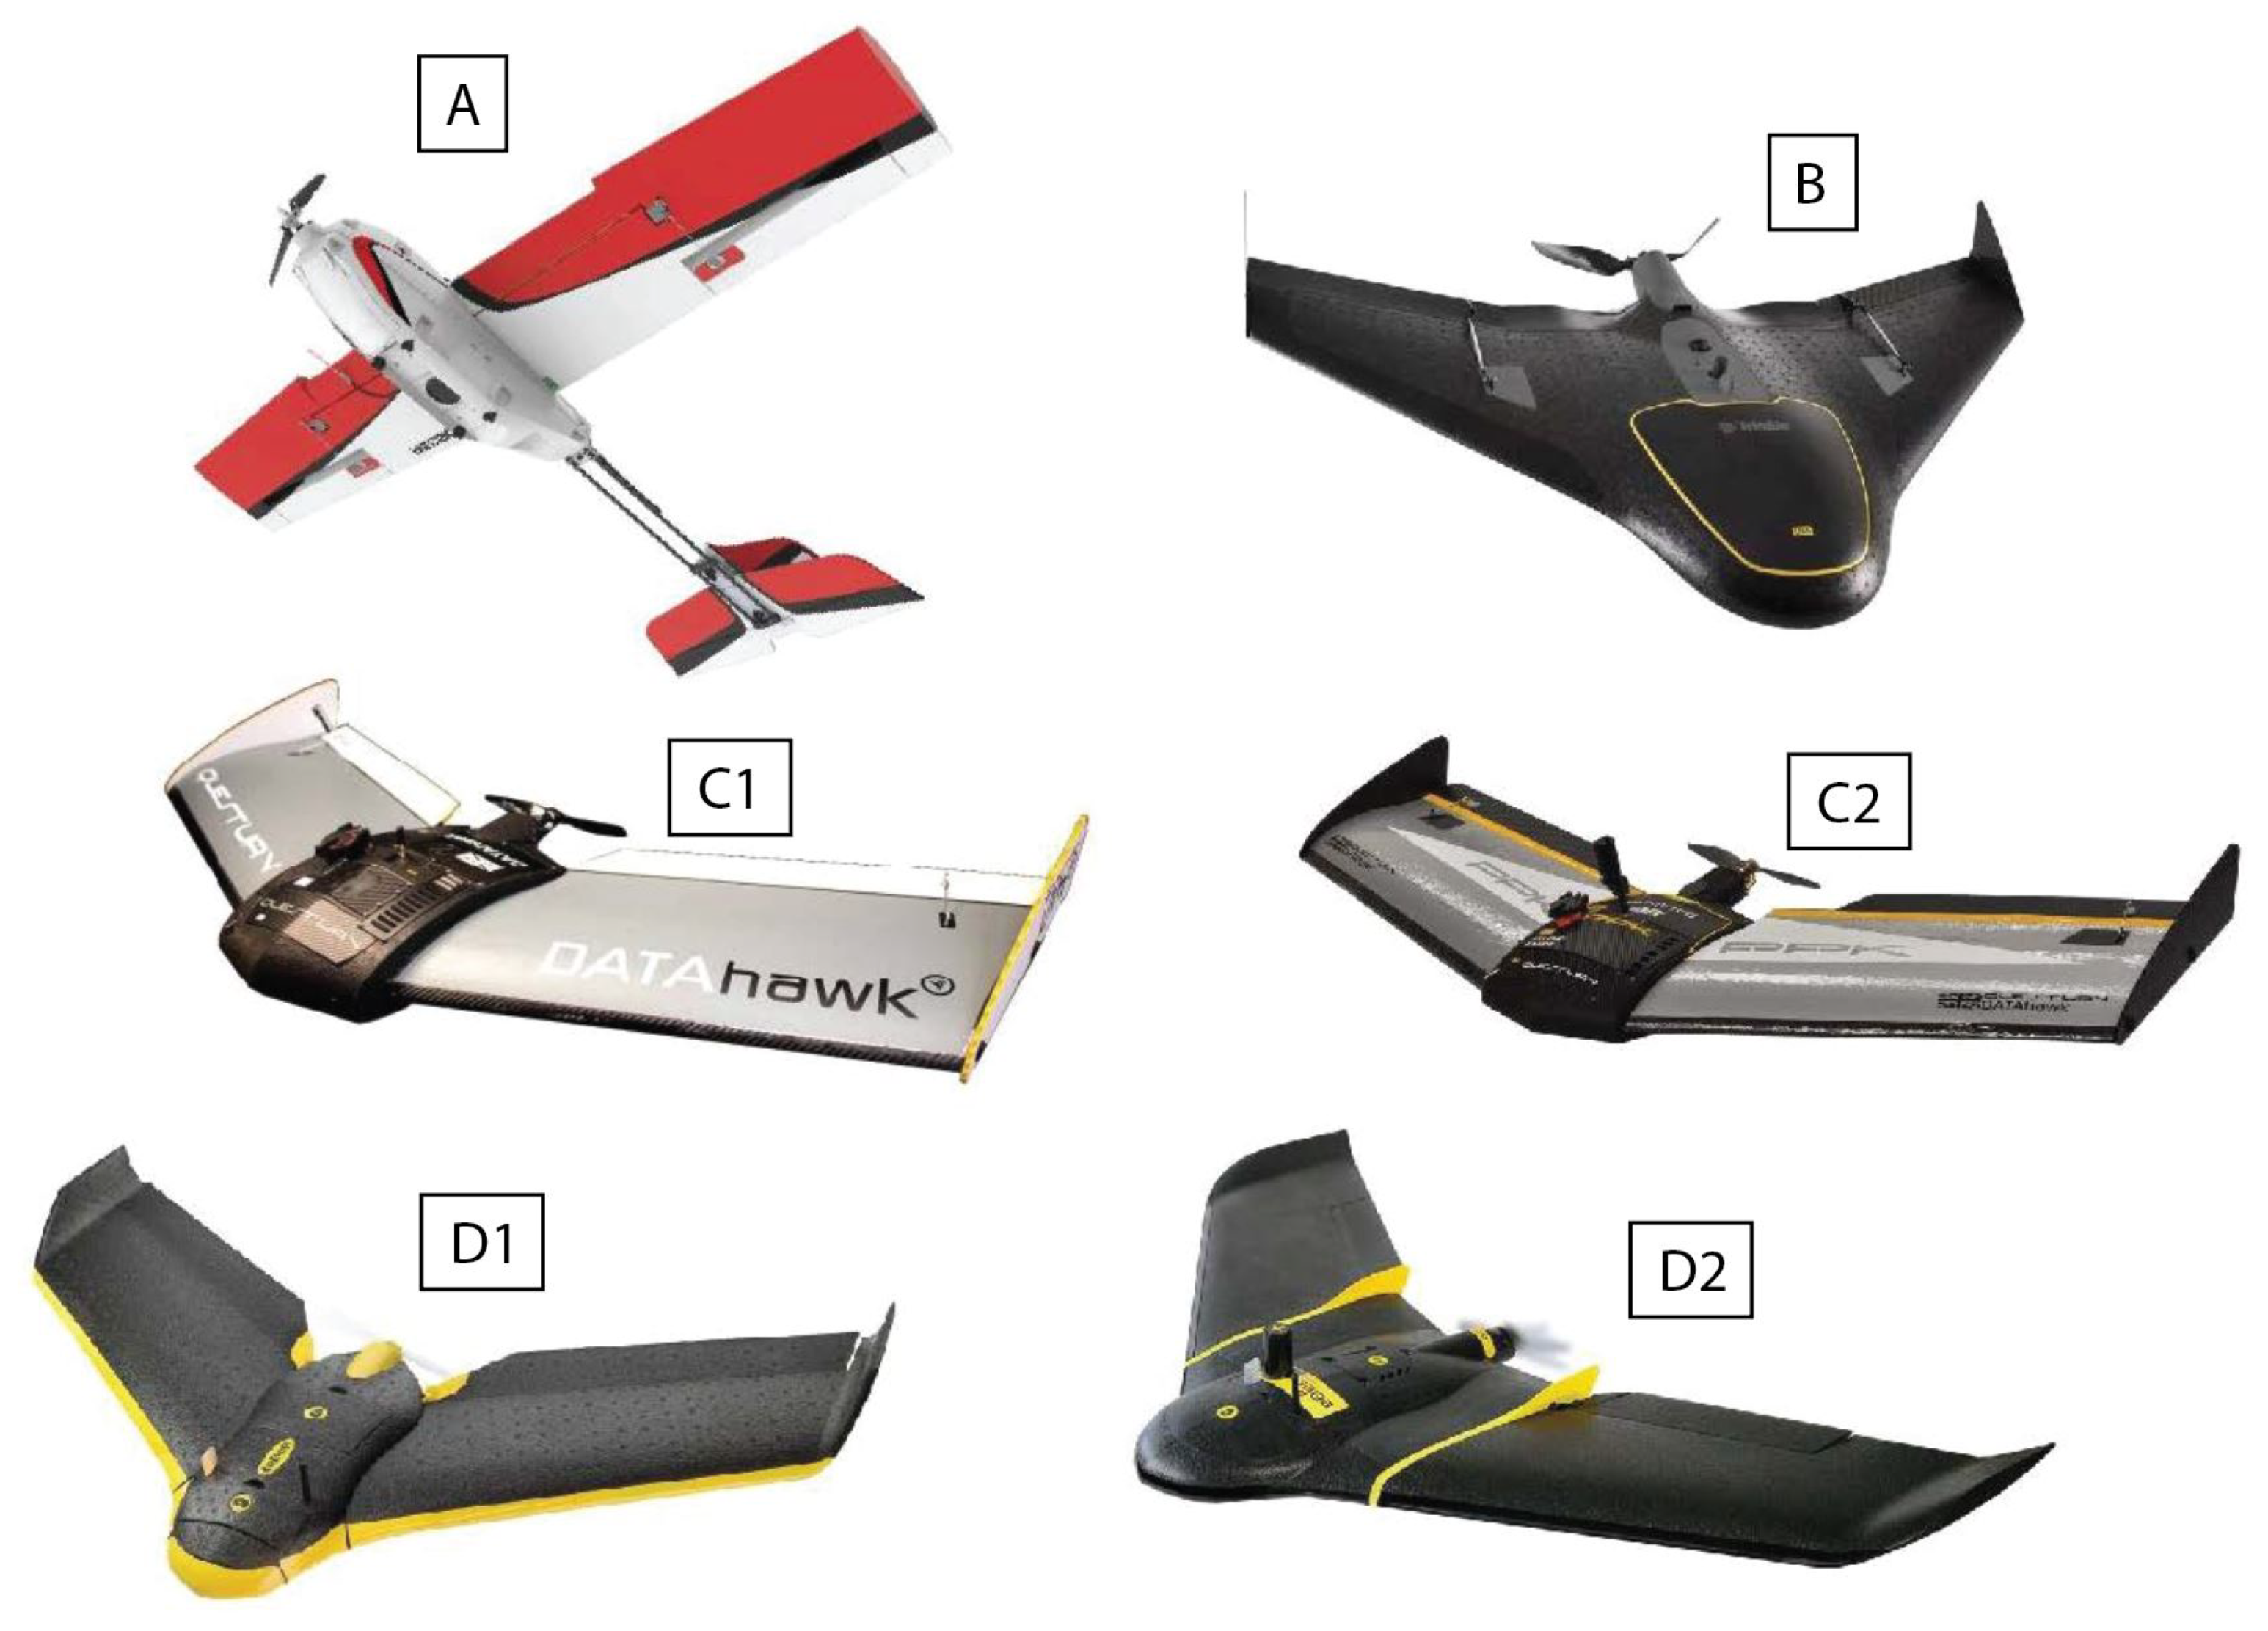
Rotary wing UAS can be divided into subclasses based on the number of rotor blades. The most common are quadrocopters and hexacopters (four and six rotors, respectively). Due to low prices and ease of use, the market of small multi-rotor UAS has boomed in recent years. The relatively shorter endurance of multi-rotor UAS substantially limits the size of the area that can be mapped with one flight. However, multi-rotors have distinct capabilities that may be important in certain contexts: higher payload capacity, ability to remain in one place for a longer time and capture data while hovering, ease of collecting oblique imagery from multiple angles, improved agility and maneuverability that may enable measurements in inaccessible places, and vertical take-off and landing that allows for more flexible deployment and in areas that would be inaccessible with fixed-wing aircraft. Some hybridized solutions offer the aerodynamic advantages of fixed-wing aircraft with the flexibility of VTOL (vertical take-off/landing) or STOL (short take-off/landing). While small size fixed wing UAS (e.g., the Sensefly eBee or Quest UAV Datahawk, see Figure 4) can be launched from the hand, bigger platforms require not only a relatively large take-off/landing zone, but also additional launching equipment (e.g., a catapult). We believe these hybrid solutions that combine high endurance and VTOL capability—for example, the ARCTURUS JUMP series, with the ability to carry heavy payloads—are the future of large scale unmanned aerial mapping. However, the use of such systems for civilian purposes is restricted in most countries, including the U.S., by current legislation (see Section 4.4).

3.2. Sensing Payloads

The optimal combination of carrier and sensing payload is an essential element for obtaining valuable data with UAS-based airborne photogrammetry and remote sensing. While there are an increasing amount of fully-integrated platforms available (i.e., aircraft and sensor packages), these typically serve a few specific use cases such as aerial photography and video (equipped with traditional Visual-Band cameras) or thermal inspection. For applications not served by these integrated offerings, users must carefully consider the pairing of aircraft and sensor. Fitting a remote sensing payload into the weight, volume or mounting restrictions of a specific aircraft is often challenging. Luckily, the availability of a wide variety of UAS-specific sensing payloads has radically increased in recent years. An extensive review of advancements in remote sensing instruments can be found in Remondino [22] and further analysis was published by Colomina and Molina [23]. Here, we aim to summarize the most relevant commercially available UAS sensor offerings for wetland mapping and hydrological modeling. We focus particularly on five types of sensors: visible-band (optical), near-infrared (NIR) and multispectral, hyperspectral, thermal, and laser scanners.
While current market sensor offerings are considerable, it is predicted to expand even faster in upcoming years. Constant improvements enabled by evolutionary advances in miniaturization result in new models appearing on the market each month. It is crucial for a potential buyer to be closely watching those advancements. We expect that this trend will lead to ever smaller, lighter, cheaper, and more capable sensors in the coming years. These advances should increase deployment flexibility because smaller and more affordable UAS systems will be able to carry increasingly sophisticated sensor payloads.

3.2.1. RGB (Visible-Band) Cameras

Visible light sensors are capable of capturing imagery perceptible to the human eye. Optical visible light cameras operate in the approximate wavelength range from 400 to 700 nm [16]. Since the market of visible range cameras is vast, from mass produced consumer-grade cameras, to professional models, the UAS manufacturers and designers frequently mount existing models on their aircraft. An example of such a solution is the Sony ILCE-QX1 (see Table 3 and Figure 5) mounted on the QuestUAV products.
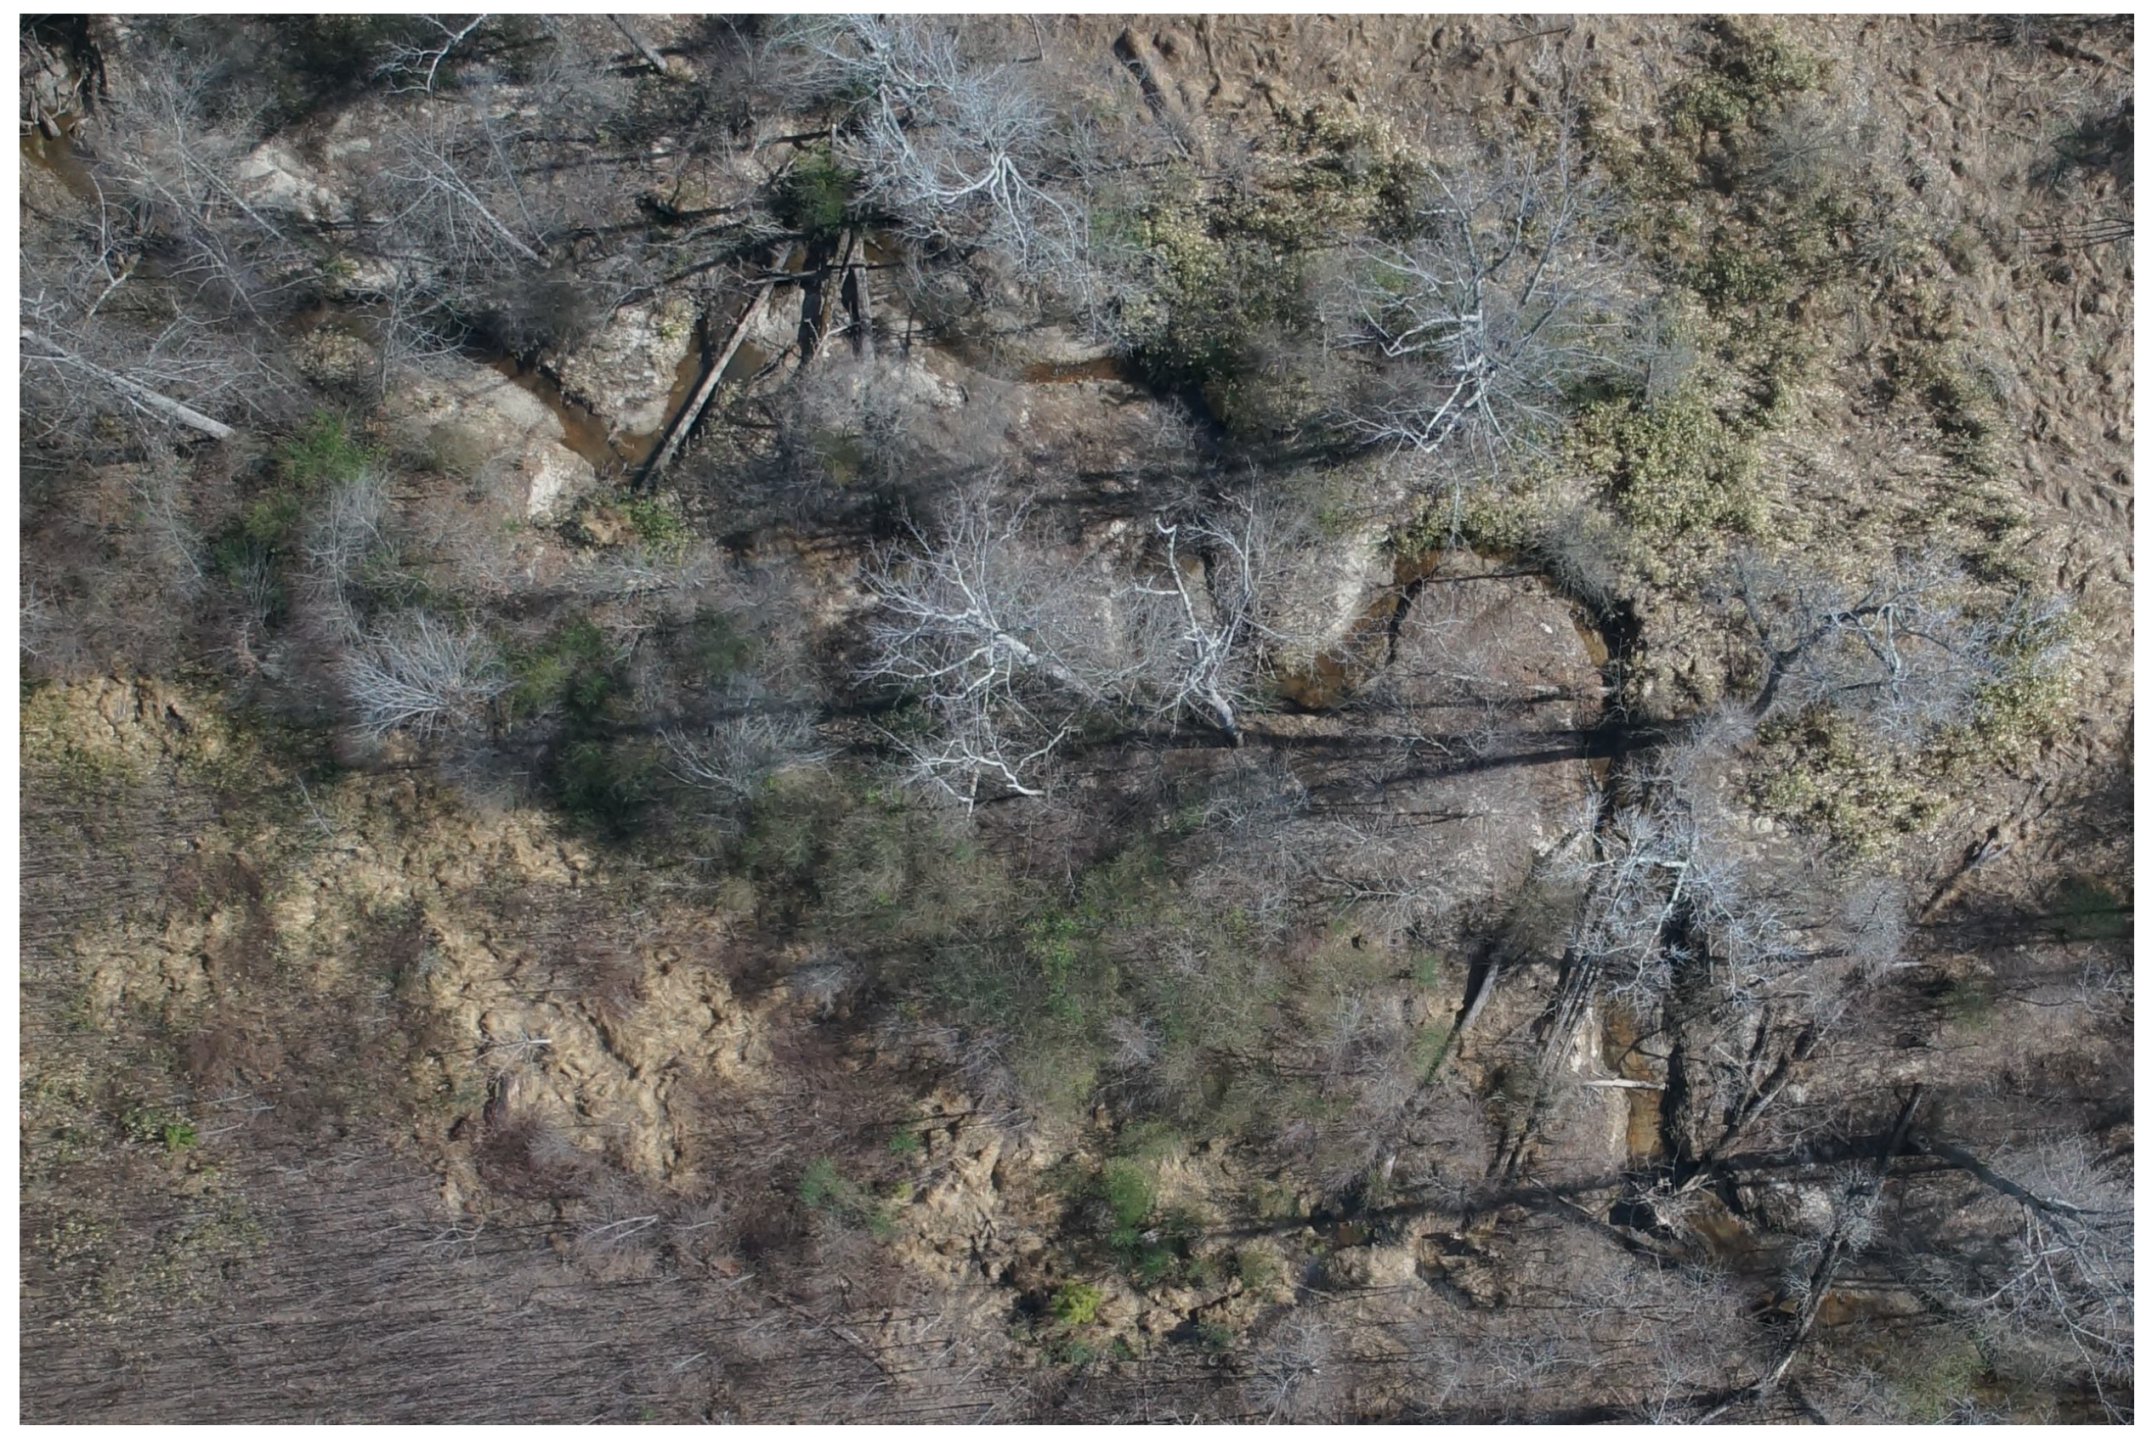
Since mapping and environmental monitoring is only one of the range of UAS applications, it is crucial to know the characteristics of the camera (and the mounting system) to be able to collect useful data. Most of the off-the-shelf drones are equipped with cameras that are used for filming and aerial photography and are not recommended for mapping purposes. However, some of the cameras (like DJI Zenmuse X7, see Table 3 and Figure 5) are successfully used in both the entertainment industry and for mapping missions. In these cases, the most relevant characteristics of the camera are its image resolution and speed. Many RGB sensors mounted on UAS are capable of providing high-resolution imagery from a bird’s eye perspective, as presented in Figure 6. These types of camera are, by far, the most common and the most affordable monitoring sensors.
These simple cameras realize their environmental mapping and monitoring capabilities through the use of Structure from Motion (SfM) and Multiple View Stero (MVS) algorithms, described in detail in Section 4.2. As a result of processing, the RGB imagery can be stitched into orthomosaics [24] but can also provide 3D information about the area in form of a 3D mesh, and georeferenced products: point clouds and Digital Surface Models (DSMs). Orthophotos and DSMs are used extensively in wetland monitoring and mapping (more in Section 5). The shortcoming of the RGB imagery stems from its very essence—since they capture only the visible spectrum, there is no information about the bare ground under dense vegetation or below canopy line (see Figure 7). Nevertheless, these cameras serve an important purpose within the context of environmental monitoring, particularly for the creation of high resolution maps to aid visual interpretation and inspection of difficult to access or dangerous areas.

3.2.2. NIR and Multispectral Cameras

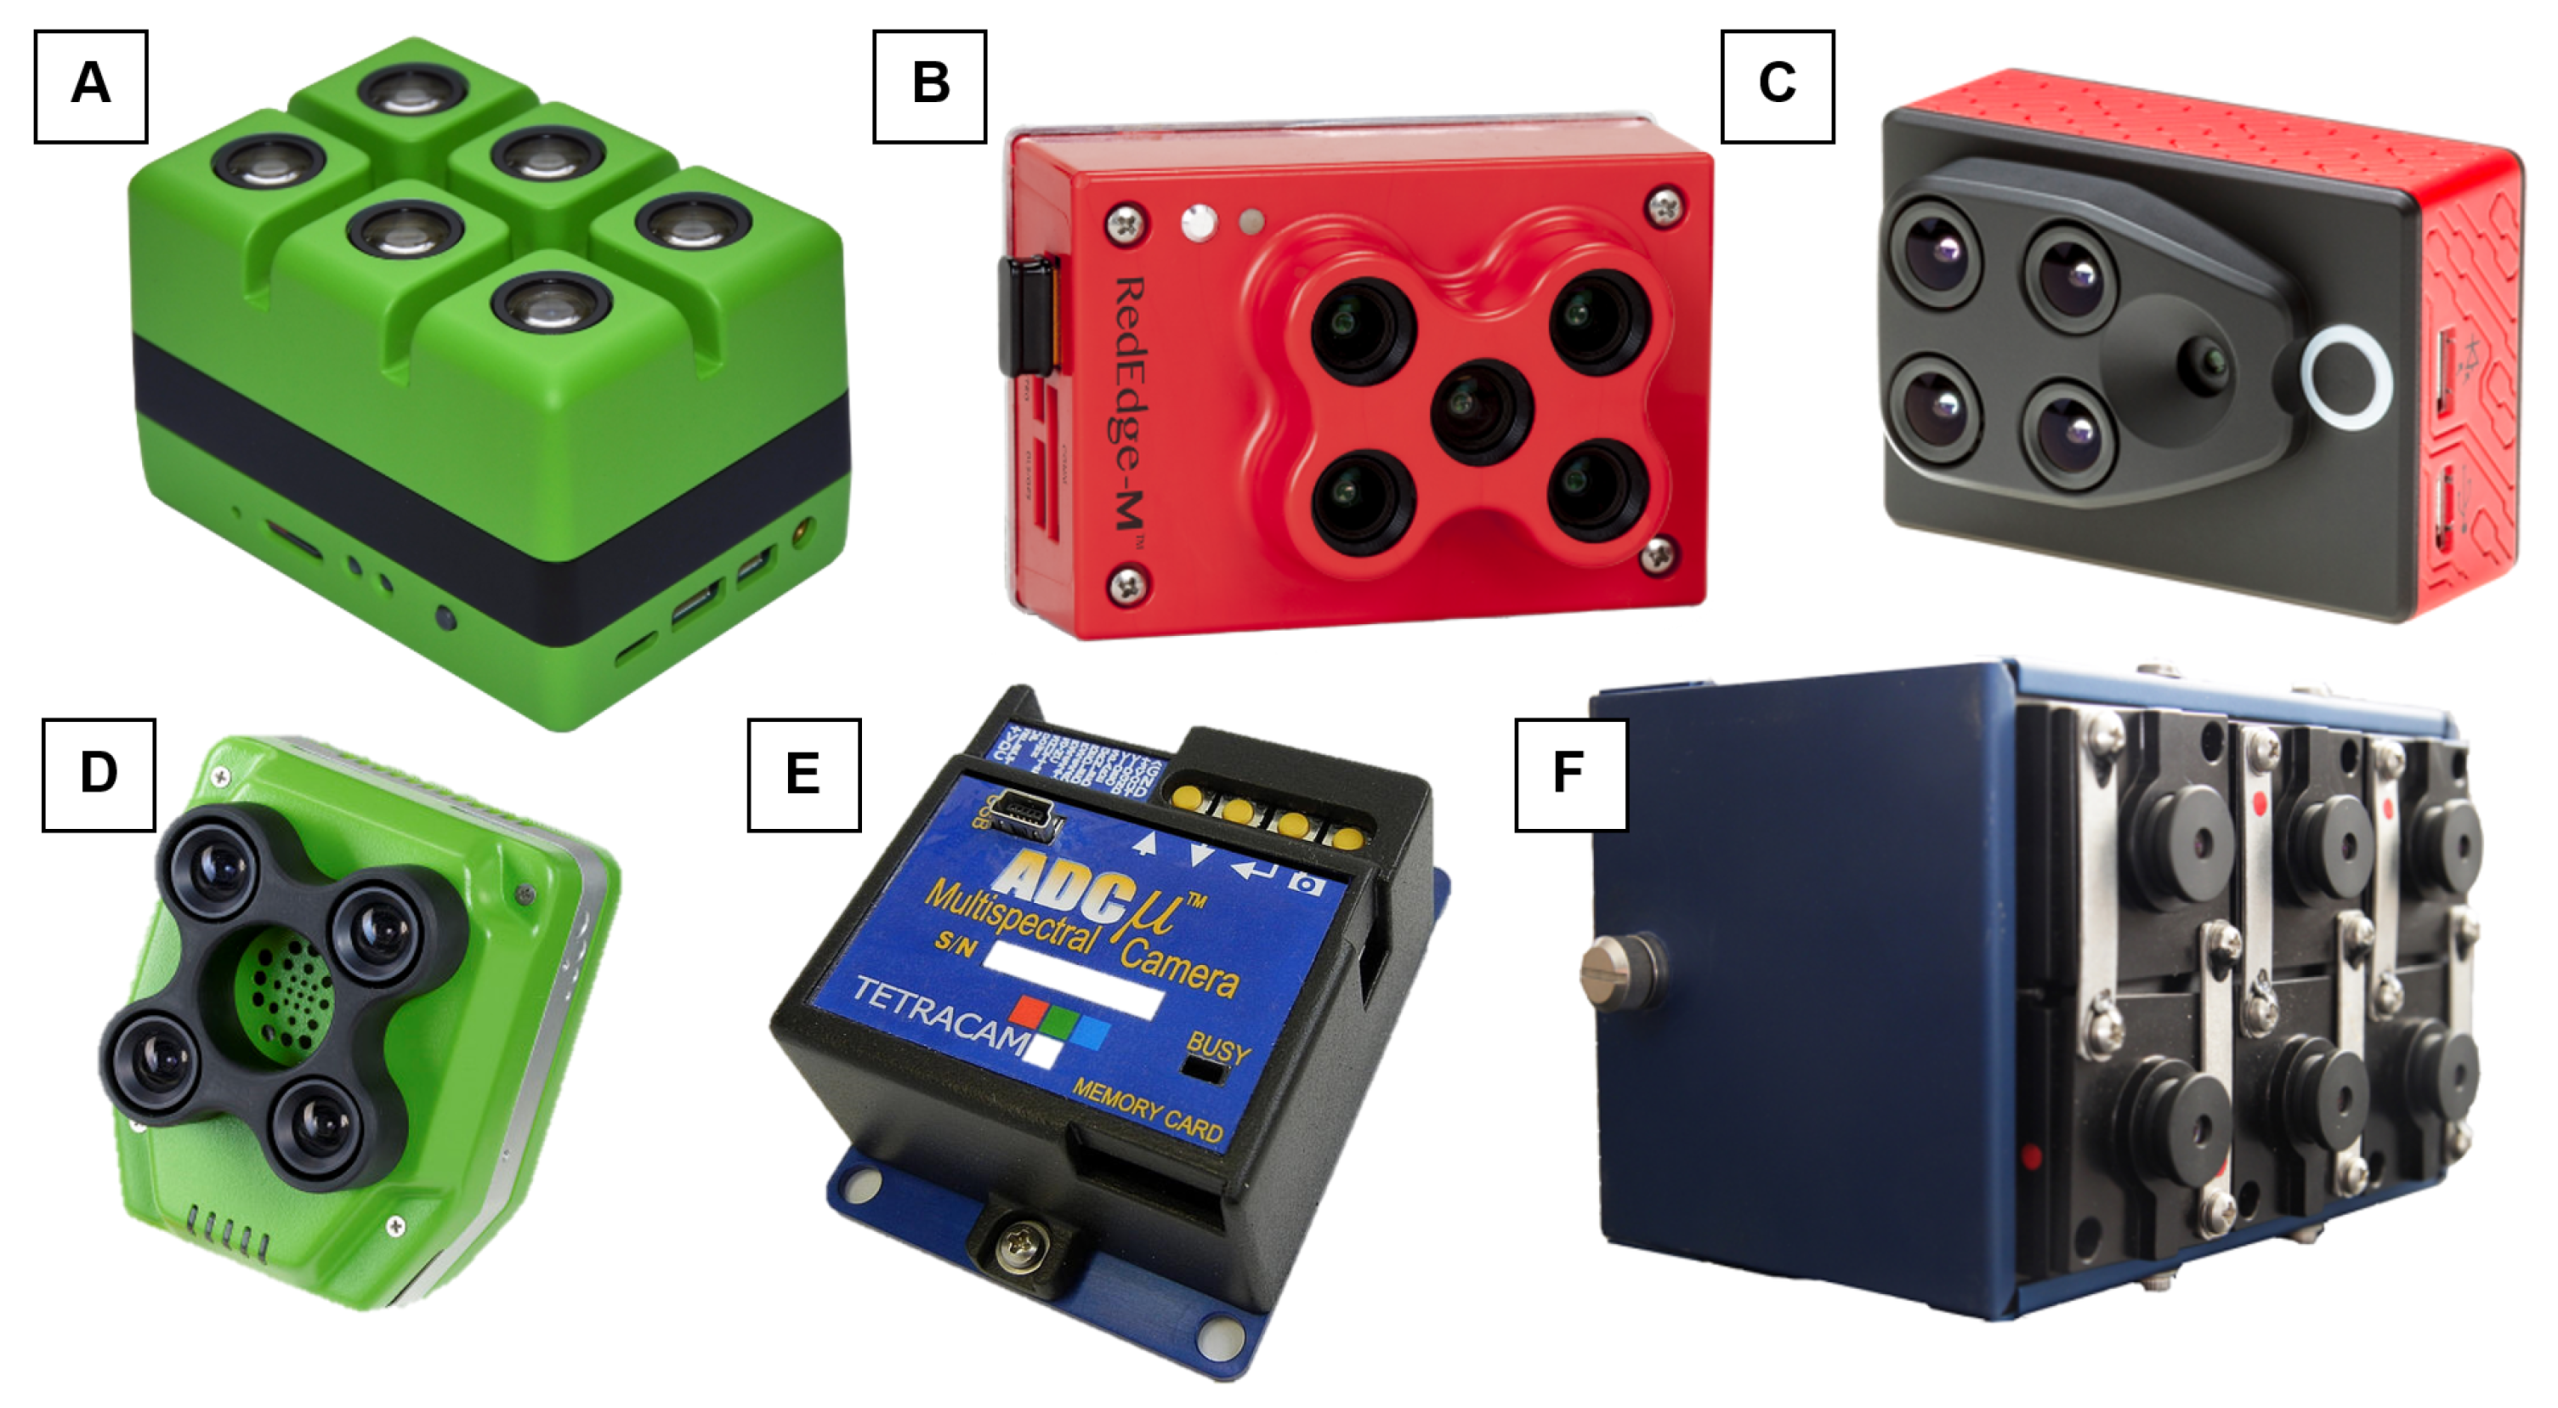
Sensing beyond the visible wavelengths, especially in the near-infrared (NIR), offers unique capabilities, particularly when it comes to the characterization of vegetation [25]. There are multiple UAS-suitable cameras on the market that can capture NIR imagery. Their use is crucial in determining vegetation health [13], and the calculation of a variety of informative spectral indices. Multispectral cameras differ in number of bands, spectral range and resolution. As the sensors become more sophisticated (wider spectral range, more bands), it is more challenging to miniaturize the technology sensor costs rise. Relatively low-cost, off-the-shelf multispectral cameras have been used with success in a wide variety of environmental mapping and monitoring applications (see Section 5). Nebiker et al. [25] compared such a camera with a high end professional UAS dedicated multispectral sensor and found substantial bias and inter-band correlation in the low-cost sensor, but nevertheless highlighted the practical utility of such sensors for many applications. Some of the more commonly used multispectral cameras are shown in Table 4 and on Figure 8.

3.2.3. Hyperspectral Cameras

In spite of the large number of uses of low-cost passive imagery sensors—such as RGB and NIR—many applications require higher spectral fidelity that only multispectral and hyperspectral [27] sensors can offer. These sensors acquire tens to hundreds of images of very narrow portions of the electromagnetic spectrum, and so can resolve much subtler spectral variation in targets. Unfortunately, acquisition of such rich data require sensors that are challenging to miniaturize because of their optics and calibration. Recent hyperspectral technology developments have been consistently resulting in smaller and lighter sensors that can currently be integrated in UAS for either scientific or commercial purposes. Some of them are listed in Table 5. We believe that such sensors may have a role to play in mapping the locations of particular species, which is not generally possible with coarser spectral resolution measurements, and which may enable wetland identification.

3.2.4. Thermal Sensors

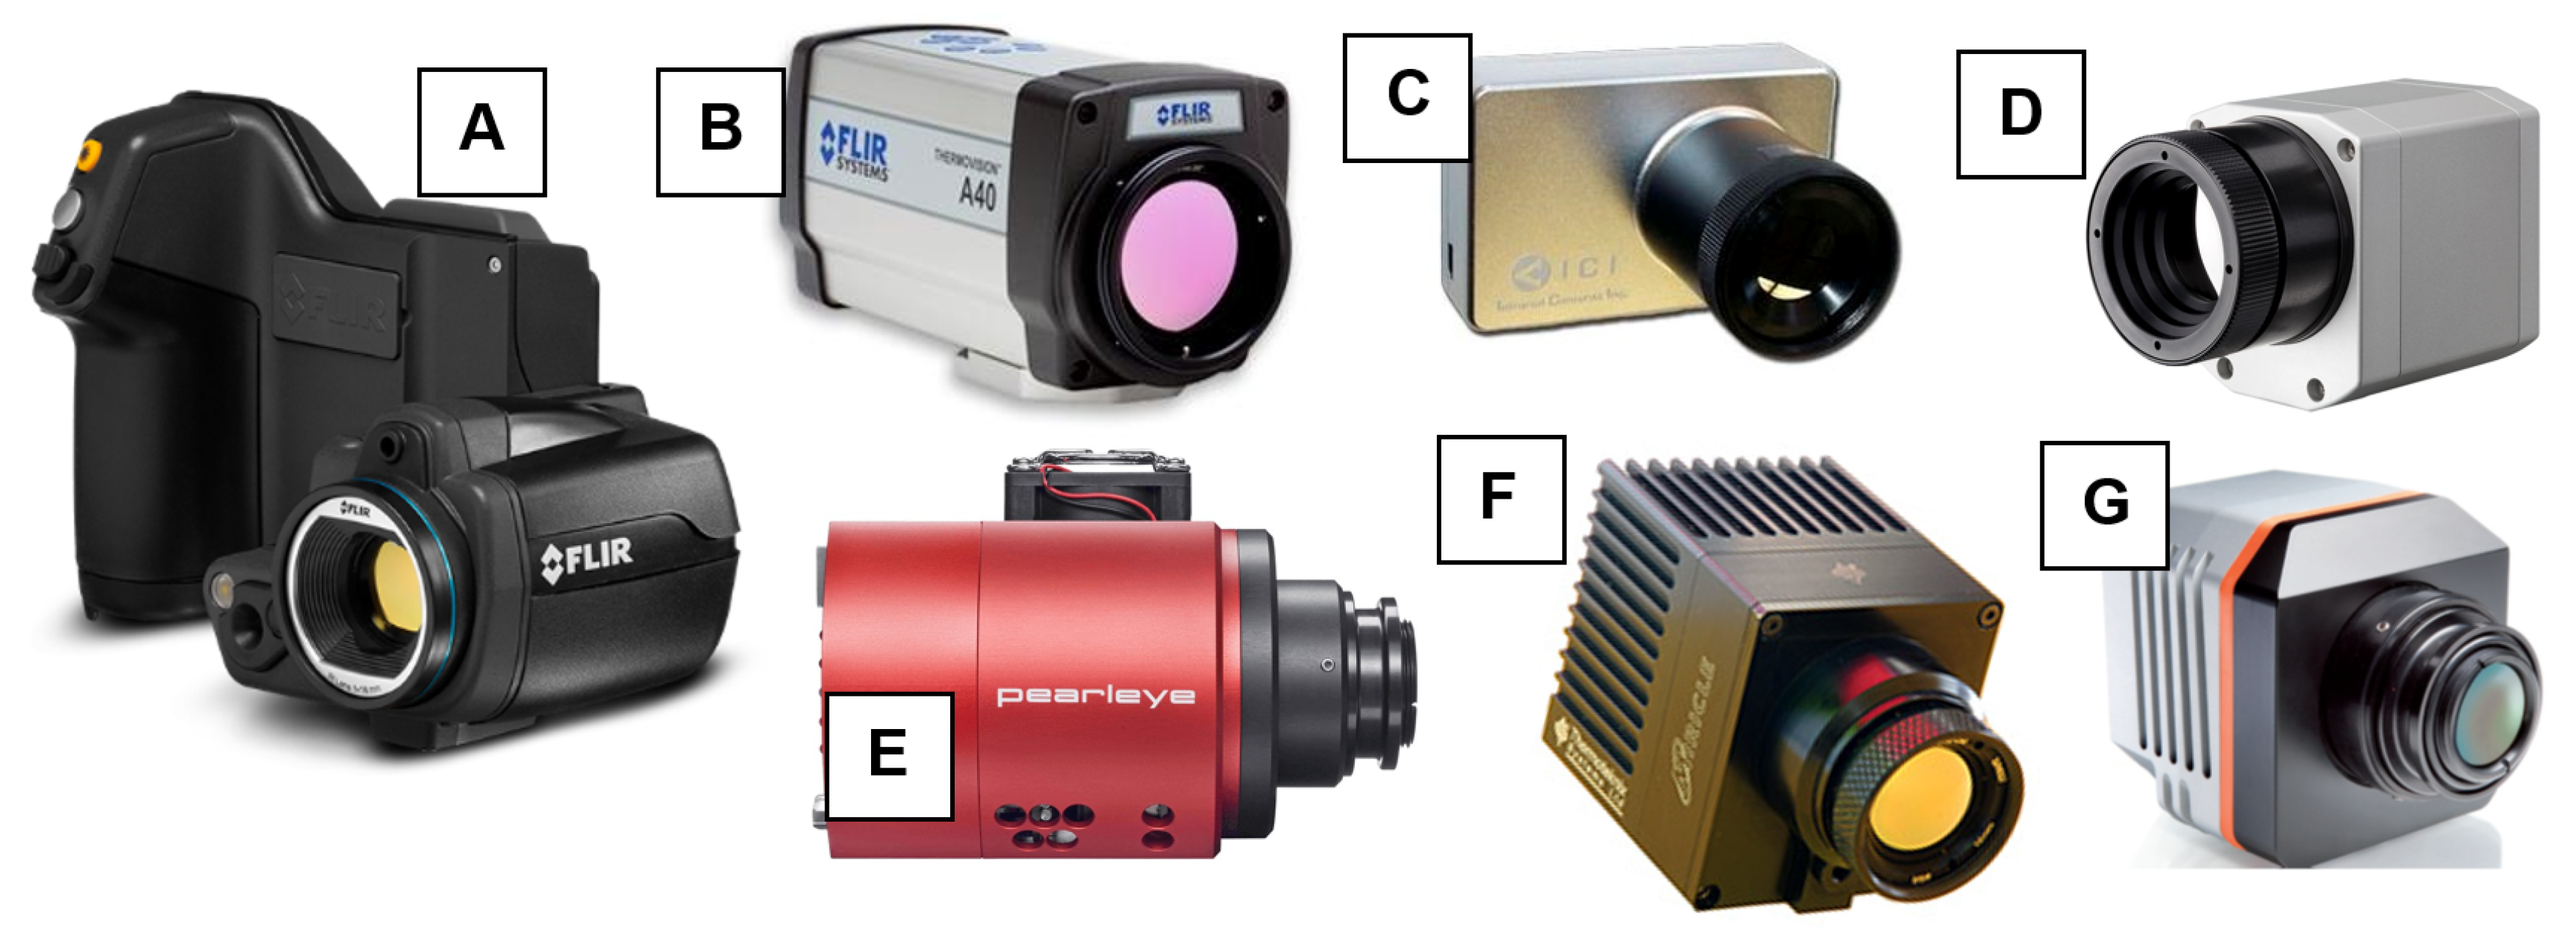
Although initially used mostly by the military [28], longwave infrared sensors (hereafter: thermal sensors) are now widely used for environmental monitoring. Khanal et al. [29] reviewed their use in precision agriculture and named applications that are essential also for wetland mapping and monitoring: distribution of soil moisture conditions [30,31,32], water stress detection [33,34,35], soil texture mapping, [36] and plant disease detection [37,38,39]. There is great potential in the use of thermal sensors for the indirect detection and mapping of wetlands. For instance, thermal imagery obtained during times of high vapor pressure deficit and high radiation loads (i.e., bright, dry days) would likely highlight areas that are cooler than their surroundings due to significant water evaporation. However, under other meteorological conditions, we might expect that the transpiration of soil water by plants would mask the thermal manifestation of sub-canopy water presence.Table 6 lists some of the thermal cameras specifically designed for UAS use, some of which are depicted in Figure 9.

3.2.5. Laser Scanners

With the advent of laser scanning techniques, surveying techniques have been improved by very high quality terrestrial and airborne lidar data [40,41,42]. Most laser scanners (lidar) employed to characterize topography, bathymetry, and wetlands vegetation are large, heavy, and mounted exclusively on manned aircraft. The market of miniaturized lidar sensors has grown very rapidly and constant technological advancements are improving the quality of data obtained by these sensors. Lang et al. [43] anticipate that lidar sensor deployment will become more common on UAS. This opens unprecedented opportunity for replacing manned airborne lidar for wetland mapping since the fundamental characteristics of lidar data are largely unaffected by the carrying platform [43]. This means that well-developed and familiar processing and analytical techniques can be brought to bear on these data sets. The main challenge in UAS lidar application lies in significant trade-offs between performance and the size or cost of the lidar sensor, or the effect of flight dynamics on the measurement process [44]. Developing small lidars that can be mounted on UAS necessitates sacrifices in the size, weight and energy source for the lidar [1]. These limitations typically reduce the effective sensing range of the sensor, but this can be somewhat overcome by the fact that UAS can often fly much closer to the target.
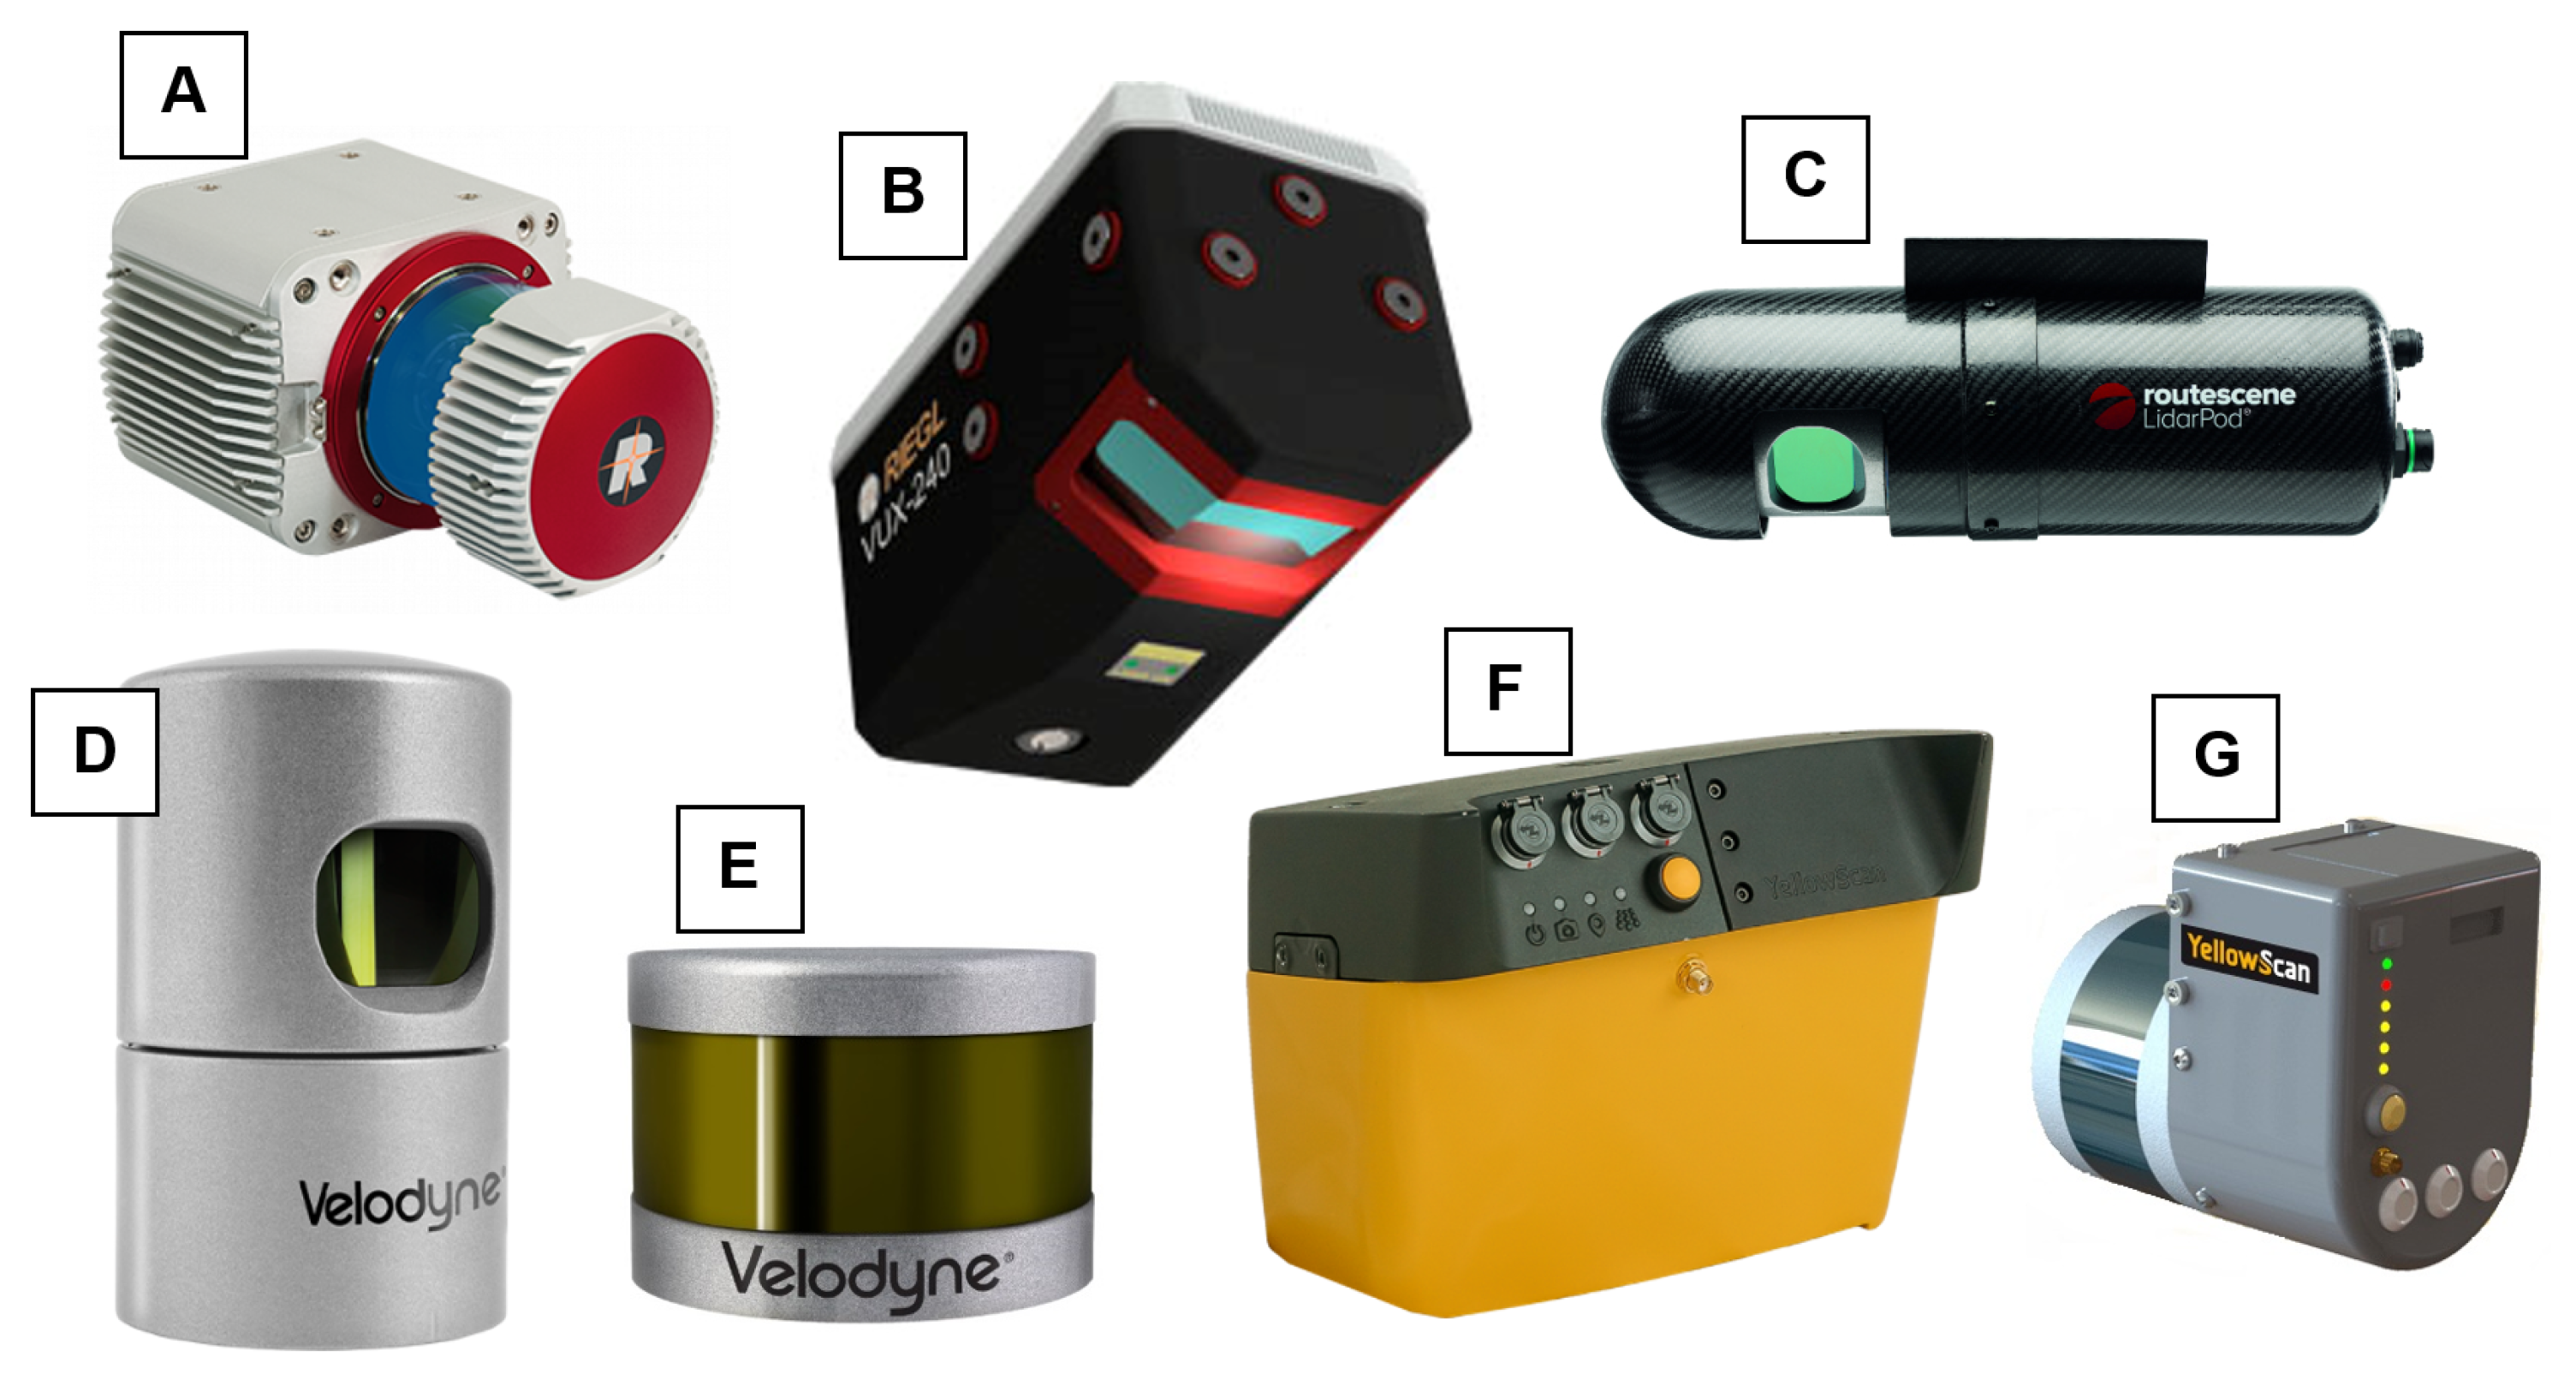
The potential of lidar data for wetland extent determination lies in the possibility of obtaining not only the surface information, but also 3D representation of the ground surface underneath [45]. It has been proven that the use of lidar data yields better accuracy in wetland mapping than photo interpretation—Hogg and Holland [46] achieved (84%) accuracy in wetland delineation using lidar data compared to colored infra-red imagery (76%). While the cost of these systems is much higher than other potential payloads, Snyder et al. [47] show, however, a variety of economic benefits that can be achieved by improving topographic maps using lidar that exceed data acquisition costs. Table 7 lists some of the lidar sensors specifically designed for UAS use, some of which are depicted in Figure 10.

4. UAS-Based Spatial Data

This section will focus on describing capabilities and best practices for UAS data acquisition (Section 4.1), raw processing processing (Section 4.2), cost and time effectiveness of UAS use (Section 4.3), and the regulatory environment for UAS in the United States (Section 4.4).

4.1. Data Acquisition Process

4.1.1. UAS Operation and Control

Options for controlling the flight of an unmanned aircraft span a spectrum from complete remote control to fully autonomous flight, with most practical applications employing both to some extent:
  • Ground control: also known as Remotely Piloted Vehicles (“RPVs”), this control option requires constant input information from an operator. A ground control station (GCS) is a control center located on land or sea that provides aircraft status information (location, orientation, systems information, etc.) and accepts and transmits control information from the operator.
  • Semi-autonomous: this control method is perhaps the most common and has an operator manually controlling the aircraft during pre-flight, take-off, landing, and a limited set of other maneuvers, but reverts to autopilot enabled autonomous flight for the majority of the mission. For example, the vehicle may be programmed to fly between specified waypoints once in-flight.
  • Fully autonomous: here control relies on controlling the unmanned vehicle only by the on-board computer without human participation. It means no human input is necessary to perform an objective following the decision to take-off. In this mode, the aircraft must have the capability to assess its condition, and status as well as make decisions affecting its flight and mission.

4.1.2. Photogrammetric Flight Planning

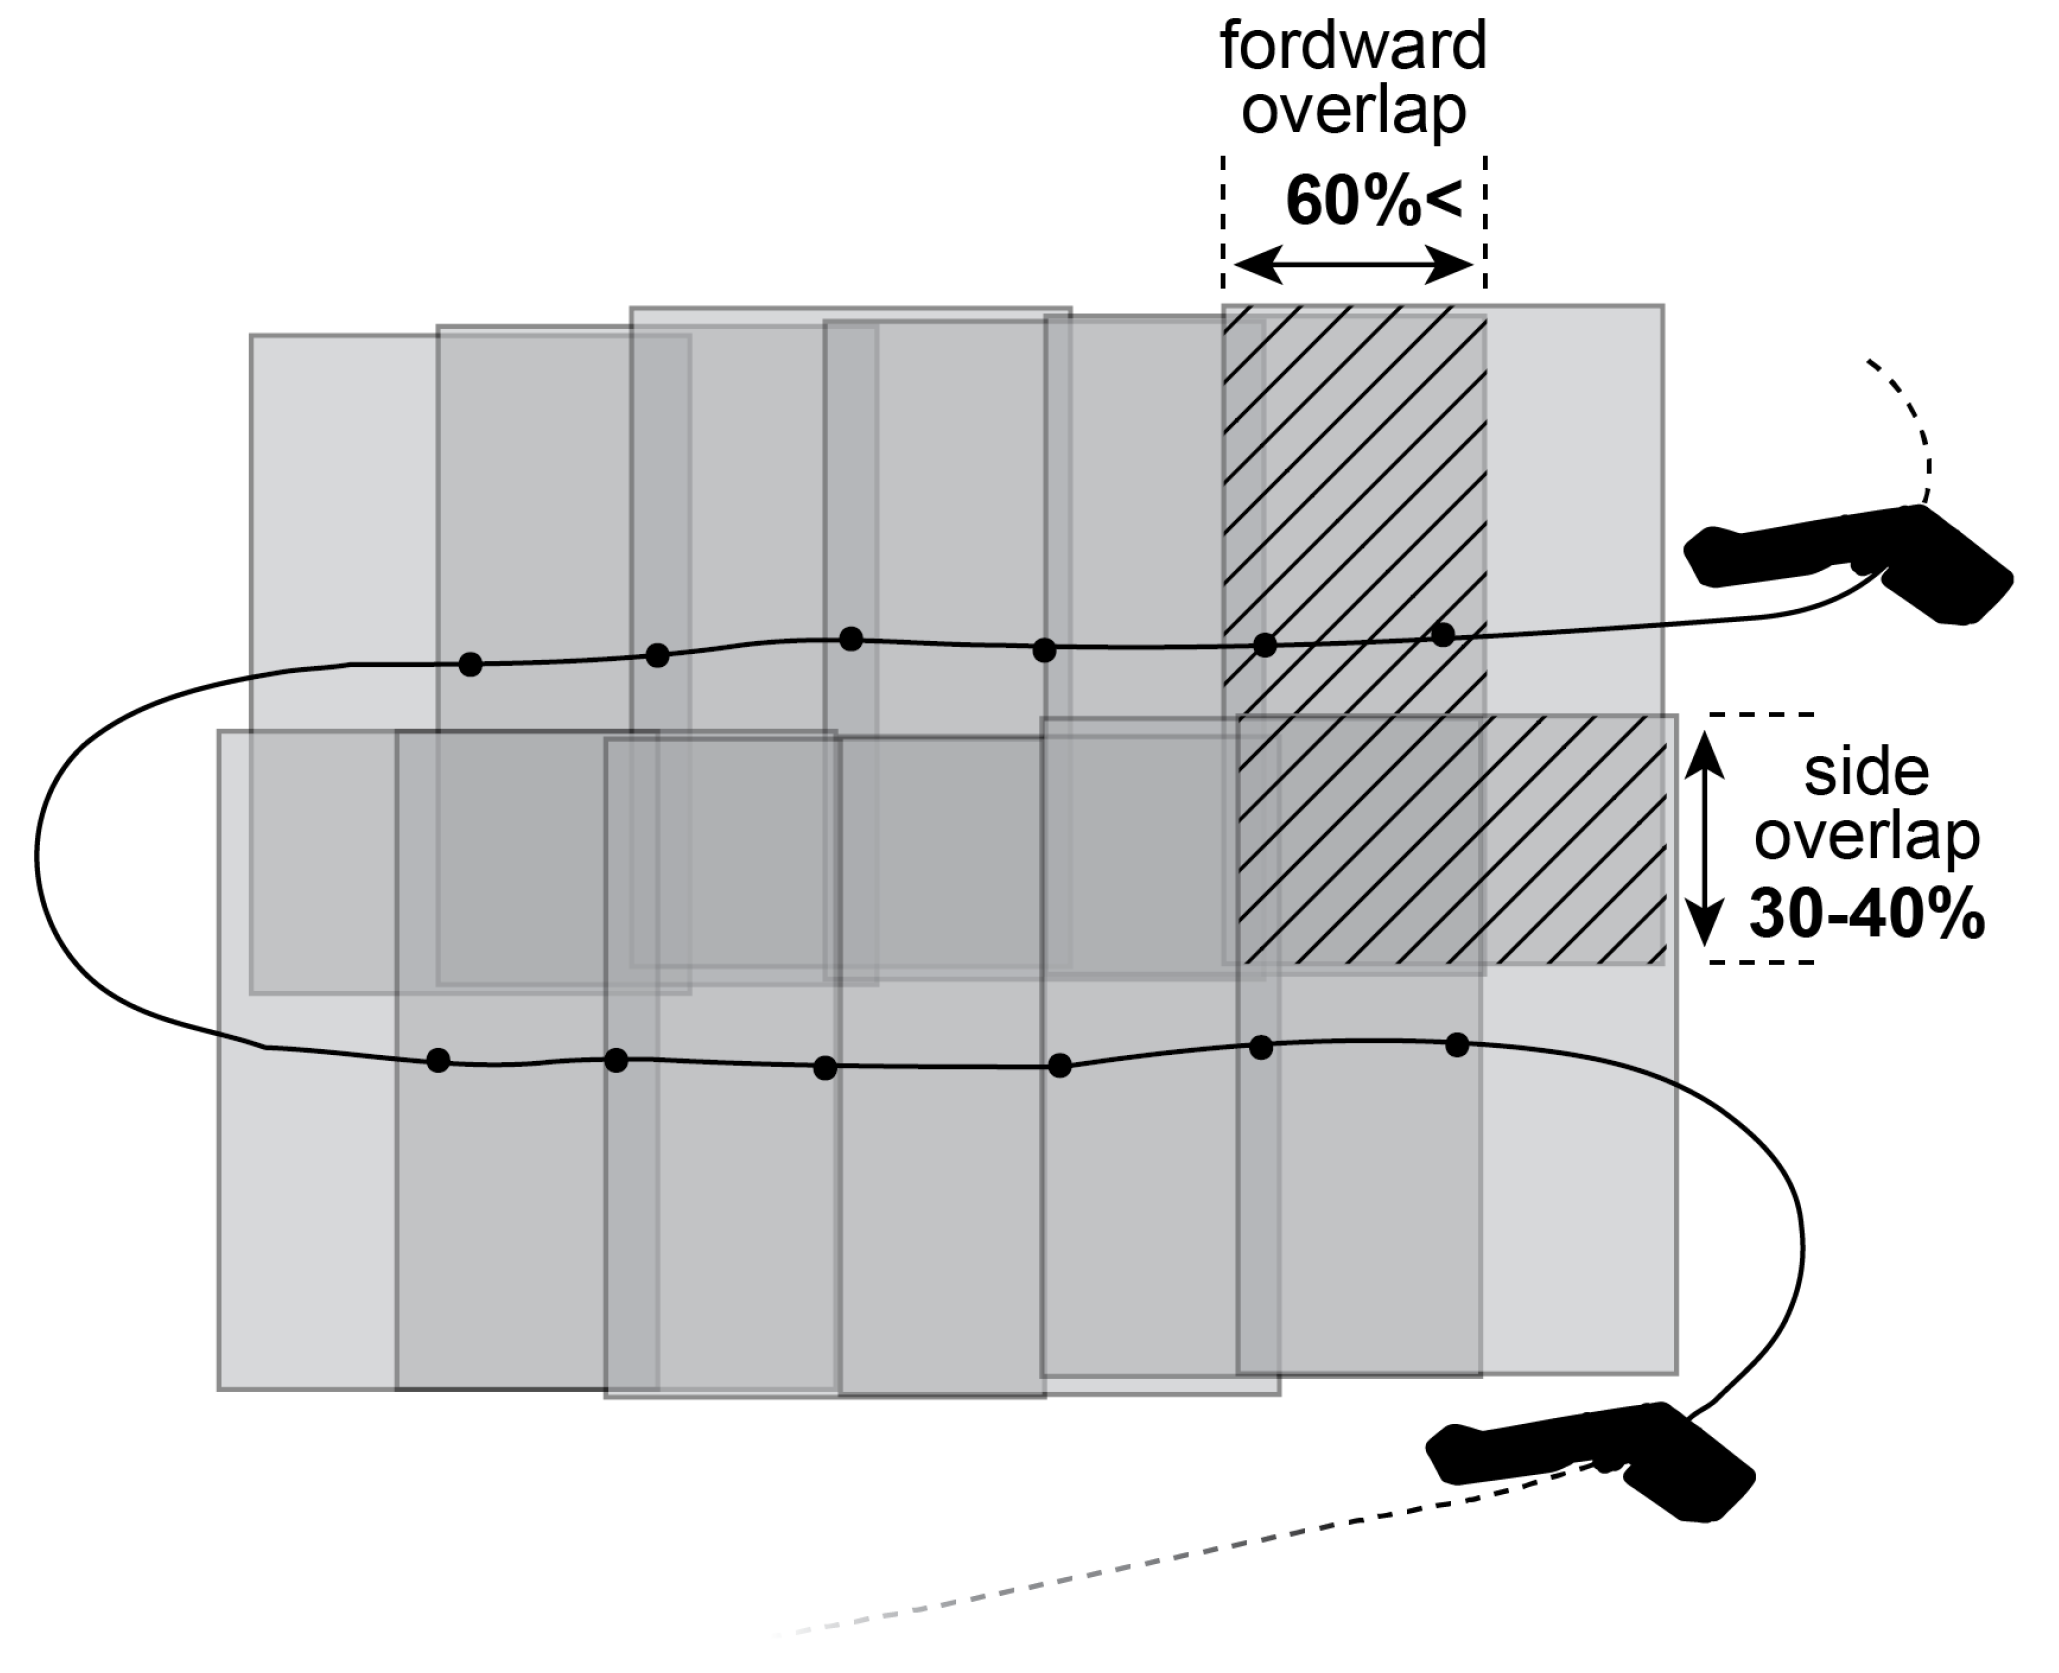
The mission (flight and data acquisition) is normally planned prior to deployment, off-site, and with the aid of dedicated software. Although available software packages have various interfaces and different mission customization levels, the mapping mission is always defined by indicating the area of interest and geometric flight parameters. Sometimes, sensor specifications need to be input manually, but most flight planning platforms have predefined protocols for particular sensor systems, particularly those that are well-integrated with the airframe. In order to plan a successful mapping mission, which ensures the quality of the output data, several principles of traditional photogrammetric flight planning need to be followed. Longitudinal and transverse overlap of images needs to be maintained (60–80% in at least one of them, see Figure 11) and the Ground Sampling Distance (GSD: distance between two consecutive image centers) needs to be determined. The GSD is determined by the flight altitude, focal length, and angle of view of the camera. Geometrical flight parameters vary according to the goal of the flight: missions for detailed mapping require high resolution, high overlap and low flying altitude resulting in small GSDs, but quick flights for emergency surveying and management prioritize flight time at the expense of resolution [14]. For mapping missions, the autonomous or semi-autonomous mission is generally planned to follow parallel lines and each change of flight trajectory will be marked as a “waypoint”. The image network quality is strongly influenced by the typology of the performed flight [14]: it is very difficult to ensure the imagery overlap and regular geometry of acquisition in a manual mode, so semi-autonomous operation is most common. Note that these considerations are not unique to the choice of a fixed or rotary wing aircraft, but those choices will imply range and maneuverability constraints that will determine available flight plans.
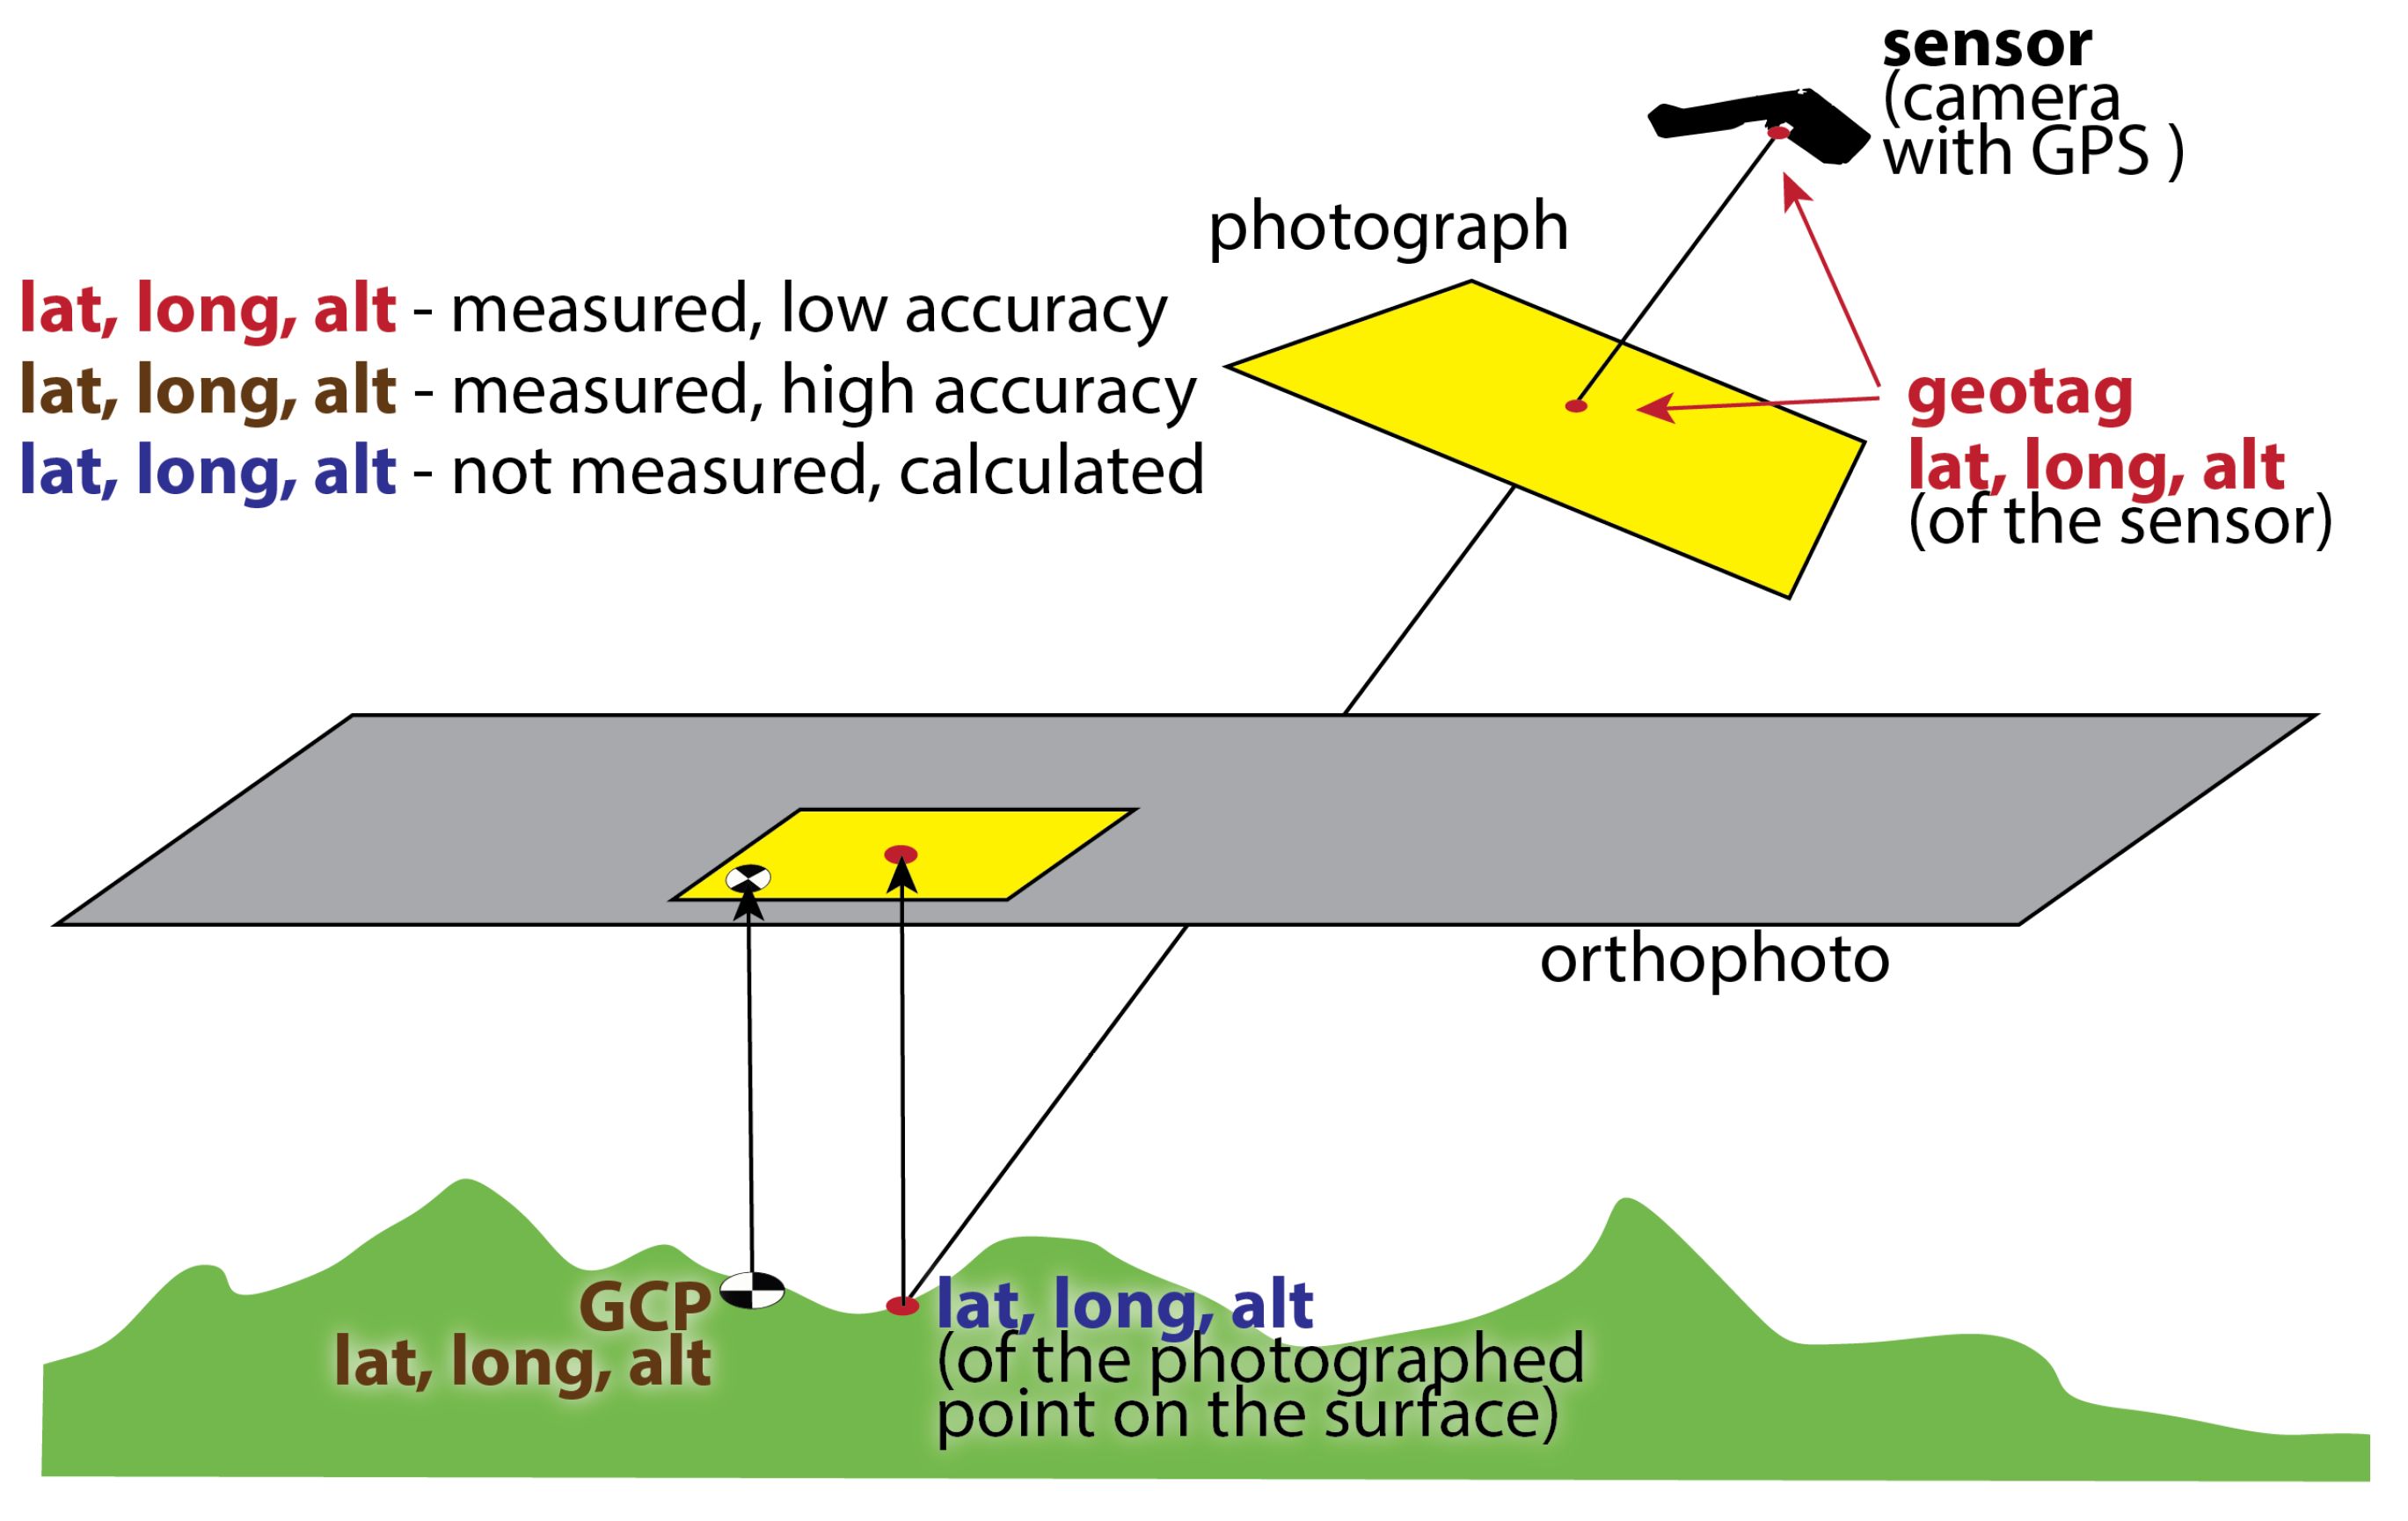
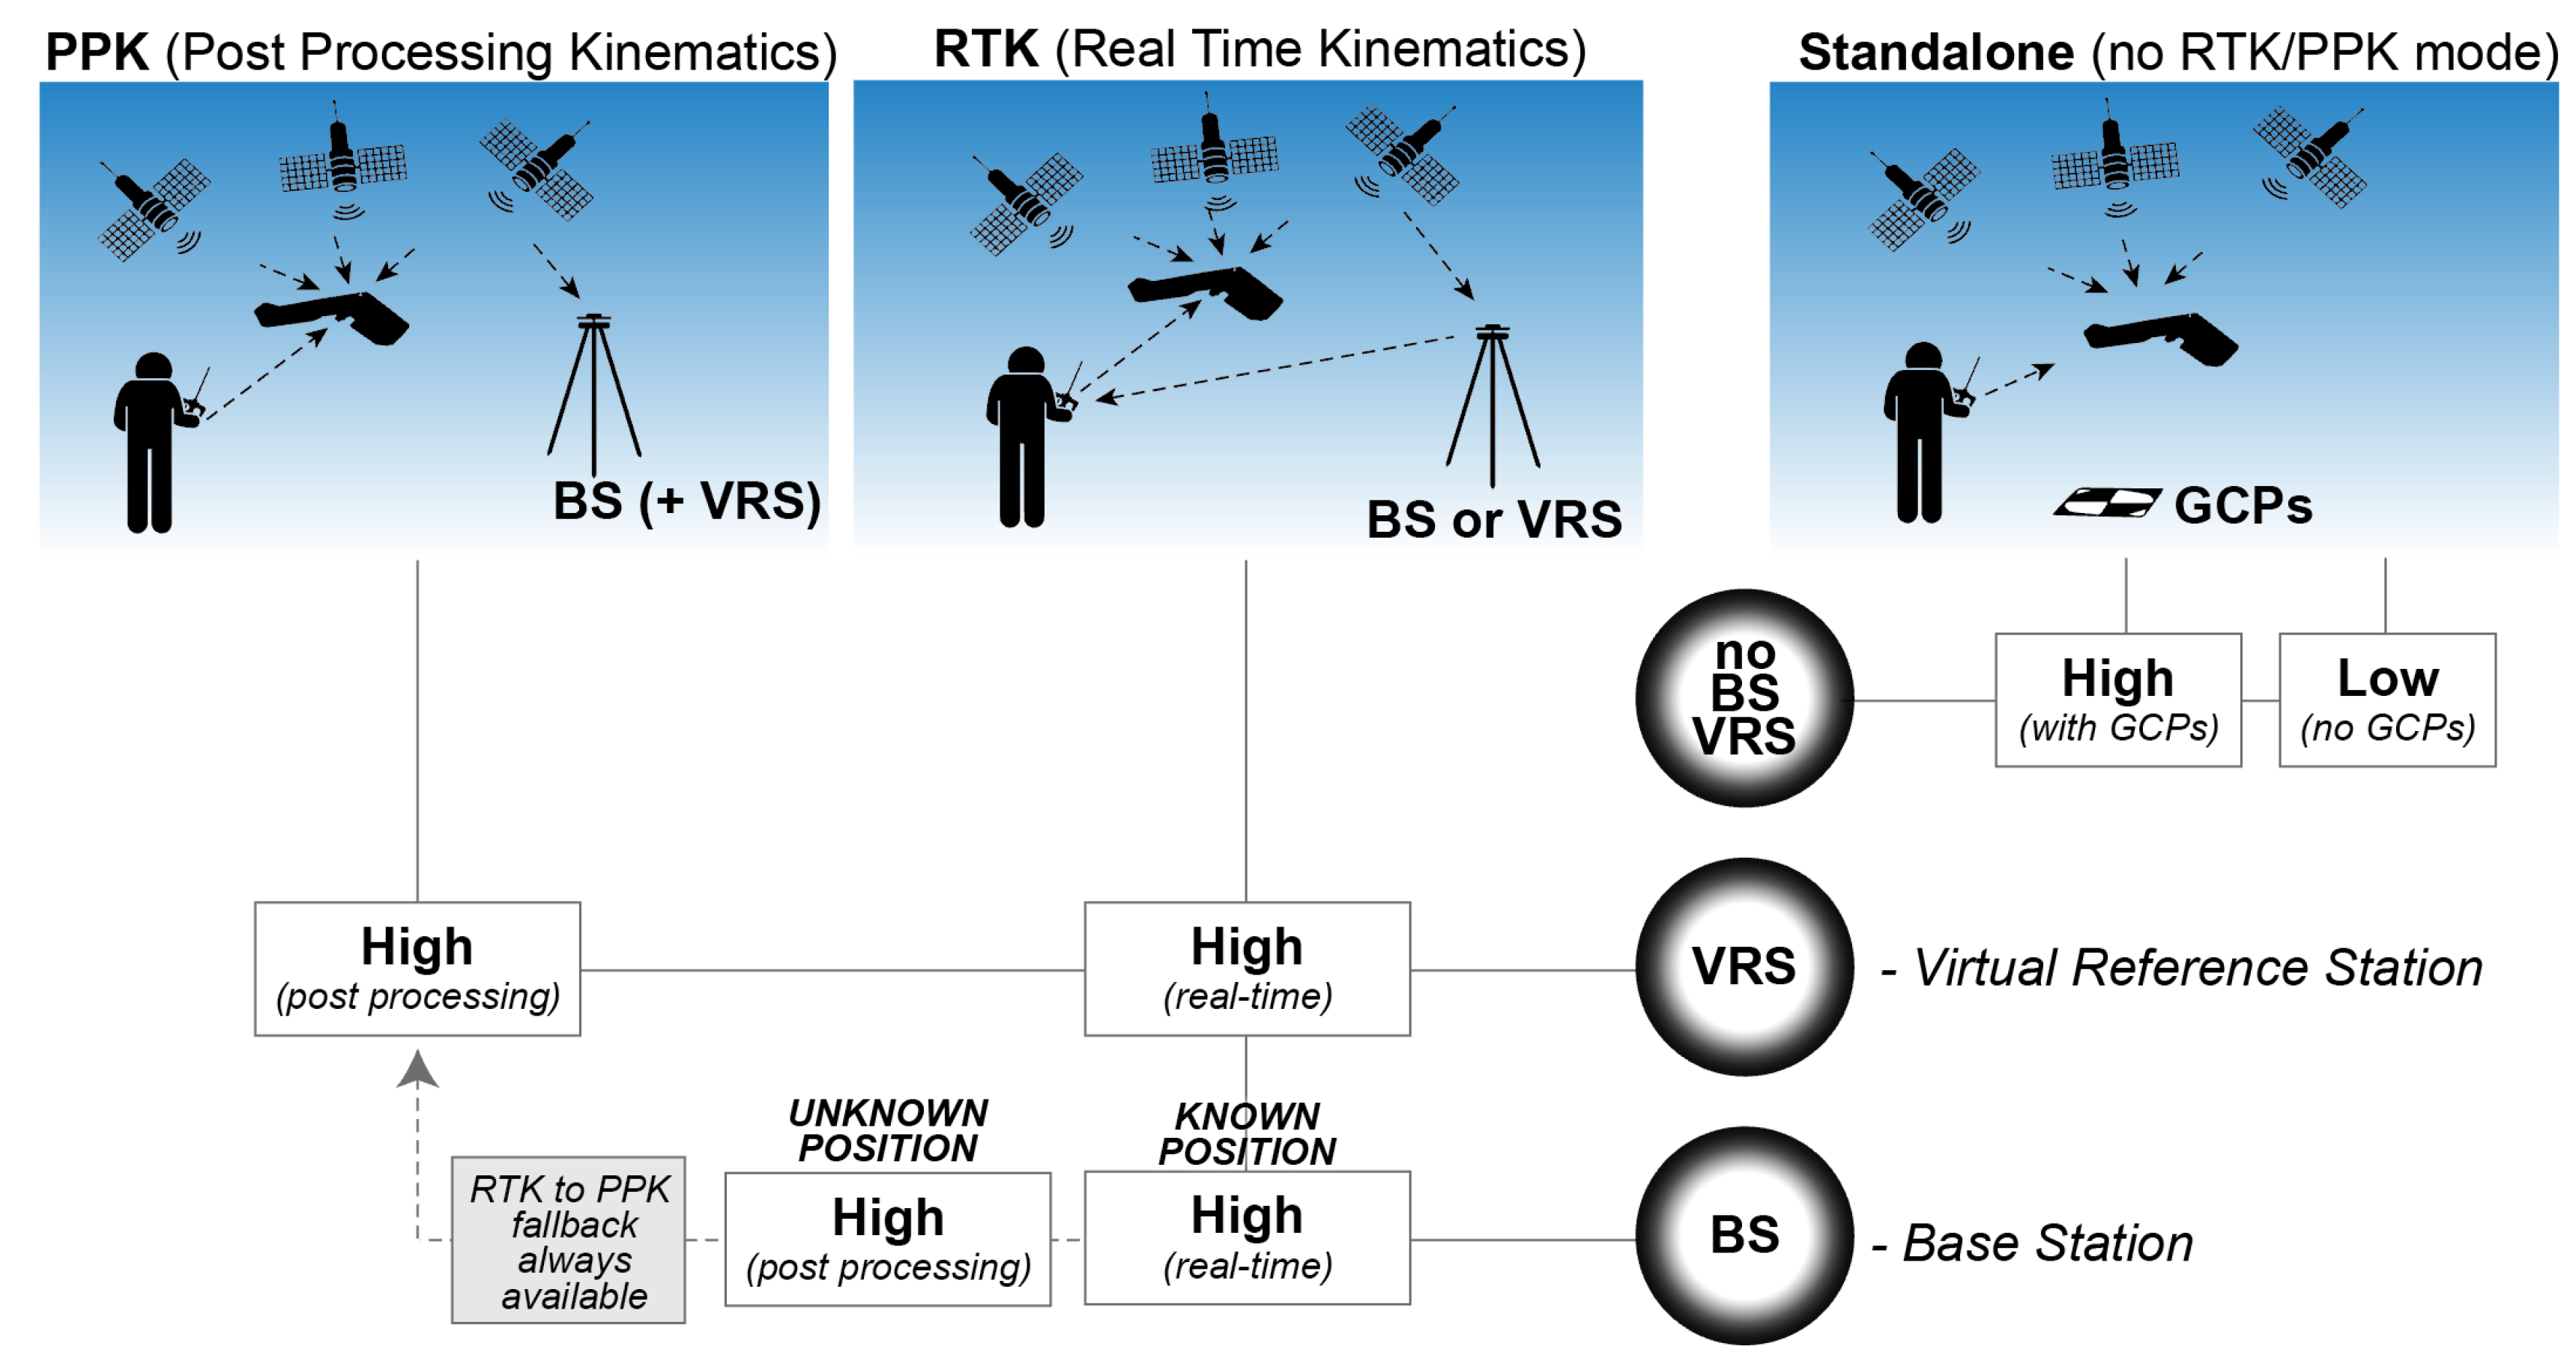
Flight navigation, but also image orientation for processing purposes, are possible thanks to onboard inertial measurement units (IMU) and GNSS/INS positioning systems. Whether the sensor is fully integrated with the aircraft and navigation electronics or not, measurements (e.g., images) taken by onboard sensors can inherit the geolocation and aircraft attitude information from the navigation unit. This simple “geotagging” solution (see Figure 12) is ubiquitous, but yields relatively low positional accuracy depending on the quality of the GNSS/INS position unit, the IMU, and conditions affecting signal strength (e.g., weather). More precise referencing can be achieved with two methods: using Ground Control Points (GCPs) or incorporating Real Time Kinematics (RTK) or Post Processing Kinematics (PPK) devices. The GCP approach relies on post-processing of image mosaics to more accurately georeference them, whereas RTK technology enables more precise positioning at the time of flight/data collection. It is worth mentioning that several methods of direct georeferencing without the use of GCP or RTK/PPK technology have been proposed [48].
  • Ground Control Points (GCPs)
    Ground control points (GCPs) are points on the surface of the Earth of a precisely known location. GCPs are tied in during data processing to georeferenced images from a project and convert ground coordinates of the points to real world locations. They need to be distributed evenly throughout the mapping area before the flight, and measured with high precision techniques such as differential GPS. The precision and accuracy of the data processed with the use of GCPs is very high—on the order of couple of centimeters [49,50]. In the context of wetland mapping and monitoring, the use of GCPs has several shortcomings. First, actually deploying and locating the targets that will serve as GCPs may not be possible in wetland environments due to access issues. Moreover, dense vegetation can make it impossible to identify the targets within the acquired imagery.
  • Real Time Kinematics (RTK) and Post Processing Kinematics (PPK)
    RTK-enabled drones use differential GPS measurements to improve accuracy. The base station (or the Virtual Reference Station—VRS) constantly provides correction and calibration of the UAS position data (see Figure 13). Each base station measurement is paired in real time with the measurement of the GPS on board the UAS. Successive GPS measurements at the base stations are paired with GPS measurements made by the drone. This provides a mechanism for substantially reducing the errors common between the two measurements (usually resulting in errors on the order of a centimeter or less for the aircraft position relative to the base station). If the UAS operates in the RTK mode, these corrections are applied real-time, requiring an uninterrupted connection between the drone and the base stations throughout the survey. This is hard to achieve in all survey areas, where building, trees, hills can be obstacles in a signal exchange. This limitation is bypassed by using a Post-Processed Kinematic (PPK) solution, in which the base station and the UAS collect the location data independently and the pairing is executed during the data processing stage. The less accurate data of the GPS onboard the UAS is corrected using the more accurate base station data, resulting in more precise geotags of aerial imagery or other survey data.
Equipment choices (platform, auto-pilot and GCS) fundamentally impact the quality and reliability of the final result: low-cost instruments can be sufficient for small areas, low altitude flights, or in applications with less strict needs for locational precision, while more expensive devices must be used for long endurance flights over wide areas. Generally, in the case of light weight and low-cost platforms, a regular overlap among collected image cannot be ensured due to the strong influence of wind, piloting capabilities and GNSS/INS quality, all randomly affecting the attitude and location of the platforms during the flight. Thus, higher overlaps, with respect to flights performed with manned vehicles or very expensive UAVs, are usually necessary to counteract these problems. Wind can greatly affect flight and image acquisition, particularly when interfering with the proper aiming and stability of the sensor system. High winds are not uncommon over coastal wetland areas, and these may impose considerable challenges to flight control and maneuvering. Lighter aircraft and those air frames with larger surfaces tend to be more affected by winds. Recent developments in platform control systems, including improved IMUs, have allowed successful data acquisition campaigns under these challenging scenarios. In addition, the introduction of weatherproof systems has extended data collection capabilities under a variety of environmental conditions. Data acquisition and the quality of the data acquired by a UAS also can be affected by other atmospheric conditions, especially atmospheric effects such as fog and high aerosol concentrations. However, due to the relatively thin atmosphere between the target and the sensor, data derived from UAS are less vulnerable to atmospheric effects than airborne systems flying at higher altitudes. This is a particular advantage for UAS measurements in context where spectral measurement precision is important. While the larger, heavier, more expensive instruments common for orbital or airborne flight often tout much higher spectral calibration accuracies, this may be a moot point when atmospheric correction procedures introduce substantial uncertainty. Therefore, it may be possible to obtain highly accurate spectral measurements with smaller, cheaper sensors onboard UAS.

4.2. Surface Reconstruction and Structure from Motion (SfM)

The concept of combining blocks of aerial images with the aim of creating georeferenced spatial data are a principal of traditional photogrammetry. Traditionally, the key components of the process included generating digital terrain models (DTMs or DEMs) using photogrammetric [51,52,53,54] and differential global positioning system (dGPS) [55] data. As described in Section 2, most of these techniques still require expensive equipment and professional knowledge to process data and improve its quality [56]. Development of UAS systems equipped with consumer grade digital cameras provided an opportunity for very low cost spatial data acquisition. Since the geometry of the photograph is not suitable for measurements, and traditional photogrammetry requires the use of photogrammetric, pre-calibrated cameras, an alternative processing method was needed in order to stitch, georeference and orthorectify the acquired imagery. The computer vision community developed such a method almost 40 years ago: Structure from Motion (SfM) [57] and Multi-View Stereo (MVS) [58], which revolutionized low-cost data acquisition in wetland mapping [1] and in other environmental applications [59,60].
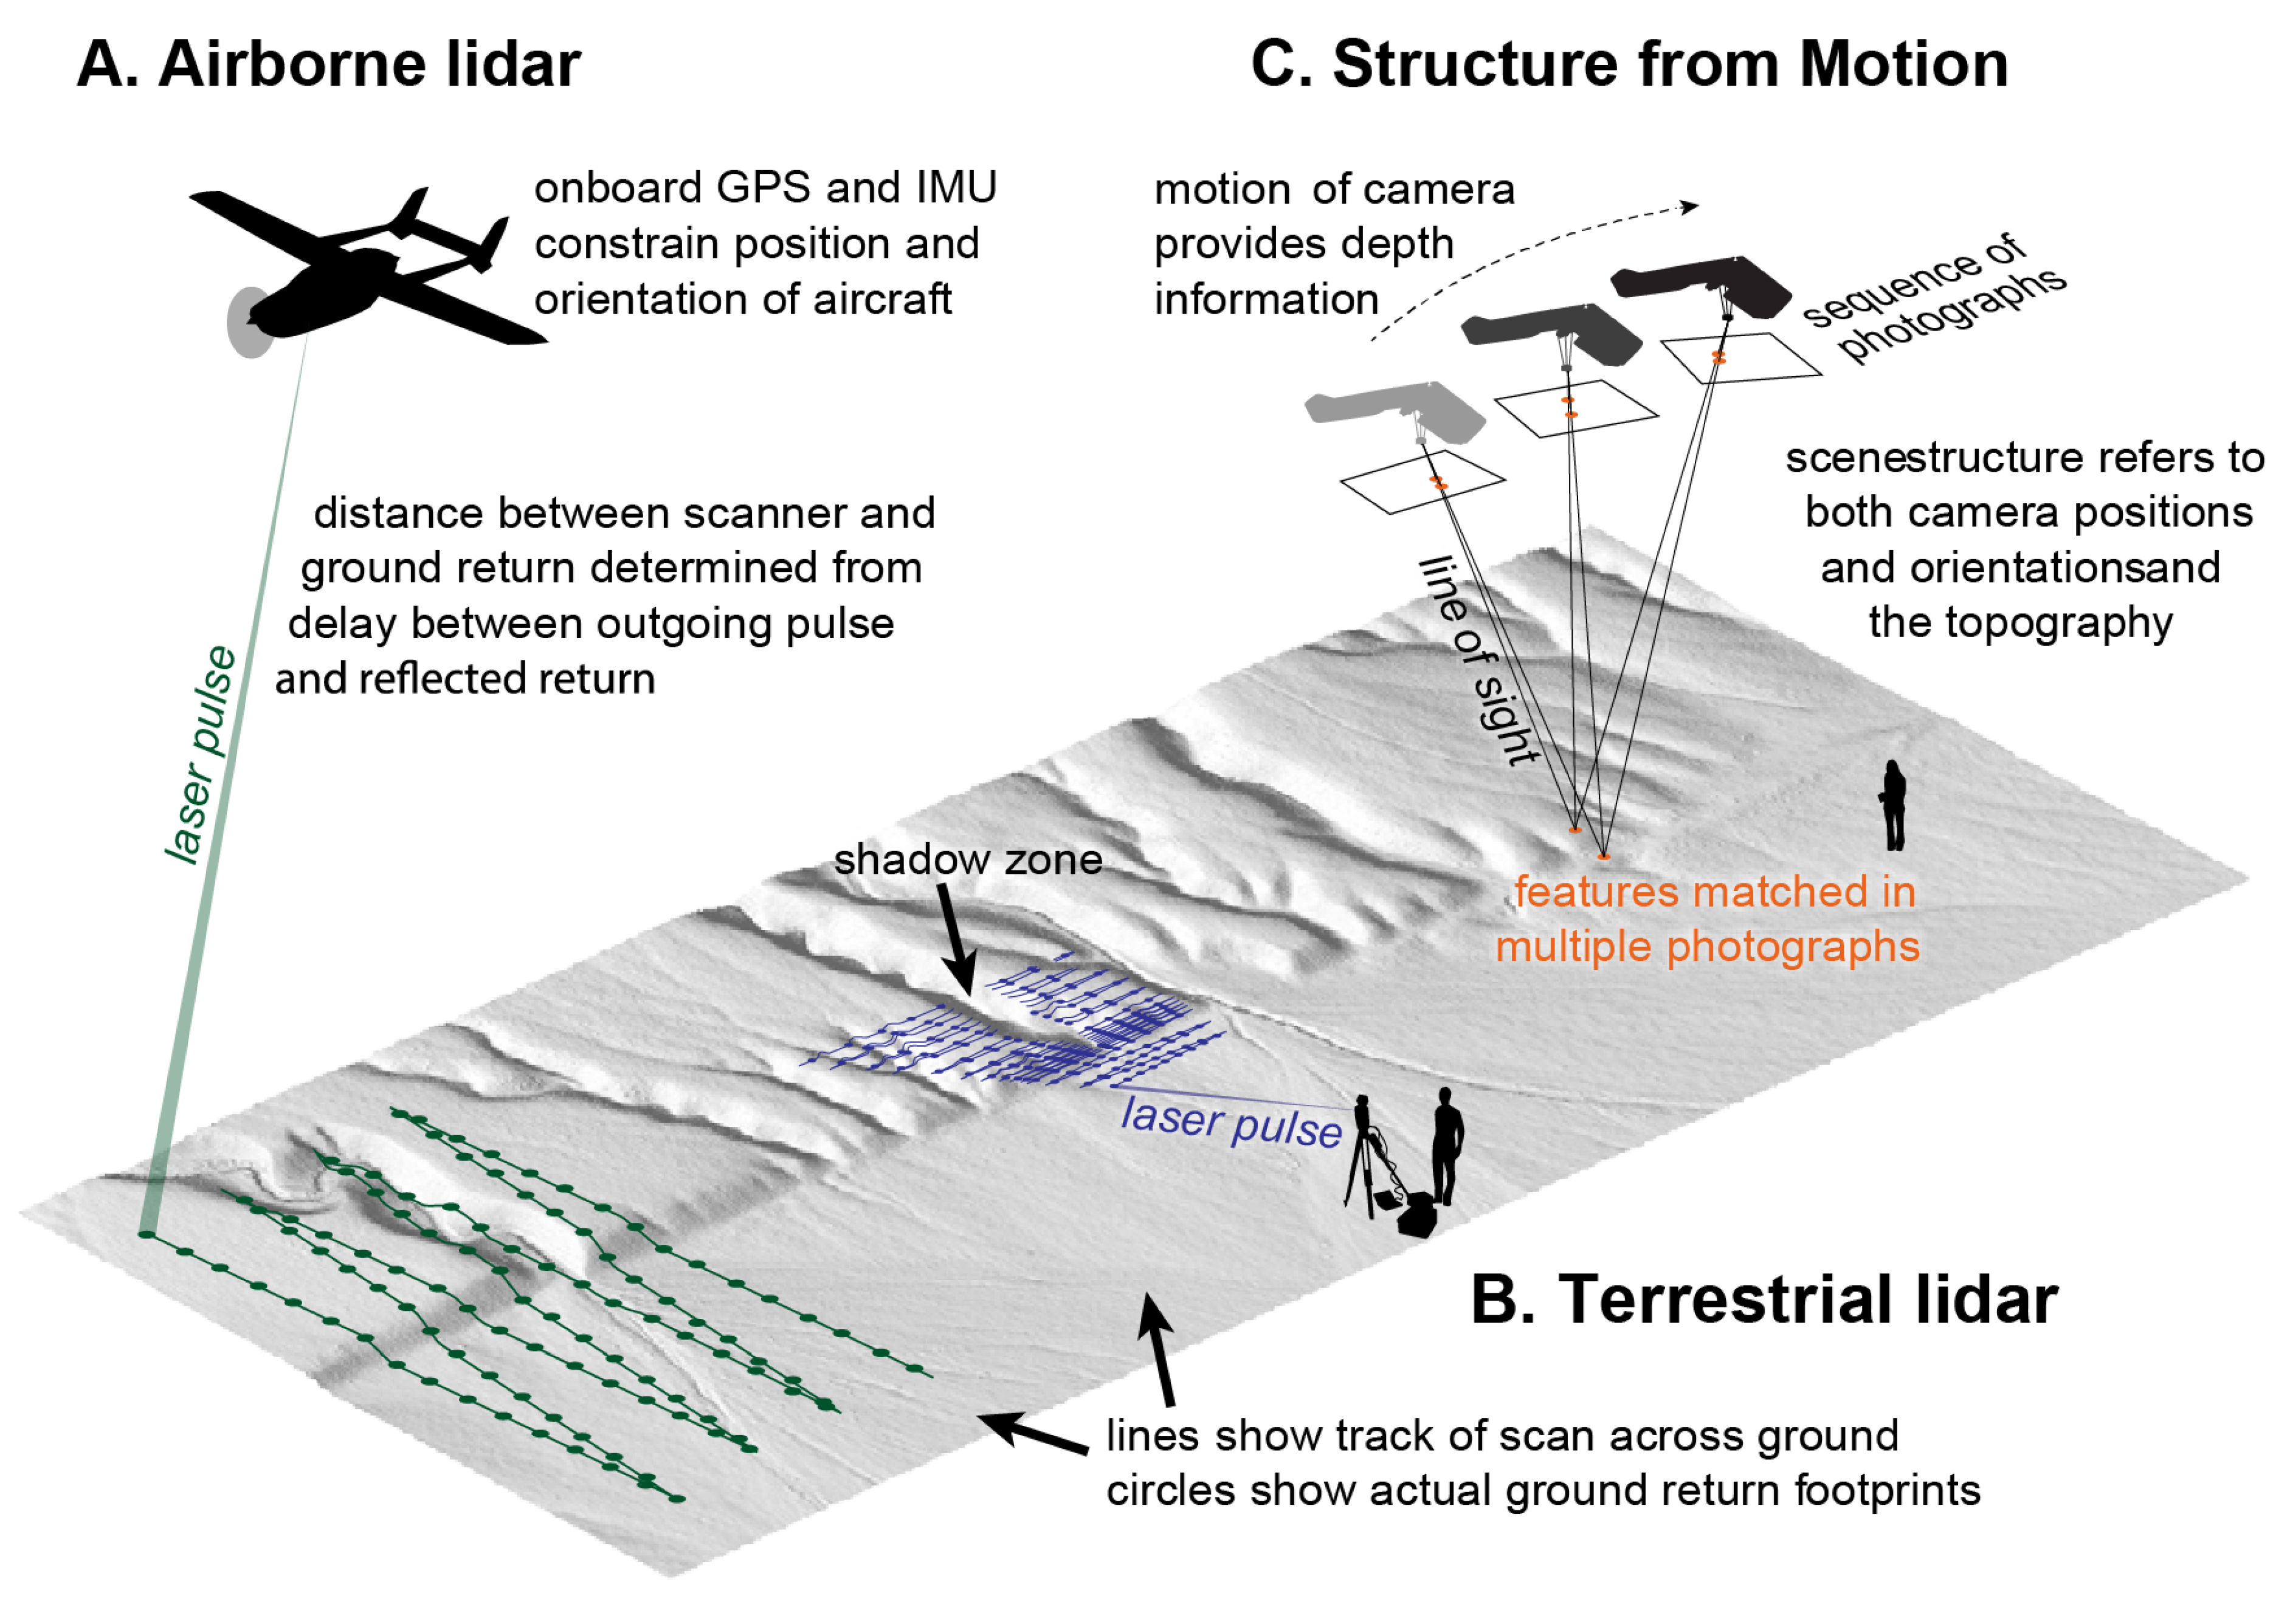
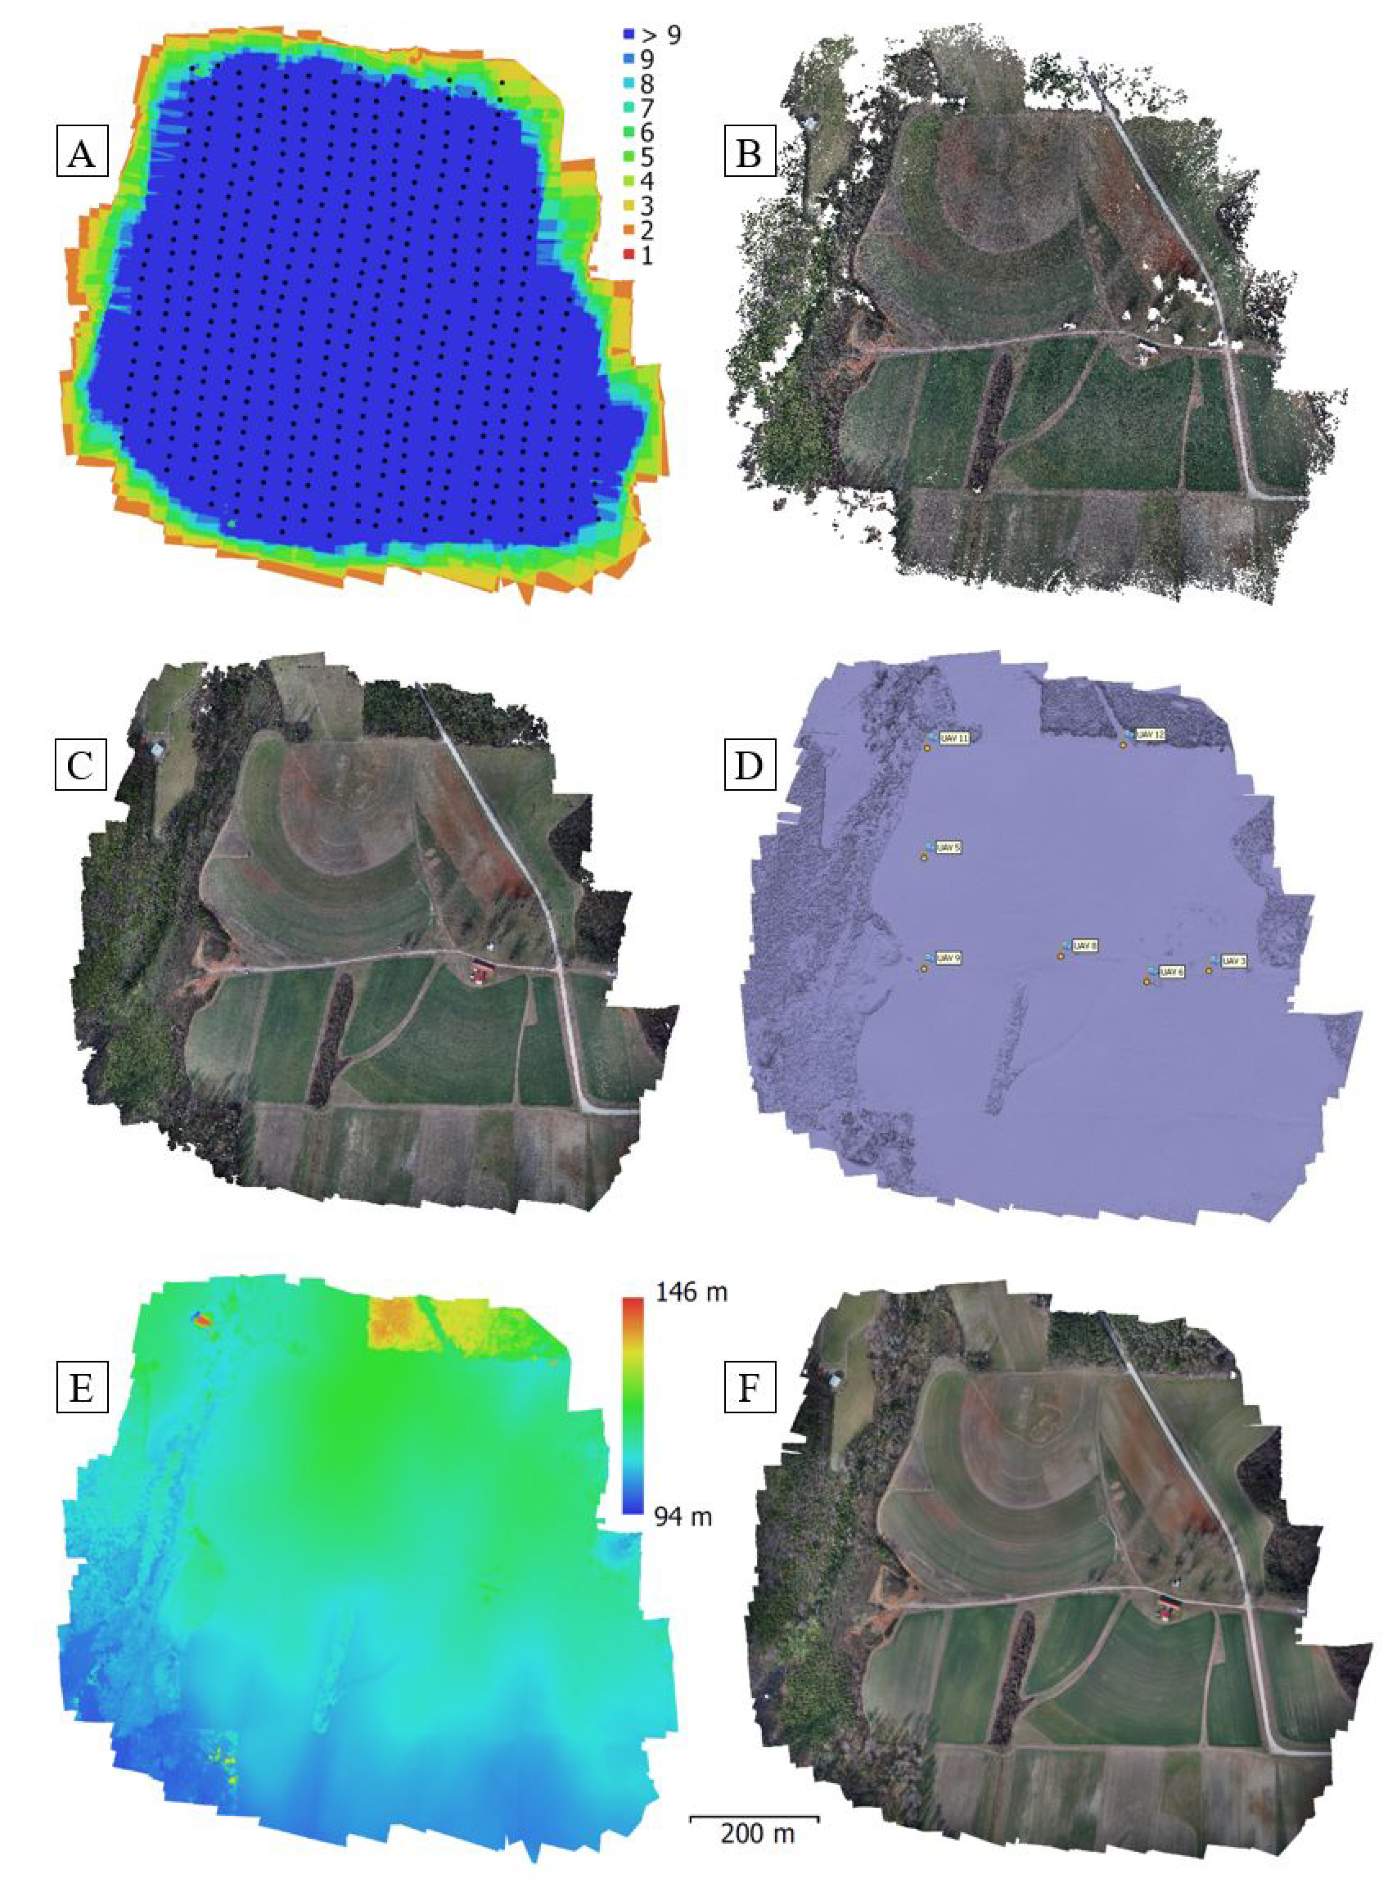
SfM-MVS has the goal of retrieving 3D information from 2D imagery [60]. The details of the process have been described by multiple authors [56,59,61,62,63,64,65,66]. The basic principle relies on the identification of common points across a sequence of 2D photographs taken from different angles, and recovering geometric information from the view parallax [56]. Since any particular common point must be present and identified within multiple pictures, it is necessary to have a sufficient overlap between consecutive photographs. It alleviates the problem of “shadow zones” when capturing data from a stationary sensor (Figure 14). The 3D scene consists of a point cloud of these distinct points generated by an automatic feature-detection-and-description algorithm called SIFT (Scale Invariant Feature Transform) [67] followed by bundle block adjustment [65]. These processes result in a scale invariant sparse point cloud (see Figure 15B). Although SIFT is the most commonly feature extraction algorithm used in UAS processing software packages, different approaches, i.e., SURF, KAZE, AKAZE, ORB, and BRISK have been successfully used for image matching for mapping purposes [68,69,70]. In order to increase the density of the point cloud, a conceptual extension of stereo photogrammetry with the use of multiple images (MVS) instead of stereo-pairs, is implemented [71], resulting in the generation of a denser point cloud (see Figure 15C). Finally, the dense point cloud can be interpolated into an orthomosaic (using values from vertices colors) and DSM (using the 3D locations, in applied coordinate system). Figure 15E,F shows the final result, a DSM and an orthophoto, respectively. There is a critical difference between use of SfM for geomatics applications (i.e., DTM creation) and 3D object modeling. Namely, the need that final image products be georeferenced—placed within a known vertical and horizontal coordinate system [63]. The method of georeferencing (based on geotags of the photographs, GCPs or using RTK/PPK technology) needs to be determined before the flight mission. Details of this process are described in Section 4.1.2.
An overview of the strengths and weaknesses of different algorithms used for multi-image SfM is discussed by Smith et al. [62] and Oliensis [73]; however, most commercially available software packages for this purpose utilize procedures optimized for high accuracy and efficiency.

4.2.1. Photogrammetric Processing Software

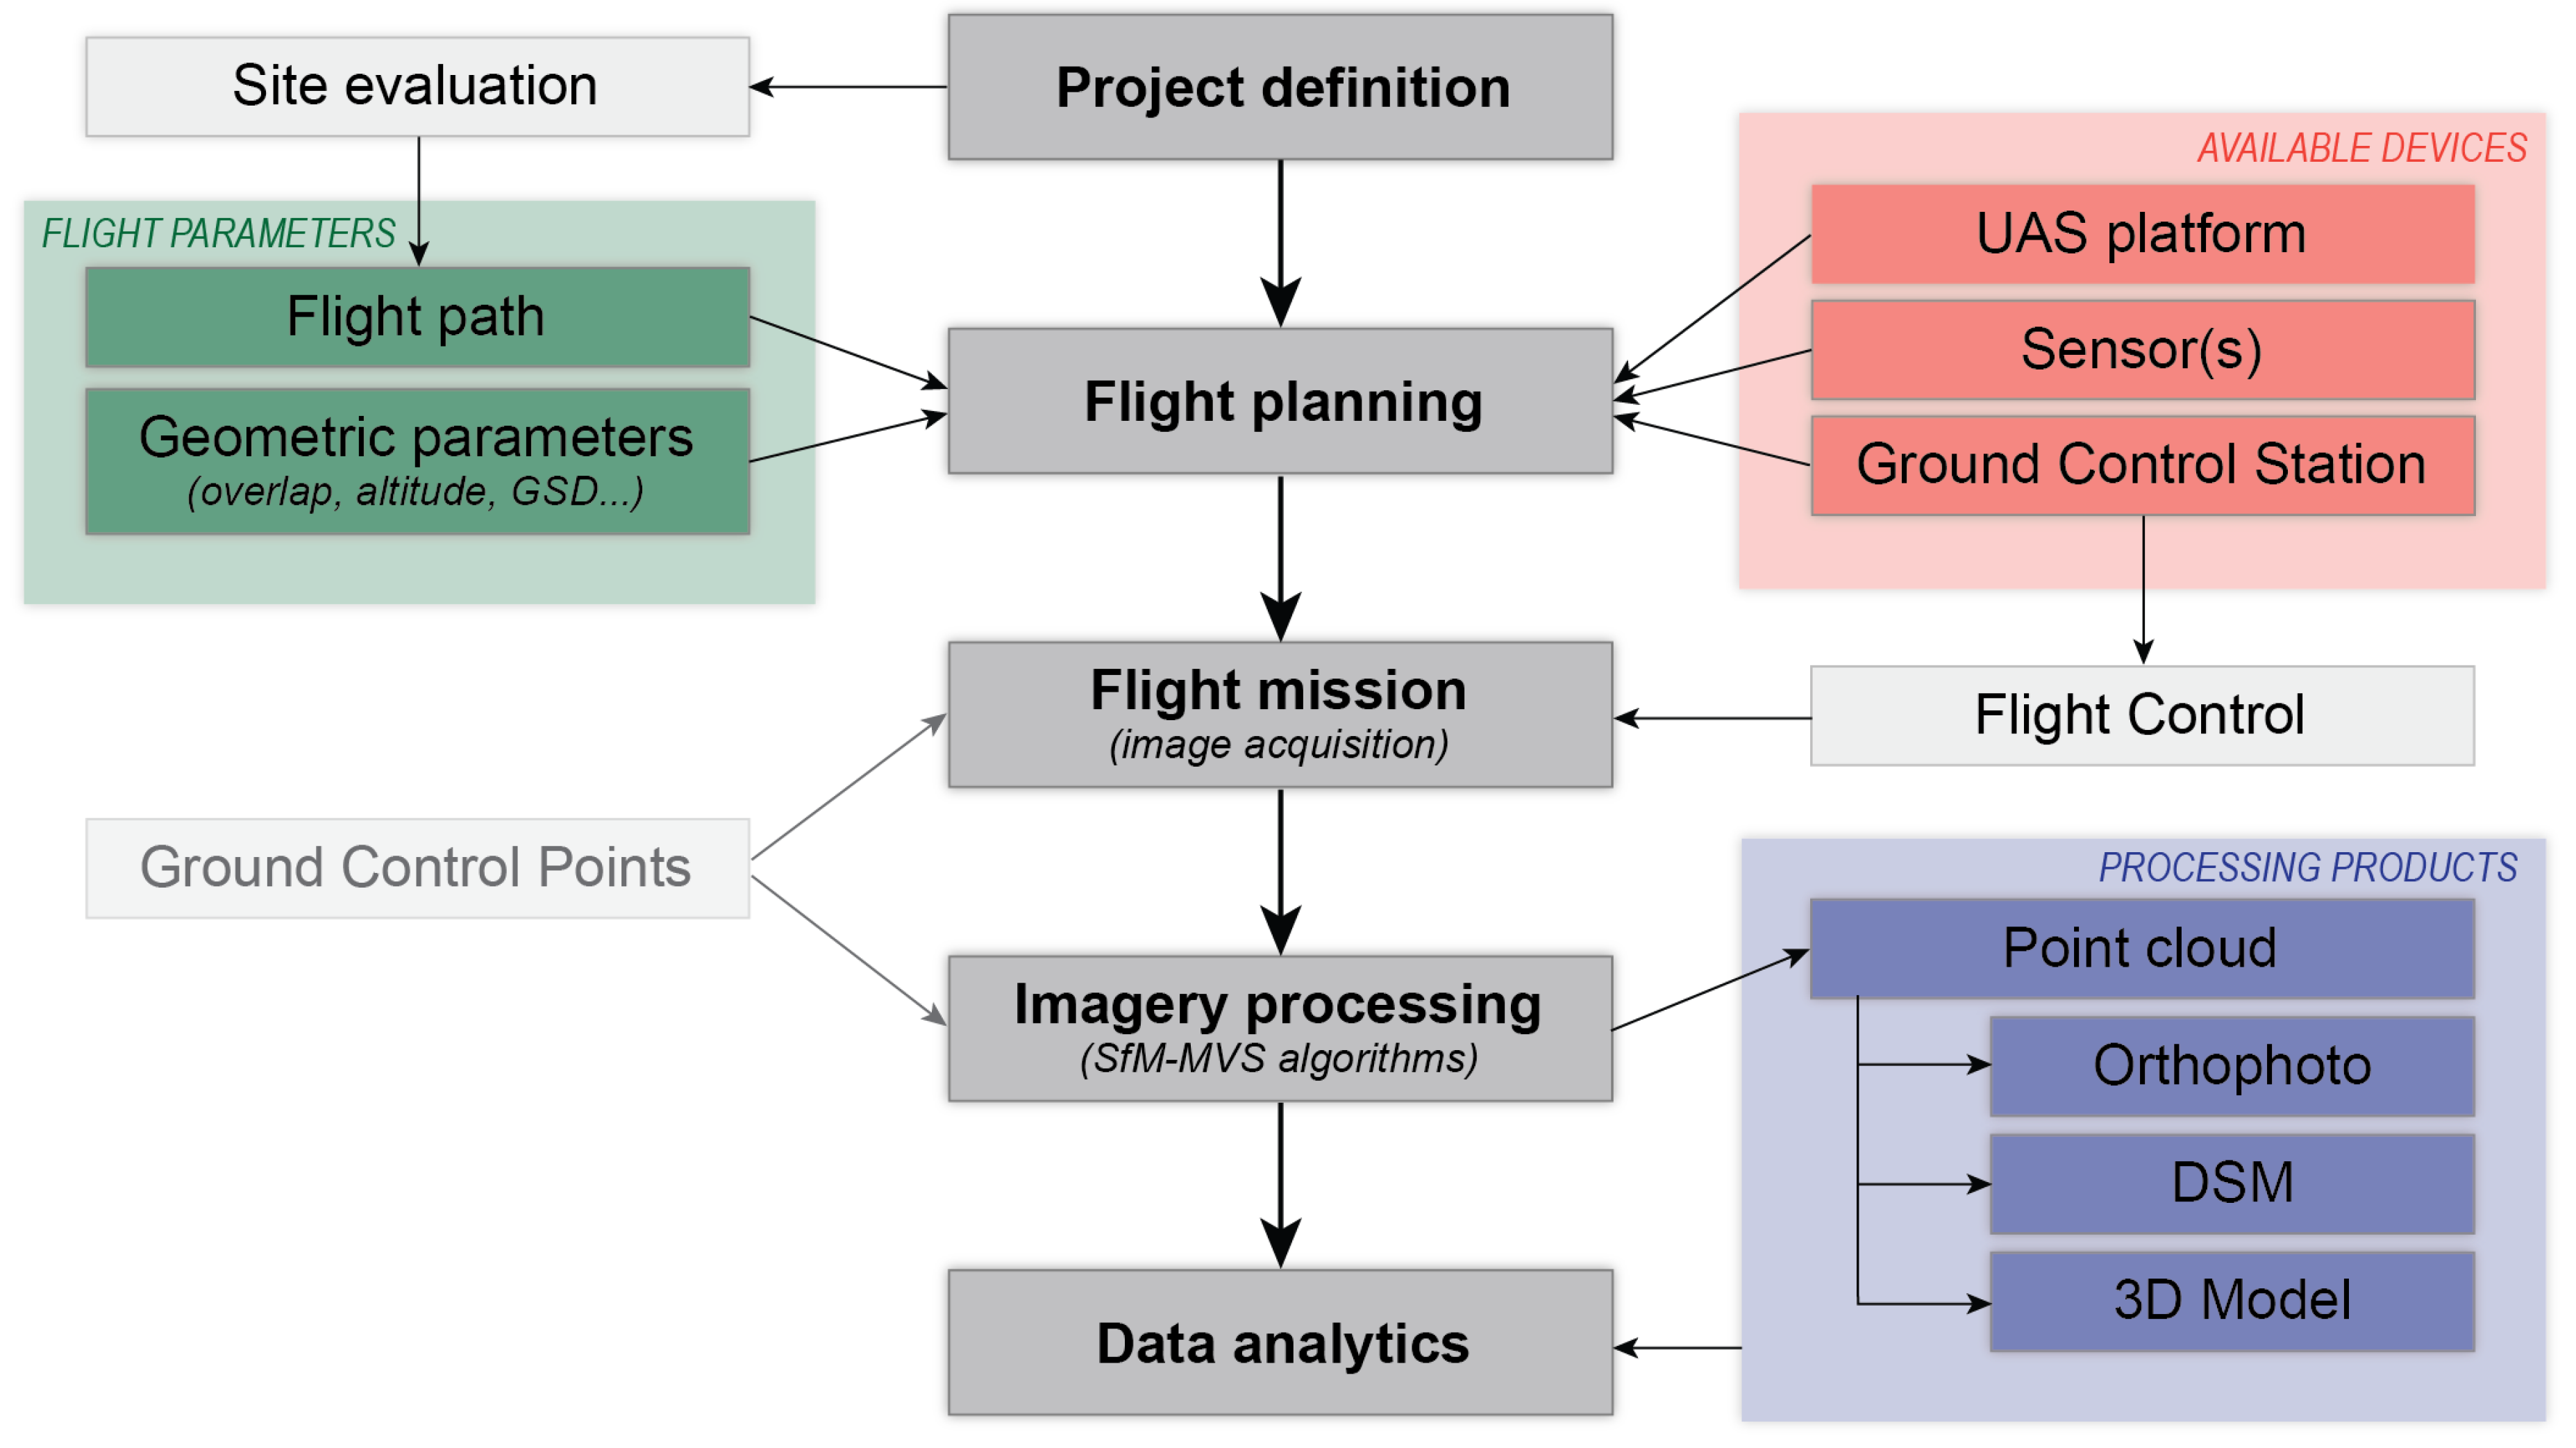
The development of SfM algorithms created new possibilities for UAS imagery processing. While the majority of professional photogrammetric software packages, designed initially for processing airborne or satellite imagery, are now able to process UAS imagery, there are distinct advantages for software solutions that are dedicated to UAS image data alone. One of the main strengths of the SfM-MVS approach is its flexibility in the type, number, scale, and positioning of input images that it can handle in the workflow [61]. An additional advantage of SfM algorithms over conventional photogrammetry from stereo-pairs is that, in addition to recreating the 3D surface objects or terrain, they recover camera parameters (interior orientation) and positions (exterior orientation). The particular steps of the processing vary based on the software, but the general scheme, based on the SfM-MVS algorithms, remains the same. Figure 16 shows the general pipeline for RGB imagery acquisition and processing.
It is not uncommon that the UAS manufacturer would offer a bundle with flight planning and post-fight imagery processing software (e.g., Trimble provides complete solutions). Advantages of such complete solutions include well-integrated workflows, and technical support. However, these solutions are often considerably less affordable and have limited flexibility in using alternative aircraft and sensor combinations. Luckily, there is a wide variety of platform-independent software packages, across a range of price points (including free and open source) that allow for flexible and adaptable workflows. The current market leader is Pix4D —which offers a suite of software products that use photogrammetry and computer vision algorithms to transform both RGB and multispectral images into 3D maps and models. Agisoft Metashape (formerly Agisoft Photoscan Professional) is also widely used in a research community. Other proprietary solutions include Bentley ContextCapture, RealityCapture, 3DF Zephyr, Correlator 3D,3Dsurvey, Menci APS, Autodesk ReCap 360, Icaros OneButton, Drone2Map for ArcGIS + Ortho mapping in ArcGIS Pro, Trimble Inpho UASMaster, Drone Mapper, Racurs PHOTOMOD UAS and open source solutions: WebODM and MicMac. The software packages differ in price and capabilities. Some of them, like Autodesk ReCap Pro or Pix4D Mapper, offer cloud-based processing, which is important when taking into account the massive computational requirements of SfM-MVS algorithms applied to very large image collections. From standalone licences, monthly and yearly subscription to pay-by-project solutions, the market of UAS imagery processing software is currently expanding at a hard-to-follow speed. On the other hand, acceptable results can be obtained with a wide variety of packages and the choice should be dictated by budgetary consideration, compute infrastructure, project requirements, integrability with existing workflows and data needs, and the dictates of the chosen aircraft-sensor combination.

4.2.2. Processing Outputs

The algorithms described above lead to the creation of multiple geospatial products (see Figure 15 and blue box on Figure 16). Primarily, SfM-MVS produces a dense point cloud. The accuracy and precision of which is comparable with point clouds derived from terrestrial or airborne lidar [74]. From this dense point cloud, the following products can be derived:
  • Orthomosaic—several blending modes (for example, assigning a raster color that represents the weighted average value of all pixels from individual photos) can be used for creating a georeferenced orthophotomap. The result looks like an aerial image consisting of all the individual pictures stitched together but is geometrically correct and can be used as cartographic material.
  • Digital Surface Model (DSM)—is created by interpolating the elevation value of the raster cells based on the points that are located within this cell. It is crucial to understand that the product of processing RGB imagery can create a Digital Surface Model, not the bare-earth DEM (see Figure 7). That is to say, whereas lidar point clouds are often processed to remove canopy returns that is not possible with DSM.
  • 3D Mesh—is a triangulated irregular network created by connecting the vertices of dense point cloud (see Figure 15, D) that can also be exported with texture and viewed as colored 3D model.
Orthomosaics and DSMs are crucial products for hydrological modeling and in wetland mapping applications. Terrain representation plays a crucial role in extracting hydrological information [75] and its accuracy substantially impacts hydrologic predictions [76]. Orthophotos and aerial imagery have been a source for wetland delineation for nearly 50 years [1], and are no less useful nowadays. An extended review of the use of the aforementioned spatial data can be found in Section 5 of this review.

4.3. Cost and Time Effectiveness

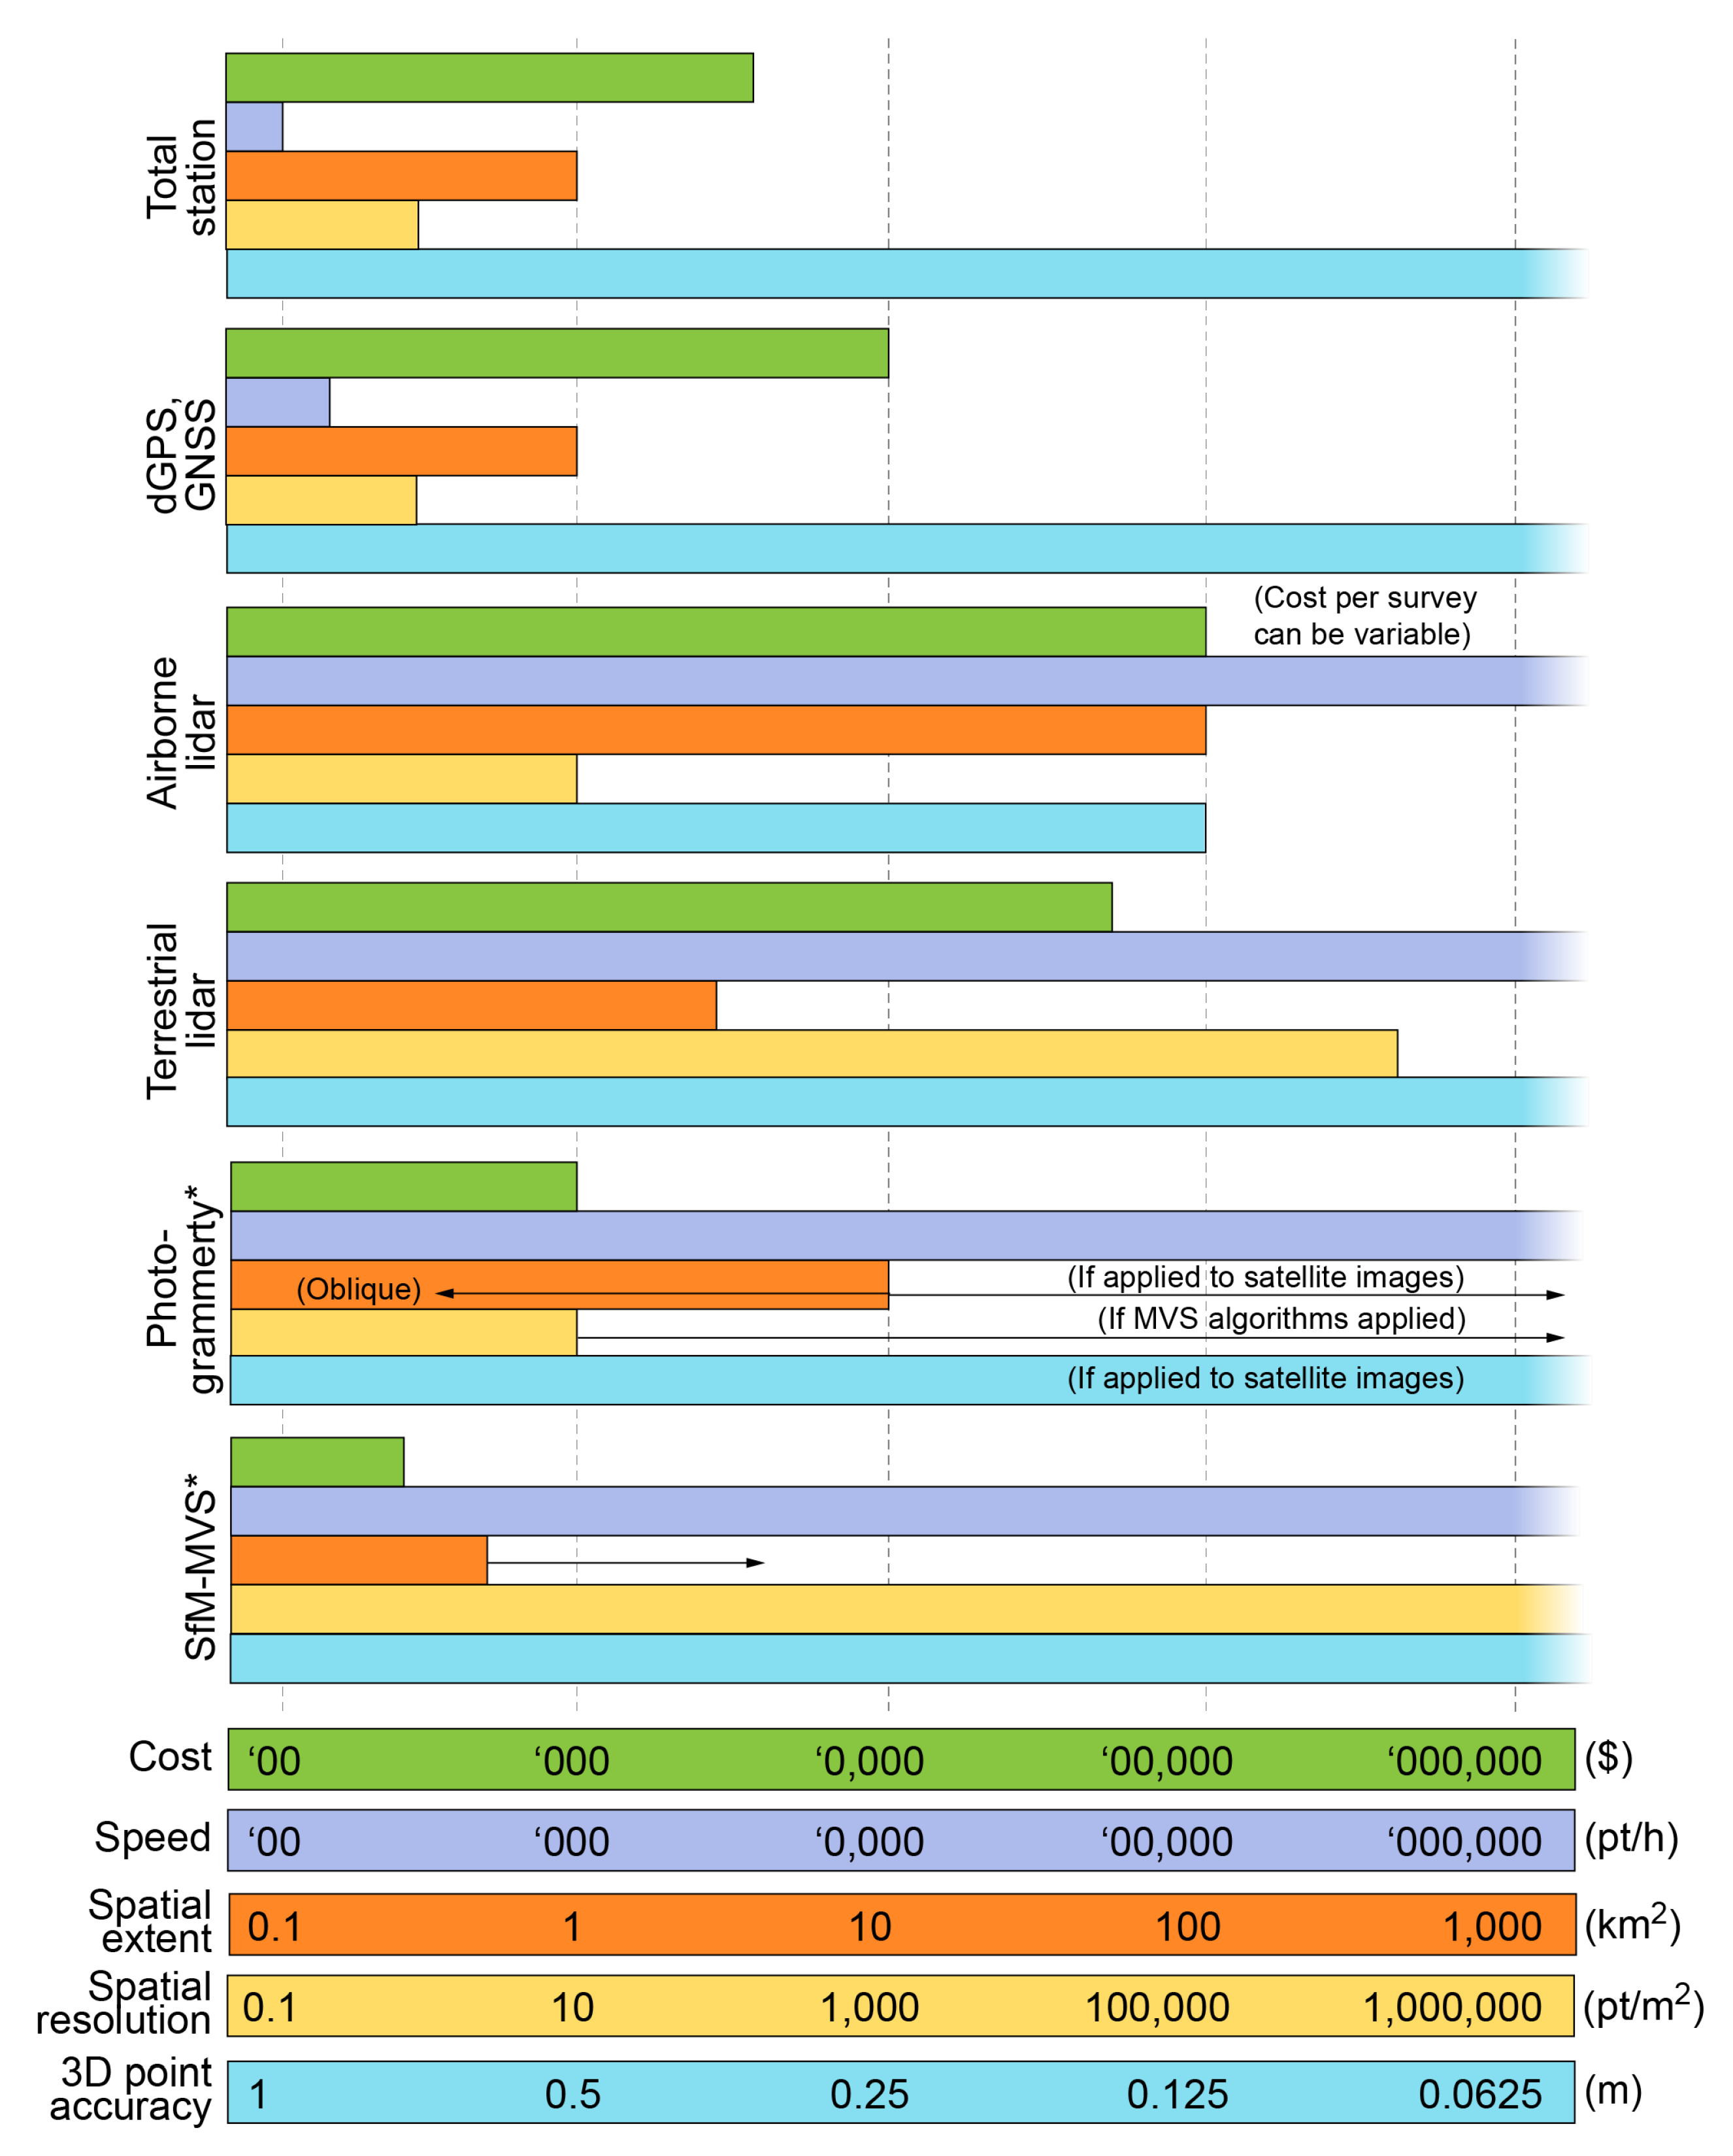
A comparison of the cost effectiveness of UAS is a challenging endeavour because it invariably fails to account for the many advantages of the UAS data acquisition. That is, while it is possible to compare production costs of very high resolution orthophotos from UAS and airborne systems, such accounting does not reflect the additional value of being able to carry novel sensors, being able to rapidly resurvey a study area, or the value of being able to recover 3D surface information [5]. Nevertheless, several studies have attempted to quantitatively evaluate UAS cost advantages. Carrivick et al. [61] cast UAS-based Structure from Motion in a broader comparison with traditional surveying methods: total station, dGPS, airborne lidar and traditional photogrammetry (see Figure 17). Like the UAS, each of these technologies has advantages and disadvantages regarding technological, operational and economic factors [13].
The versatility of the sensors that can be mounted on the UAS make them unique and hard to classify in a cost-effectiveness manner. A separate comparison would need to be made for each combination of sensor and platform. Bakuła et al. [77] examined the effectiveness of UAS-based lidar for levee monitoring. Thiel and Schmullius [78] compared photograph based point cloud accuracy with an airborne lidar and observed high match between these two sources, and Wallace et al. [79] assessed the accuracy in favor of airborne lidar. After a detailed comparison of the cost, time consumption and accuracy of UAS data in comparison to traditional surveying methods, Fitzpatrick [80] demonstrated that UAS methods cost less, take less time, and are as accurate in all but terrestrial lidar case.
Utilizing UAS for data acquisition has three unique advantages:
  • low initial investment cost;
  • low mobilization cost;
  • decreased time required for data acquisition.
In addition to cost and time effectiveness, Manfreda et al. [5] highlight the UAS ability to collect data in cloudy or hazy conditions that would otherwise obscure satellite retrieval. The low time and resource requirements for UAS deployment make them the most flexible of the data acquisition platforms and provide near real-time capabilities that are required in many environmental applications.
These unprecedented spatiotemporal advantages of UAS do not come without limitations in operations or data processing. These are scrutinized by Whitehead and Hugenholtz [81] in their review paper. In addition to the already described shortcomings of UAS-collected RGB imagery (variable illumination, irregular resolution due to variable flight altitude, image blur caused by the motion of the platform, etc.), other shortcomings of UAS can be noticed:
  • challenges for acquiring and processing data over large spatial scales (legal and technological);
  • repeatability depends on factors outside of the control of the surveyor;
  • more affordable solutions (SfM from RGB sensors, multispectral data) limit the application range.
In order to address these shortcomings, best practices in mission and fight planning, sensor configuration, data collection, ground control, image processing and analytics [5] must be implemented to ensure the final quality of the processed data.

4.4. Legal Constraints

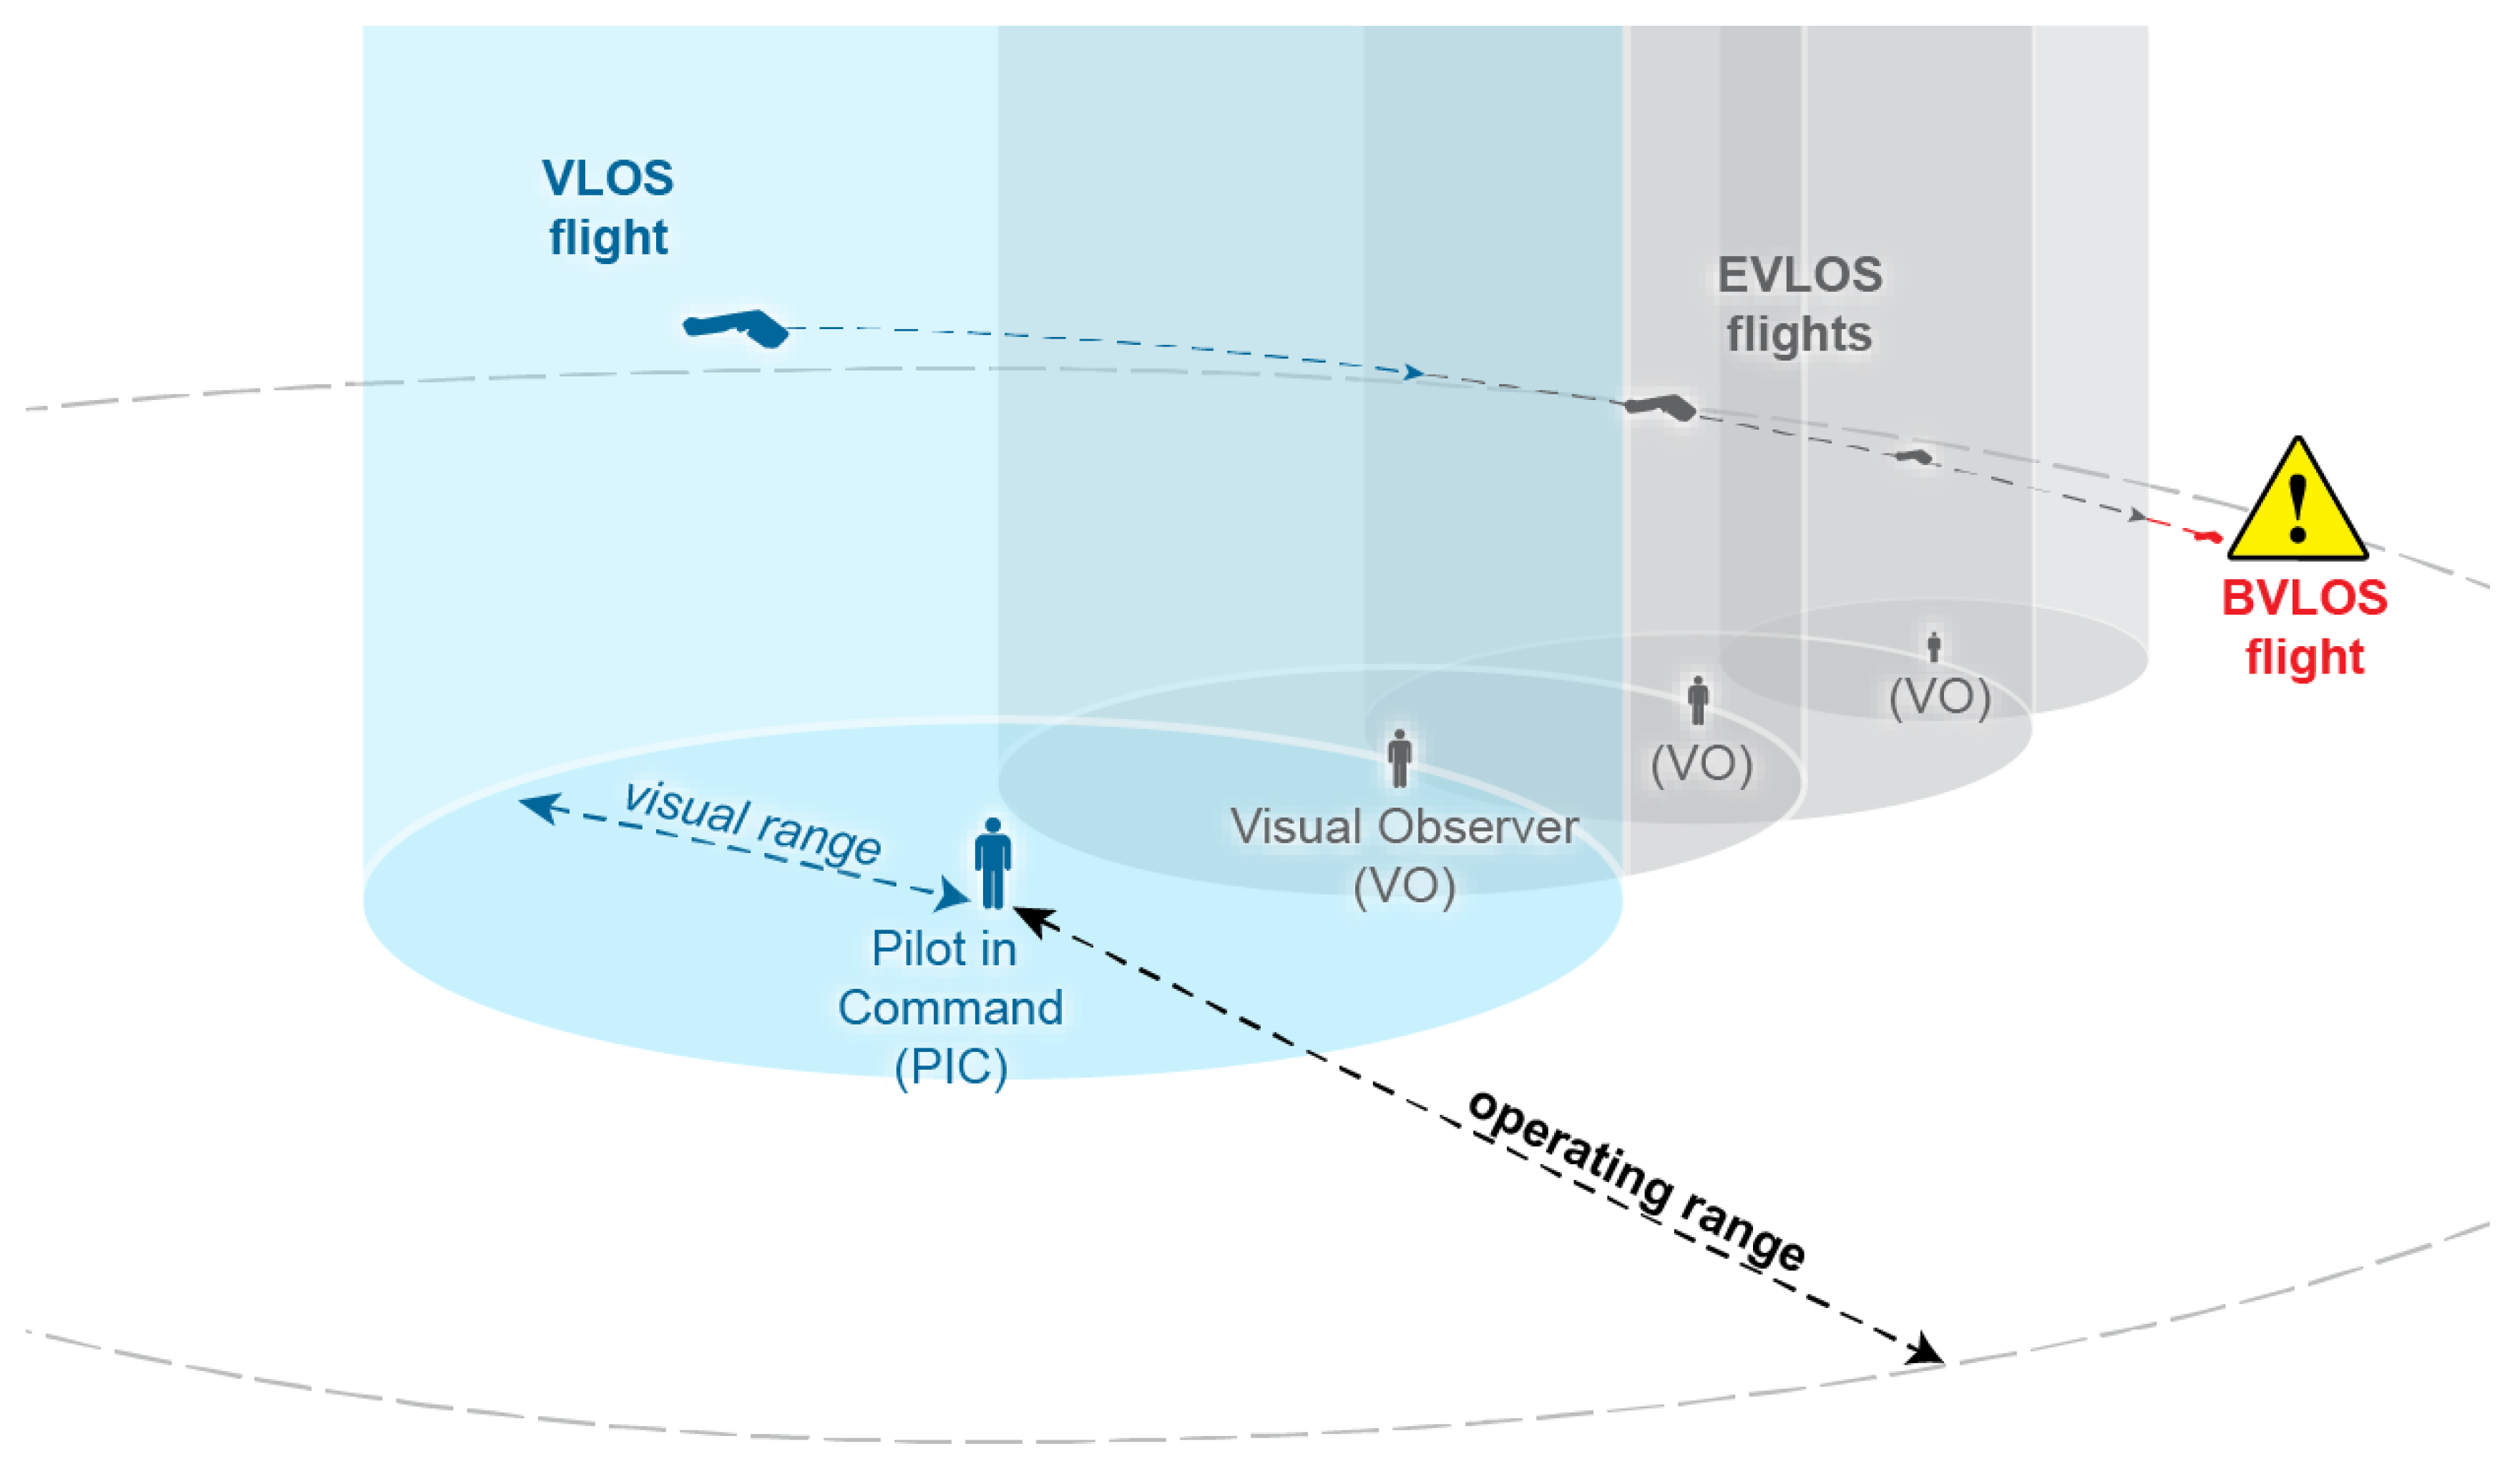
The rapid development of UAS technologies in the last couple of decades has resulted in a boom in the drone market, and unmanned vehicles have rapidly populated the airspace. At first, regulatory bodies were applying manned aircraft rules to UAS, but quickly started developing new standards and laws all over the world. In the United States, the Federal Aviation Administration (FAA) introduced, in August 2016, a new set of rules, known as “Part 107” aiming for safe incorporation of UAS into the National Airspace System [82]. Under this guidance, civilian use is restricted to unmanned vehicles up to 55 lbs. (~25 kg) in weight with mandatory registration for those between 0.55 to 55 lbs. (~0.25 to ~25 kg). The recreational use of drones remains the least regulated, while commercial drone pilots need to obtain a remote pilot certification which requires passing a knowledge test every two years (for those pilots who do not hold at least a manned aircraft sport license). There are important rules restricting in which classes of airspace UAS may be flown [83]. With regards to wetland monitoring in particular, and environmental observation in general, important FAA rules constrain the extent of interrogable areas. For instance, the size and flight altitude restrictions (up to 400 ft, ~122 m AGL) limit the area that can be covered by one flight. Furthermore, the UAS operator must maintain visible contact with the aircraft for the flight duration, constituting the biggest obstacle to the mapping of large areas. Although waivers can be granted by FAA which approve certain operations of aircraft outside these limitations [84], some of them, like § 107.39—“Operation Over People” and § 107.31—“Visual Line of Sight Aircraft Operation” are nearly impossible to obtain. The latter restriction has been the focus of a wide variety of projects aiming to improve unmanned traffic management practices [85] and detect and avoid capabilities [86]. The 2018 changes to part § 107.33—“Visual” observer allow for Extended Visual Line of Sight (EVLOS) flights. In EVLOS operations (see Figure 18), the remote pilot in command may not have the drone in visible sight at all times, but relies on one or more remote observers to keep the it in visual sight at all times [87]. This development enables more efficient large scale mapping and mapping within obstacle-rich areas.
Across the globe, regulations regarding UAS use differ greatly, spanning from very restrictive in countries who favor the safety-first approach to more permissive, supporting development of new technologies. Favorable regulations have aided the US, Europe, and China to become the largest markets in the world for commercial drone use [88]. Regulations in Europe vary from country to country (similarly to the patchwork of state-level legislation in the US). In China, the use of UAS is spatially restricted to airspace that is not controlled by the military (which governs over a half of national airspace). Although the level of restrictiveness vary in national laws worldwide, there are common elements of regulation: pilot’s license, aircraft registration, restricted zones, and insurance [88]. The requirements take into account UAS mass, flight altitude, type of use and sometimes pilot licence level.
Because the national UAS laws are constantly reevaluated and changed frequently (almost always to a more permissive approach), it is expected that, in a couple of years, operators will be able to fly in new locations and for new application cases.

5. Applications for Wetland Mapping and Hydrologic Modeling

The proliferation of UAS technology has impacted a wide-variety of application areas and research domains. In this section, we provide an overview of some of the seminal work on state-of-the-art UAS applications in hydrological modeling and wetland mapping. While most of the analyzed publications concern wetland areas, review also includes related environmental applications with the strong potential for use in wetland mapping or hydrological modeling. A number of studies have had the specific aim of using UAS to delineate wetlands. Among those, many studies focused on identifying and classifying wetland vegetation using Object-Based Image Analysis [20,89,90,91,92,93]. OBIA was discovered to be superior to pixel-based classification by Pande-Chhetri et al. [92]. UAS imagery has also been demonstrated to be suitable for species distribution quick mapping [94], as well as for training and validating satellite imagery [90]. Novel techniques for enhancing OBIA have been developed which take advantage of the unique characteristics of UAS data [91]. The versatility of UAS payloads facilitate multi-sensor approaches to environmental monitoring. Sankey et al. [95] fused data gathered by hyperspectral and lidar sensors obtained by UAS for individual plant species identification and 3D characterization; Wigmore et al. [96] mapped surface soil moisture in Andean wetlands using thermal and multispectral imagery, and Berni et al. [97] showed that UAS-based thermal and multispectral imagery yielded comparable estimates to the products of traditional manned airborne sensors.
Importance of the resolution of terrain data for performance of hydrological models has been studied by many [98,99,100,101,102,103]. The need for very fine scale terrain models for testing the performace of the models triggered the use of UAS for terrain data collection. Besides the direct use of UAS generated products for testing the models, they can also be used for parametralization, similar to the use of airborne lidar [104]. A novel method of updating the lidar DEM with UAS derived DSM has been recently developed [105].
These and other UAS uses in hydrological and environmental studies with their respective main objectives and conclusions, as well as the type of the UAS platform and sensor used, are compiled in Table 8.
While the above listed studies are selective in their application, they are sufficiently diverse to illustrate many of the major benefits and challenges currently associated with the use of small UAS for wetland mapping and monitoring purposes. They also provide a good snapshot of the present state of the industry. Currently, UAS applications in wetlands are heavily biased towards photogrammetric applications. With the unprecedented pace of platform and sensor development in the last decade, it is predicted that the continued evolution will extend the range of wetland related applications for which small UAS are suitable. Recent advances in miniaturization of the lidar sensors opened new avenues for wetlands and hydrology related research, including fusion of multiple sensors. Constant improvements in hardware and technologies leave room for improvements in already established methods and leaves opportunities for developing new algorithms. The main challenge is not the data acquisition, but the automation of analysis and interpretation of the processing products. It is evident that wetland related UAS research relies heavily on technology that is being improved by other fields, driven not only by the academia, but also by the UAS industry. For researchers interested in developing new methods based on UAS spatial data, it is crucial to follow the UAS market very closely. On the other hand, the hindering factor for research and development is still the legislation preventing testing new applications. Researchers should be vigilant about the anticipated changes in UAS laws in the upcoming years and use the more permissive regulations to expand the studies.

6. Discussion and Conclusions

The advent of the use of UAS for scientific purposes was triggered by multiple factors. Recent advances in electronics and miniaturization contribute to the increased availability of these systems and the popularization of their use [1]. It is worth mentioning that the commercial popularization of drones for seemingly unrelated purposes (defense, videography, traffic control, construction planning, mining, etc.) aids research by development of new technologies, sensors, control elements and air frames that can be adapted for mapping, environmental monitoring and modeling. We can expect that further investments in aforementioned fields will contribute to further development of novel applications of UAS in wetland mapping and hydrological modeling.
The following conclusions can be drawn from this review:
  • The key advantage of the UAS is the ability to capture spatial data with high spatial and temporal resolution coupled with time and cost efficiency. Filling the void between time-consuming terrain measurements and expensive and sophisticated satellite and airborne data collection benefits a vast array of research, including environmental monitoring and modeling at unprecedented resolution and ease (see Section 2 and Section 4.3)
  • The use of UAS-derived data bolstered by environmental sensor networks, satellite-based remote sensing, and high-performance numerical modeling [104] brings new opportunities in hydrology and related fields: modeling, predictions and overall understanding of hydrological processes enters into new era thanks to availability and affordability of reliable high resolution terrain data (see Section 5).
  • The most common type of UAS used for wetland mapping and hydrological modeling is the rotary wing and the prevailing sensor used for this purpose is an RGB camera (see Section 5). It is caused by affordability and ease of use of both technologies. There is room for development and advancement of other sensors in addition to taking advantage of fixed wing UAS capabilities (see Section 3.1).
  • Ample choice of processing software and analytics algorithms gives opportunity to investigate various hydrological phenomena, but the shortcoming of the Structure from Motion algorithms in reconstructing homogeneous and moving scene elements makes it challenging to capture water (it is either still and homogeneous or moving) and snow (homogeneous) surfaces, crucial for analyzing some aspects of hydrological studies.
  • Another shortcoming of using optical sensor for hydrological research lies in the inability to penetrate vegetation. Representing the ground surface is crucial, especially for hydrological modeling and wetland studies in very densely vegetated wetland areas. This can be addressed by the use of lidar, but, just like hyperspectral sensors, they face a challenge of maintaining good quality data capture capabilities while miniaturization progresses. An additional barrier is the relatively high cost of these sensors (see Section 3.2).
  • The issue of scale can also be a disadvantage for the use of UAS. Many wetlands cover significant areas and capturing the whole basin is also very important in hydrological modeling. While technology allows for long flights, the legislation prohibits operations beyond the line of sight (without a waiver), which results in the need of multiple flight missions in commonly hard to reach wetland areas. With the addition of extended visual line of sight (EVLOS) lies a hope for the future change of law or easing the waiver obtaining process (see Section 4.4).
  • Along with all the advantages of the UAS use also come the safety and privacy concerns. It is crucial for each UAS user to be informed, follow the state and federal legislature, and ensure the proper equipment maintenance in order not only to avoid collision but also to maximise the benefits of UAS use while respecting privacy.
We can expect further advances in technology followed by more common and more novel use of the UAS for wetland mapping and hydrological modeling in the future.

Funding

This research received no external funding

Acknowledgments

The author would like to acknowledge Joshua Gray; Helena Mitasova; Tomasz Niedzielski, for mentoring and guidance.

Conflicts of Interest

The author declares no conflict of interest.

Abbreviations

The following abbreviations are used in this manuscript:
AGLAbove Ground Level
ASLAbove Sea Level
AOIArea of Interest
BVLOSBeyond Visual Line of Sight
CIRColor-Infrared
dGPSdifferential Global Positioning System
DEMDigital Elevation Model
DoDDepartment of Defense
DSMDigital Surface Model
DTMDigital Terrain Model
EVLOSExtended Visual Line of Sight
FAAFederal Aviation Administration
GCPGround Control Point
GCSGround Control Station
GNSSGlobal Navigation Satellite System
GPSGlobal Positioning System
GSDGround Sampling Distance
IMUInertial Measurement Unit
INSInertial Navigation System
lidarlight detection and ranging
MVSMultiple View Stereo
NDVINormalized Difference Vegetation Index
NIRNear-infrared
OBIAObject-based Image Analysis
PPKPost Processed Kinematics
RGBRed Green Blue
RTKReal Time Kinematics
SARSynthetic Aperture Radar
SfMStructure from Motion
STOLShort Take-Off and Landing
UASUnmanned Aerial System
UAVUnmanned Aerial Vehicle
VLOSVisual Line of Sight
VTOLVertical Take-Off and Landing

References

  1. Madden, M.; Jordan, T.; Bernardes, S.; Cotten, D.L.; O’Hare, N.; Pasqua, A. Unmanned aerial systems and structure from motion revolutionize wetlands mapping. In Remote Sensing of Wetlands: Applications and Advances; CRC Press: Boca Raton, FL, USA, 2015; pp. 195–220. [Google Scholar] [CrossRef]
  2. Belward, A.S.; Skøien, J.O. Who launched what, when and why; trends in global land-cover observation capacity from civilian earth observation satellites. ISPRS J. Photogramm. Remote Sens. 2015, 103, 115–128. [Google Scholar] [CrossRef]
  3. Wekerle, T.; Filho, J.B.P.; da Costa, L.E.V.L.; Trabasso, L.G. Status and trends of smallsats and their launch vehicles—An up-to-date review. J. Aerosp. Technol. Manag. 2017, 9, 269–286. [Google Scholar] [CrossRef]
  4. McCabe, M.F.; Aragon, B.; Houborg, R.; Mascaro, J. CubeSats in hydrology: Ultrahigh-resolution insights into vegetation dynamics and terrestrial evaporation. Water Resour. Res. 2017, 53, 10017–10024. [Google Scholar] [CrossRef]
  5. Manfreda, S.; McCabe, M.F.; Miller, P.E.; Lucas, R.; Pajuelo Madrigal, V.; Mallinis, G.; Ben Dor, E.; Helman, D.; Estes, L.; Ciraolo, G.; et al. On the use of unmanned aerial systems for environmental monitoring. Remote Sens. 2018, 10, 641. [Google Scholar] [CrossRef]
  6. Pajares, G. Overview and current status of remote sensing applications based on unmanned aerial vehicles (UAVs). Photogramm. Eng. Remote Sens. 2015, 81, 281–330. [Google Scholar] [CrossRef]
  7. Matese, A.; Toscano, P.; di Gennaro, S.F.; Genesio, L.; Vaccari, F.P.; Primicerio, J.; Belli, C.; Zaldei, A.; Bianconi, R.; Gioli, B. Intercomparison of UAV, Aircraft and Satellite Remote Sensing Platforms for Precision Viticulture. Remote Sens. 2015, 7, 2971–2990. [Google Scholar] [CrossRef] [Green Version]
  8. Dustin, M.C. Monitoring Parks with Inexpensive UAVs: Cost Benefits Analysis for Monitoring and Maintaining Parks Facilities. Ph.D. Thesis, University of Southern California, Los Angeles, CA, USA, August 2015. [Google Scholar]
  9. Watts, A.C.; Ambrosia, V.G.; Hinkley, E.A.; Watts, A.C.; Ambrosia, V.G.; Hinkley, E.A. Unmanned aircraft systems in remote sensing and scientific research: Classification and considerations of use. Remote Sens. 2012, 4, 1671–1692. [Google Scholar] [CrossRef]
  10. van der Wal, T.; Abma, B.; Viguria, A.; Prévinaire, E.; Zarco-Tejada, P.J.; Serruys, P.; van Valkengoed, E.; van der Voet, P. Fieldcopter: Unmanned aerial systems for crop monitoring services. In Precision Agriculture ’13; Wageningen Academic Publishers: Wageningen, The Netherlands, 2013; pp. 169–175. [Google Scholar] [CrossRef]
  11. Przybilla, H.; Wester-Ebbinghaus, W. Bildflug mit ferngelenktem Kleinflugzeug. Bildmessung und Luftbildwesen; Zeitschrift für Photogrammetrie und Fernerkundung; Herbert Wichmann Verlag: Karlsruhe, Germany, 1979; pp. 137–142. [Google Scholar]
  12. Eisenbeiß, H.; Zurich, E.T.H.; Eisenbeiß, H.; Zürich, E.T.H. UAV Photogrammetry. Ph.D. Thesis, ETH Zurich, Zurich, Switzerland, 2009. [Google Scholar] [CrossRef]
  13. Pádua, L.; Vanko, J.; Hruška, J.; Adão, T.; Sousa, J.J.; Peres, E.; Morais, R. UAS, sensors, and data processing in agroforestry: A review towards practical applications. Int. J. Remote Sens. 2017, 38, 2349–2391. [Google Scholar] [CrossRef]
  14. Nex, F.; Remondino, F. UAV for 3D mapping applications: A review. Appl. Geomat. 2014, 6, 1–15. [Google Scholar] [CrossRef]
  15. Fahlstrom, P.G.; Gleason, T.J. Introduction to UAV Systems, Fourth Edition; John Wiley & Sons, Ltd.: Hoboken, NJ, USA, 2012. [Google Scholar] [CrossRef]
  16. Austin, R. Unmanned Aircraft Systems: UAVs Design, Development and Deployment; John Wiley & Sons, Ltd.: Chichester, UK, 2010. [Google Scholar]
  17. Zhang, C.; Kovacs, J.M. The application of small unmanned aerial systems for precision agriculture: A review. Precis. Agric. 2012, 13, 693–712. [Google Scholar] [CrossRef]
  18. Qi, S.; Wang, F.; Jing, L. Unmanned aircraft system pilot/operator qualification requirements and training study. MATEC Web Conf. 2018, 179, 03006. [Google Scholar] [CrossRef]
  19. Senthilnath, J.; Kandukuri, M.; Dokania, A.; Ramesh, K. Application of UAV imaging platform for vegetation analysis based on spectral-spatial methods. Comput. Electron. Agric. 2017, 140, 8–24. [Google Scholar] [CrossRef]
  20. Husson, E.; Ecke, F.; Reese, H.; Husson, E.; Ecke, F.; Reese, H. Comparison of manual mapping and automated object-based image analysis of non-submerged aquatic vegetation from very-high-resolution UAS images. Remote Sens. 2016, 8, 724. [Google Scholar] [CrossRef]
  21. Laliberte, A.S.; Goforth, M.A.; Steele, C.M.; Rango, A. Multispectral remote sensing from unmanned aircraft: Image processing workflows and applications for rangeland environments. Remote Sens. 2011, 3, 2529–2551. [Google Scholar] [CrossRef]
  22. Remondino, F. Heritage Recording and 3D Modeling with Photogrammetry and 3D Scanning. Remote Sens. 2011, 3, 1104–1138. [Google Scholar] [CrossRef] [Green Version]
  23. Colomina, I.; Molina, P. Unmanned aerial systems for photogrammetry and remote sensing: A review. ISPRS J. Photogramm. Remote Sens. 2014, 92, 79–97. [Google Scholar] [CrossRef] [Green Version]
  24. Turner, I.L.; Harley, M.D.; Drummond, C.D. UAVs for coastal surveying. Coastal Eng. 2016, 114, 19–24. [Google Scholar] [CrossRef]
  25. Nebiker, S.; Lack, N.; Abächerli, M.; Läderach, S. Light-weight multispectral UAV sensors and their capabilities for predicting grain yield and detecting plant diseases. ISPRS—Int. Arch. Photogramm. Remote Sens. Spat. Inf. Sci. 2016, XLI-B1, 963–970. [Google Scholar] [CrossRef]
  26. Deng, L.; Mao, Z.; Li, X.; Hu, Z.; Duan, F.; Yan, Y. UAV-based multispectral remote sensing for precision agriculture: A comparison between different cameras. ISPRS J. Photogramm. Remote Sens. 2018, 146, 124–136. [Google Scholar] [CrossRef]
  27. Adão, T.; Hruška, J.; Pádua, L.; Bessa, J.; Peres, E.; Morais, R.; Sousa, J. Hyperspectral imaging: A review on UAV-based sensors, data processing and applications for agriculture and forestry. Remote Sens. 2017, 9, 1110. [Google Scholar] [CrossRef]
  28. Kostrzewa, J.; Meyer, W.H.; Laband, S.; Terre, W.A.; Petrovich, P.; Swanson, K.; Sundra, C.; Sener, W.; Wilmott, J. Infrared microsensor payload for miniature unmanned aerial vehicles. In Unattended Ground Sensor Technologies and Applications V; Carapezza, E.M., Ed.; SPIE: Bellingham, WA, USA, 2003. [Google Scholar] [CrossRef]
  29. Khanal, S.; Fulton, J.; Shearer, S. An overview of current and potential applications of thermal remote sensing in precision agriculture. Comput. Electron. Agric. 2017, 139, 22–32. [Google Scholar] [CrossRef]
  30. Shafian, S.; Maas, S. Index of soil moisture using raw landsat image digital count data in texas high plains. Remote Sens. 2015, 7, 2352–2372. [Google Scholar] [CrossRef]
  31. Hassan-Esfahani, L.; Torres-Rua, A.; Jensen, A.; McKee, M. Assessment of surface soil moisture using high-resolution multi-spectral imagery and artificial neural networks. Remote Sens. 2015, 7, 2627–2646. [Google Scholar] [CrossRef]
  32. Soliman, A.; Heck, R.; Brenning, A.; Brown, R.; Miller, S. Remote sensing of soil moisture in vineyards using airborne and ground-based thermal inertia data. Remote Sens. 2013, 5, 3729–3748. [Google Scholar] [CrossRef]
  33. Osroosh, Y.; Peters, R.T.; Campbell, C.S.; Zhang, Q. Automatic irrigation scheduling of apple trees using theoretical crop water stress index with an innovative dynamic threshold. Comput. Electron. Agric. 2015, 118, 193–203. [Google Scholar] [CrossRef]
  34. Gonzalez-Dugo, V.; Zarco-Tejada, P.; Nicolás, E.; Nortes, P.A.; Alarcón, J.J.; Intrigliolo, D.S.; Fereres, E. Using high resolution UAV thermal imagery to assess the variability in the water status of five fruit tree species within a commercial orchard. Precis. Agric. 2013, 14, 660–678. [Google Scholar] [CrossRef]
  35. O’Shaughnessy, S.A.; Evett, S.R.; Colaizzi, P.D.; Howell, T.A. A crop water stress index and time threshold for automatic irrigation scheduling of grain sorghum. Agric. Water Manag. 2012, 107, 122–132. [Google Scholar] [CrossRef] [Green Version]
  36. Wang, B.; Shi, W.; Liu, E. Robust methods for assessing the accuracy of linear interpolated DEM. Int. J. Appl. Earth Observ. Geoinform. 2015, 34, 198–206. [Google Scholar] [CrossRef]
  37. Mahlein, A.K. Plant disease detection by imaging sensors—Parallels and specific demands for precision agriculture and plant phenotyping. Plant Dis. 2016, 100, 241–251. [Google Scholar] [CrossRef]
  38. Calderón, R.; Montes-Borrego, M.; Landa, B.B.; Navas-Cortés, J.A.; Zarco-Tejada, P.J. Detection of downy mildew of opium poppy using high-resolution multi-spectral and thermal imagery acquired with an unmanned aerial vehicle. Precis. Agric. 2014, 15, 639–661. [Google Scholar] [CrossRef]
  39. Oerke, E.C.; Fröhling, P.; Steiner, U. Thermographic assessment of scab disease on apple leaves. Precis. Agric. 2010, 12, 699–715. [Google Scholar] [CrossRef]
  40. Heritage, G.L.; Milan, D.J.; Large, A.R.G.; Fuller, I.C. Influence of survey strategy and interpolation model on DEM quality. Geomorphology 2009, 112, 334–344. [Google Scholar] [CrossRef]
  41. Alho, P.; Kukko, A.; Hyyppä, H.; Kaartinen, H.; Hyyppä, J.; Jaakkola, A. Application of boat-based laser scanning for river survey. Earth Surf. Process. Landf. 2009, 34, 1831–1838. [Google Scholar] [CrossRef]
  42. Hodge, R.; Brasington, J.; Richards, K. Analysing laser-scanned digital terrain models of gravel bed surfaces: Linking morphology to sediment transport processes and hydraulics. Sedimentology 2009, 56, 2024–2043. [Google Scholar] [CrossRef]
  43. Lang, M.; Bourgeau-Chavez, L.; Tiner, R.; Klemas, V. Advances in remotely sensed data and techniques for wetland mapping and monitoring. In Remote Sensing of Wetlands; CRC Press: Boca Raton, FL, USA, 2015; pp. 79–116. [Google Scholar] [CrossRef]
  44. Wallace, L.; Lucieer, A.; Watson, C.; Turner, D. Development of a UAV-LiDAR system with application to forest inventory. Remote Sens. 2012, 4, 1519–1543. [Google Scholar] [CrossRef]
  45. Mitsch, W.J.; Gosselink, J.G. Wetlands; John Wiley & Sons, Ltd.: Hoboken, NJ, USA, 2007. [Google Scholar]
  46. Hogg, A.R.; Holland, J. An evaluation of DEMs derived from LiDAR and photogrammetry for wetland mapping. For. Chron. 2008, 84, 840–849. [Google Scholar] [CrossRef] [Green Version]
  47. Snyder, G.I.; Sugarbaker, L.J.; Jason, A.L.; Maune, D.F. National Requirements for Improved Elevation Data; USGS: Reston, VA, USA, 2014. [CrossRef]
  48. Miziński, B.; Niedzielski, T. Fully-automated estimation of snow depth in near real time with the use of unmanned aerial vehicles without utilizing ground control points. Cold Reg. Sci. Technol. 2017, 138, 63–72. [Google Scholar] [CrossRef]
  49. Sanz-Ablanedo, E.; Chandler, J.; Rodríguez-Pérez, J.; Ordóñez, C. Accuracy of unmanned aerial vehicle (UAV) and SfM photogrammetry survey as a function of the number and location of ground control points used. Remote Sens. 2018, 10, 1606. [Google Scholar] [CrossRef]
  50. Hugenholtz, C.; Brown, O.; Walker, J.; Barchyn, T.; Nesbit, P.; Kucharczyk, M.; Myshak, S. Spatial accuracy of UAV-derived orthoimagery and topography: Comparing photogrammetric models processed with direct geo-referencing and ground control points. GEOMATICA 2016, 70, 21–30. [Google Scholar] [CrossRef]
  51. Lane, S.N.; Richards, K.S.; Chandler, J.H. Developments in monitoring and modelling small-scale river bed topography. Earth Surf. Process. Landf. 1994, 19, 349–368. [Google Scholar] [CrossRef]
  52. Chandler, J. Effective application of automated digital photogrammetry for geomorphological research. Earth Surf. Process. Landf. 1999, 24, 51–63. [Google Scholar] [CrossRef]
  53. Westaway, R.M.; Lane, S.N.; Hicks, D.M. The development of an automated correction procedure for digital photogrammetry for the study of wide, shallow, gravel-bed rivers. Earth Surf. Process. Landf. 2000, 25, 209–226. [Google Scholar] [CrossRef]
  54. Bennett, G.; Molnar, P.; Eisenbeiss, H.; McArdell, B. Erosional power in the Swiss Alps: Characterization of slope failure in the Illgraben. Earth Surf. Process. Landf. 2012, 37, 1627–1640. [Google Scholar] [CrossRef]
  55. Brasington, J.; Rumsby, B.T.; McVey, R.A. Monitoring and modelling morphological change in a braided gravel-bed river using high resolution GPS-based survey. Earth Surf. Process. Landf. 2000, 25, 973–990. [Google Scholar] [CrossRef]
  56. Micheletti, N.; Chandler, J.H.; Lane, S.N. Structure from Motion (SfM) Photogrammetry. In Geomorphological Techniques; Cook, S.J., Clarke, L.E., Nield, J.M., Eds.; British Society for Geomorphology: London, UK, 2015. [Google Scholar]
  57. Ullman, S.; Brenner, S. The interpretation of structure from motion. Proc. R. Soc. Lond. Ser. B Biol. Sci. 1979, 203, 405–426. [Google Scholar] [CrossRef]
  58. Seitz, S.; Curless, B.; Diebel, J.; Scharstein, D.; Szeliski, R. A comparison and evaluation of multi-view stereo reconstruction algorithms. In Proceedings of the 2006 IEEE Computer Society Conference on Computer Vision and Pattern Recognition—Volume 1 (CVPR’06), New York, NY, USA, 17–22 June 2006; IEEE: Piscataway, NJ, USA, 2006. [Google Scholar] [CrossRef]
  59. Fonstad, M.A.; Dietrich, J.T.; Courville, B.C.; Jensen, J.L.; Carbonneau, P.E. Topographic structure from motion: a new development in photogrammetric measurement. Earth Surf. Process. Landf. 2013, 38, 421–430. [Google Scholar] [CrossRef]
  60. Gomez, C.; Hayakawa, Y.; Obanawa, H. A study of Japanese landscapes using structure from motion derived DSMs and DEMs based on historical aerial photographs: New opportunities for vegetation monitoring and diachronic geomorphology. Geomorphology 2015, 242, 11–20. [Google Scholar] [CrossRef] [Green Version]
  61. Carrivick, J.; Smith, M.; Quincey, D. Structure from Motion in the Geosciences; John Wiley & Sons, Ltd.: Hoboken, NJ, USA, 2016. [Google Scholar]
  62. Smith, M.; Carrivick, J.; Quincey, D. Structure from motion photogrammetry in physical geography. Prog. Phys. Geogr. Earth Environ. 2015, 40, 247–275. [Google Scholar] [CrossRef]
  63. James, M.R.; Robson, S. Straightforward reconstruction of 3D surfaces and topography with a camera: Accuracy and geoscience application. J. Geophys. Res. Earth Surf. 2012, 117, 1–17. [Google Scholar] [CrossRef]
  64. Verhoeven, G.; Doneus, M.; Briese, C.; Vermeulen, F. Mapping by matching: A computer vision-based approach to fast and accurate georeferencing of archaeological aerial photographs. J. Archaeol. Sci. 2012, 39, 2060–2070. [Google Scholar] [CrossRef]
  65. Westoby, M.; Brasington, J.; Glasser, N.F.; Hambrey, M.; Reynolds, J. ‘Structure-from-Motion’ photogrammetry: A low-cost, effective tool for geoscience applications. Geomorphology 2012, 179, 300–314. [Google Scholar] [CrossRef]
  66. Snavely, N.; Seitz, S.M.; Szeliski, R. Modeling the world from internet photo collections. Int. J. Comput. Vis. 2007, 80, 189–210. [Google Scholar] [CrossRef]
  67. Lowe, D.G. Distinctive image features from scale-invariant keypoints. Int. J. Comput. Vis. 2004, 60, 91–110. [Google Scholar] [CrossRef]
  68. Tareen, S.A.K.; Saleem, Z. A comparative analysis of SIFT, SURF, KAZE, AKAZE, ORB, and BRISK. In Proceedings of the 2018 IEEE International Conference on Computing, Mathematics and Engineering Technologies (iCoMET), Sukkur, Pakistan, 3–4 March 2018; IEEE: Piscataway, NJ, USA, 2018. [Google Scholar] [CrossRef]
  69. Wu, M. Research on optimization of image fast feature point matching algorithm. EURASIP J. Image Video Process. 2018, 2018. [Google Scholar] [CrossRef]
  70. Işık, Ş. A Comparative evaluation of well-known feature detectors and descriptors. Int. J. Appl. Math. Electron. Comput. 2014, 3, 1–6. [Google Scholar] [CrossRef]
  71. Strecha, C.; von Hansen, W.; Gool, L.V.; Fua, P.; Thoennessen, U. On benchmarking camera calibration and multi-view stereo for high resolution imagery. In Proceedings of the 2008 IEEE Conference on Computer Vision and Pattern Recognition, Anchorage, AK, USA, 24–26 June 2008; IEEE: Piscataway, NJ, USA, 2008. [Google Scholar] [CrossRef]
  72. Johnson, K.; Nissen, E.; Saripalli, S.; Arrowsmith, J.R.; McGarey, P.; Scharer, K.; Williams, P.; Blisniuk, K. Rapid mapping of ultrafine fault zone topography with structure from motion. Geosphere 2014, 10, 969–986. [Google Scholar] [CrossRef]
  73. Oliensis, J. A critique of structure-from-motion algorithms. Comput. Vis. Image Underst. 2000, 80, 172–214. [Google Scholar] [CrossRef]
  74. Wenger, S.M.B. Evaluation of SfM against Traditional Stereophotogrammetry and Lidar Techniques for DSM Creation in Various Land Cover Areas. Ph.D. Thesis, Stellenbosch University, Stellenbosch, South Africa, December 2016. [Google Scholar]
  75. Jenson, S.K. Applications of hydrologic information automatically extracted from digital elevation models. Hydrolog. Process. 1991, 5, 31–44. [Google Scholar] [CrossRef]
  76. Kenward, T. Effects of digital elevation model accuracy on hydrologic predictions. Remote Sens. Environ. 2000, 74, 432–444. [Google Scholar] [CrossRef]
  77. Bakuła, K.; Salach, A.; Wziątek, D.Z.; Ostrowski, W.; Górski, K.; Kurczyński, Z. Evaluation of the accuracy of lidar data acquired using a UAS for levee monitoring: preliminary results. Int. J. Remote Sens. 2017, 38, 2921–2937. [Google Scholar] [CrossRef]
  78. Thiel, C.; Schmullius, C. Comparison of UAV photograph-based and airborne lidarbased point clouds over forest from a forestry application perspective. Int. J. Remote Sens. 2017, 38, 2411–2426. [Google Scholar] [CrossRef]
  79. Wallace, L.; Lucieer, A.; Malenovskỳ, Z.; Turner, D.; Vopěnka, P. Assessment of forest structure using two UAV techniques: A comparison of airborne laser scanning and structure from motion (SfM) point clouds. Forests 2016, 7, 62. [Google Scholar] [CrossRef]
  80. Fitzpatrick, B.P. Unmanned Aerial Systems for Surveying and Mapping: Cost Comparison of UAS versus Traditional Methods of Data Acquisition. Ph.D. Thesis, University of Southern California, Los Angeles, CA, USA, August 2016. [Google Scholar]
  81. Whitehead, K.; Hugenholtz, C.H. Remote sensing of the environment with small unmanned aircraft systems (UASs), part 1: A review of progress and challenges. J. Unmanned Veh. Syst. 2014, 2, 69–85. [Google Scholar] [CrossRef]
  82. Federal Aviation Administration. Summary of Small Unmanned Aircraft Rule (Part 107); Federal Aviation Administration: Washington, DC, USA, 2016.
  83. Federal Aviation Administration. No Drone Zone; Federal Aviation Administration: Washington, DC, USA, 2016.
  84. Federal Aviation Administration. Part 107 Waivers; Federal Aviation Administration: Washington, DC, USA, 2016.
  85. Jiang, T.; Geller, J.; Ni, D.; Collura, J. Unmanned aircraft system traffic management: Concept of operation and system architecture. Int. J. Transp. Sci. Technol. 2016, 5, 123–135. [Google Scholar] [CrossRef]
  86. Askelson, M.; Cathey, H. Small UAS Detect and Avoid Requirements Necessary for Limited Beyond Visual Line of Sight (BVLOS) Operations; Technical Report; ASSURE: Starkville, MS, USA, 2017. [Google Scholar]
  87. Federal Aviation Administration. Integration of Civil Unmanned Aircraft Systems (UAS) in the National Airspace System (NAS) Roadmap Federal Aviation Administration Second Edition; Technical Report; Federal Aviation Administration: Washington, DC, USA, 2018.
  88. Jones, T. International Commercial Drone Regulation and Drone Delivery Services; RAND: Santa Monica, CA, USA, 2017. [Google Scholar]
  89. Biggs, H.J.; Nikora, V.I.; Gibbins, C.N.; Fraser, S.; Green, D.R.; Papadopoulos, K.; Hicks, D.M. Coupling Unmanned Aerial Vehicle (UAV) and hydraulic surveys to study the geometry and spatial distribution of aquatic macrophytes. J. Ecohydraul. 2018, 3, 45–58. [Google Scholar] [CrossRef]
  90. Gray, P.; Ridge, J.; Poulin, S.; Seymour, A.; Schwantes, A.; Swenson, J.; Johnston, D. Integrating drone imagery into high resolution satellite remote sensing assessments of estuarine environments. Remote Sens. 2018, 10, 1257. [Google Scholar] [CrossRef]
  91. Liu, T.; Abd-Elrahman, A. Multi-view object-based classification of wetland land covers using unmanned aircraft system images. Remote Sens. Environ. 2018, 216, 122–138. [Google Scholar] [CrossRef]
  92. Pande-Chhetri, R.; Abd-Elrahman, A.; Liu, T.; Morton, J.; Wilhelm, V.L. Object-based classification of wetland vegetation using very high-resolution unmanned air system imagery. Eur. J. Remote Sens. 2017, 50, 564–576. [Google Scholar] [CrossRef] [Green Version]
  93. Wan, H.; Wang, Q.; Jiang, D.; Fu, J.; Yang, Y.; Liu, X. Monitoring the invasion of Spartina alterniflora using very high resolution unmanned aerial vehicle imagery in Beihai, Guangxi (China). Sci. World J. 2014, 2014, 1–7. [Google Scholar] [CrossRef]
  94. Li, Q.S.; Wong, F.K.; Fung, T. Assessing the utility of UAV-borne hyperspectral image and photogrammetry derived 3D data for wetland species distribution quick mapping. Int. Arch. Photogramm. Remote Sens. Spat. Inf. Sci. ISPRS Arch. 2017, 42, 209–215. [Google Scholar] [CrossRef]
  95. Sankey, T.T.; McVay, J.; Swetnam, T.L.; McClaran, M.P.; Heilman, P.; Nichols, M. UAV hyperspectral and lidar data and their fusion for arid and semi-arid land vegetation monitoring. Remote Sens. Ecol. Conserv. 2017, 4, 20–33. [Google Scholar] [CrossRef]
  96. Wigmore, O.; Mark, B.; McKenzie, J.; Baraer, M.; Lautz, L. Sub-metre mapping of surface soil moisture in proglacial valleys of the tropical Andes using a multispectral unmanned aerial vehicle. Remote Sens. Environ. 2019, 222, 104–118. [Google Scholar] [CrossRef]
  97. Berni, J.A.J.; Zarco-Tejada, P.J.; Suarez, L.; Fereres, E. Thermal and narrowband multispectral remote sensing for vegetation monitoring from an unmanned aerial vehicle. IEEE Trans. Geosci. Remote Sens. 2009, 47, 722–738. [Google Scholar] [CrossRef]
  98. Chaplot, V. Impact of spatial input data resolution on hydrological and erosion modeling: Recommendations from a global assessment. Phys. Chem. Earth Parts A/B/C 2014, 67–69, 23–35. [Google Scholar] [CrossRef]
  99. Zhang, P.; Liu, R.; Bao, Y.; Wang, J.; Yu, W.; Shen, Z. Uncertainty of SWAT model at different DEM resolutions in a large mountainous watershed. Water Res. 2014, 53, 132–144. [Google Scholar] [CrossRef]
  100. Shrestha, R.; Tachikawa, Y.; Takara, K. Input data resolution analysis for distributed hydrological modeling. J. Hydrol. 2006, 319, 36–50. [Google Scholar] [CrossRef]
  101. Horritt, M.; Bates, P. Effects of spatial resolution on a raster based model of flood flow. J. Hydrol. 2001, 253, 239–249. [Google Scholar] [CrossRef]
  102. Molnár, D.K.; Julien, P.Y. Grid-size effects on surface runoff modeling. J. Hydrol. Eng. 2000, 5, 8–16. [Google Scholar] [CrossRef]
  103. Bruneau, P.; Gascuel-Odoux, C.; Robin, P.; Merot, P.; Beven, K. Sensitivity to space and time resolution of a hydrological model using digital elevation data. Hydrol. Process. 1995, 9, 69–81. [Google Scholar] [CrossRef]
  104. Vivoni, E.R.; Rango, A.; Anderson, C.A.; Pierini, N.A.; Schreiner-McGraw, A.P.; Saripalli, S.; Laliberte, A.S. Ecohydrology with unmanned aerial vehicles. Ecosphere 2014, 5, art130. [Google Scholar] [CrossRef] [Green Version]
  105. Petrasova, A.; Mitasova, H.; Petras, V.; Jeziorska, J. Fusion of high-resolution DEMs for water flow modeling. Open Geospat. Data Softw. Stand. 2017, 2. [Google Scholar] [CrossRef]
  106. Tang, Q.; Schilling, O.S.; Kurtz, W.; Brunner, P.; Vereecken, H.; Franssen, H.J.H. Simulating flood-induced riverbed transience using unmanned aerial vehicles, physically based hydrological modeling, and the ensemble Kalman filter. Water Resour. Res. 2018, 54, 9342–9363. [Google Scholar] [CrossRef]
  107. Boon, M.A.; Greenfield, R.; Tesfamichael, S. Wetland assessment using unmanned aerial vehicle (UAV) photogrammetry. Int. Arch. Photogramm. Remote Sens. Spat. Inf. Sci. ISPRS Arch. 2016, 41, 781–788. [Google Scholar] [CrossRef]
  108. Jeziorska, J.; Mitasova, H.; Petrasova, A.; Petras, V.; Divakaran, D.; Zajkowski, T. Overland flow analysis using time series of sUAS derived data. ISPRS Ann. Photogramm. Remote Sens. Spat. Inf. Sci. 2016, III-8, 159–166. [Google Scholar] [CrossRef]
  109. Capolupo, A.; Pindozzi, S.; Okello, C.; Fiorentino, N.; Boccia, L. Photogrammetry for environmental monitoring: The use of drones and hydrological models for detection of soil contaminated by copper. Sci. Total Environ. 2015, 514, 298–306. [Google Scholar] [CrossRef]
  110. Tamminga, A.; Hugenholtz, C.; Eaton, B.; Lapointe, M. Hyperspatial remote sensing of channel reach morphology and hydraulic fish habitat using an unmanned aerial vehicle (UAV): A first assessment in the context of river research and management. River Res. Appl. 2014, 31, 379–391. [Google Scholar] [CrossRef]
  111. Zarco-Tejada, P.; González-Dugo, V.; Berni, J. Fluorescence, temperature and narrow-band indices acquired from a UAV platform for water stress detection using a micro-hyperspectral imager and a thermal camera. Remote Sens. Environ. 2012, 117, 322–337. [Google Scholar] [CrossRef]
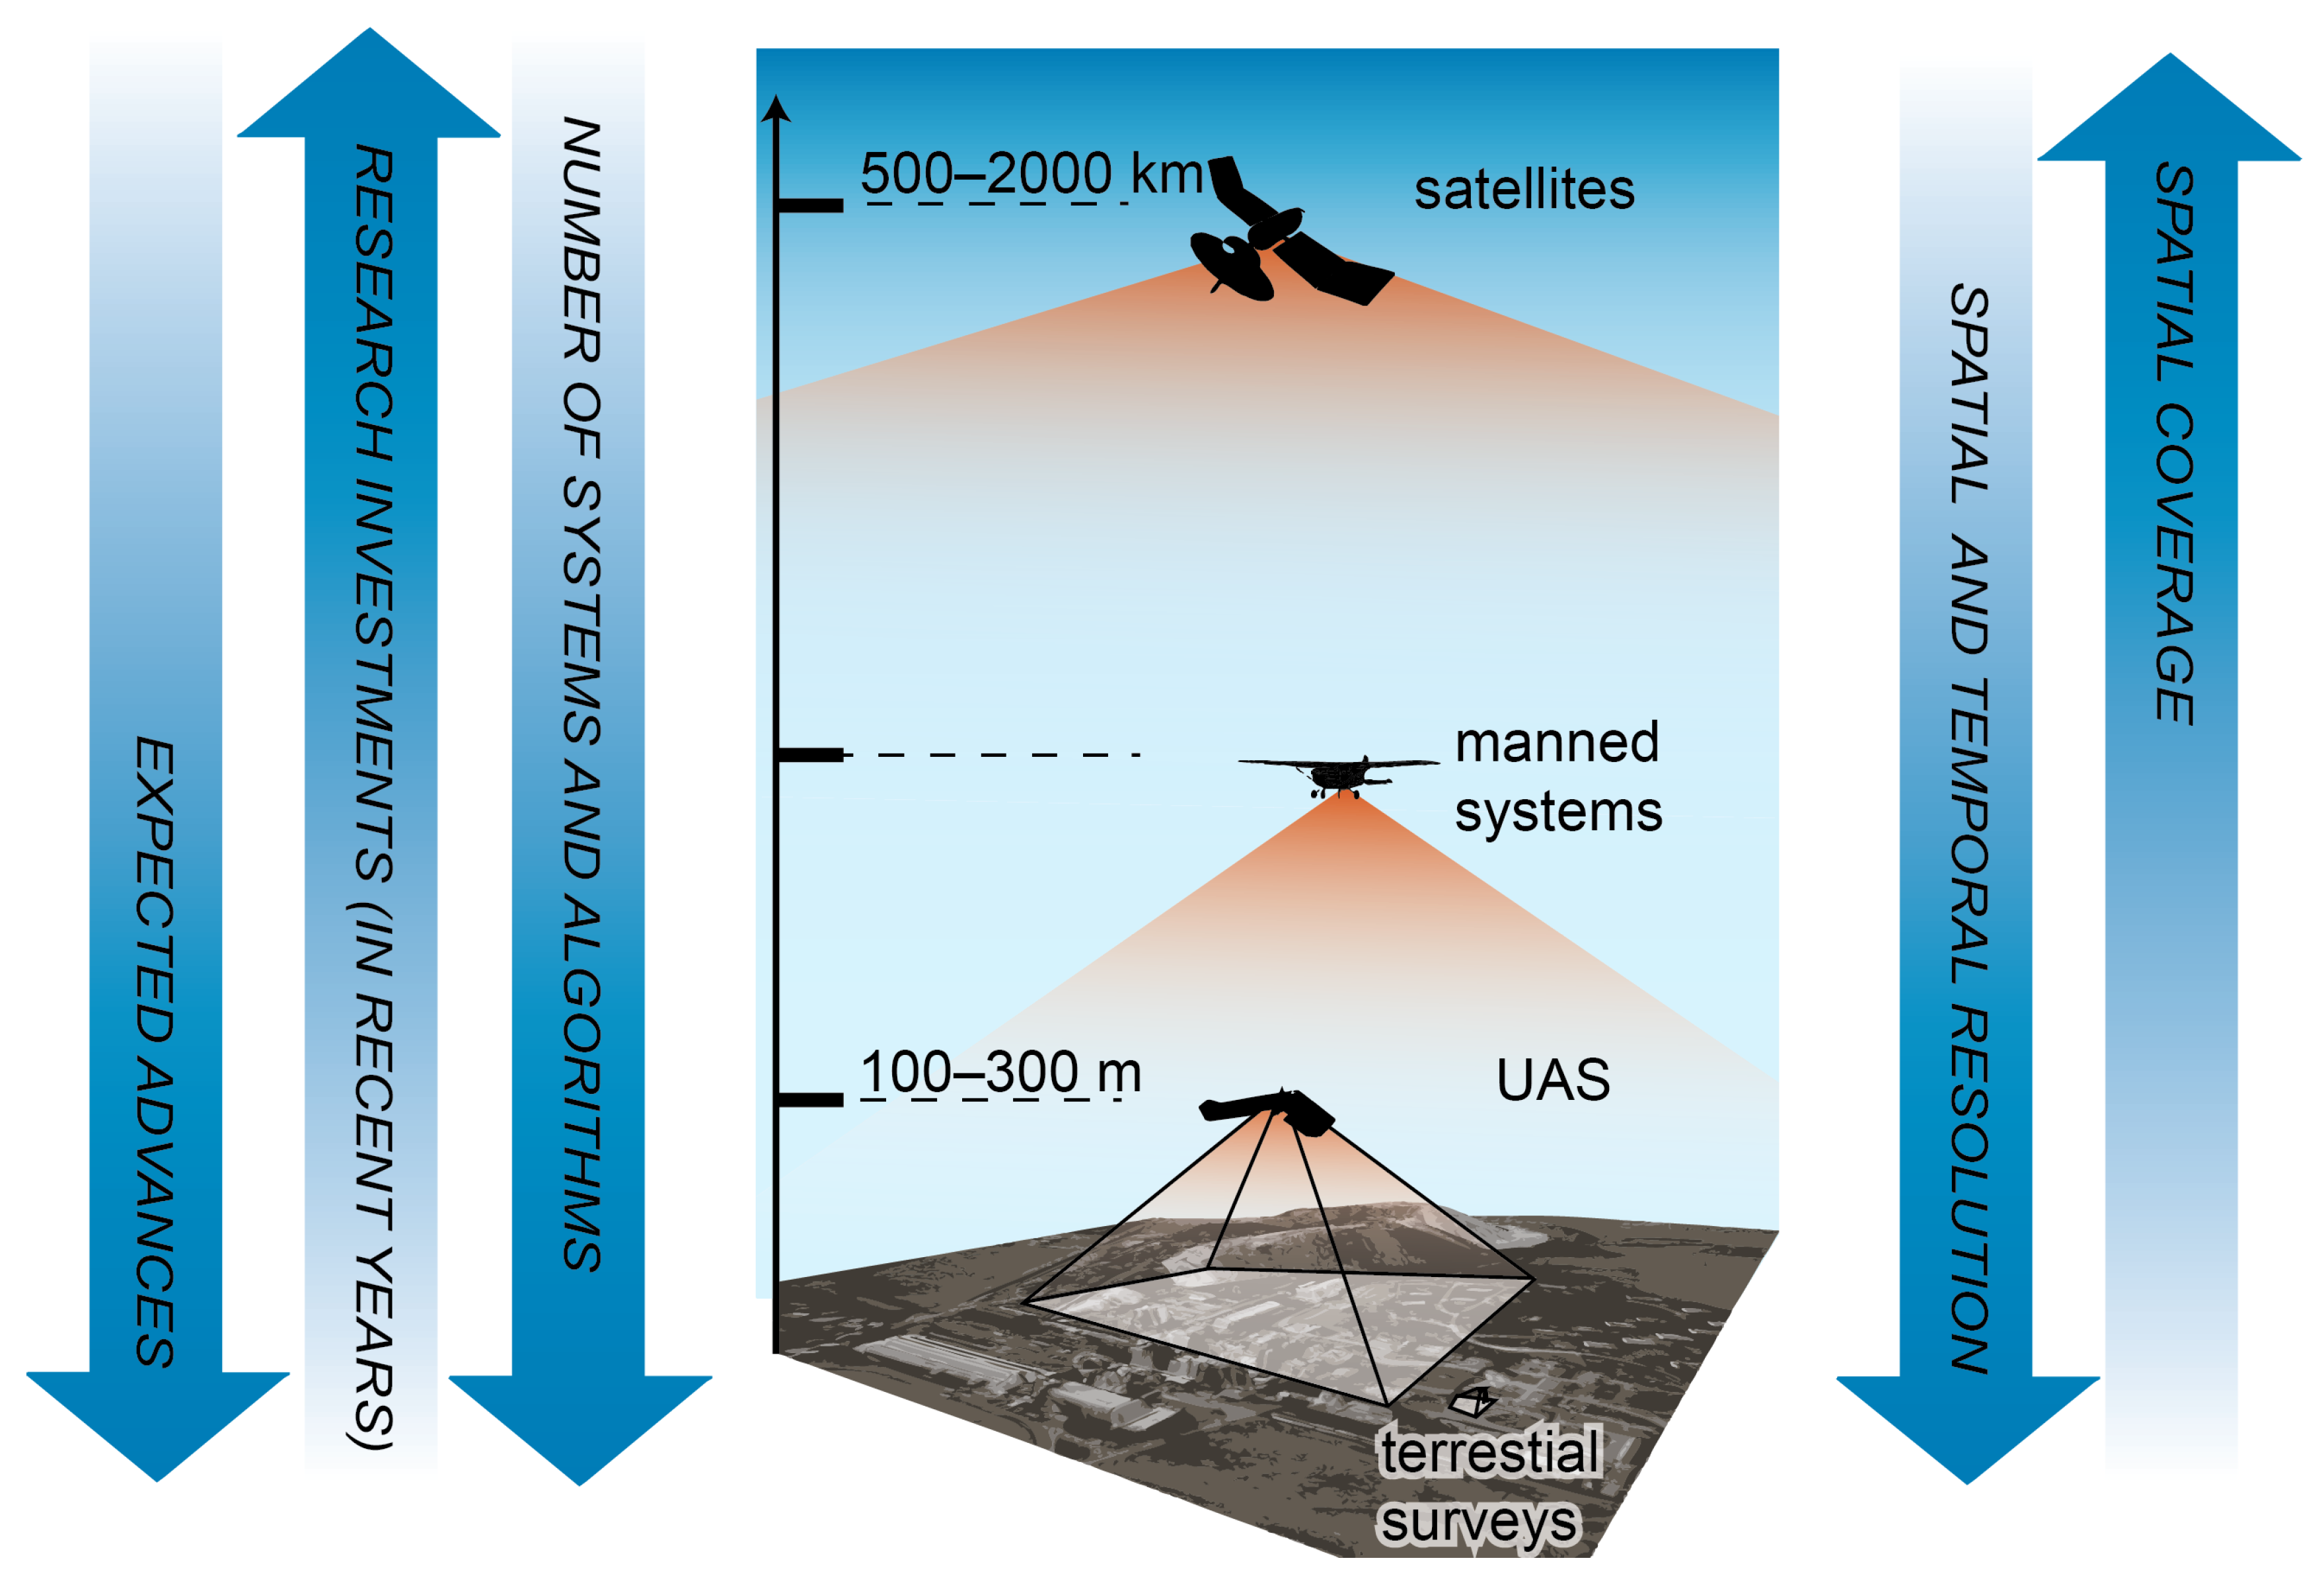
Figure 1. Comparison of the most important aspects of spatial data acquisition, after [5].
Remotesensing 11 01997 g001
Figure 2. General architecture of an unmanned aerial system.
Remotesensing 11 01997 g002
Figure 3. Classification of UAS according to the Department of Defence.
Remotesensing 11 01997 g003
Figure 4. Examples of fixed wing UAS: (A) Precision Hawk Lancaster 5; (B) Trimble UX5; (C1) QuestUAV DATAhawk; (C2) QuestUAV DATAhawk PPK; (D1) senseFly eBee; (D2) senseFly eBee Plus.
Remotesensing 11 01997 g004
Figure 5. Some commonly used UAS Visual-Band cameras, listed in Table 3: (A) DJI Zenmuse X7; (B) MAPIR Survey3 (also avaliable in multispectral option); (C) PhaseOne iXU-RS 1000; (D) Sony ILCE-QX1; (E) senseFly S.O.D.A.
Remotesensing 11 01997 g005
Figure 6. An RGB imagery of wetland area captured by Sony NEX-5T camera mounted on Trimble UX5 (see Figure 4). Flight altitude—135 m, data captured 17 February 2017.
Remotesensing 11 01997 g006
Figure 7. Processed RGB imagery using Structure from Motion (SfM) techniques. Visible lack of data below the canopy on dense point cloud (A) and resulting misrepresentation of the canopy structure on a 3D model (B) and textured 3D model (C).
Remotesensing 11 01997 g007
Figure 8. Some commonly used UAS multispectral cameras: (A) Buzzard Camera six; (B) MicaSense RedEdge; (C) Parrot Sequoia+; (D) Sentera Quad; (E) Tetracam ACD Micro; (F) Tetracam MiniMCA6.
Remotesensing 11 01997 g008
Figure 9. Currently available thermal cameras, listed in Table 6: (A) FLIR T450sc; (B) FLIR Thermovision A40M; (C) ICI 7640 P-Series; (D) Optris PI400; (E) Pearleye LWIR; (F) Thermoteknix MIRICLE 370 K; (G) Xenix Gobi-384 (Scientific).
Remotesensing 11 01997 g009
Figure 10. Some commonly used lidar sensors for UAS, listed in Table 7: (A) Riegl VUX-1UAV; (B) Riegl VUX-240; (C) Routescene UAV LidarPod; (D) Velodyne HDL-32E; (E) Velodyne PUC VLP-16; (F) YellowScan Mapper II; (G) YellowScan Surveyor.
Remotesensing 11 01997 g010
Figure 11. Schematic overview of a photogrammetric flight with minimum overlap values.
Remotesensing 11 01997 g011
Figure 12. Comparison of georeferencing based on GCPs and imagery geotags.
Remotesensing 11 01997 g012
Figure 13. Achievable absolute accuracy using Real Time Kinematics or Post Processing Kinematics-enabled and Standalone UAS.
Remotesensing 11 01997 g013
Figure 14. A schematic illustration of three methods of producing high-resolution digital topography: A. Airborne lidar (light detection and ranging), B. Terrestrial lidar, C. UAS-based structure from Motion (GPS—global positioning system; IMU—inertial measurement unit), modified from Johnson et al. [72].
Remotesensing 11 01997 g014
Figure 15. An example UAS image processing workflow. (A) photo capturing positions and image overlap; (B) sparse point cloud; (C) dense point cloud; (D) mesh with indicated positions of Ground Control Points; (E) Digital Surface Model; (F) orthomosaic.
Remotesensing 11 01997 g015
Figure 16. Typical acquisition and processing pipeline for RGB imagery with the use of SfM-MVS algorithms.
Remotesensing 11 01997 g016
Figure 17. Comparison of digital survey methods with regard to financial cost, maximum possible speed, spatial coverage, resolution, and accuracy; after Figure 2.7 in Carrivick et al. [61]. dGPS—differential Global Positioning System, GNSS—Global Navigation Satellite System, SfM—Structure from Motion, MVS—Multiple View Stereo. * Photogrammetry and SfM-MVS values are completely dependent on survey range.
Remotesensing 11 01997 g017
Figure 18. Flights in the visual range (VLOS), extended visual line of sight (EVLOS) and beyond visual line of sight (BVLOS).
Remotesensing 11 01997 g018
Table 1. UAS classification (according to the Department of Defence), after Qi et al. [18].
CategoryWeight
[kg]
Altitude
[feet ASL]
Radius
[km]
Endurance
[h]
Micro<2up to 200<5< 1
Mini2–20up to 3000<251–2
Small20–150up to 5000<501–5
Tactical150–600up to 10,000100–3004–15
MALE>600up to 45,000>500>24
HALE>600up to 60,000global>24
Table 2. Comparison between different features of fixed-wing and multi-rotor UAS.
Fixed WingMulti Rotor
advantageslonger flight autonomy,
larger areas covered in less time,
better control of flight parameters,
higher control of image quality,
greater stability (better aerodynamic performance
minor influence of environmental conditions),
higher flight safety (safer recovery from power loss),
greater maneuverability,
lower price,
more compact and portable,
easy to use,
higher payload capacity,
ability to hover,
small landing/takeoff zone
disadvantagesless compact,
less portable,
higher price,
challenging to fly
larger takeoff/landing site needed
shorter range,
less stable in the wind,
Table 3. Main parameters of some commonly used UAS mounted Visual-Band cameras.
Manufacturer and ModelResolution
[px]
Weight
[g]
Speed
[/s]
DJI Zenmuse X724 MP (multiple photo sizes)449up to 6000
MAPIR Survey34000 × 300050 *up to 200
PhaseOne iXU-RS 100011,608 × 8708930up to 2500
Sony ILCE-QX15456 × 3632158 *up to 4000
senseFly S.O.D.A.5472 × 3648111up to 2000
* Without lens.
Table 4. Main parameters of some commonly used multispectral cameras, after Deng et al. [26], updated.
Manufacturer and ModelResolution
[px]
Pixel Size
[µm]
Weight
[g]
Spectral Range
Central Wavelength [nm]
(Band with [nm])
Buzzard1280 × 10245.3250Blue: 500 (50)
Camera sixGreen: 550 (25)
Red: 675 (25)
NIR1: 700 (10)
NIR2: 750 (10)
NIR3: 780 (10)
MicaSense1280 × 9603.75180Blue: 475 (20)
RedEdgeGreen: 560 (20)
Red: 668 (10)
Red edge: 717 (10)
NIR: 840 (40)
Parrot1280 × 9603.7571Green: 550 (40)
Sequoia+Red: 660 (40)
Red edge: 735 (10)
NIR: 790 (40)
Sentera Quad1248 × 95037500.17RGB Red: 655 (40)
Red edge: 725 (25)
NIR: 800 (25)
Tetracam2048 × 153632000.09Green: 520–600
ADC MicroRed: 630–690
NIR: 760–900
Tetracam1280 × 10245.2700Blue: 490 (10)
MiniMCA6Green: 550 (10)
Red: 680 (10)
Red edge: 720 (10)
NIR1: 800 (10)
NIR2: 900(20)
Table 5. Main parameters of some hyperspectral sensors available for being coupled with UAS, modified from Adão et al. [27].
Manufacturer and ModelSpectral Range [nm]Number of BandsSpatial Resolution [px]Weight [g]
BaySpec OCI-UAV-1000600–10001002048 *272
Brandywine Photonics CHAI V-640350–1080256640 × 512480
HySpex VNIR-1024400–10001081024 *4000
NovaSol Alpha-SWIR microHSI900–1700160640 *1200
Quest Hyperea 660 C1400–10006601024 *1440
Resonon Pika L400–1000281900 *600
Resonon Pika NIR900–1700164320 *2700
SENOP VIS-VNIR Snapshot400–9003801010 × 1010720
SPECIM SPECIM FX17900–1700224640 *1700
Surface Optics Corp. SOC710-GX400–1000120640 *1250
XIMEA MQ022HG-IM-LS150-VISNIR470–900150+2048 × 5300
* Pushbroom length line.
Table 6. Some of the currently available thermal cameras, after Khanal et al. [29], modified.
Manufacturer and ModelResolution
[px]
Weight
[g]
Spectral Band
[µm]
FLIR T450sc320 × 240880 *7.5–13.0
FLIR Tau 640640 × 5121107.5–13.5
FLIR Thermovision A40M320 × 24014007.5–13.5
ICI 320x320 × 240150 *7.0–14.0
ICI 7640 P-Series640 × 480127.67.0–14.0
InfraTec mobileIR M4160 × 120265 *8.0–14.0
Optris PI400382 × 288320 *7.5–13.0
Pearleye LWIR640 × 480790 *8.0–14.0
Photon 320324 × 256977.5–13.5
Tamarisk 640640 × 4801218.0–14.0
Thermoteknix MIRICLE 370 K640 × 4801668.0–12.0
Xenix Gobi-384 (Scientific)384 × 288500 *8.0–14.0
* With housing and lens.
Table 7. Main parameters of some lidar sensors designed for UAS.
Manufacturer and ModelRange
[m]
Weight
[g]
Field of View [°]Laser ClassAccuracy
[mm]
Riegl VUX-1UAV3–3503500330110
Riegl VUX-2405–14003800±37.53R20
Routescene UAV LidarPod0–1001300(H)41, (V)3601(XY) 15 * (Z) 8 *
Velodyne HDL-32E80–1001300(H)360,120
(V)+10 to −30
Velodyne PUC VLP-160–100830(H)360, (V)±15130
YellowScan Mapper II10–7521001001(XY) 150 (Z) 50
YellowScan Surveyor10–601600360150
(H) Horizontal, (V) Vertical, * with RTK.
Table 8. Compilation of hydrological and environmental studies presenting their respective main objectives and conclusions and UAS type and sensors used in each case. F—fixed wing, R—rotary wing, V—visible range, T—thermal, M—multispectral, H—hyperspectral, L—lidar.
ReferenceObjectiveMain ConclusionsTypeSensor Used
FRVTMHL
Wigmore et al. [96]Map surface soil moisture content in Andean wetlands using UAS based multispectral imagery to better understand controls and impacts on its observed spatial variability within these systems.UAS can provide reliable sub-metre estimates of surface soil moisture and provide unique insights into spatially heterogeneous environments.RTM
Biggs et al. [89]Coupling UAS and hydraulic surveys to study the geometry and spatial distribution of aquatic macrophytes.The aerial surveying techniques can be used to efficiently estimate vegetation abundance, surface area blockage factor and also to visualise flow through patch mosaics, enabling targeted management of aquatic vegetation.RV
Gray et al. [90]Classification of estuarine wetlands based on WorldView-3 and RapidEye satellite imagery, using UAS imagery to assist training a Support Vector Machine.UAS can be highly effective in training and validating satellite imagery. Within a fixed budget, it allows much larger training and testing sample sizes. The UAS accuracy is similar to field-based assessments.FV
Liu and Abd-Elrahman [91]Testing approach seamlessly integrating multi-view data and object-based classification of wetland land covers.Multi-view OBIA (MV-OBIA) substantially improves the overall accuracy compared with traditional OBIA, regardless of the features used for classification and types of wetland land covers. Two window-based implementations of MV-OBIA both show potential in generating an equal if not higher overall accuracy compared with MV-OBIA at substantially reduced computational costs.FV
Sankey et al. [95]A fusion method for individual plant species identification and 3D characterization at submeter scales based on UAV lidar and hyperspectral imagery.UAS lidar characterized the individual vegetation canopy structure and bare ground elevation, whereas the hyperspectral sensor provided species-specific spectral signatures for the dominant and target species at study area. The fusion of the two different data sources performed better than either data type alone in the arid and semi-arid ecosystems with sparse vegetation.RHL
Tang et al. [106]Investigation of the effect of the spatial and temporal variability of riverbed topography and riverbed hydraulic conductivity on predictions of hydraulic states and fluxes and to test whether data assimilation based on the ensemble Kalman filter can better reproduce flood-induced changes to hydraulic states and parameters with the help of riverbed topography changes recorded with an unmanned aerial vehicle (UAV) and through-water photogrammetry.Updating of riverbed hydraulic conductivity and aquifer hydraulic conductivity based on ensemble Kalman filter and UAV-based observations of riverbed topography transience after a major flood event strongly improve predictions of postflood hydraulic states—the RMSE was reduced by 55%.FV
Li et al. [94]Assessment of the utility of UAV-borne hyperspectral image and photogrammetry derived 3D data for wetland species distribution quick mapping.The utility of UAV-borne hyperspectral and photogrammetry-derived 3D data help to characterize and monitor wetland environment. UAS offers a solution for detail species survey of wetland area in a relatively low cost of time and labor.RVH
Pande-Chhetri et al. [92]Comparison of classification methods for wetland vegetation based on UAS imagery.The use of OBIA of high spatial resolution (sub-decimeter) UAS imagery is viable for wetland vegetation mapping. Object-based classification produced higher accuracy than pixel-based classification. Discadvantage for OBIA is a great amount of time and efforts spent on scale parameter selection or post-classification refinement for an object-based approach with expert knowledge.FVH
Petrasova et al. [105]Updating lidar-based DEM with UAS-based DSMs for overland flow modeling using fast and effective technique to merge raster DEMs with different spatial extents by blending the DEMs along their overlap using distance-based weighted average.The novel approach based on spatially variable overlap width improves preservation of subtle topographic features of the high-resolution DEMs while ensuring smooth transition. The two case studies demonstrated the importance of smooth transition for modeling water flow patterns while capturing the impacts of microtopography.FV
Senthilnath et al. [19]Evaluation of performance of proposed spectral-spatial classification methods for crop region mapping and tree crown mapping of images acquired using UAV.UAV images obtained using the two UAV platforms were used to demonstrate the performance of the proposed algorithm. From the obtained results, it was concluded that the proposed spectral-spatial classification performs better and was more robust than the other algorithms in the literature.FRV
Boon et al. [107]Assessing if the use of UAV photogrammetry can be used to enhance the wetland delineation classification and WET-Health assessment.UAV photogrammetry can significantly enhance wetland delineation and classification but also be a valuable contribution to WET-Health assessment.RV
Husson et al. [20]Comparison of Manual Mapping and Automated Object-Based Image Analysis of Non-Submerged Aquatic VegetationAutomated classification of non-submerged aquatic vegetation from true-colour UAS images was feasible, indicating good potential for operative mapping of aquatic vegetation.FV
Jeziorska et al. [108](1) Assessment of the suitability of digital surface models (DSMs) produced by sUAS photogrammetry for overland flow simulation in the context of precision agriculture applications, (2) Development of a workflow for overland flow pattern simulation using high spatial and temporal resolution DSMs derived from sUAS data, and (3) Investigation of the differences between flow patterns based on sUAS derived DSMs and lidar based DEMs.(1) sUAS derived data can improve the quality of the flow pattern modeling due to the increased spatial and temporal resolution. It can capture preferential flow along tillage that is represented by capturing the changing microtopography. (2) Due to the high resolution of obtained data, vegetation significantly disrupts the flow pattern. Therefore, densely vegetated areas are not suitable for water flow modeling. (3) Overland water flow modeling based on data from airborne lidar surveys is suitable for identifying potentially vulnerable areas. sUAS based data, however, is needed to actually identify and monitor gully formation.FV
Wallace et al. [79]Investigation of the potential of UAS based airborne laser scanning and structure from motion (SfM) to measure and monitor structural properties of forests.Although airborne laser scanning is capable of providing more accurate estimates of the vertical structure of forests across the larger range of canopy densities found in this study, SfM was still found to be an adequate low-cost alternative for surveying of forest stands.RVL
Capolupo et al. [109]Introduce and test an innovative approach able to predict copper accumulation points at plot scales, using a combination of aerial photos, taken by drones, micro-rill network modelling and wetland prediction indices usually used at catchment scales.The DEM obtained with a resolution of 30 mm showed a high potential for the study of micro-rill processes and Tpographic (TI) and Clima-Topographic (CTI) indices were able to predict zones of copper accumulation at a plot scale.RV
Tamminga et al. [110]Assessing the capabilities of an UAS to characterize the channel morphology and hydraulic habitat with the goal of identifying its advantages and challenges for river research and management.By enabling dynamic linkages between geomorphic processes and aquatic habitat to be established, the advantages of UAVs make them ideally suited to river research and management.RV
Wan et al. [93]Monitoring the invasion of Spartina alterniflora using very high resolution UAS imagery.Imagery can provide details on distribution, progress, and early detection of Spartina alterniflora invasion. OBIA, object based image analysis for remote sensing detection method, can enable control measures to be more effective, accurate, and less expensive than a field survey.RVH
Zarco-Tejada et al. [111]Detect water stress based on Fluorescence, temperature and narrow-band indices acquired from a UAV platform.The research proves feasibility of thermal, narrow-band indices and fluorescence retrievals obtained from a micro-hyperspectral imagery and a light-weight thermal camera on board small UAV platforms for stress detection in a heterogeneous tree canopy where very high resolution is required.FTH
Laliberte et al. [21]Develop a relatively automated and efficient image processing workflow for deriving geometrically and radiometrically corrected multispectral imagery from a UAS for the purpose of species-level rangeland vegetation mapping.Comparison of vegetation and soil spectral responses for the airborne and WorldView-2 satellite data demonstrate potential for conducting multi-scale studies and evaluating upscaling the UAS data to larger areas.FM
Berni et al. [97]Generate quantitative remote sensing products by means of an UAS equipped with inexpensive thermal and narrowband multispectral imaging sensors and compare them to the products of traditional manned airborne sensors.The low cost and operational flexibility, along with the high spatial, spectral, and temporal resolutions provided at high turnaround times, make this platform suitable for a number of applications, where time-critical management is required. The results yielded comparable estimations, if not better, than those obtained by traditional manned airborne sensors.RTM