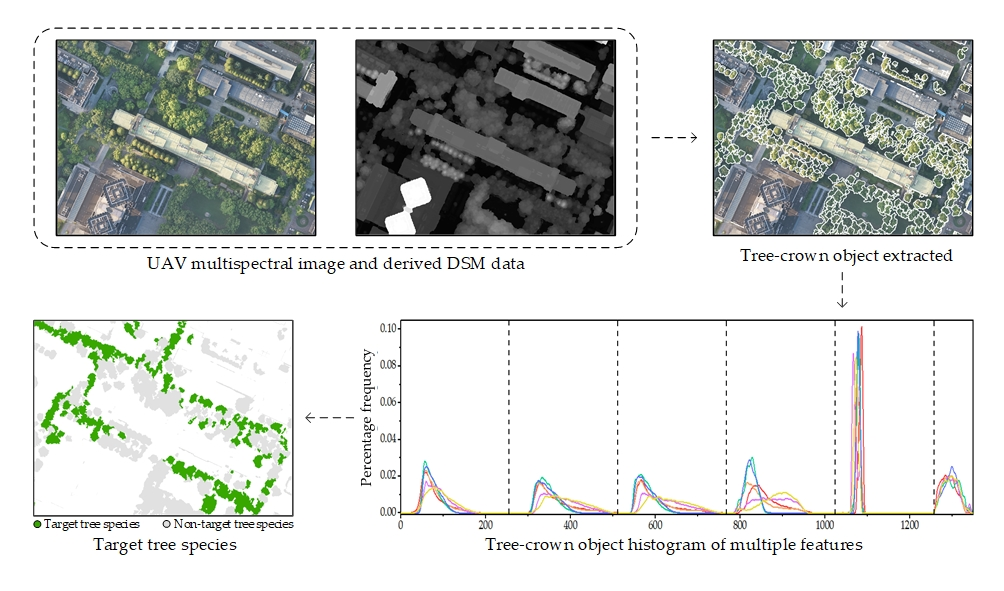
A Tree Species Mapping Method from UAV Images over Urban Area Using Similarity in Tree-Crown Object Histograms


Abstract

1. Introduction
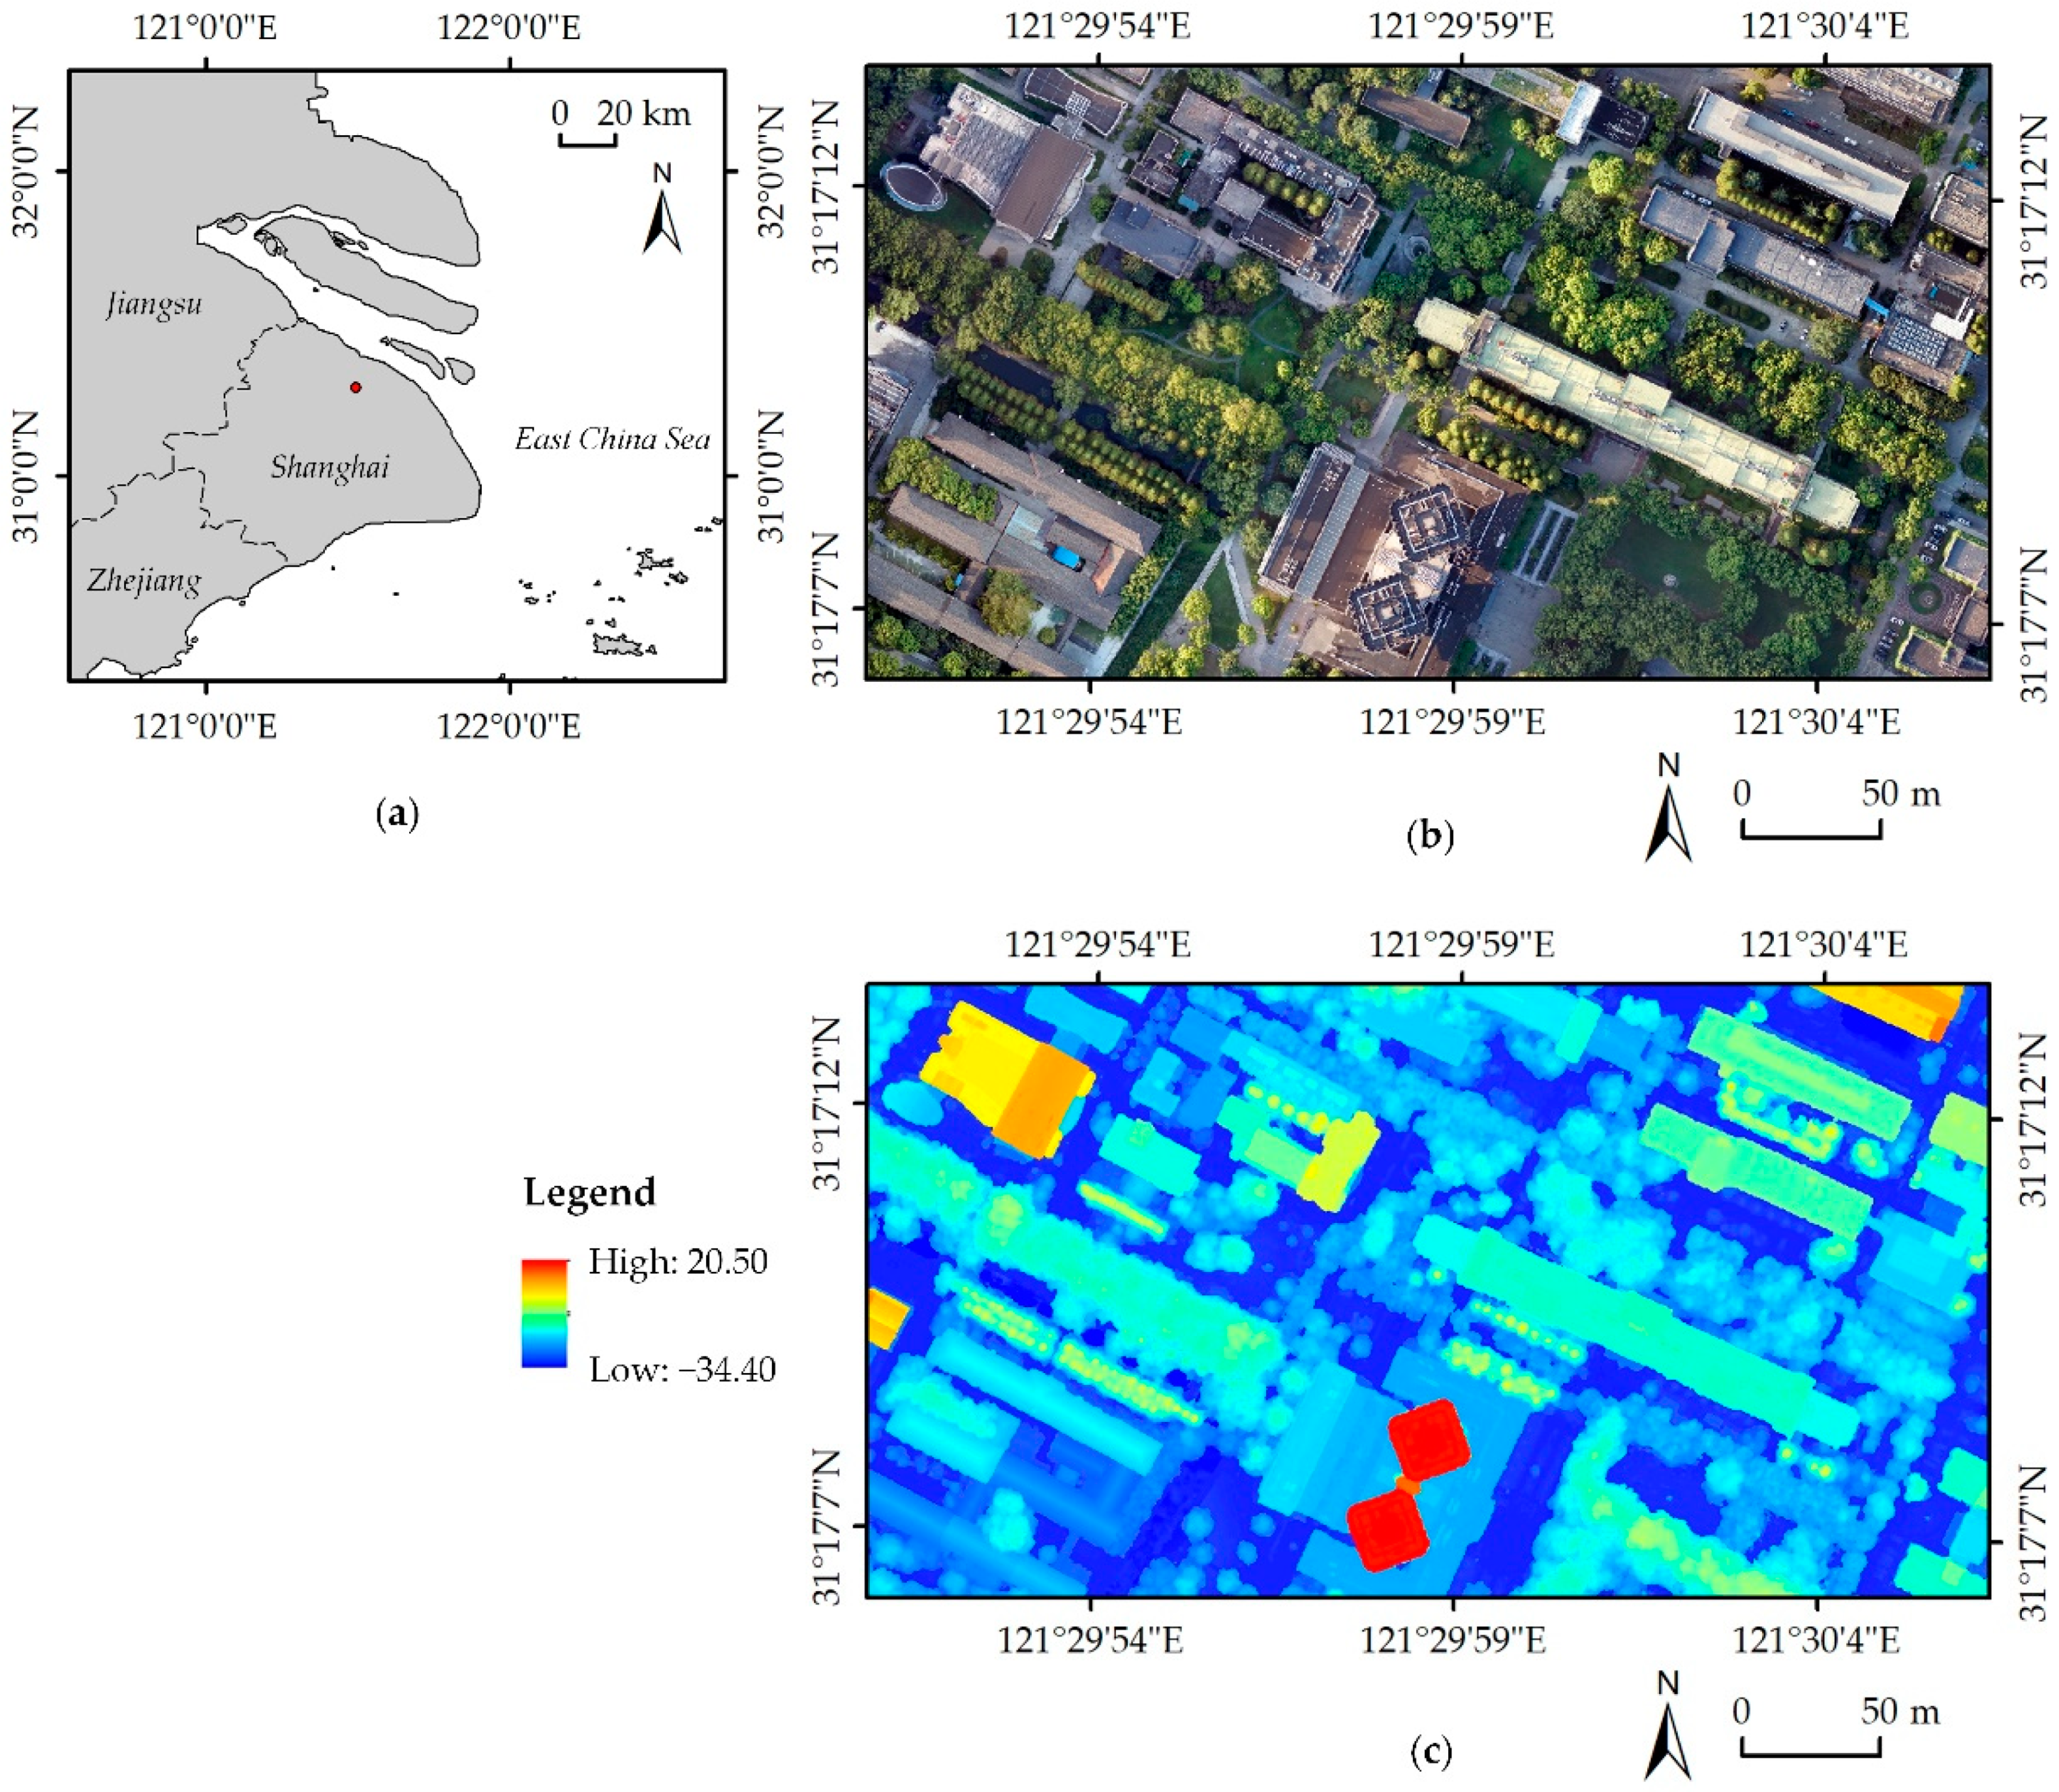
2. Study Area and Data
2.1. Study Area and Tree Species
2.2. Data
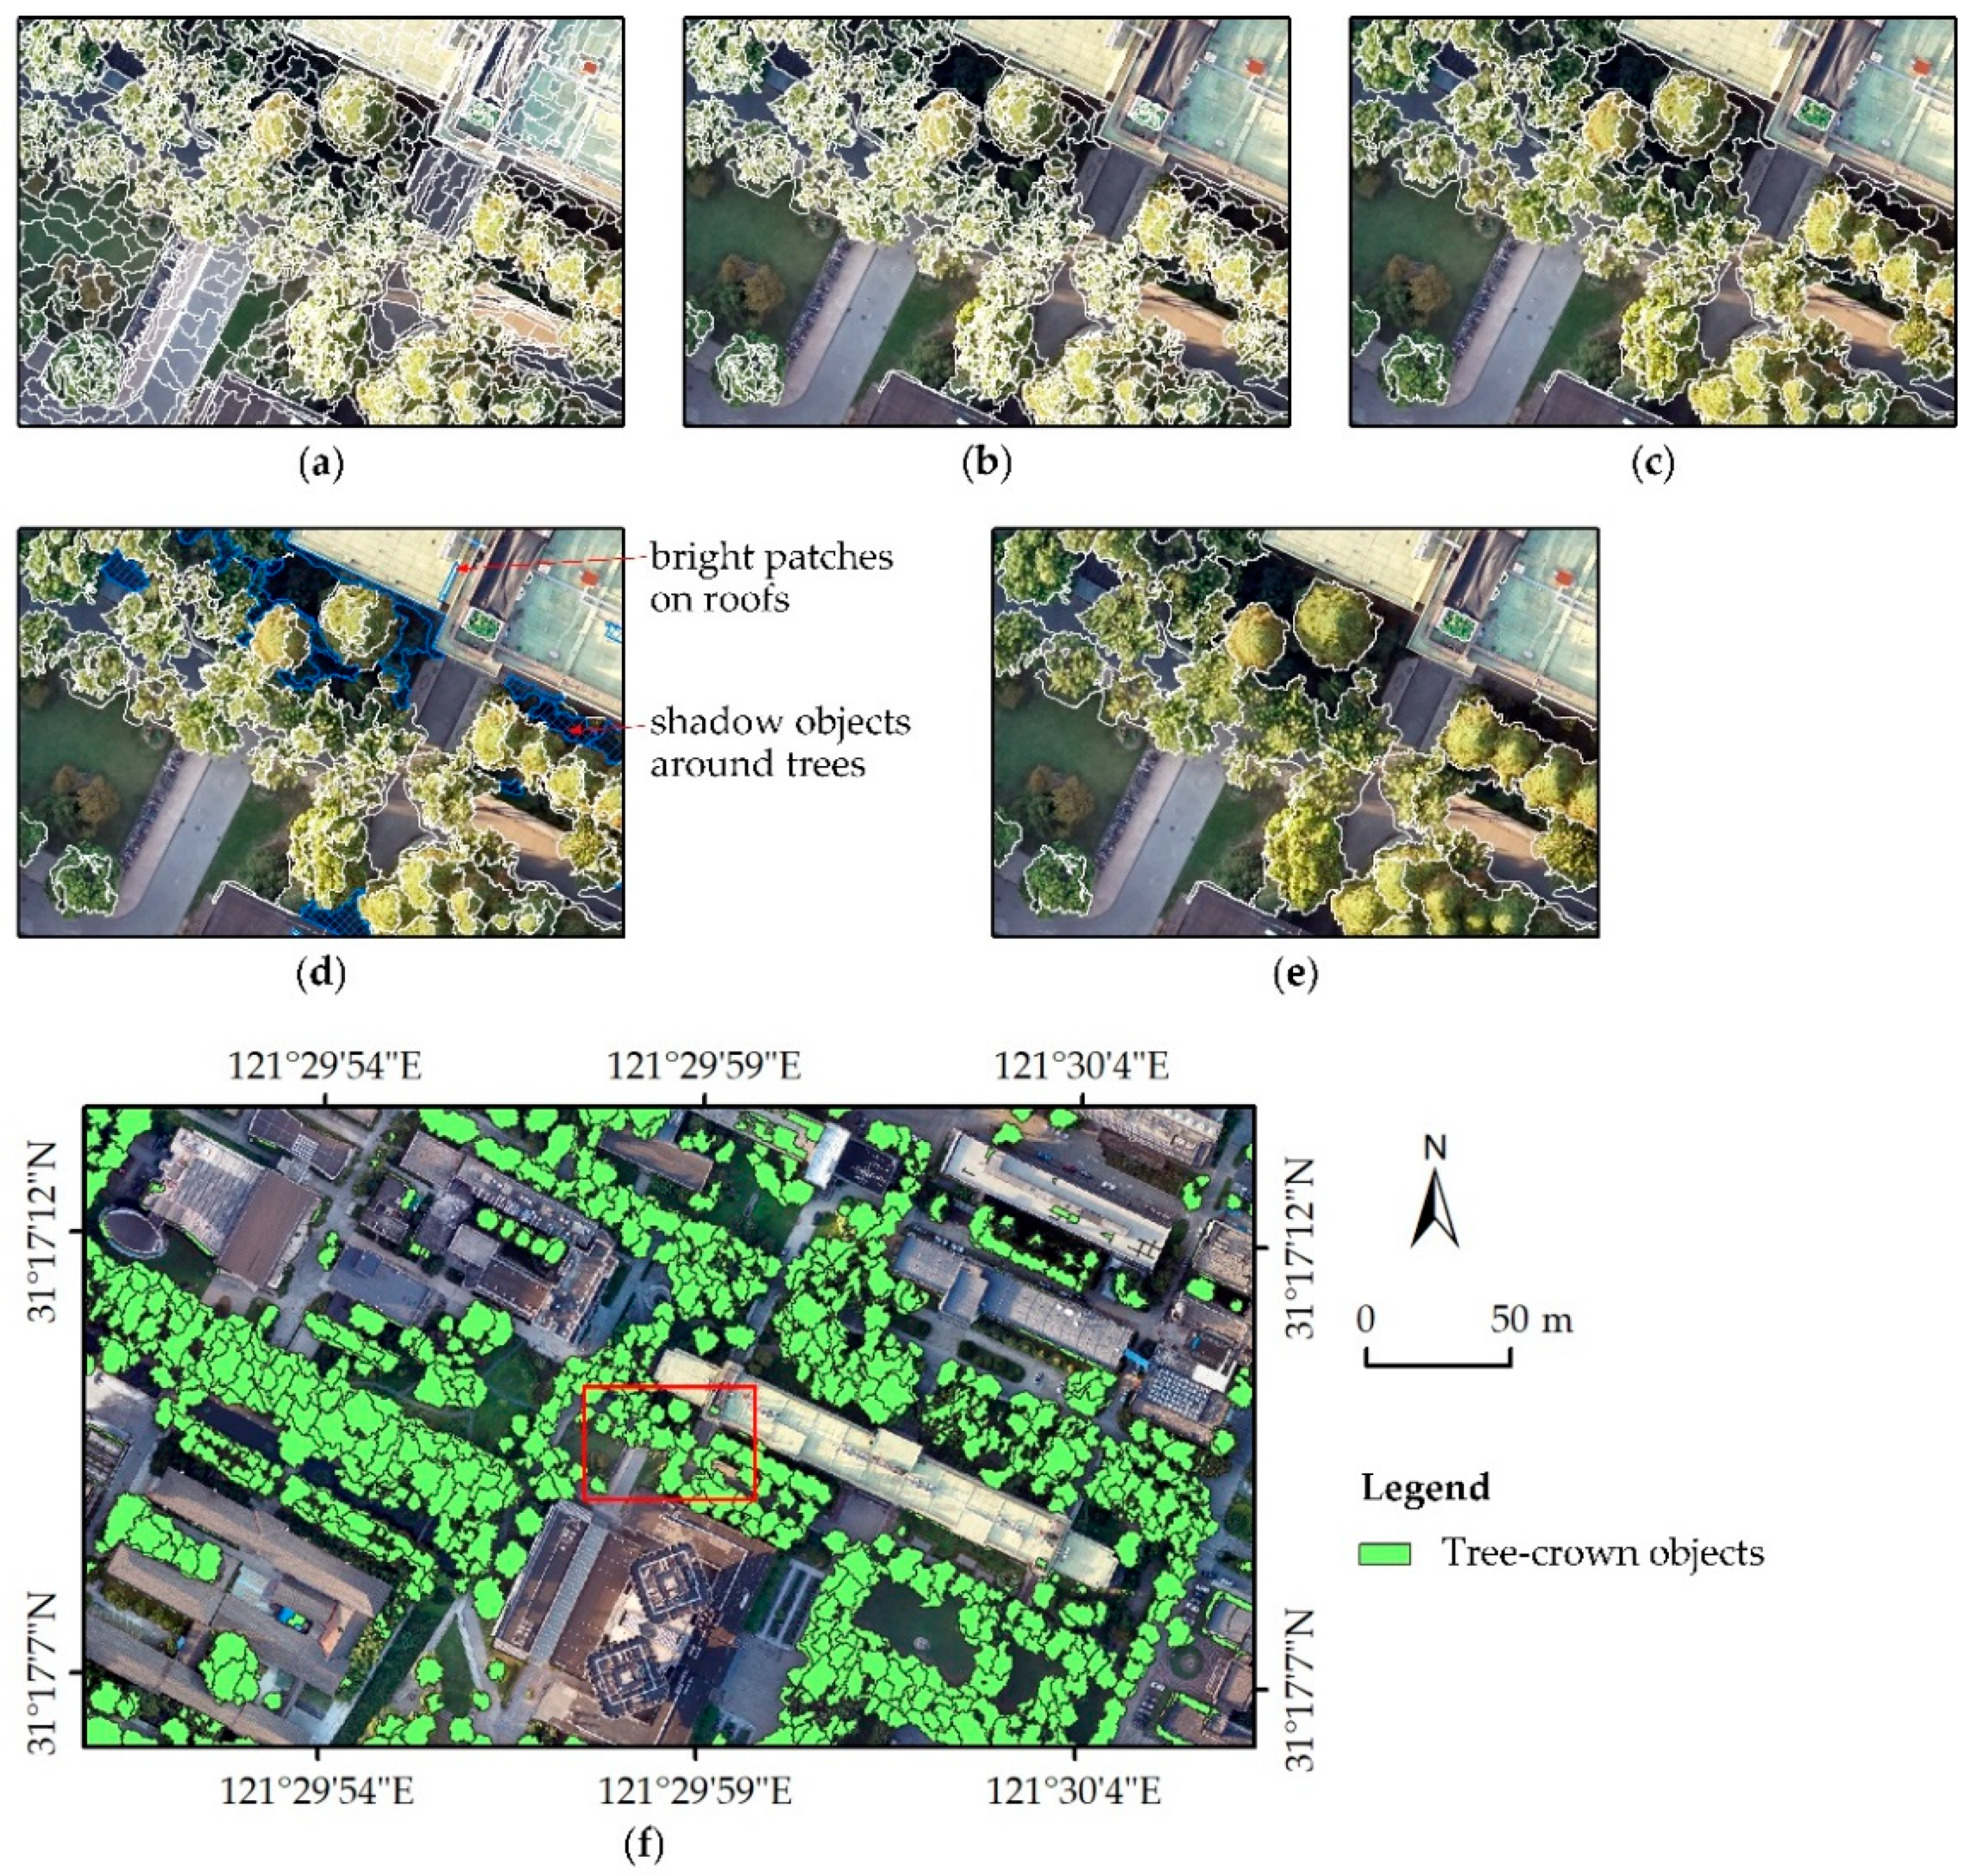
3. Methods
3.1. Tree-Crown Object Extraction
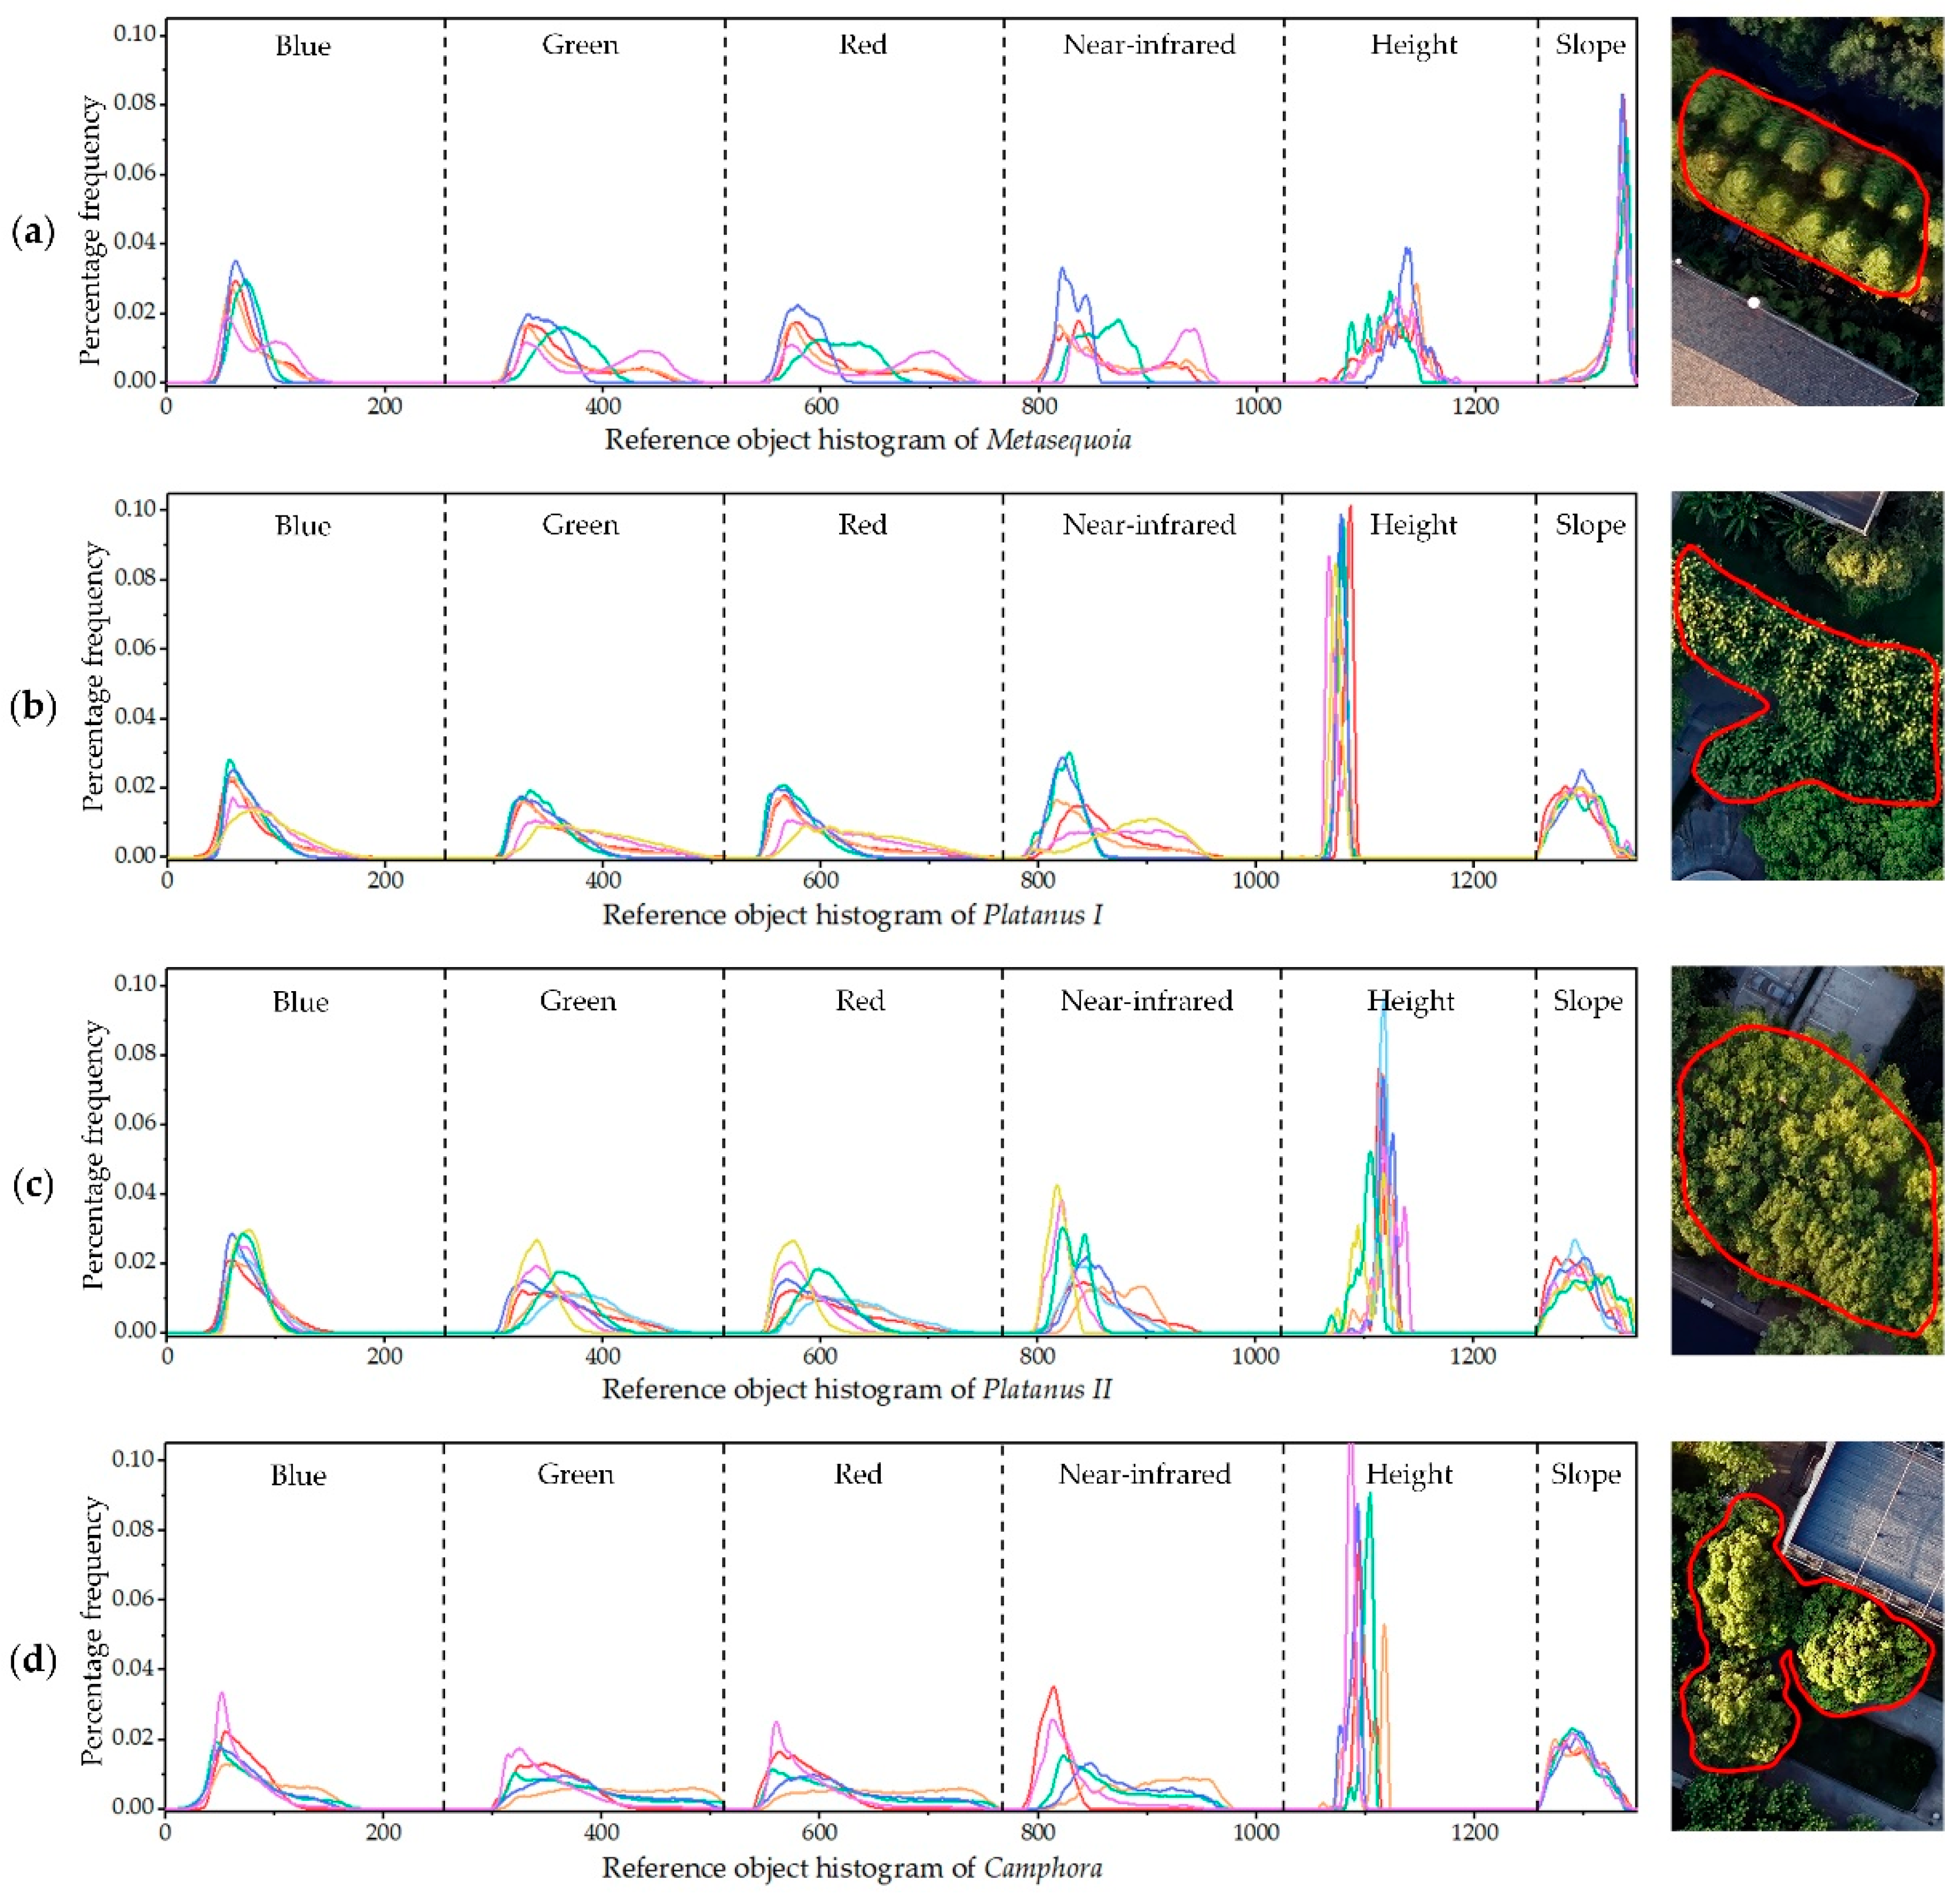
3.2. Generation of Tree-Crown Object Histogram
3.3. Histogram Similarity Comparison
3.4. Tree Species Mapping
3.5. Accuracy Assessment
4. Results
4.1. Generation of Tree-Crown Objects
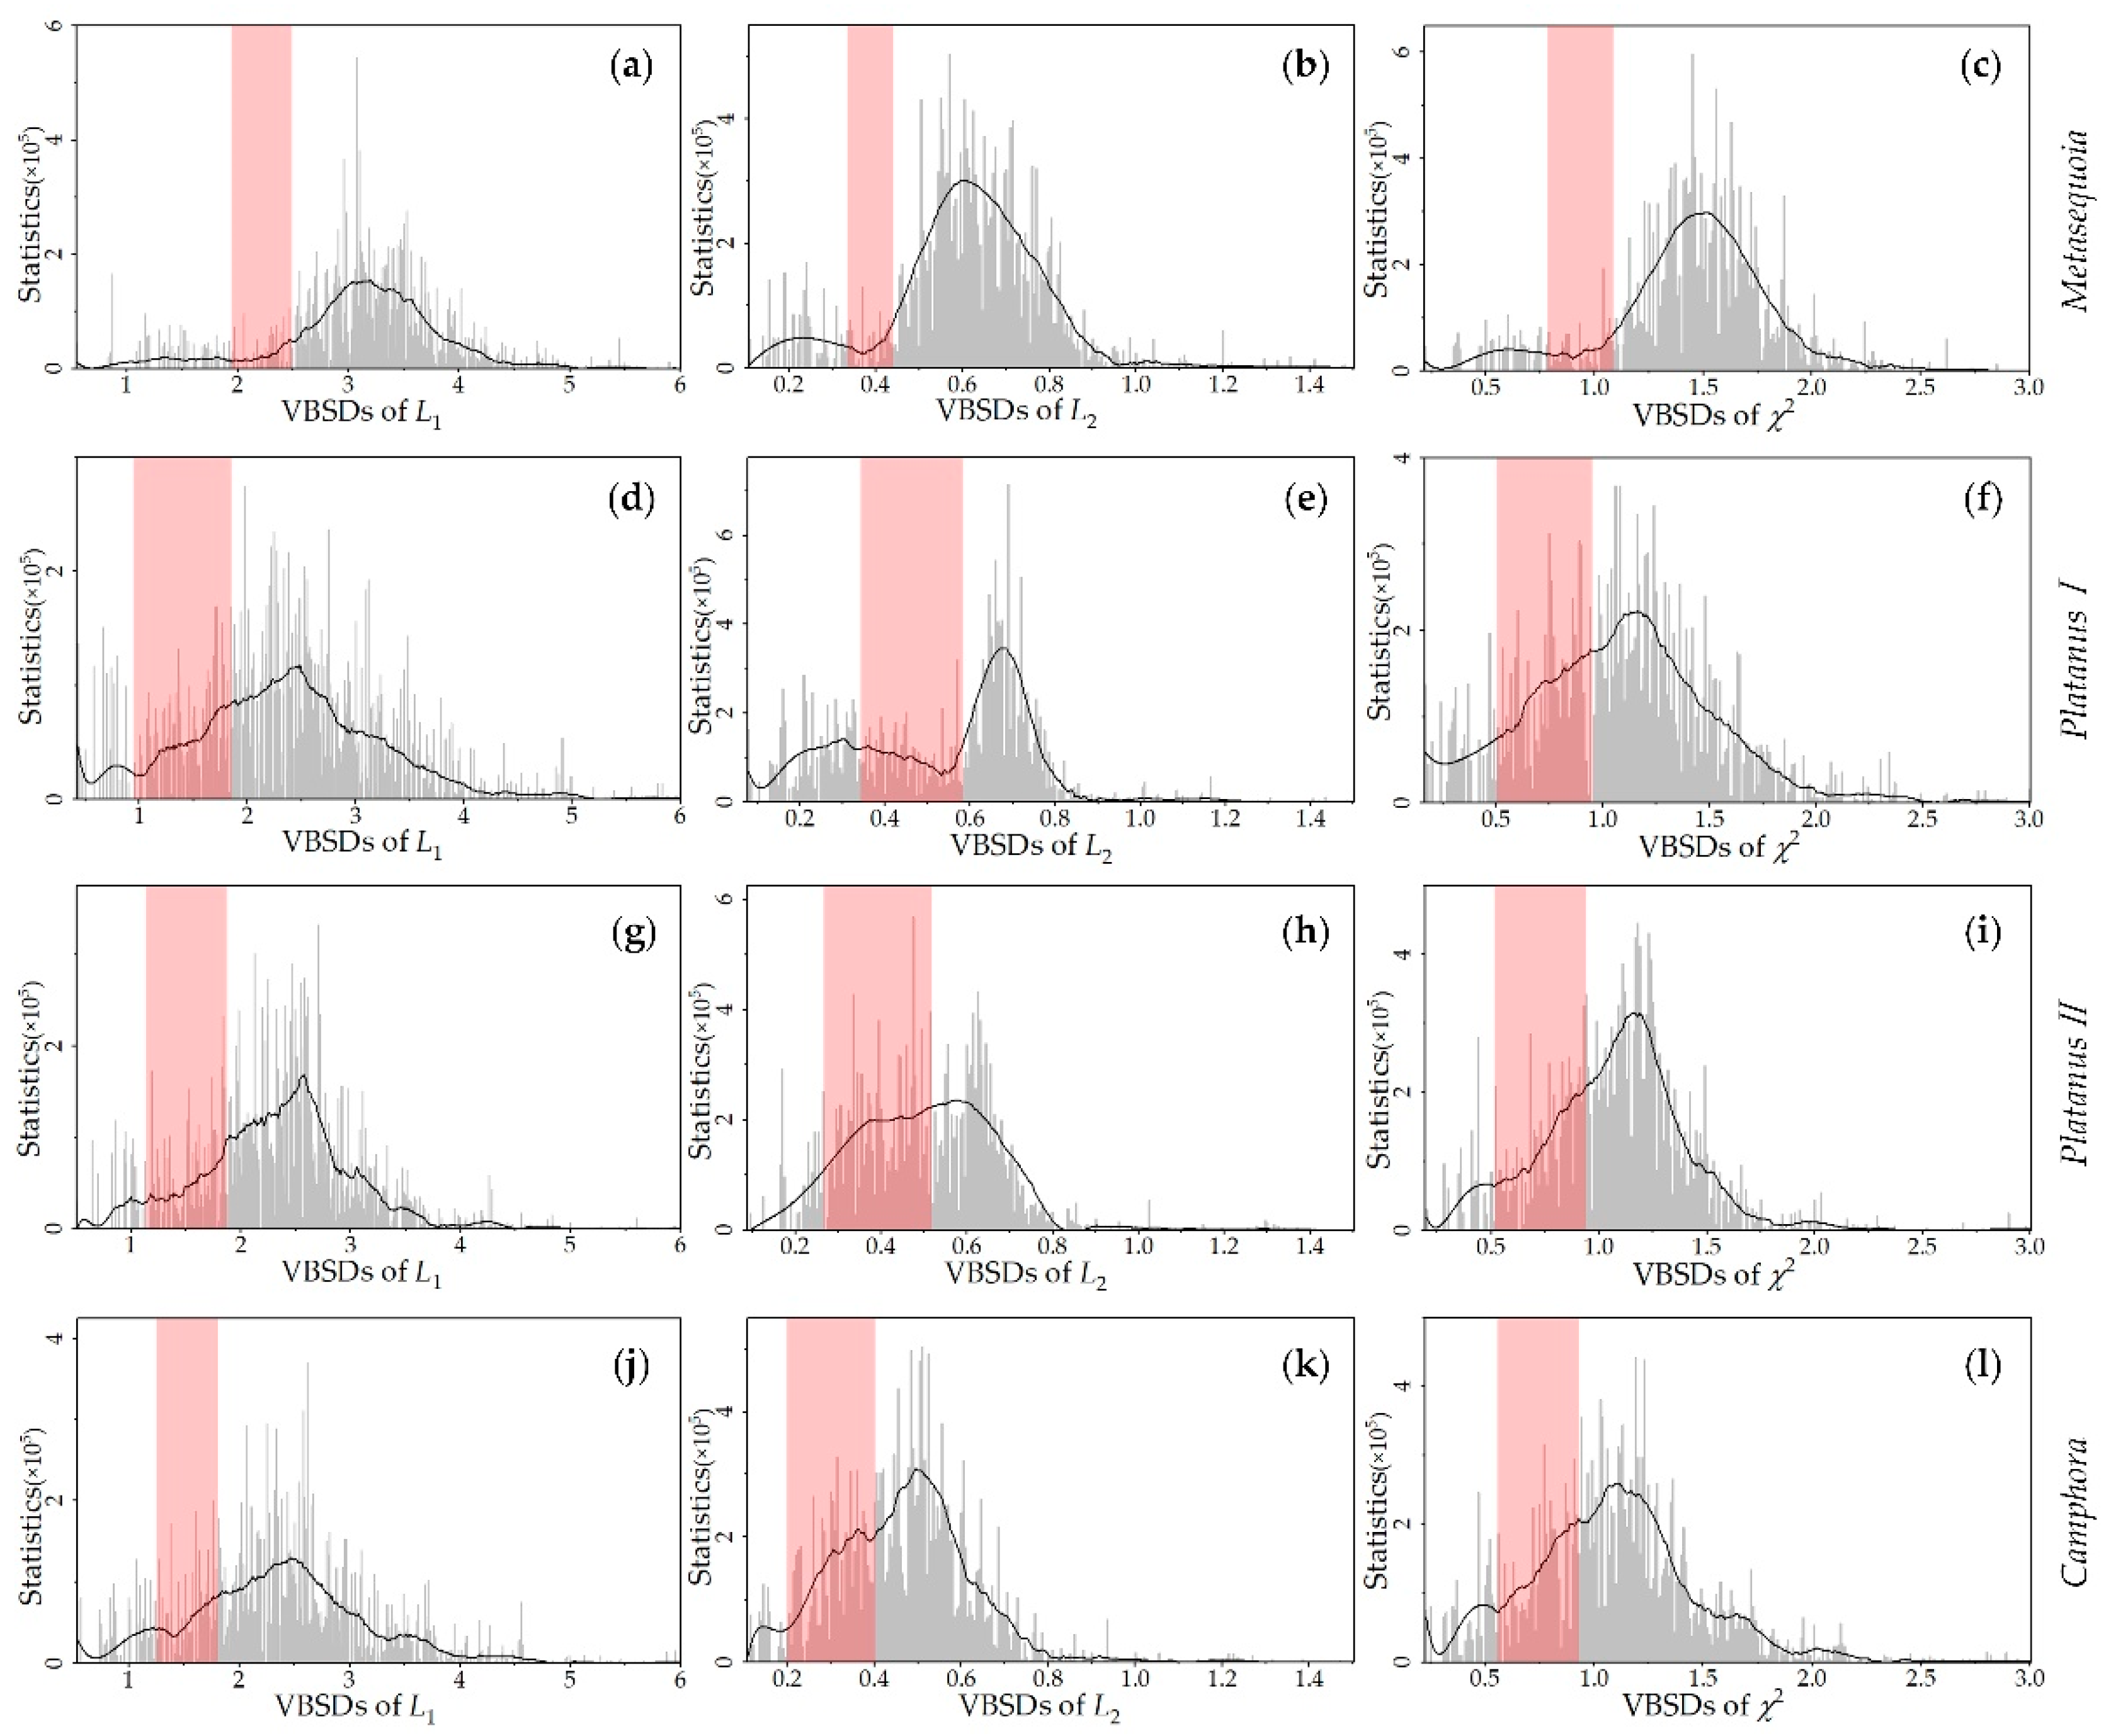
4.2. Object Histogram Analysis
4.3. Tree Species Mapping Results
5. Discussion
6. Conclusions
Author Contributions
Funding
Acknowledgments
Conflicts of Interest
References
- Dwyer, J.F.; McPherson, E.G.; Schroeder, H.W.; Rowntree, R.A. Assessing the benefits and costs of the urban forest. J. Arboric. 1992, 18, 227. [Google Scholar]
- Davies, Z.G.; Edmondson, J.L.; Heinemeyer, A.; Leake, J.R.; Gaston, K.J. Mapping an urban ecosystem service: Quantifying above-ground carbon storage at a city-wide scale. J. Appl. Ecol. 2011, 48, 1125–1134. [Google Scholar] [CrossRef]
- Armson, D.; Stringer, P.; Ennos, A. The effect of tree shade and grass on surface and globe temperatures in an urban area. Urban For. Urban Green. 2012, 11, 245–255. [Google Scholar] [CrossRef]
- Berland, A.; Shiflett, S.A.; Shuster, W.D.; Garmestani, A.S.; Goddard, H.C.; Herrmann, D.L.; Hopton, M.E. The role of trees in urban stormwater management. Landsc. Urban Plan. 2017, 162, 167–177. [Google Scholar] [CrossRef] [PubMed]
- Dallimer, M.; Irvine, K.N.; Skinner, A.M.J.; Davies, Z.G.; Rouquette, J.R.; Maltby, L.L.; Warren, P.H.; Armsworth, P.R.; Gaston, K.J. Biodiversity and the Feel-Good Factor: Understanding Associations between Self-Reported Human Well-being and Species Richness. Bioscience 2012, 62, 47–55. [Google Scholar] [CrossRef]
- Escobedo, F.J.; Kroeger, T.; Wagner, J.E. Urban forests and pollution mitigation: Analyzing ecosystem services and disservices. Environ. Pollut. 2011, 159, 2078–2087. [Google Scholar] [CrossRef] [PubMed]
- Yan, P.; Yang, J. Performances of Urban Tree Species under Disturbances in 120 Cities in China. Forest 2018, 9, 50. [Google Scholar] [CrossRef]
- Fassnacht, F.E.; Latifi, H.; Stereńczak, K.; Modzelewska, A.; Lefsky, M.; Waser, L.T.; Straub, C.; Ghosh, A. Review of studies on tree species classification from remotely sensed data. Remote Sens. Environ. 2016, 186, 64–87. [Google Scholar] [CrossRef]
- Ardila, J.P.; Tolpekin, V.A.; Bijker, W.; Stein, A. Markov-random-field-based super-resolution mapping for identification of urban trees in VHR images. ISPRS J. Photogramm. Remote Sens. 2011, 66, 762–775. [Google Scholar] [CrossRef]
- Li, D.; Ke, Y.; Gong, H.; Li, X. Object-Based Urban Tree Species Classification Using Bi-Temporal WorldView-2 and WorldView-3 Images. Remote Sens. 2015, 7, 16917–16937. [Google Scholar] [CrossRef]
- Pu, R.; Landry, S. A comparative analysis of high spatial resolution IKONOS and WorldView-2 imagery for mapping urban tree species. Remote Sens. Environ. 2012, 124, 516–533. [Google Scholar] [CrossRef]
- Xiao, Q.; Ustin, S.L.; McPherson, E.G. Using AVIRIS data and multiple-masking techniques to map urban forest tree species. Int. J. Remote Sens. 2004, 25, 5637–5654. [Google Scholar] [CrossRef]
- Alonzo, M.; Roth, K.; Roberts, D. Identifying Santa Barbara’s urban tree species from AVIRIS imagery using canonical discriminant analysis. Remote Sens. Lett. 2013, 4, 513–521. [Google Scholar] [CrossRef]
- Zhang, C.; Qiu, F. Mapping Individual Tree Species in an Urban Forest Using Airborne Lidar Data and Hyperspectral Imagery. Photogramm. Eng. Remote Sens. 2012, 78, 1079–1087. [Google Scholar] [CrossRef]
- Alonzo, M.; Bookhagen, B.; Roberts, D.A. Urban tree species mapping using hyperspectral and lidar data fusion. Remote Sens. Environ. 2014, 148, 70–83. [Google Scholar] [CrossRef]
- Zhang, Z.; Kazakova, A.; Moskal, L.M.; Styers, D.M. Object-Based Tree Species Classification in Urban Ecosystems Using LiDAR and Hyperspectral Data. Forest 2016, 7, 122. [Google Scholar] [CrossRef]
- Liu, L.; Coops, N.C.; Aven, N.W.; Pang, Y. Mapping urban tree species using integrated airborne hyperspectral and LiDAR remote sensing data. Remote Sens. Environ. 2017, 200, 170–182. [Google Scholar] [CrossRef]
- Immitzer, M.; Atzberger, C.; Koukal, T. Tree Species Classification with Random Forest Using Very High Spatial Resolution 8-Band WorldView-2 Satellite Data. Remote Sens. 2012, 4, 2661–2693. [Google Scholar] [CrossRef]
- Boschetti, M.; Boschetti, L.; Oliveri, S.; Casati, L.; Canova, I. Tree species mapping with Airborne hyper-spectral MIVIS data: The Ticino Park study case. Int. J. Remote Sens. 2007, 28, 1251–1261. [Google Scholar] [CrossRef]
- Lu, B.; He, Y.; Liu, H. Investigating Species Composition in a Temperate Grassland Using Unmanned Aerial Vehicle-Acquired Imagery. In Proceedings of the 4th International Workshop on Earth Observation and Remote Sensing Applications (EORSA), Guangzhou, China, 4–6 July 2016; pp. 107–111. [Google Scholar]
- Gini, R. Use of Unmanned Aerial Systems for multispectral survey and tree classification: A test in a park area of northern Italy. Eur. J. Remote Sens. 2014, 47, 251–269. [Google Scholar] [CrossRef]
- Franklin, S.E.; Ahmed, O.S. Deciduous tree species classification using object-based analysis and machine learning with unmanned aerial vehicle multispectral data. Int. J. Remote Sens. 2018, 39, 5236–5245. [Google Scholar] [CrossRef]
- Lisein, J.; Michez, A.; Claessens, H.; Lejeune, P. Discrimination of Deciduous Tree Species from Time Series of Unmanned Aerial System Imagery. PLoS ONE 2015, 10, e0141006. [Google Scholar] [CrossRef] [PubMed]
- Hill, D.J.; Tarasoff, C.; Whitworth, G.E.; Baron, J.; Bradshaw, J.L.; Church, J.S. Utility of unmanned aerial vehicles for mapping invasive plant species: A case study on yellow flag iris (Iris pseudacorus L.). Int. J. Remote Sens. 2017, 38, 2083–2105. [Google Scholar] [CrossRef]
- Michez, A.; Piégay, H.; Jonathan, L.; Claessens, H.; Lejeune, P. Mapping of riparian invasive species with supervised classification of Unmanned Aerial System (UAS) imagery. Int. J. Appl. Earth Obs. Geoinf. 2016, 44, 88–94. [Google Scholar] [CrossRef]
- Alvarez-Taboada, F.; Paredes, C.; Julián-Pelaz, J. Mapping of the Invasive Species Hakea sericea Using Unmanned Aerial Vehicle (UAV) and WorldView-2 Imagery and an Object-Oriented Approach. Remote Sens. 2017, 9, 913. [Google Scholar] [CrossRef]
- Saarinen, N.; Vastaranta, M.; Näsi, R.; Rosnell, T.; Hakala, T.; Honkavaara, E.; Wulder, M.A.; Luoma, V.; Tommaselli, A.M.G.; Imai, N.N.; et al. Assessing Biodiversity in Boreal Forests with UAV-Based Photogrammetric Point Clouds and Hyperspectral Imaging. Remote Sens. 2018, 10, 338. [Google Scholar] [CrossRef]
- Cao, J.; Leng, W.; Liu, K.; Liu, L.; He, Z.; Zhu, Y. Object-Based Mangrove Species Classification Using Unmanned Aerial Vehicle Hyperspectral Images and Digital Surface Models. Remote Sens. 2018, 10, 89. [Google Scholar] [CrossRef]
- Liu, C.; Ai, M.; Chen, Z.; Zhou, Y.; Wu, H. Detection of Firmiana danxiaensis Canopies by a Customized Imaging System Mounted on an UAV Platform. J. Sens. 2018, 2018, 1–12. [Google Scholar] [CrossRef]
- Stow, D.A.; Toure, S.I.; Lippitt, C.D.; Lippitt, C.L.; Lee, C.R. Frequency distribution signatures and classification of within-object pixels. International Int. J. Appl. Earth Obs. Geoinf. 2012, 15, 49–56. [Google Scholar] [CrossRef]
- Toure, S.I.; Stow, D.A.; Weeks, J.R.; Kumar, S. Histogram curve matching approaches for object-based image classification of land cover and land use. Photogramm. Eng. Remote Sens. 2013, 79, 433–440. [Google Scholar] [CrossRef]
- Zhou, Y.; Qiu, F. Fusion of high spatial resolution WorldView-2 imagery and LiDAR pseudo-waveform for object-based image analysis. ISPRS J. Photogramm. Remote Sens. 2015, 101, 221–232. [Google Scholar] [CrossRef]
- Liu, J.; Li, P. Extraction of Earthquake-Induced Collapsed Buildings from Bi-Temporal VHR Images Using Object-Level Homogeneity Index and Histogram. IEEE J. Sel. Top. Appl. Earth Obs. Remote Sens. 2019, 1–16. [Google Scholar] [CrossRef]
- Liu, Z.; Jiang, J.; Yang, H.; Wen, S.; Li, A. Study on bio-ecological characteristics of Platanus acerifolia in Blooming and Bearing II Changing of flower buds’ development with increase of DBH. J. Henan Agric. Univ. 2002, 36, 54–58, (In Chinese with English abstract). [Google Scholar]
- Wang, X.; Ma, L.; Guo, B. History and Research Process on the Silviculture of Metasequoia glyptostroboides in China. J. Northwest For. Univ. 2004, 19, 82–88, (In Chinese with English abstract). [Google Scholar]
- Mao, C. Research on Introduction and Domestication of Camphora Camphora (Linn.). Presl. J. Shandong Agric. Univ. (Nat. Sci.) 2004, 35, 534–539, (In Chinese with English abstract). [Google Scholar]
- Mesas-Carrascosa, F.J.; Torres-Sánchez, J.; Clavero-Rumbao, I.; García-Ferrer, A.; Peña, J.M.; Borra-Serrano, I.; López-Granados, F. Assessing optimal flight parameters for generating accurate multispectral orthomosaicks by UAV to support site-specific crop management. Remote Sens. 2015, 7, 12793–12814. [Google Scholar] [CrossRef]
- Ma, Y.; Gu, X.; Wang, Y. Histogram similarity measure using variable bin size distance. Comput. Vis. Image Underst. 2010, 114, 981–989. [Google Scholar] [CrossRef]
- Liu, J.; Li, P.; Wang, X. A new segmentation method for very high resolution imagery using spectral and morphological information. ISPRS J. Photogramm. Remote Sens. 2015, 101, 145–162. [Google Scholar] [CrossRef]
- Belgiu, M.; Drăguţ, L. Comparing supervised and unsupervised multiresolution segmentation approaches for extracting buildings from very high resolution imagery. ISPRS J. Photogramm. Remote Sens. 2014, 96, 67–75. [Google Scholar] [CrossRef] [PubMed]
- Baatz, M.; Schäpe, A. Multiresolution Segmentation: An Optimization Approach for High Quality Multi-Scale Image Segmentation. In Angewandte Geographische Informationsverarbeitung XII, 1st ed.; Strobl, J., Blaschke, T., Griesebner, G., Eds.; Herbert Wichmann Verlag: Heidelberg, Germany, 2000; pp. 12–23. [Google Scholar]
- Benz, U.C.; Hofmann, P.; Willhauck, G.; Lingenfelder, I.; Heynen, M. Multi-resolution, object-oriented fuzzy analysis of remote sensing data for GIS-ready information. ISPRS J. Photogramm. Remote Sens. 2004, 58, 239–258. [Google Scholar] [CrossRef]
- Trimble eCognition Developer 9.0 Reference Book. 2014. Available online: www.eCognition.com (accessed on 6 July 2014).
- Savitzky, A.; Golay, M.J.E. Smoothing and Differentiation of Data by Simplified Least Squares Procedures. Anal. Chem. 1964, 36, 1627–1639. [Google Scholar] [CrossRef]
- Chen, J.; Jönsson, P.; Tamura, M.; Gu, Z.; Matsushita, B.; Eklundh, L. A simple method for reconstructing a high-quality NDVI time-series data set based on the Savitzky?Golay filter. Remote Sens. Environ. 2004, 91, 332–344. [Google Scholar] [CrossRef]
- Zhou, W.; Huang, G.; Troy, A.; Cadenasso, M. Object-based land cover classification of shaded areas in high spatial resolution imagery of urban areas: A comparison study. Remote Sens. Environ. 2009, 113, 1769–1777. [Google Scholar] [CrossRef]
- Congalton, R.G.; Green, K. Assessing the Accuracy of Remotely Sensed Data: Principles and Practices; Lewis Publishers: Boca Raton, FL, USA, 1999; 137p. [Google Scholar]
- Koga, Y.; Miyazaki, H.; Shibasaki, R. A CNN-Based Method of Vehicle Detection from Aerial Images Using Hard Example Mining. Remote Sens. 2018, 10, 124. [Google Scholar] [CrossRef]
- Schölkopf, B.; Platt, J.C.; Shawe-Taylor, J.; Smola, A.J.; Williamson, R.C. Estimating the Support of a High-Dimensional Distribution. Neural Comput. 2001, 13, 1443–1471. [Google Scholar] [CrossRef]


| Steps | Parameters and Threshold Values |
|---|---|
| 1 | Initial segmentation scale: 50 |
| 2 | NDVI: −0.4; Height: −24 |
| 3 | Merging scale: 120 |
| 4 | Brightness: 57 (low) and 180 (high) |
| 5 | Merging scale: 140 |
| Tree Species | Threshold Values | ||
|---|---|---|---|
| VBSD for L1 | VBSD for L2 | VBSD for χ2 | |
| Metasequoia | 2.23 | 0.40 | 1.02 |
| Platanus I | 1.73 | 0.35 | 0.77 |
| Platanus II | 1.81 | 0.37 | 0.82 |
| Camphora | 1.78 | 0.31 | 0.78 |
| Tree Species | VBSDs for Three Distances | Accuracy Measures | ||||
|---|---|---|---|---|---|---|
| PA(%) | UA(%) | OA(%) | Kappa | F1 | ||
| Metasequoia | L1 | 90.11 ± 2.196 | 96.35 ± 0.083 | 95.57 ± 0.731 | 0.899 ± 0.017 | 0.931 ± 0.012 |
| L2 | 89.87 ± 1.340 | 96.10 ± 0.057 | 95.41 ± 0.446 | 0.895 ± 0.011 | 0.929 ± 0.007 | |
| χ2 | 90.91 ± 1.743 | 96.14 ± 0.068 | 95.75 ± 0.581 | 0.903 ± 0.014 | 0.934 ± 0.009 | |
| Platanus I | L1 | 93.39 ± 0.409 | 82.59 ± 0.055 | 91.23 ± 0.131 | 0.809 ± 0.003 | 0.877 ± 0.002 |
| L2 | 93.09 ± 0.599 | 79.09 ± 0.100 | 89.49 ± 0.196 | 0.774 ± 0.005 | 0.855 ± 0.003 | |
| χ2 | 93.39 ± 0.409 | 82.84 ± 0.056 | 91.35 ± 0.135 | 0.811 ± 0.003 | 0.878 ± 0.002 | |
| Platanus II | L1 | 80.70 ± 2.274 | 87.21 ± 0.312 | 89.63 ± 0.762 | 0.762 ± 0.019 | 0.838 ± 0.014 |
| L2 | 82.39 ± 1.729 | 77.51 ± 0.370 | 86.17 ± 0.579 | 0.694 ± 0.014 | 0.799 ± 0.010 | |
| χ2 | 82.15 ± 1.829 | 86.94 ± 0.263 | 89.94 ± 0.615 | 0.770 ± 0.015 | 0.845 ± 0.011 | |
| Camphora | L1 | 73.43 ± 0.981 | 74.83 ± 0.239 | 82.91 ± 0.320 | 0.614 ± 0.008 | 0.741 ± 0.006 |
| L2 | 66.93 ± 2.034 | 82.36 ± 0.424 | 84.20 ± 0.673 | 0.627 ± 0.018 | 0.738 ± 0.014 | |
| χ2 | 70.64 ± 1.816 | 75.68 ± 0.467 | 82.65 ± 0.601 | 0.603 ± 0.016 | 0.731 ± 0.012 | |
| Tree Species | Accuracy Measures | ||||
|---|---|---|---|---|---|
| PA(%) | UA(%) | OA(%) | Kappa | F1 | |
| Metasequoia | 86.80 ± 5.480 | 98.45 ± 0.355 | 95.14 ± 1.775 | 0.887 ± 0.043 | 0.922 ± 0.031 |
| Platanus I | 83.39 ± 6.857 | 83.04 ± 1.432 | 88.78 ± 1.860 | 0.747 ± 0.047 | 0.831 ± 0.035 |
| Platanus II | 71.34 ± 5.912 | 84.16 ± 3.218 | 85.93 ± 2.033 | 0.671 ± 0.050 | 0.771 ± 0.038 |
| Camphora | 67.20 ± 13.014 | 67.71 ± 5.089 | 78.39 ± 4.235 | 0.510 ± 0.109 | 0.669 ± 0.088 |
© 2019 by the authors. Licensee MDPI, Basel, Switzerland. This article is an open access article distributed under the terms and conditions of the Creative Commons Attribution (CC BY) license (http://creativecommons.org/licenses/by/4.0/).
Share and Cite
Feng, X.; Li, P. A Tree Species Mapping Method from UAV Images over Urban Area Using Similarity in Tree-Crown Object Histograms. Remote Sens. 2019, 11, 1982. https://doi.org/10.3390/rs11171982
Feng X, Li P. A Tree Species Mapping Method from UAV Images over Urban Area Using Similarity in Tree-Crown Object Histograms. Remote Sensing. 2019; 11(17):1982. https://doi.org/10.3390/rs11171982
Chicago/Turabian StyleFeng, Xiaoxue, and Peijun Li. 2019. "A Tree Species Mapping Method from UAV Images over Urban Area Using Similarity in Tree-Crown Object Histograms" Remote Sensing 11, no. 17: 1982. https://doi.org/10.3390/rs11171982
APA StyleFeng, X., & Li, P. (2019). A Tree Species Mapping Method from UAV Images over Urban Area Using Similarity in Tree-Crown Object Histograms. Remote Sensing, 11(17), 1982. https://doi.org/10.3390/rs11171982