Article

Revealing Kunming’s (China) Historical Urban Planning Policies Through Local Climate Zones

by
Stéphanie Vandamme
1,
Matthias Demuzere
2,3,
Marie-Leen Verdonck
1,
Zhiming Zhang
4 and
Frieke Van Coillie
1,*
1
Department of Environment, Laboratory of Forest Management and Spatial Information Techniques, Ghent University, 9000 Ghent, Belgium
2
Department of Geography, Ruhr-University Bochum, 44801 Bochum, Germany
3
Department of Environment, Laboratory of Hydrology and Water Management, Ghent University, 9000 Ghent, Belgium
4
School of Ecology and Environmental Science, Yunnan University, Kunming 650091, China
*
Author to whom correspondence should be addressed.
Remote Sens. 2019, 11(14), 1731; https://doi.org/10.3390/rs11141731
Submission received: 24 June 2019 / Revised: 15 July 2019 / Accepted: 16 July 2019 / Published: 22 July 2019
(This article belongs to the Special Issue Application of Remote Sensing in Urban Climatology)

Abstract

:
Over the last decade, Kunming has been subject to a strong urbanisation driven by rapid economic growth and socio-economic, topographical and proximity factors. As this urbanisation is expected to continue in the future, it is important to understand its environmental impacts and the role that spatial planning strategies and urbanisation regulations can play herein. This is addressed by (1) quantifying the cities’ expansion and intra-urban restructuring using Local Climate Zones (LCZs) for three periods in time (2005, 2011 and 2017) based on the World Urban Database and Access Portal Tool (WUDAPT) protocol, and (2) cross-referencing observed land-use and land-cover changes with existing planning regulations. The results of the surveys on urban development show that, between 2005 and 2011, the city showed spatial expansion, whereas between 2011 and 2017, densification mainly occurred within the existing urban extent. Between 2005 and 2017, the fraction of open LCZs increased, with the largest increase taking place between 2011 and 2017. The largest decrease was seen for low the plants (LCZ D) and agricultural greenhouse (LCZ H) categories. As the potential of LCZs as, for example, a heat stress assessment tool has been shown elsewhere, understanding the relation between policy strategies and LCZ changes is important to take rational urban planning strategies toward sustainable city development.

1. Introduction

In this study, urbanisation in Kunming is investigated. Urbanisation is one of the main driving forces for global environmental changes and socio-economic development and it is happening very fast and on a large scale, especially in China [1,2,3]. Urbanisation in China is primarily driven by the economic growth caused by the market reforms of 1978, through which the Chinese economy switched from being centrally-planned to being market-based [4,5,6]. Besides the economic growth, migration also affects urbanisation, as more than 150 million Chinese farmers are expected to move to cities between 2010 and 2020 [7]. To accommodate all the migrants and the natural population growth in cities, urban areas need to expand [5]. For example, in Kunming, there has been a strong urbanisation in the past ten years [8] and it is expected to further increase in the future [9]. In addition to the general drivers of urbanisation in China [10], Kunming’s urbanisation is also driven by local planning policies and topographic and proximity factors. Economic and demographic factors mainly influence the urban expansion rate, while natural and policy factors mainly affect the spatial form [9].
Planning policies are an important driver for Kunming’s urban expansion [11]. In 1996, the State Council approved the “Kunming urban planning 1996–2010” strategy, outlining major development strategies for the Kunming area, whereby the old city was taken as the core to expand in the northeast, southwest and southeast, resulting in a “Star” pattern. It also included the plan for the development of four sub-cities that are located in the four cardinal directions of the old city [9]. Meanwhile, the State Council approved the Kunming high-tech industrial development zone, northwest of the old city, promoting urban expansion in that direction. Because of this zone, the adjacent city Anning expanded, which led to more urban expansion to the west [11]. Between 1999 and 2010, urbanisation was further sped up by two factors. First, the World Horticultural Expo in 1999 improved mobility (road and air access) and urban green (trees) infrastructure. As a result, the planning and construction of main road networks were completed 10 years earlier than expected, improving the reputation of Kunming [12]. It also stimulated foreign investment, leading to modifications of the industrial structure and the rapid development of the tourism-centred tertiary industry. Kunming is now a preferred tourism site in China and a migration destination [12]. The second important factor is the new planning framework that was approved in 2003, outlining the urbanisation strategy for the period 2008–2030 [9]. This framework had an important influence on urbanisation, and has led to an increase in built-up areas in the southeast, northwest and northeast of the old city [13]. In addition, the new framework promotes the agglomeration of Kunming with neighbouring cities [14]. Besides the political factors, topographic factors are also important drivers of urbanisation. For example, the agreement of the Kunming-Yuxi integration in 2011 was greatly affected by the topography of the landscape and the morphology of Dianchi Lake [11].
Urbanisation has a major impact on the environmental, social and cultural aspects of society. Industrialisation is responsible for high pollutant emissions, causing environmental degradation and health problems. The conversion from natural to urban land use/cover induces a change in the radiative, thermal, and spectral properties of the land surface, which, in turn, lead to a different local thermal environment [15]. Changes in the local thermal environment are driven by increased anthropogenic heat releases and impervious fractions, surface geometry, the thermal properties of building materials and air pollution [16,17]. As a result, the city turns into an Urban Heat Island (UHI) where air temperatures can be significantly higher compared to the temperatures in the surrounding rural areas. The increase in temperature of the local climate can cause heat stress in specific locations at certain points in time [18,19]. According to a study by Li et al. (2016, [20]), Beijing might experience 14,401 heat-related deaths per year for elderly individuals by 2080, which is an increase of 264.9% compared to the number of casualties in the 1980s. In order to minimise and prevent economical and public health problems due to the more unpredictable and extreme weather events in the future, it is key to have a good understanding of the historical urban development and its corresponding land use/cover changes (LULCC; [21]) and environmental impacts [22]. A study by Xu et al. (2019, [23]) also confirms that it is most urgent that urban managers take full account of climate adaptation in future land use planning and implementation, in order to enhance climate resilience. Combining this knowledge with climate-sensitive urban design strategies [15,24,25] can ultimately support local urban planners and government officials to make science- and data-driven future planning decisions [26]. Such knowledge sharing and integration into local-scale processes requires an urban descriptor that is easy to understand, which captures the heterogeneous forms and functions of a city and that is suited for environmental studies and global climate solutions [27]. This is addressed by the World Urban Database and Access Portal Tool (WUDAPT) project, an international community-driven program that, amongst others, aims at providing coherent and consistent descriptions and information on the form and function of urban morphology relevant to climate, weather and environment studies on a worldwide basis [28]. The lowest level of detail herein is provided by Local Climate Zones (LCZ), a classification scheme suggested by Stewart and Oke (2012, [29]) that provides information on the form and function of cities. Since Middel et al. (2014, [30]) stressed the importance of incorporating urban climate knowledge with urban planning and because Wang et al. (2019, [31]) demonstrated that LCZs can inspire scientific and rational urban planning strategies in terms of the sustainable development of cities, this study adopted the WUDAPT level 0 procedure [32,33,34] as a tool to provide an in-depth understanding of the historical spatiotemporal LCZ dynamics in Kunming.
In order to progress scientific research on the functionality of sustainable cities, much effort currently goes towards large-scale LCZ mapping. Qui et al. (2018) [35,36] particularly focused on data/feature choice including optical data such as Landsat-8 and Sentinel-2, as well as additional datasets such as the Global Urban Footprint (GUF), the OpenStreetMap (OSM) layers buildings and land use, and the Visible Infrared Imager Radiometer Suite (VIIRS)-based Nighttime Light (NTL). Hu et al. (2018) [37,38], on the other hand, explored the potential of Sentinel-1 polarimetric SAR data for LCZ classification. Despite the rapid advancements in spatio-temporal LCZ mapping, to date, the large number of LCZ maps created for cities and regions around the world (see, e.g., references in [28,33,35,39,40,41]) are typically static in time. Except for the work done by Wang et al. (2019, [31]) on the Pearl River Delta region (China), to the author’s best knowledge, no other studies have come up with multi-temporal LCZ maps that allow the quantification of the transformation of natural and urban landscapes through time. In addition, this study cross-references the observed land-cover and land-use changes with historic and present-day planning policies. Considering the rapidly growing number of applications using the LCZ scheme [28] and the need for data-based approaches to upscale urban climate solutions [27] and integrated urban weather, environment and climate services [42], this effort is undertaken to demonstrate that the LCZ framework might push the mission of WUDAPT well beyond the provision of “urban canopy information and modelling infrastructure to facilitate urban-focused climate, weather, air-quality and energy-use modelling application studies” [28]. It provides a powerful means to transfer and translate scientific urban climate information to city practitioners, allowing them to form rational urban planning strategies toward the sustainable development of cities [43,44].

2. Materials and Methods
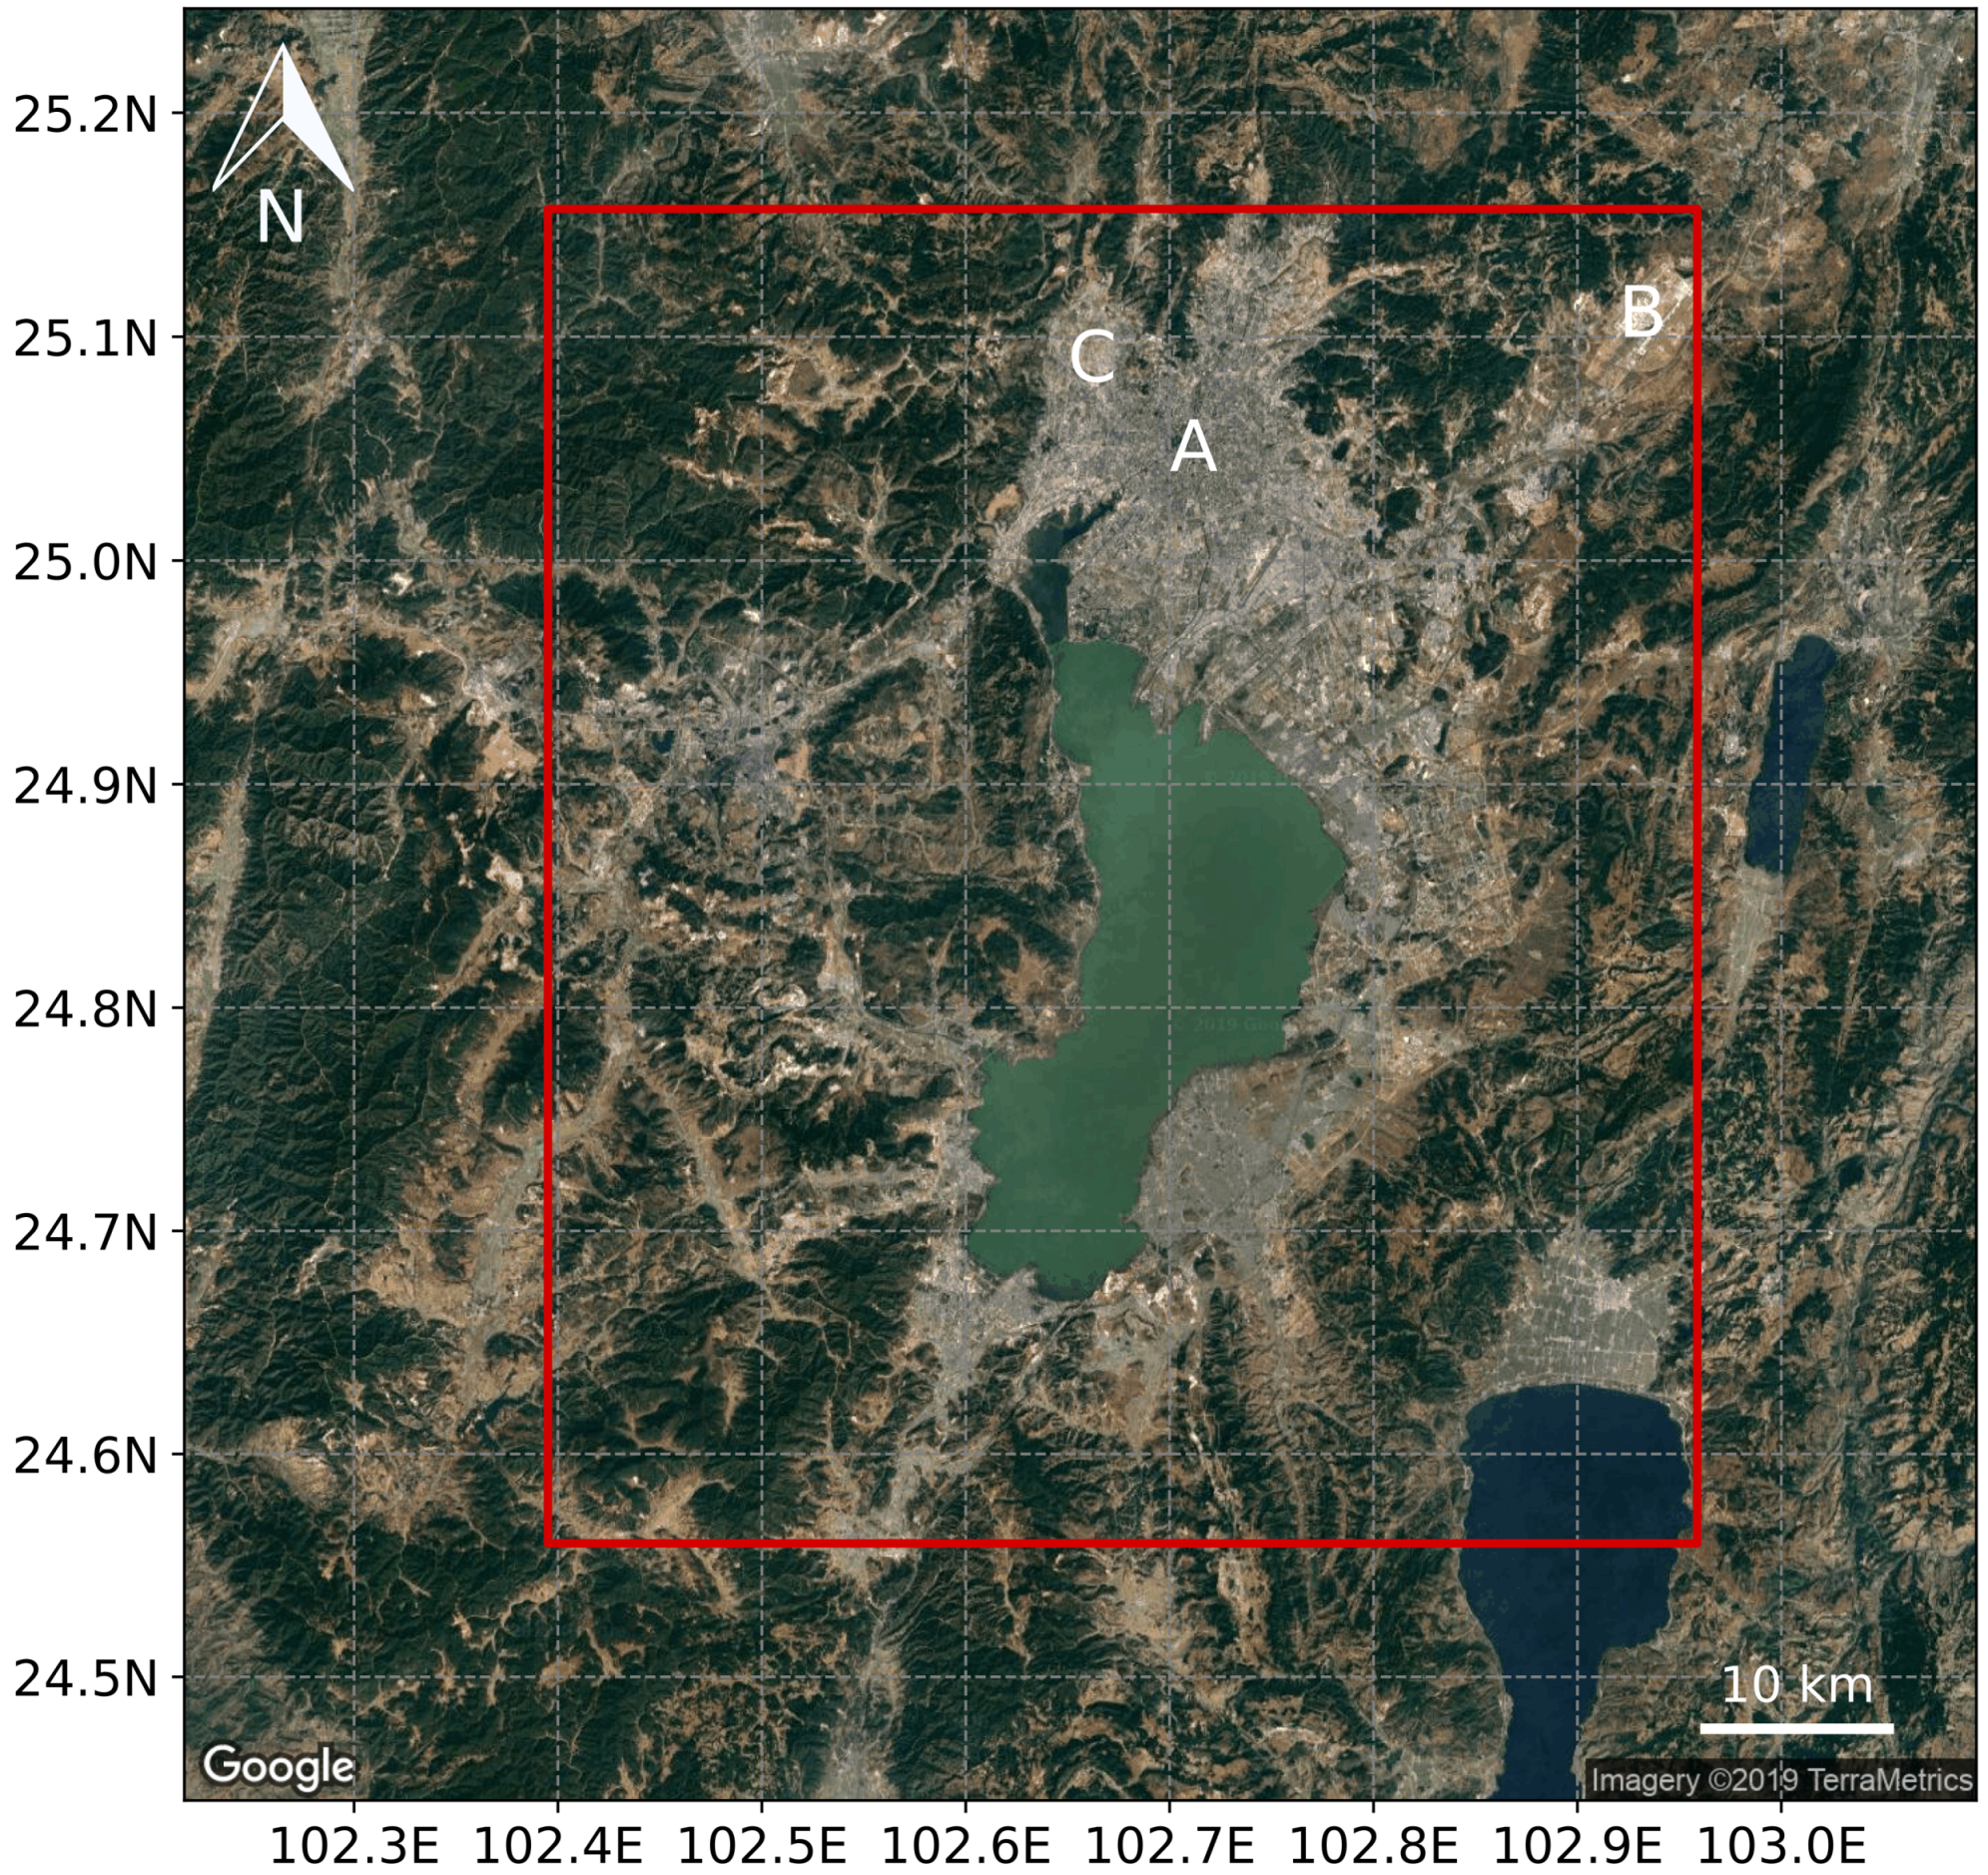
2.1. Study Area

Kunming is the capital and largest city of Yunnan Province and is located in southwest China (Figure 1). It is located on a plateau with an elevation from 1500 to 2800 m and is surrounded by mountain scenery in the north, east, and west. The metropolitan area of Kunming is found in the Dianchi basin. The city has a subtropical monsoon climate, with humid and warmer summers and dry and colder winters. Kunming has a mean annual precipitation between 788 and 1000 mm, and rain mostly falls in May to October. Because of various landscapes, the amount of rainfall is dependent on location. In general, mountainous regions have more rainfall than flat regions. Annual average air temperature is between 15.4 and 24.2 ° C, with a minimum of −3 ° C and a maximum of 32.2 ° C. The climate is one of the mildest of China due to its surrounding orography [11]. The landscape causes a more or less all year round spring climate, which is why the city is also called the “City of Eternal Spring.”

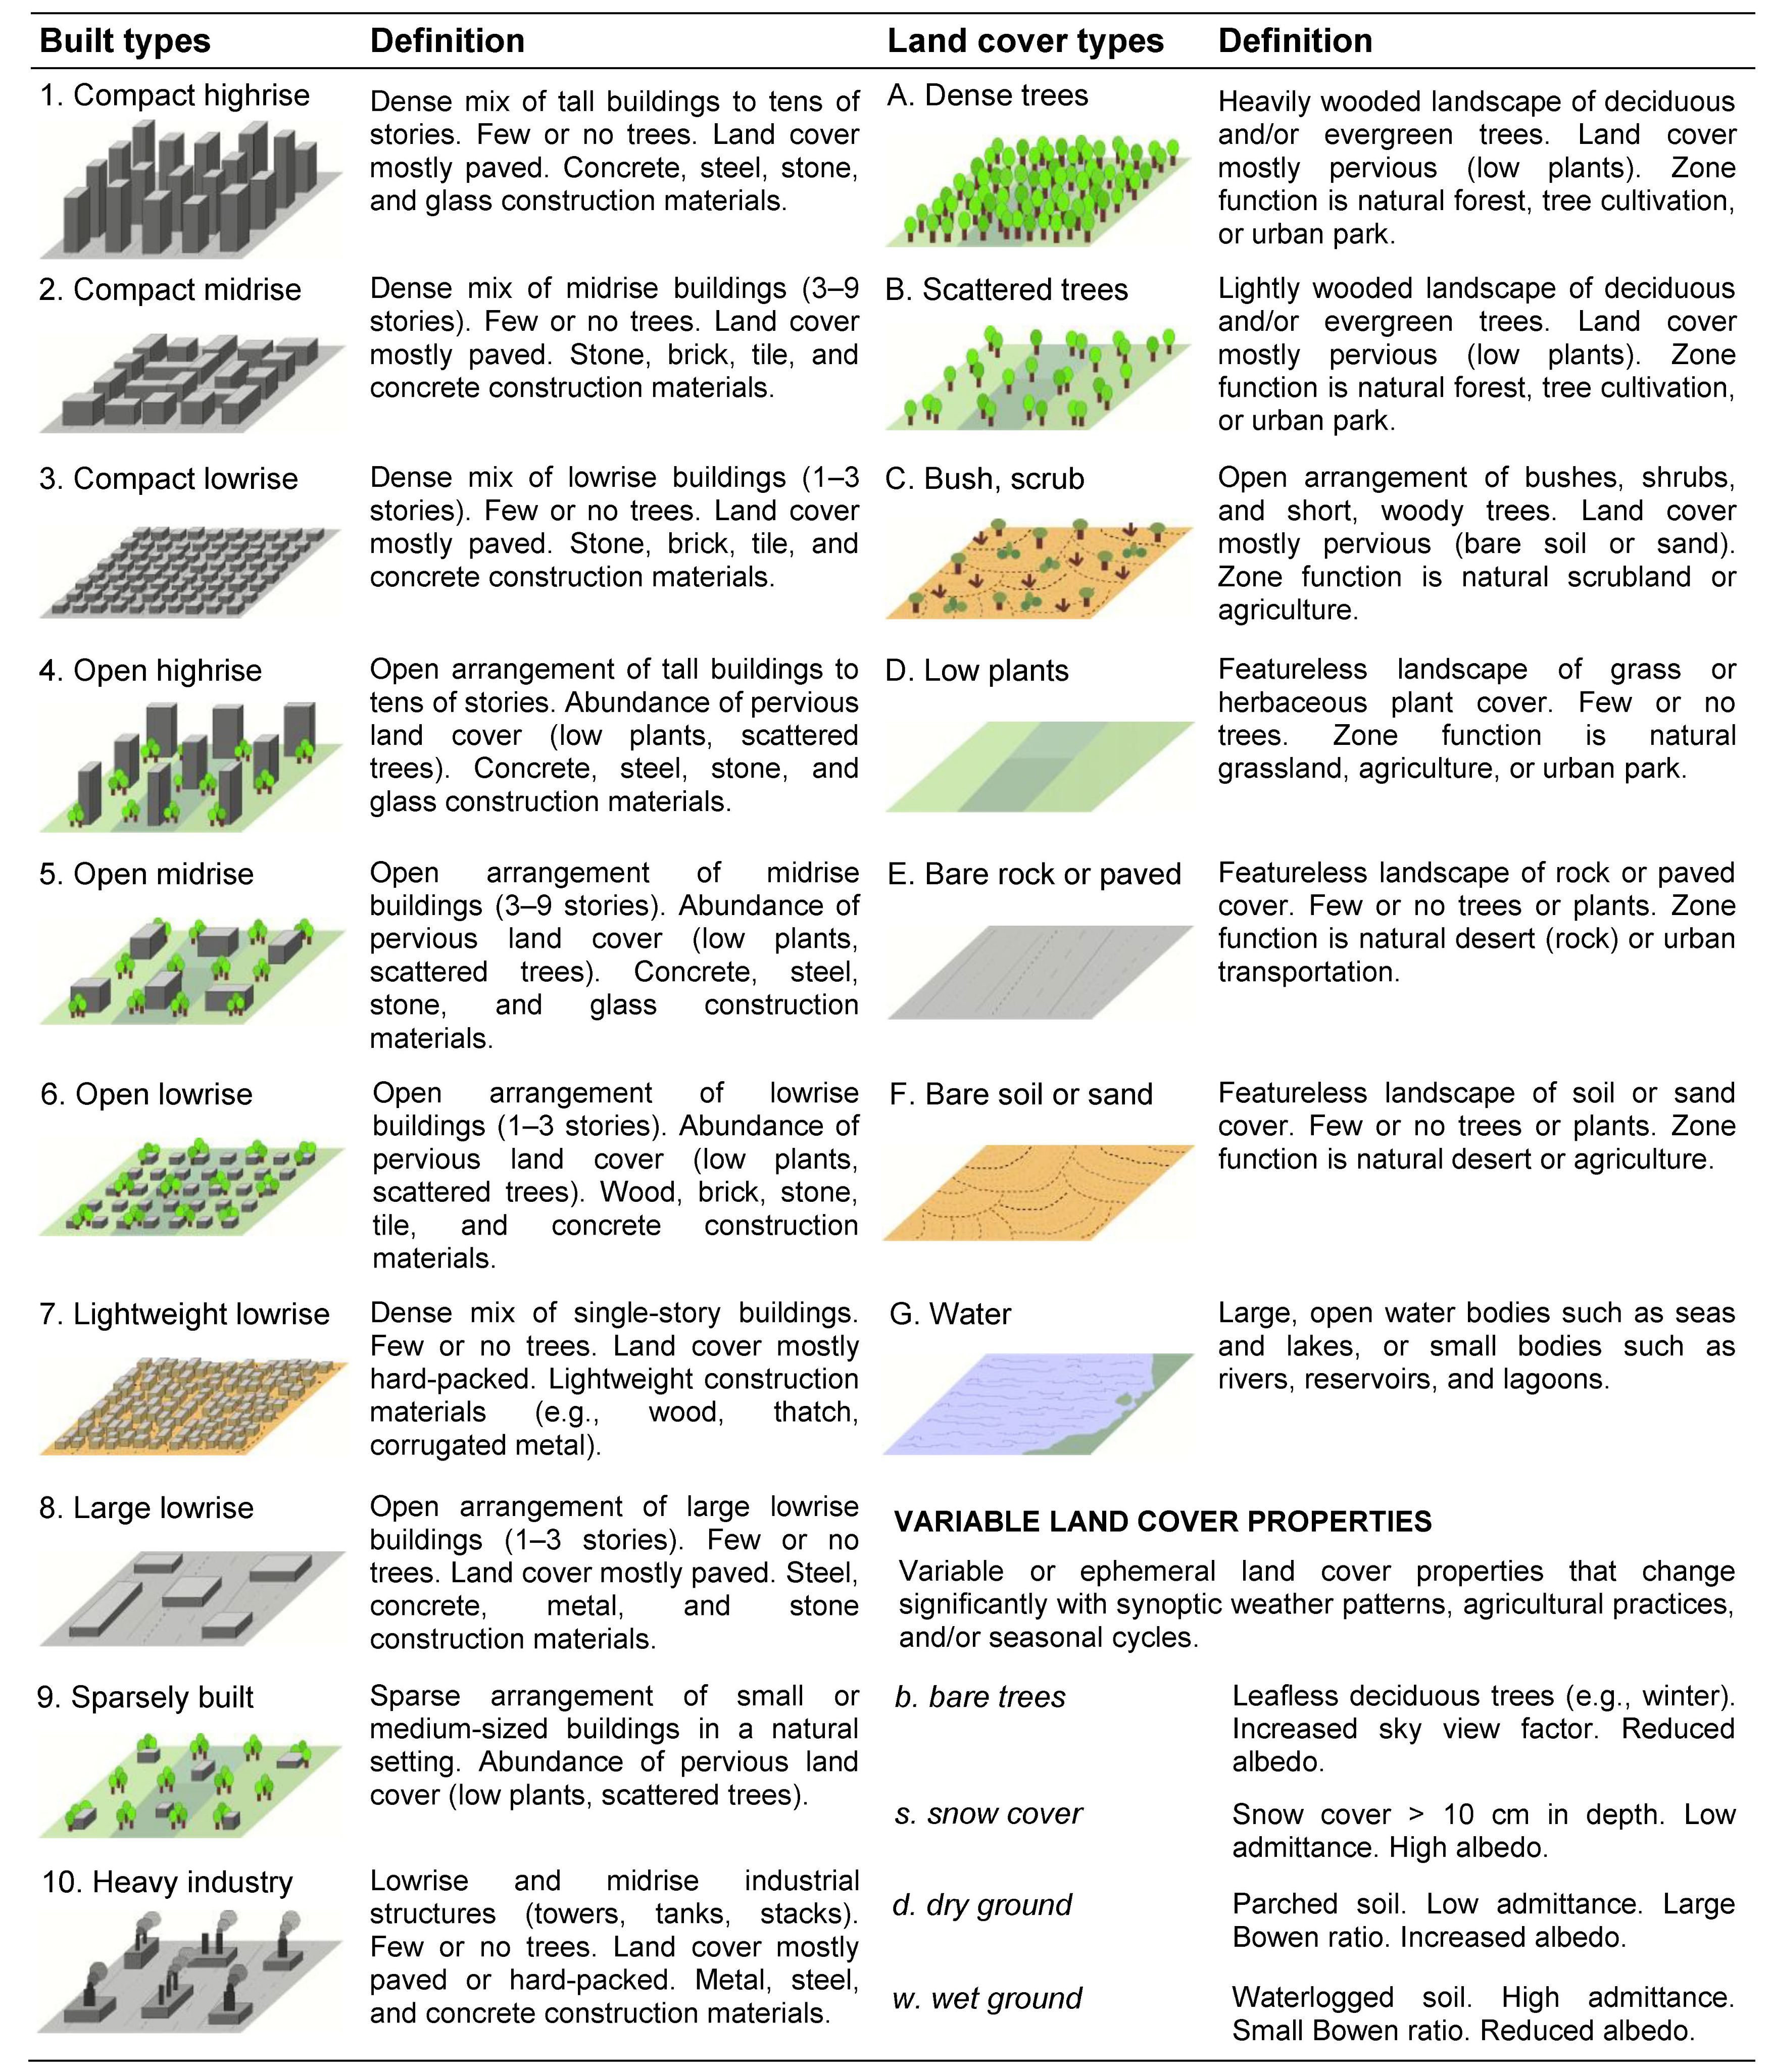
2.2. Background on LCZ Mapping

The necessity to acquire information about the urban landscape is recognised by the Intergovernmental Panel on Climate Change (IPCC) assessment reports on both adaptation and mitigation [46]. However, at present, most of the available global urban data consist only of the urban mask, which just shows the boundaries that separate the urban from the “natural” landscape (see, e.g., Reference [40]). That is why, in 2015, WUDAPT was conceived to gather and spread data on the physical geographies of cities globally by using the Local Climate Zone scheme in order to overcome the lack of useful information about the form and function of cities [28,32]. LCZs (Figure 2) characterise areas with uniform surface coverage, material, structure, and human activity that cover hundreds of metres to several kilometres on a horizontal scale [29]. The zones are determined by physical and functional information of the area, including urban structures, urban coverage, urban fabric and urban metabolism. Each zone features a typical screen-height temperature that is most clearly seen on dry surfaces, on quiet, clear nights and on simple relief [29]. It was found by Geletič et al. (2016) [47]) and Cai et al. (2017) [43] that higher Land Surface Temperatures (LST) are found in areas with heavy industry (LCZ 10), large low-rises (LCZ 8), compact mid-rises (LCZ 2) and compact low-rises (LCZ 3) due to factors like building material, thermal activities, absence of green elements, and the sky-view factor [48].
To this end, Bechtel et al. (2015, [32]) introduced a semi-automated procedure to map cities into LCZs using multi-temporal, -spectral, and thermal remote sensing data and modern machine learning methods using free data and software. This procedure is followed here as well, extended by the contextual classifier information developed by Verdonck et al. (2017; [34]). Each of the different steps in the LCZ mapping procedure is described in more detail below.
To date, the WUDAPT Level 0 LCZ mapping community effort is evolving rapidly as demonstrated by a large number of developments such as a more stringent accuracy assessment procedure [41], the introduction of novel remote sensing information and learning/classification techniques [49,50], in-depth comparisons with local administrative datasets [44], applications in health-risk studies [51], comparisons with land-surface temperature dynamics [31,33,52], and the upscaling of city-wide maps to whole continents such as Europe [40]. This work contributes to these advances by providing a dynamic map for Kunming for different periods in time (2005, 2011 and 2017) and by interpreting the land-cover changes in terms of policy and planning regulations.

2.3. Landsat Images

To study urban development in Kunming via LCZs, Level 1 Tier 1 Landsat images with a cloud cover of less than 10% on their original 30 m resolution were downloaded from the United States Geological Survey (USGS) for the different years. Within each specific year, images were chosen from different seasons and thus with different climatic characteristics. For the imagery of Landsat 8, only the bands 1 to 7, 10, and 11 were used and for the Landsat 7 images, only the bands 1 to 7. Specific information is shown in Table 1.
Pre-processing of Landsat raster data, following Bechtel et al. (2015; [32]), was performed in SAGA GIS [53] and included the cropping of images to the region of interest (ROI) and the resampling of the image data to a common-sized grid. After pre-processing, the Landsat data were ready to be used in WUDAPT’s LCZ classification algorithm [41]. Due to the failure of the Scan Line Corrector from the Landsat 7 Enhanced Thematic Mapper (ETM) sensor, these satellite images needed additional correction using the linear transform method available in the ENVI software. This technique fills the gaps in one scene with data from another Landsat scene based on the standard deviation and mean values of each band [54].

2.4. ROI and Training Areas

According to the method developed by Bechtel et al. (2015) [32], the first step in the LCZ classification is to select the region of interest (ROI, Figure 1) in Google Earth. Within this ROI, multiple training areas and validation polygons were selected for the different LCZs in the different periods (Table 2). At least 10 training areas per LCZ were selected, whereas the number of validation polygons was about the half of the number of training areas. When it was not possible to find at least 10 representative training areas for a certain LCZ, that LCZ was not included in the classification in order to maximise the quality of the LCZ map.
Since large areas of Kunming’s agricultural land are characterised by rose plantations covered by plastic foils, an extra LCZ (LCZ H) was added because of the uncertainty of the spectral response of this foil. This LCZ class is called "agriculture-greenhouse." Examples of the different LCZs are presented in Figure 3.
To select training areas for 2017, initial training areas were chosen based on both top-view and street-view Baidu Maps, and were verified on-site. Baidu Maps is a mapping service application that offers satellite imagery, street-map, street-view, and indoor-view perspectives of the entire world. Training areas for 2005 and 2011 were collected by only using the timeline of Google Earth Pro and Baidu Maps. To do so, the 2017 training areas were reviewed and used, changed, or omitted, and new training areas for both 2005 and 2011 were added. These initial training areas are used for making the initial LCZ map, which is subsequently compared with the corresponding Google Earth imagery. Based on observed inconsistencies, the initial training areas were adjusted or additional ones were added, leading to a different number of training areas for the different LCZs. Thereafter, a new LCZ map was created using the revised training set. This iterative process was performed multiple times in order to achieve a high-quality LCZ map.
In the sampling for 2017, almost no lightweight low-rise (LCZ 7), sparsely built (LCZ 9), bare rock or paved (LCZ E) and bare soil and sand (LCZ F) areas are found with an acceptable size. These LCZs were left out of the training set. For 2005 and 2011, some extra LCZs are left out due to too few representative areas. For 2005, compact high-rise (LCZ 1), open high-rise (LCZ 4) and heavy industry (LCZ 10) areas were not included in the training set. For 2011, compact high-rise (LCZ 1) areas were not present. Note that, for 2005 and 2011, training areas could not be verified on-site or with street view, potentially introducing a source of uncertainty. To minimise this uncertainty, areas that did not undergo changes were preferred.

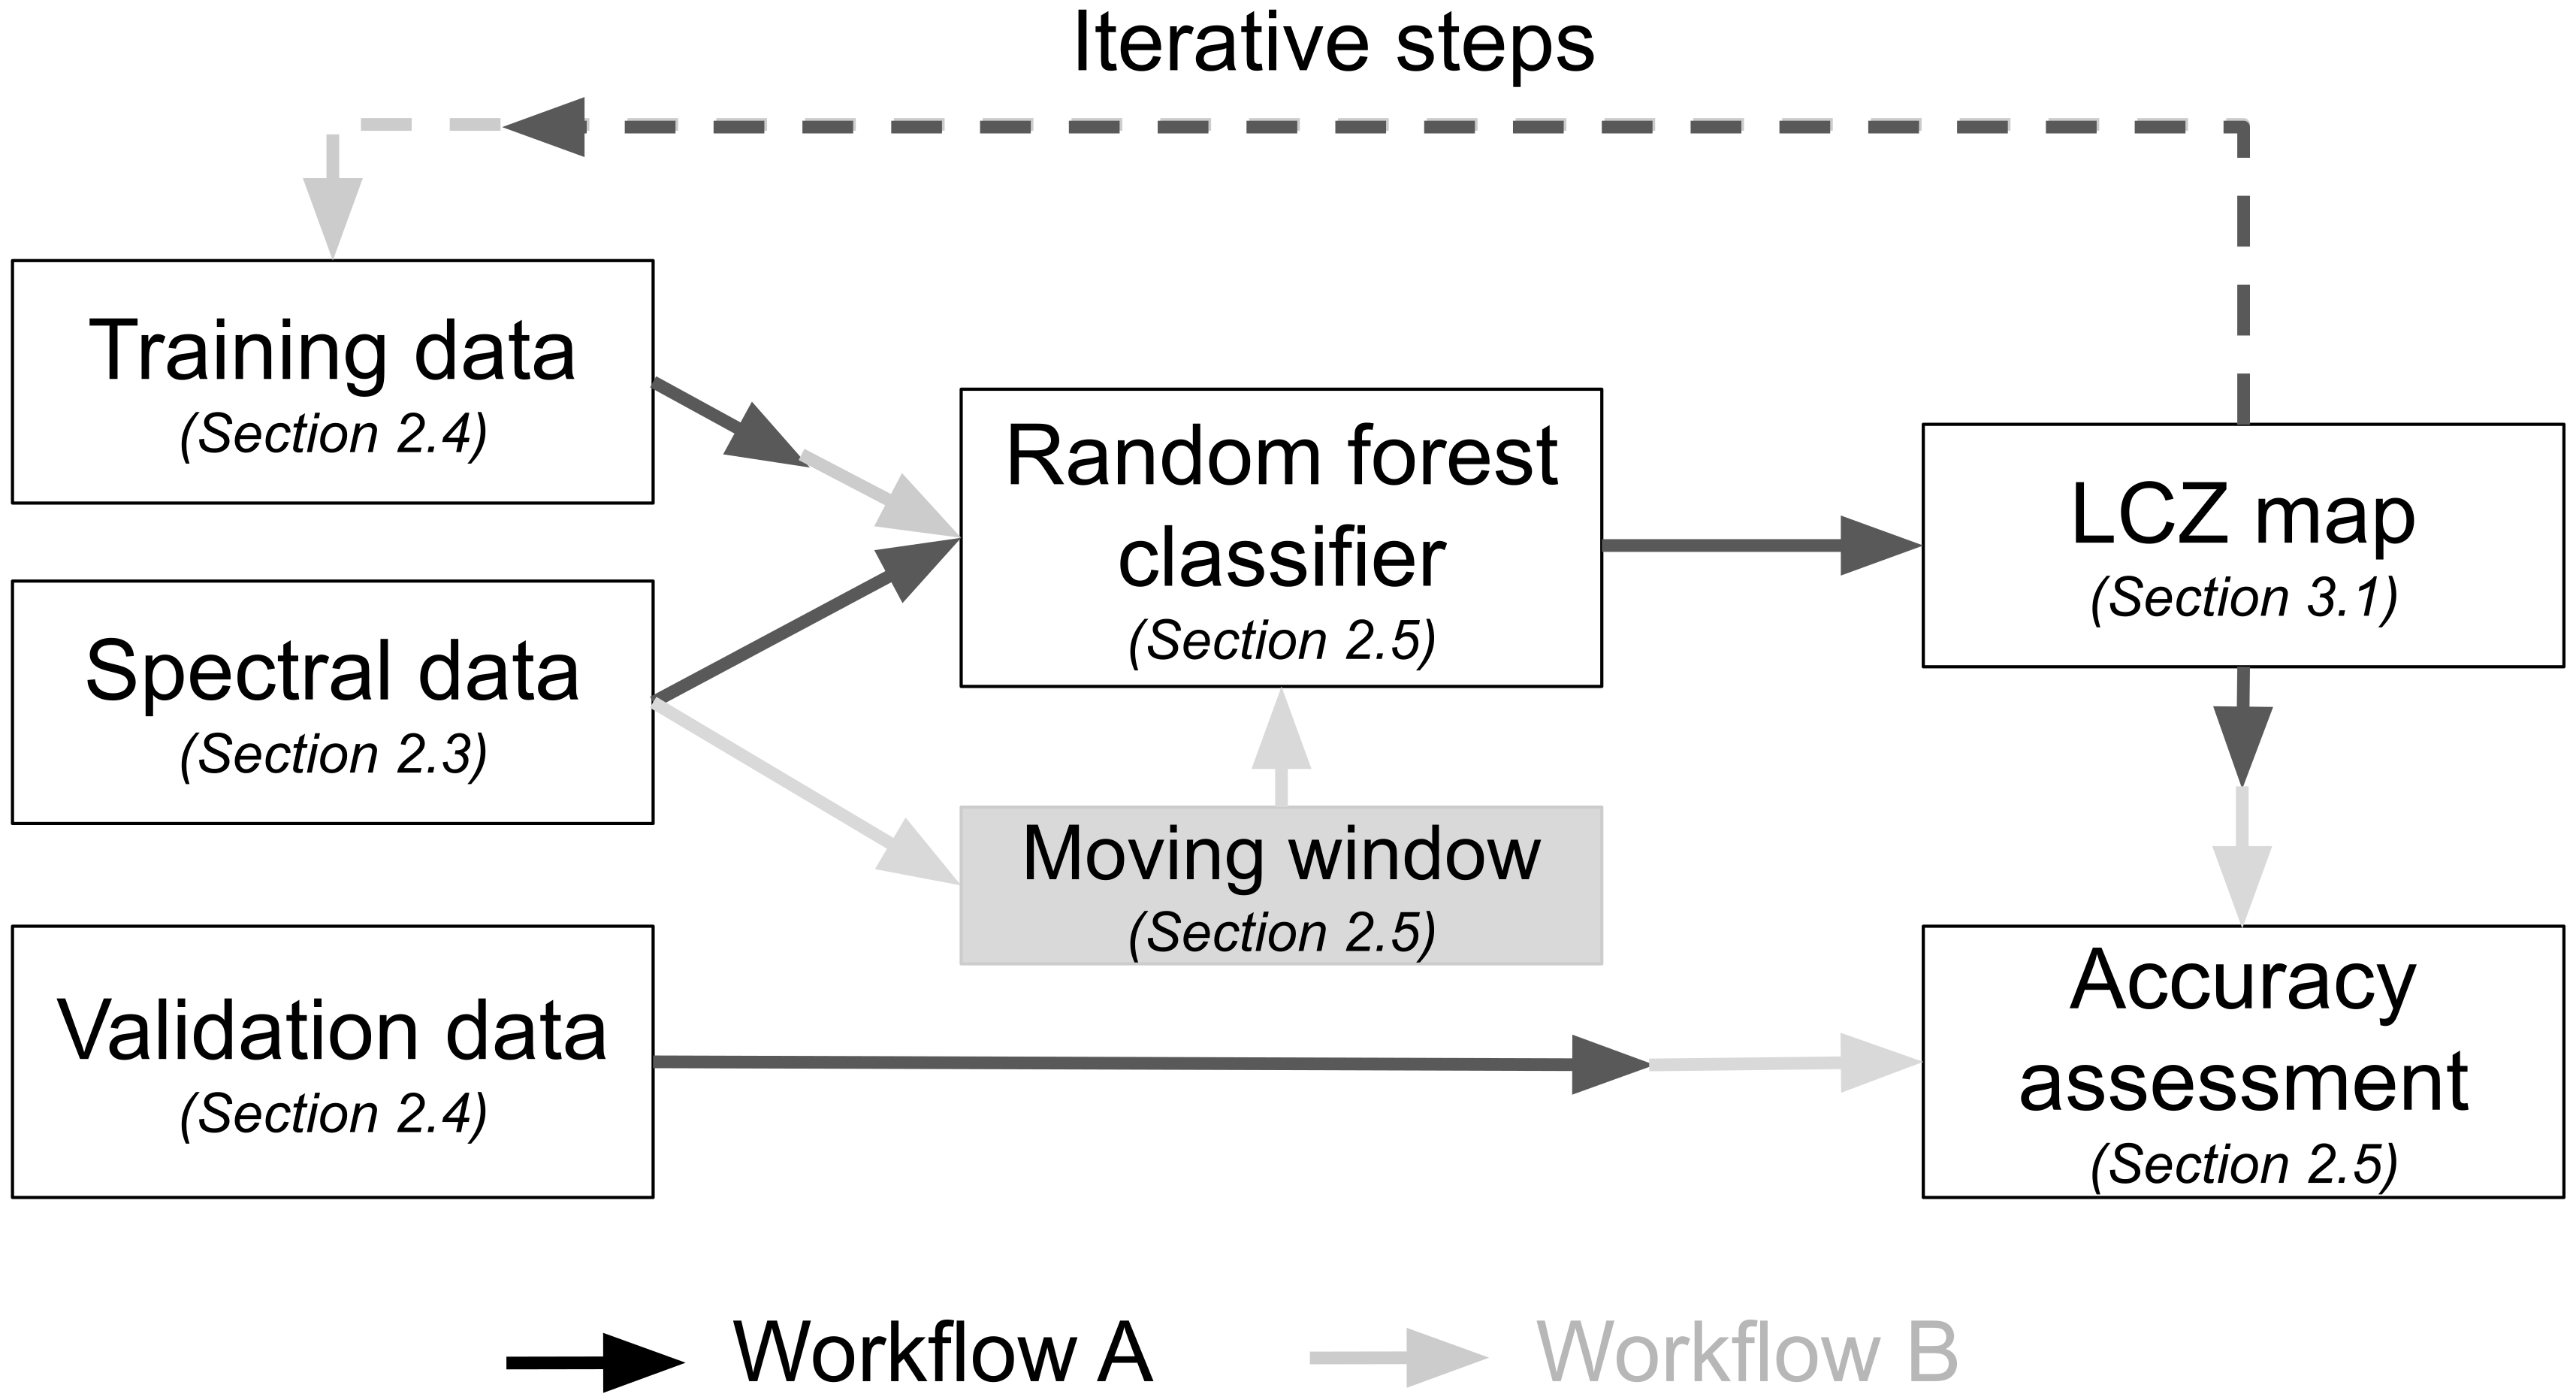
2.5. Classification Procedure and Its Adaptations

The default LCZ classification workflow consists out of the following steps [32]: (1) selection of Landsat images and resampling them from 30 m to 100 m spatial resolution, (2) performing a random-forest classification in SAGA and (3) accuracy assessment of the resulting LCZ maps (Figure 4, Workflow A).
Since this procedure was found to be suboptimal for cities characterised by small heterogeneous areas [34], Workflow B was applied here (Figure 4). Workflow B extends Workflow A in the following ways:
  • A first adaptation is applied on the first condition of the WUDAPT protocol, where training areas should be homogeneous polygons with a minimum surface area of 1 km 2 , because smaller surface areas would not be large enough to establish a local climate zone [32]. Since Kunming is characterised by heterogeneous areas, training areas of at least 1 km 2 were difficult to find, so many smaller, homogeneous areas were selected.
  • The second adaption takes neighbourhood information into account. This is not included in the original WUDAPT method causing loss of spectral variability due to the resampling of Landsat images to a 100 m resolution. Because of this, a contextual classifier was used that uses information from neighbouring 30 m pixels through a moving window [34]. This is a way to include horizontal heterogeneity. Multiple moving windows with different kernel sizes were used in order to select the most appropriate moving window per year (5 × 5, 7 × 7, 9 × 9 and 11 × 11 pixels, as was done in Verdonck et al. (2017) [34]).
  • A third adaptation concerns the accuracy assessment. For each kernel size, 10 random forest classifications were performed. These runs are evaluated by assessing the map accuracies on the pixels of an independent validation polygon set, using an error matrix. Independent validation polygons are selected on randomly selected pixels from training areas, in order to avoid a positive bias of neighbouring training and validation samples [34]. The error matrix computes the overall accuracy (OA) and provides an estimation of the accuracy of the classification result. The OA is the division of the correctly allocated validation pixels by the total amount of validation pixels. In addition, F1-scores are computed, which are the weighted averages of the user (UA) and producer accuracies (PA). The UA gives an idea about how often the LCZ on the map is actually the LCZ in real life, while the PA is the probability that a certain LCZ in real life is correctly classified. The class-wise F1-score for class i is calculated as F 1 i = 2 × U A i × P A i / ( U A i + P A i ) following [34,55,56,57]. In order to assess the robustness of the different classification methods, standard deviations (SD) on the OA and F1 are provided as well (see Table A1).

3. Results

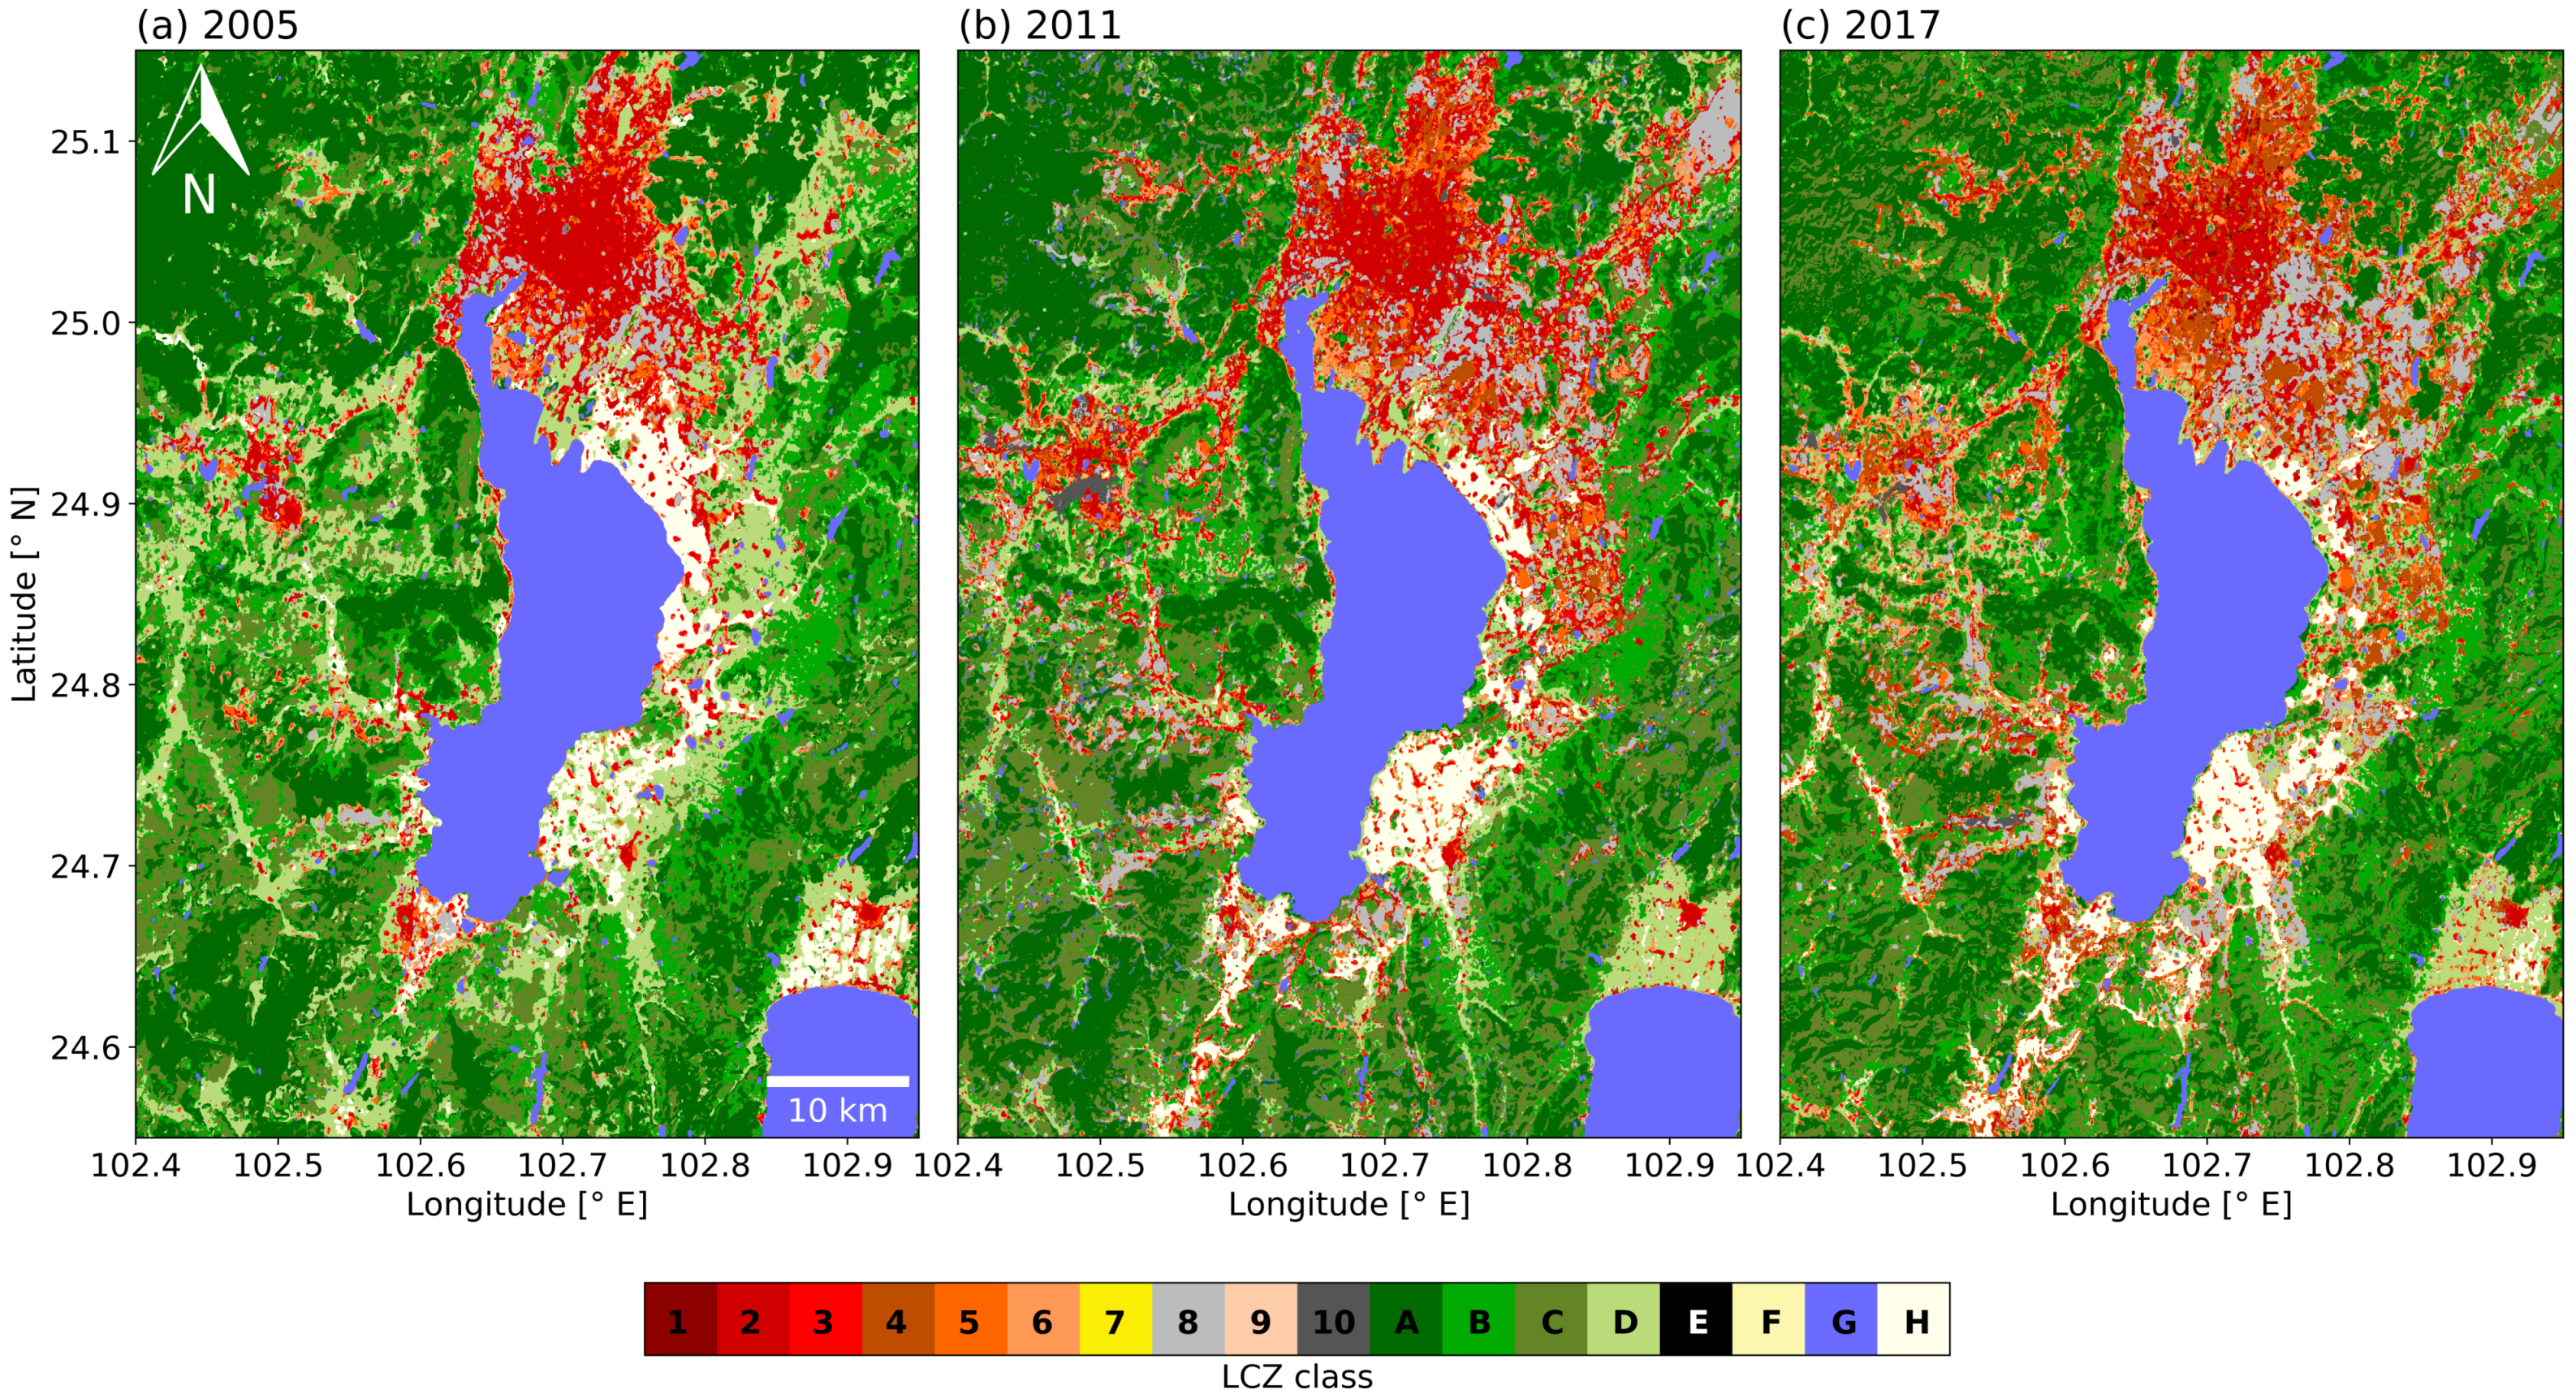
3.1. LCZ Maps: General Description and Accuracy

The final LCZ maps of 2005, 2011 and 2017 are shown in Figure 5. For the LCZ map of 2005, the highest OA with the lowest standard deviation (SD) was achieved using a kernel size of 9 × 9, while for the maps of 2011 and 2017 this was achieved using a kernel size of 5 × 5 and 7 × 7, respectively. Overall accuracies for the maps with the optimal kernel sizes were 97.7 ± 0.1, 96.7 ± 0.1 and 95.9 ± 0.1% for 2005, 2011, and 2017 respectively (see Table A1). The class-wise F1 accuracy results (for all years) reveals what is typically found in LCZ mapping experiments. Natural classes perform very well, with the F1 ranging from 60.4% (LCZ B—scattered trees in 2011) to 100% (LCZ G—water in 2011/2011). Quality of the urban classes was slightly more variable, with the highest confusion found for LCZ 3 (Compact low-rise), LCZ 5 (Open mid-rise) and LCZ 6 (Open low-rise). See Table A1 for more details on all accuracies. This is in line with previous results such as from “The Human Influence Experiment” (HUMINEX) [56,57] and is a limitation of the input feature space that is currently not able to detect height variations (see, e.g., discussion on page 12 of Reference [39]).
In Table 3, the area of every LCZ is shown for the different years. In addition, the total surface area (km 2 ) for all combined urban areas is provided. This indicates a strong urbanisation trend between 2005 and 2017, with an increase from 444.2 km 2 to 1245.5 km 2 in 2017. Note that the urbanisation rate decreased between 2011 and 2017 (1.4×) compared to the rate between 2005 and 2011 (1.9×). For all the different years, the centre of Kunming was mostly covered with compact mid-rise (LCZ 2) areas, while the southwest of the Dianchi lake had the most agricultural land (LCZ D and LCZ H), and the mountainous areas were largely covered with dense trees (LCZ A), scattered trees (LCZ B), and bush and scrubs (LCZ C). Small villages of compact mid-and low-rise areas (LCZs 2 and 3 respectively) are located between zones of low plants or agricultural greenhouses.

3.2. LCZ Changes between 2005 and 2017

Urban growth between 2005 and 2011 (Figure 5a,b, respectively) is seen in the northern, eastern, and southern directions from the city centre where natural LCZs were replaced by urban LCZs. Comparing 2011 (Figure 5b and Table 3) with 2005 reveals that the presence of open high-rise and open mid-rise (LCZ 5) areas is more pronounced in the outskirts of the city, and large low-rise (LCZ 8) areas are more abundant south of the city centre. Due to the construction of the airport in the northeastern part of Kunming, open mid-rise and large low-rise areas are present in this region and in toward it. On the eastern shores of Dianchi Lake, a mixture of compact mid-rise, open mid-rise, and large low-rise areas was found. Agricultural areas are less dominant compared to 2005. Heavy industry has increased a little, and is visible northwest of Dianchi lake and in the northern direction of the city centre.
Between 2011 and 2017 (Figure 5b,c, respectively), most LULCC consist of the conversion of urban LCZs to other urban LCZs. In addition, the urbanisation to the south is more pronounced. In 2017 (Figure 5c, Table 3), the presence of open high-rise areas has increased, and the presence of compact mid-rise areas has decreased in the outskirts of the city. Areas south of Kunming are getting more urbanised by open high-rise and open mid-rise areas. The areas east of the Dianchi lake presented an increase in open mid-rise areas, while the amount of compact mid-rise areas decreased.
Figure 6a,b expresses the area of each LCZ relative to the total area (all LCZs) and the total urban area (LCZs 1-10), respectively. The biggest LULCC is the conversion of low plants (LCZ D) to urban zones, whereas LCZ D decreased from 16.7% of the total area in 2005 to 9.1% in 2011 and to 6.2% in 2017 (Figure 6a). Other important changes are the increasing open high-rise (LCZ 4), open low-rise (LCZ 6), and large low-rise (LCZ 8) areas. Open high-rise areas increased from 16.7% of the urban area in 2011 to 21.1% in 2017, and large low-rise areas went from 16.2% of the urban area in 2005 to 26.1% in 2011 and to 35.7% in 2017 (Figure 6b). Furthermore, the presence of compact high-rise (LCZ 1) areas has become noticeable but is still fairly low (1.1% of the urban area; Figure 6b).
Besides the strong decrease of areas with low plants (LCZ D), other decreases are notable for compact low-rise (LCZ 3) and dense-tree (LCZ A) areas. Of the total urban area, compact low-rise (LCZ 3) areas decreased from 11.4% in 2005 to 4.1% in 2011, and to 2.5% in 2017 (Figure 6b), and dense-tree (LCZ A) areas decreased from 31.8% of the total area in 2005 to 28.1% in 2011, and to 26.6% in 2017 (Figure 6a). Open mid-rise (LCZ 6) areas increased in total surface area over the 2005–2017 period (Figure 6a), but decreased in percentage relative to the total urban area (Figure 6b), which means that the total area of the LCZ did have a smaller increase compared to the increase of the total urban area. Compact mid-rise (LCZ 2) areas were characterised by a strong decrease relative to the total urban area (from 44.5% in 2005 to 30.3% in 2011, and to 12.1% in 2017; Figure 6b). In contrast, this zone showed an increase relative to the total area between 2005 and 2011 (4.6% to 5.8%; Figure 6a) and a decrease between 2011 and 2017 (5.8% to 3.2%; Figure 6a). To compare Figure 6a,b, the increase in total urban area should be taken into account since it increases over time. For LCZ 2, this means that, between 2005 and 2011, the total area of LCZ 2 increased, but not to the same extent as the urban area, which could be confirmed by looking at Table 3. Between 2011 and 2017, the total area of LCZ 2 decreased, while total urban area further increased, resulting in a decrease in percentage of LCZ 2, both compared to the total area and total urban area.

4. Discussion

4.1. Period between 2005 and 2011

Between 2005 and 2011, urban growth with regard to the centre of Kunming was established in the northwestern, eastern, and southern parts, which were led by urbanisation policies and socioeconomic, topographic, and proximity factors [11]. The biggest LULCC in this period relates to the conversion of agricultural land to urban LCZs. This can be explained by rural-to-urban migration, where Chinese farmers move to the city that, in effect, causes agricultural land to decrease. Since accommodation is needed for these migrants, urban areas increase at the expense of rural areas, in line with the findings of Gong et al. (2012) [7] for other parts of China. Urbanisation in the northwestern part could have been the result of the World Expo in 1999, which stimulated the progress of suburbanisation of residential housing [58], a high-tech industrial development zone, and the agglomeration of Anning with Kunming. In 2005, the west of Dianchi lake (Anning) was mostly covered with agricultural land (LCZ D and LCZ H), and compact mid-rise (LCZ 2) and compact low-rise (LCZ 3) areas. By 2011, agglomeration with Kunming was visible and most of the farmland had been converted into urban LCZs. In the northeastern part of the city, the settlement of Changshui Airport in 2012 led to the conversion of agricultural land to urban areas. Before the settlement of the airport, the region in the southeastern part of the city centre was mostly covered with rural villages (LCZ 2 and LCZ 3) and agricultural land (low plants; LCZ D). In 2011, the airport was under construction and classified as a large low-rise (LCZ 8) area, and the direction to the airport was densified with mostly large low-rise (LCZ 8) and open mid-rise (LCZ 5) areas. These zones represent warehouses, a nearby wood factory, and (touristic) residences.

4.2. Period between 2011 and 2017

Between 2011 and 2017, there was both expansion and densification (Figure 5b,c). The expansion was generally noticeable in the east and south of Kunming, and was a result of both agglomeration and the settlement of the airport. The expansion causes areas with agricultural land (LCZ D and LCZ H), and compact low-rise (LCZ 3) and compact mid-rise (LCZ 2) areas to decrease because of the conversion of rural villages to high- and mid-rise apartment buildings (LCZs 1, 4, and 5) or suburbs (LCZ 6). New compact low-rise (LCZ 3) areas are rare since these zones cannot provide plentiful residences compared to taller buildings of high- and mid-rise LCZ classes. Aside from the expansion, there was densification in already existing urban areas, for example, in the western region where open high-rise (LCZ 4) and open mid-rise (LCZ 5) areas were replaced with, or were added to, the already existing compact mid-rise (LCZ 2) areas. This densification is the result of the new model of urbanisation in China. Through densification and more compact neighbourhoods, the “compact-city” approach of the urbanisation model wants to counteract the negative effects of urban sprawl, such as ineffective land use and environmental problems [59]. It also conserves farmland, which is becoming more important in China, since the current available amount of farmland is close to the “red line” of 120 million hectares, which is considered to be the minimum area necessary to ensure food security [60]. Decreased reduction of agricultural land was noticeable in Kunming (Figure 6a and Table 3). Densification of urban areas also enhances economic efficiency, and reduces carbon emissions and infrastructural costs [60,61,62].
Urbanisation in the eastern part of Kunming is mostly the result of the establishment of the new airport, Changshui, which officially opened in 2012. Changshui Airport is the fourth largest airport in China and it connects Kunming to primary cities in Asia [58]. Because of this, the airport has significantly promoted urbanisation and tourism in Yunnan Province [63]. Urbanisation to the south can mostly be explained by the Kunming-Yuxi integration in 2011, which was affected by topographic factors, such as Dianchi lake and the mountains. The biggest LULCC in the south was the conversion of agricultural land into urban LCZs. Open high-rise (LCZ 4), open mid-rise (LCZ 5), and large low-rise (LCZ 8) areas have especially been built there. The establishment of LCZs 4 and 5 to the south of the centre was probably due to the combination of the Kunming-Yuxi integration [11], the new planning framework [58] and the need for more compact and green residences. The increase of large low-rise (LCZ 8) areas to the south of the centre could be the result of new businesses driven by industrialisation and economic growth.
Especially for 2017, open high-rise (LCZ 4) areas were more commonly seen in the centre. This can be due to a combination of expansion, densification and creating a greener environment. Expansion and densification are necessary because of increasing population and less available land. Because of this, apartment buildings with more floors are desired. The choice for LCZs with a larger pervious fraction and thus more green is the result of more awareness of the need for a better living environment [64], especially in terms of air quality. Urban green infrastructure is, in that respect, known for its multiple advantages (e.g., References [65,66]). It provides ecosystem services that improve the quality of the environment and human life, support the conservation of energy, remove air pollutants, sequestrate CO 2 , and reduce stormwater runoff. It also provides aesthetic benefits, cognitive development, and social and psychological benefits, while at the same time potentially increasing real-estate values by increasing attractiveness and recreational opportunities [65,66,67,68,69]. Despite the attempt to add more open LCZs to the city centre, it should be noticed that most of the city centre is covered by compact mid-rise areas. Adding and replacing compact zones by open LCZs is necessary to reach climate-sensitive urban design. Nevertheless, it is important to pay attention to existing buildings as well. For existing urban forms, the best way to manage urban-climate effects on all scales is to increase vegetative cover and add natural landscape features into the current urban design [15]. Other measures include green facades [65,70], building materials with higher albedo, reducing anthropogenic heat release, and integrating more previous surfaces [71,72].

4.3. Implications of Land-Cover Changes

As a result of land-cover changes, urban expansion, and densification, changes in the thermal climate of the city are inevitable. Urbanisation is, in general, responsible for higher surface temperatures due to a larger degree of impervious surfaces, increasing anthropogenic heat and built-up areas [33,43,47,73]. Areas with higher LSTs have the possibility to increase Surface UHI (SUHI) intensity, while areas with lower LSTs can lower SUHI intensities [74]. Moreover, Bechtel et al. (2019) [33] have shown that LCZs provide a promising framework for consistent and comprehensive SUHI analysis, providing substantial SUHI variability between LCZ classes. On top of that, numerous studies have shown the relevance of LCZ types to Canopy UHI (CUHI), as well as their potential as a heat-risk assessment tool [75,76,77,78,79]. Dynamic LCZ maps, as such, provide a first proxy of relating planning policies to the thermal characteristics of neighbourhoods, thereby contributing to the creation of sustainable cities. In Kunming’s current planning strategies, attempts are being made to limit the increase of (S)UHI and to achieve more sustainable urbanisation by focusing on more open building zones and more greenery in the city (e.g., 37 new green parks in Kunming [80]). In addition, promoting electric cars, green roofs [81] and decreasing polluting industries [82] are on the rise in China. However, given expected future population increases and projected climate change, it remains a challenge for Kunming to reach its current environmental goals [80,83,84,85].

5. Conclusions

Kunming was characterised by rapid urban expansion and changes in urban form between 2005 and 2017. In the period between 2005 and 2011, there was mostly a conversion of agricultural land into urban LCZs in order to expand the city for residences or industrial zones. Starting from 2011 onward, expansion rate decreased and the focus changed to densifying urban areas, where smaller plots with mixed land uses were built over larger homogeneous areas with only one land use or one built-up type. In addition, a conversion of low and compact building zones to higher and more open building zones was noticeable. This approach strives for a more compact and greener city, an observation that is supported by the increasing open high-rise (LCZ 4) and open mid-rise (LCZ 5) areas. Next to more compact and green residences, large low-rise (LCZ 8) areas increased due to increased industrialisation in the city.
These spatiotemporal LCZ dynamics are a result of the implementation of an urban planning policy that aims to achieve a more sustainable urban living environment. New building areas consist of more open zones with higher buildings and new parks are being implemented in the city, but the centre of the city still needs attention. Compact zones, buildings with mixed heights, narrow streets, and non-permeable surfaces still dominate the city centre, which prevents those areas from achieving good air, solar, runoff, temperature, and wind-control quality.
This study clearly demonstrates that the LCZ framework can be used to (1) characterise spatiotemporal land-use and land-cover dynamics, (2) assess those in relation to past and present urban-planning strategies and policies, and (3) provide a simple framework to monitor those changes and transfer/translate them to city practitioners, allowing them to form rational urban-planning strategies toward the sustainable development of cities. When this information is overlain with numerous LCZ applications on, for example, the thermal environment, it provides a powerful tool for urban practitioners to design more liveable cities in the future. The urgency for such tools is becoming increasingly clear, as both urban contributions to climate mitigation and adaptation, as well as the impact of climate change on urban residents [86], become more significant.

Author Contributions

F.V.C., M.-L.V. and S.V. designed the study. S.V. performed the analysis. F.V.C., M.-L.V., M.D. and Z.Z. supervised the study. S.V. and M.D. made all visualisations. M.D. led the review and editing. All co-authors contributed to the writing of the manuscript and the discussion and interpretation of the methods and results.

Funding

This research received funding in the form of a student travel grant from the Scientific Research Commission of the Faculty of Bio-science Engineering, Ghent University.

Acknowledgments

We thank Zhiming Zhang and his team for guidance and assistance during the field survey.

Conflicts of Interest

The authors declare no conflict of interest.

Appendix A

Table A1. Overall accuracies (%) and F1-scores (%) of the LCZ maps with kernel size 5 × 5, 7 × 7, 9 × 9 and 11 × 11 for 2005, 2011 and 2017. The accuracy metrics for the kernel sizes with the largest OA score per year are indicated in bold.
5 × 57 × 79 × 911 × 11
2015OA (%) 96.9 ± 0.297.4 ± 0.197.7 ± 0.197.3 ± 0.1
F1 Measure (%)LCZ 2 Compact mid-rise73.3 ± 2.275.6 ± 1.879.0 ± 2.074.6 ± 1.5
LCZ 3 Compact low-rise47.2 ± 2.947.6 ± 2.848.3 ± 4.140.2 ± 5.3
LCZ 4 Open high-rise63.1 ± 2.062.9 ± 2.261.1 ± 2.156.4 ± 2.4
LCZ 5 Open mid-rise83.9 ± 1.763.9 ± 3.867.4 ± 2.172.4 ± 4.3
LCZ 6 Open low-rise88.3 ± 1.285.1 ± 1.685.7 ± 2.781.4 ± 2.1
LCZ A Dense trees98.9 ± 0.199.3 ± 0.099.4 ± 0.199.5 ± 0.0
LCZ B Scattered trees74.3 ± 2.575.8 ± 2.880.5 ± 2.174.3 ± 3.6
LCZ C Bush, scrub60.3 ± 1.262.3 ± 0.867.0 ± 3.466.2 ± 5.2
LCZ D Low plants64.7 ± 2.867.1 ± 3.375.1 ± 2.573.4 ± 1.6
LCZ G Water99.9 ± 0.099.9 ± 0.099.9 ± 0.099.9 ± 0.0
LCZ H Agricultural greenhouse92.4 ± 0.993.0 ± 1.095.7 ± 0.794.6 ± 0.4
2011OA (%) 96.8 ± 0.196.7 ± 0.196.5 ± 0.196.3 ± 0.2
F1 Measure (%)LCZ 2 Compact mid-rise73.2 ± 1.077.6 ± 0.778.0 ± 0.877.3 ± 0.9
LCZ 3 Compact low-rise54.5 ± 2.555.8 ± 1.254.3 ± 1.851.4 ± 2.2
LCZ 4 Open high-rise75.4 ± 0.977.2 ± 0.776.9 ± 1.074.8 ± 1.3
LCZ 5 Open mid-rise57.6 ± 0.756.4 ± 1.156.1 ± 1.557.9 ± 1.4
LCZ 6 Open low-rise60.8 ± 2.456.8 ± 1.756.2 ± 1.655.2 ± 1.8
LCZ 8 Large low-rise89.0 ± 1.491.4 ± 0.492.3 ± 0.692.1 ± 0.8
LCZ 10 Heavy industry68.8 ± 0.460 ± 0.258.0 ± 0.556.3 ± 0.8
LCZ A Dense trees98.9 ± 0.299.4 ± 0.199.6 ± 0.299.5 ± 0.2
LCZ B Scattered trees60.4 ± 1.468.2 ± 2.065.4 ± 1.863.3 ± 1.9
LCZ C Bush, scrub70.0 ± 3.372.5 ± 1.471.8 ± 2.570.9 ± 3.0
LCZ D Low plants86.6 ± 2.283.2 ± 2.882.0 ± 2.879.0 ± 3.2
LCZ G Water100.0 ± 0.0100.0 ± 0.0100.0 ± 0.0100.0 ± 0.0
LCZ H Agricultural greenhouse96.9 ± 0.795.5 ± 0.996.7 ± 0.895.3 ± 1.1
2017OA (%) 95.8 ± 0.195.9 ± 0.195.7 ± 0.195.4 ± 0.2
F1 Measure (%)LCZ 1 Compact high-rise74.8 ± 1.278.0 ± 0.878.0 ± 0.771.8 ± 2.2
LCZ 2 Compact mid-rise86.6 ± 0.484.4 ± 0.684.1 ± 0.583.0 ± 0.9
LCZ 3 Compact low-rise61.3 ± 0.867.8 ± 2.350.5 ± 3.156.9 ± 4.0
LCZ 4 Open high-rise77.4 ± 0.376.7 ± 0.874.4 ± 0.669.9 ± 0.7
LCZ 5 Open mid-rise45.1 ± 1.045.3 ± 2.548.1 ± 2.143.0 ± 3.6
LCZ 6 Open low-rise56.7 ± 1.350.6 ± 1.549.9 ± 1.849.1 ± 1.2
LCZ 8 Large low-rise90.7 ± 0.993.8 ± 0.492.4 ± 0.688.8 ± 0.8
LCZ 10 Heavy industry75.8 ± 3.563.2 ± 1.263.7 ± 9.450.7 ± 5.1
LCZ A Dense trees97.3 ± 0.298.2 ± 0.397.0 ± 0.596.0 ± 0.4
LCZ B Scattered trees60.8 ± 1.961.6 ± 4.552.8 ± 4.646.7 ± 4.8
LCZ C Bush, scrub80.9 ± 4.574.2 ± 3.860.6 ± 4.174.1 ± 4.9
LCZ D Low plants85.6 ± 2.683.5 ± 1.378.0 ± 2.472.1 ± 3.2
LCZ G Water100.0 ± 0.0100.0 ± 0.0100.0 ± 0.0100.0 ± 0.0
LCZ H Agricultural greenhouse96.7 ± 0.496.3 ± 0.396.9 ± 0.296.4 ± 0.1

References

  1. Grimm, N.B.; Faeth, S.H.; Golubiewski, N.E.; Redman, C.L.; Wu, J.; Bai, X.; Briggs, J.M. Global Change and the Ecology of Cities. Science 2008, 319, 756–760. [Google Scholar] [CrossRef] [PubMed] [Green Version]
  2. Wu, J.; Wei-Ning, X.; Zhao, J. Urban ecology in China: Historical developments and future directions. Landsc. Urban Plan. 2014, 125, 222–233. [Google Scholar] [CrossRef]
  3. Sun, Y.; Zhang, X.; Ren, G.; Zwiers, F.W.; Hu, T. Contribution of urbanization to warming in China. Nat. Clim. Chang. 2016, 6, 706. [Google Scholar] [CrossRef]
  4. Chow, G.C. Economic reform and growth in China. Ann. Econ. Financ. 2004, 152, 127–152. [Google Scholar]
  5. Luo, J.; Wei, Y.H.D. Modeling spatial variations of urban growth patterns in Chinese cities: The case of Nanjing. Landsc. Urban Plan. 2009, 91, 51–64. [Google Scholar] [CrossRef]
  6. Zhang, Q.; Su, S. Determinants of urban expansion and their relative importance: A comparative analysis of 30 major metropolitans in China. Habitat Int. 2016, 58, 89–107. [Google Scholar] [CrossRef]
  7. Gong, P.; Liang, S.; Carlton, E.J.; Jiang, Q.; Wu, J.; Wang, L.; Remais, J.V. Urbanisation and health in China. Lancet 2012, 379, 843–852. [Google Scholar] [CrossRef]
  8. Wang, Q.; Xu, Q.; Hong, L.; Peng, S. Extraction and Spatial-Temporal Analysis of Impervious Surfaces Expansion in Dianchi Lake Basin. In Proceedings of the 2018 26th International Conference on Geoinformatics (GEOINFORMATICS 2018), Kunming, China, 28–30 June 2018; Hu, S., Ye, X., Yang, K., Fan, H., Eds.; SuperMap Software Co Ltd.: Beijing, China; Beijing PIESAT Informat Technol Co Ltd.: Beijing, China; Yunnan Normal Univ: Kunming, China, 2018. [Google Scholar]
  9. Liu, M.; Zhang, Z.; Zhang, H.; Yang, M.; Song, D.; Ou, X. Spatial-temporal monitoring of urban growth: A case in Kunming, southwest China. Commun. Comput. Inf. Sci. 2016, 116–127. [Google Scholar] [CrossRef]
  10. Li, G.; Sun, S.; Fang, C. The varying driving forces of urban expansion in China: Insights from a spatial-temporal analysis. Landsc. Urban Plan. 2018, 174, 63–77. [Google Scholar] [CrossRef]
  11. Zhang, Z.; Wang, B.; Buyantuev, A.; He, X.; Gao, W.; Wang, Y.; Dawazhaxi; Yang, Z. Urban agglomeration of Kunming and Yuxi cities in Yunnan, China: the relative importance of government policy drivers and environmental constraints. Landsc. Ecol. 2019, 34, 663–679. [Google Scholar] [CrossRef]
  12. Qiyan, W.; Jianquan, C.; Dan, L.; Li, H.; Yuhong, Y. Kunming: A Regional International Mega City in Southwest China. In Urban Development Challenges, Risks and Resilience in Asian Mega Cities; Singh, R., Ed.; Springer: Tokyo, Japan, 2015; pp. 323–347. [Google Scholar]
  13. National Bureau of Statistics of China. China Statistical Yearbook; Chinese Statistical Bureau: Beijing, China, 2004; p. 62791819. Available online: http://www.stats.gov.cn/tjsj/ndsj/2007/indexee.htm (accessed on 15 June 2019).
  14. Fang, C.; Yu, D. Urban agglomeration: An evolving concept of an emerging phenomenon. Landsc. Urban Plan. 2017, 162, 126–136. [Google Scholar] [CrossRef]
  15. Oke, T.R.; Mills, G.; Christen, A.; Voogt, J.A. Urban Climates; Cambridge University Press: Cambridge, UK, 2017; pp. 1–525. [Google Scholar] [CrossRef]
  16. Singh, S.K.; Srivastava, P.K.; Gupta, M.; Thakur, J.K.; Mukherjee, S. Appraisal of land use/land cover of mangrove forest ecosystem using support vector machine. Environ. Earth Sci. 2014, 71, 2245–2255. [Google Scholar] [CrossRef]
  17. Yang, X.; Lo, C.P. Using a time series of satellite imagery to detect land use and land cover changes in the Atlanta, Georgia metropolitan area. Int. J. Remote Sens. 2002, 23, 1775–1798. [Google Scholar] [CrossRef]
  18. Yan, Z.W.; Wang, J.; Xia, J.J.; Feng, J.M. Review of recent studies of the climatic effects of urbanization in China. Adv. Clim. Chang. Res. 2016, 7, 154–168. [Google Scholar] [CrossRef]
  19. Wai PoTse, J.; ShingYeung, P.; Chi-HungFung, J.; Ren, C.; Wang, R.; Mau-Fong, M.; Cai, M. Investigation of the meteorological effects of urbanization in recent decades: A case study of major cities in Pearl River Delta. Urban Clim. 2018, 26, 174–187. [Google Scholar]
  20. Li, F. Physical activity and health in the presence of China’s economic growth: Meeting the public health challenges of the aging population. J. Sport Health Sci. 2016, 5, 258–269. [Google Scholar] [CrossRef] [PubMed]
  21. Zhang, B.; Liu, W. Planning history research in China: Past, present, and future. Plan. Perspect. 2018, 33, 113–124. [Google Scholar] [CrossRef]
  22. Cui, L.; Shi, J. Urbanization and its environmental effects in Shanghai, China. Urban Clim. 2012, 2, 1–15. [Google Scholar] [CrossRef] [Green Version]
  23. Xu, L.; Cui, S.; Tang, J.; Nguyen, M.; Liu, J.; Zhao, Y. Assessing the adaptive capacity of urban form to climate stress: a case study on an urban heat island. Environ. Res. Lett. 2019, 14, 044013. [Google Scholar] [CrossRef]
  24. Eliasson, I.; Knez, I.; Westerberg, U.; Thorsson, S.; Lindberg, F. Climate and behaviour in a Nordic city. Landsc. Urban Plan. 2007, 82, 72–84. [Google Scholar] [CrossRef]
  25. Coutts, A.M.; Daly, E.; Beringer, J.; Tapper, N.J. Assessing practical measures to reduce urban heat: Green and cool roofs. Build. Environ. 2013, 70, 266–276. [Google Scholar] [CrossRef]
  26. Acuto, M. Global science for city policy. Science 2018, 359, 165–166. [Google Scholar] [CrossRef] [PubMed]
  27. Creutzig, F.; Lohrey, S.; Bai, X.; Baklanov, A.; Dawson, R.; Dhakal, S.; Lamb, W.F.; McPhearson, T.; Minx, J.; Munoz, E.; et al. Upscaling urban data science for global climate solutions. Glob. Sustain. 2019, 2. [Google Scholar] [CrossRef] [Green Version]
  28. Ching, J.; Mills, G.; Bechtel, B.; See, L.; Feddema, J.; Wang, X.; Ren, C.; Brorousse, O.; Martilli, A.; Neophytou, M.; et al. WUDAPT: An urban weather, climate, and environmental modeling infrastructure for the anthropocene. Bull. Am. Meteorol. Soc. 2018, 99, 1907–1924. [Google Scholar] [CrossRef]
  29. Stewart, I.D.; Oke, T.R. Local climate zones for urban temperature studies. Bull. Am. Meteorol. Soc. 2012, 93, 1879–1900. [Google Scholar] [CrossRef]
  30. Middel, A.; Häb, K.; Brazel, A.J.; Martin, C.A.; Guhathakurta, S. Impact of urban form and design on mid-afternoon microclimate in Phoenix Local Climate Zones. Landsc. Urban Plan. 2014, 122, 16–28. [Google Scholar] [CrossRef]
  31. Wang, R.; Cai, M.; Ren, C.; Bechtel, B.; Xu, Y.; Ng, E. Detecting multi-temporal land cover change and land surface temperature in Pearl River Delta by adopting local climate zone. Urban Clim. 2019, 28, 100455. [Google Scholar] [CrossRef]
  32. Bechtel, B.; Alexander, P.; Böhner, J.; Ching, J.; Conrad, O.; Feddema, J.; Mills, G.; See, L.; Stewart, I. Mapping Local Climate Zones for a Worldwide Database of the Form and Function of Cities. ISPRS Int. J. Geo-Inf. 2015, 4, 199–219. [Google Scholar] [CrossRef] [Green Version]
  33. Bechtel, B.; Demuzere, M.; Mills, G. SUHI analysis using Local Climate Zones—A comparison of 50 cities. Urban Clim. 2019, 28, 100451. [Google Scholar] [CrossRef]
  34. Verdonck, M.L.; Okujeni, A.; Van der Linden, S.; Demuzere, M.; De Wulf, R.; Van Coillie, F. Influence of neighbourhood information on ‘Local Climate Zone’ mapping in heterogeneous cities. Int. J. Appl. Earth Obs. Geoinf. 2017, 62, 102–113. [Google Scholar] [CrossRef]
  35. Qiu, C.; Schmitt, M.; Mou, L.; Ghamisi, P.; Zhu, X.X. Feature Importance Analysis for Local Climate Zone Classification Using a Residual Convolutional Neural Network with Multi-Source Datasets. Remote Sens. 2018, 10, 1572. [Google Scholar] [CrossRef]
  36. Qiu, C.; Schmitt, M.; Ghamisi, P.; Mou, L.; Zhu, X.X. Feature importance analysis of Sentinel-2 imagery for large-scale urban local climate zone classification. In Proceedings of the IGARSS 2018—2018 IEEE International Geoscience and Remote Sensing Symposium, Valencia, Spain, 22–27 July 2018; pp. 4681–4684. [Google Scholar]
  37. Hu, J.; Ghamisi, P.; Zhu, X.X. Feature Extraction and Selection of Sentinel-1 Dual-Pol Data for Global-Scale Local Climate Zone Classification. ISPRS Int. J. Geo-Inf. 2018, 7, 379. [Google Scholar] [CrossRef]
  38. Hu, J.; Zhu, X.X. Exploring Sentinel-1 data for local climate zone classification. In Proceedings of the IGARSS 2018—2018 IEEE International Geoscience and Remote Sensing Symposium, Valencia, Spain, 22–27 July 2018; pp. 4677–4680. [Google Scholar]
  39. Demuzere, M.; Bechtel, B.; Mills, G. Global transferability of local climate zone models. Urban Clim. 2019, 27, 46–63. [Google Scholar] [CrossRef]
  40. Demuzere, M.; Bechtel, B.; Middel, A.; Mills, G. Mapping Europe into local climate zones. PLoS ONE 2019, 14, e0214474. [Google Scholar] [CrossRef] [PubMed]
  41. Bechtel, B.; Alexander, P.J.; Beck, C.; Böhner, J.; Brousse, O.; Ching, J.; Demuzere, M.; Fonte, C.; Gál, T.; Hidalgo, J.; et al. Generating WUDAPT Level 0 data—Current status of production and evaluation. Urban Clim. 2019, 27, 24–45. [Google Scholar] [CrossRef]
  42. Baklanov, A.; Grimmond, C.S.; Carlson, D.; Terblanche, D.; Tang, X.; Bouchet, V.; Lee, B.; Langendijk, G.; Kolli, R.K.; Hovsepyan, A. From urban meteorology, climate and environment research to integrated city services. Urban Clim. 2018, 23, 330–341. [Google Scholar] [CrossRef]
  43. Cai, M.; Ren, C.; Xu, Y.; Lau, K.K.L.; Wang, R. Investigating the relationship between local climate zone and land surface temperature using an improved WUDAPT methodology—A case study of Yangtze River Delta, China. Urban Clim. 2018, 24, 485–502. [Google Scholar] [CrossRef]
  44. Hidalgo, J.; Dumas, G.; Masson, V.; Petit, G.; Bechtel, B.; Bocher, E.; Foley, M.; Schoetter, R.; Mills, G. Comparison between local climate zones maps derived from administrative datasets and satellite observations. Urban Clim. 2019, 27, 64–89. [Google Scholar] [CrossRef]
  45. Maussion, F.; Tbridel; Schlump; Rothenberg, D. Fmaussion/Salem: v0.2.2; Zenodo: Geneva, Switzerland, 2018. [Google Scholar]
  46. Pachauri, R.K.; Allen, M.R.; Barros, V.R.; Broome, J.; Cramer, W.; Christ, R.; Church, J.A.; Clarke, L.; Dahe, Q.; Dasgupta, P.; et al. Climate Change 2014: Synthesis Report. Contribution of Working Groups I, II and III to the Fifth Assessment Report of the Intergovernmental Panel on Climate Change; EPIC3; IPCC: Geneva, Switzerland, 2014; p. 151. ISBN 978-92-9169-143-2. [Google Scholar]
  47. Geletič, J.; Lehnert, M.; Dobrovolný, P. Land surface temperature differences within local climate zones, Based on two central European cities. Remote Sens. 2016, 8, 788. [Google Scholar] [CrossRef]
  48. Scarano, M.; Sobrino, J.A. On the relationship between the sky view factor and the land surface temperature derived by Landsat-8 images in Bari, Italy. Int. J. Remote Sens. 2015, 36, 4820–4835. [Google Scholar] [CrossRef]
  49. Liu, S.; Qi, Z.; Li, X.; Yeh, A. Integration of Convolutional Neural Networks and Object-Based Post-Classification Refinement for Land Use and Land Cover Mapping with Optical and SAR Data. Remote Sens. 2019, 11, 690. [Google Scholar] [CrossRef]
  50. Simanjuntak, R.M.; Kuffer, M.; Reckien, D. Object-based image analysis to map local climate zones: The case of Bandung, Indonesia. Appl. Geogr. 2019, 106, 108–121. [Google Scholar] [CrossRef]
  51. Brousse, O.; Georganos, S.; Demuzere, M.; Vanhuysse, S.; Wouters, H.; Wolff, E.; Linard, C.; Van Lipzig, N.P.; Dujardin, S. Using Local Climate Zones in Sub-Saharan Africa to tackle urban health issues. Urban Clim. 2019, 27, 227–242. [Google Scholar] [CrossRef]
  52. Wang, C.; Middel, A.; Myint, S.W.; Kaplan, S.; Brazel, A.J.; Lukasczyk, J. Assessing local climate zones in arid cities: The case of Phoenix, Arizona and Las Vegas, Nevada. ISPRS J. Photogramm. Remote Sens. 2018, 141, 59–71. [Google Scholar] [CrossRef]
  53. Böhner, J.; Bock, M.; Wichmann, V.; Fischer, E.; Wehberg, J.; Conrad, O.; Bechtel, B.; Dietrich, H.; Gerlitz, L. System for Automated Geoscientific Analyses (SAGA) v. 2.1.4. Geosci. Model Dev. 2015, 8, 1991–2007. [Google Scholar] [CrossRef] [Green Version]
  54. Scaramuzza, P.; Micijevic, E.; Chander, G. SLC Gap-Filled Products Phase One Methodology. In Landsat Technical Notes; NASA: Washington, DC, USA, 2004; pp. 1–5. [Google Scholar]
  55. Sokolova, M.; Lapalme, G. A systematic analysis of performance measures for classification tasks. Inf. Process. Manag. 2009, 45, 427–437. [Google Scholar] [CrossRef]
  56. Bechtel, B.; Demuzere, M.; Sismanidis, P.; Fenner, D.; Brousse, O.; Beck, C.; Van Coillie, F.; Conrad, O.; Keramitsoglou, I.; Middel, A.; et al. Quality of Crowdsourced Data on Urban Morphology—The Human Influence Experiment (HUMINEX). Urban Sci. 2017, 1, 15. [Google Scholar] [CrossRef]
  57. Verdonck, M.L.; Demuzere, M.; Bechtel, B.; Beck, C.; Brousse, O.; Droste, A.; Fenner, D.; Leconte, F.; Van Coillie, F. The Human Influence Experiment (Part 2): Guidelines for Improved Mapping of Local Climate Zones Using a Supervised Classification. Urban Sci. 2019, 3, 27. [Google Scholar] [CrossRef]
  58. Wu, Q.; Cheng, J.; Liu, D.; Han, L.; Yang, Y. Kunming: A Regional International Mega City in Southwest China; Springer: Tokyo, Japan, 2014. [Google Scholar] [CrossRef]
  59. Haaland, C.; Van den Bosch, C.K. Challenges and Strategies for Urban Green-Space Planning in Cities Undergoing Densification: A Review; Elsevier: Amsterdam, The Netherlands, 2015. [Google Scholar] [CrossRef]
  60. The World Bank. Urban China: Toward Efficient, Inclusive, and Sustainable Urbanization; World Bank Publications: Washington, DC, USA, 2014; p. 111. [Google Scholar]
  61. Creutzig, F.; Baiocchi, G.; Bierkandt, R.; Pichler, P.P.; Seto, K.C. Global typology of urban energy use and potentials for an urbanization mitigation wedge. Proc. Natl. Acad. Sci. USA 2015, 112, 6283–6288. [Google Scholar] [CrossRef] [Green Version]
  62. Creutzig, F.; Agoston, P.; Minx, J.C.; Canadell, J.G.; Andrew, R.M.; Quéré, C.L.; Peters, G.P.; Sharifi, A.; Yamagata, Y.; Dhakal, S. Urban infrastructure choices structure climate solutions. Nat. Clim. Chang. 2016, 6, 1054. [Google Scholar] [CrossRef]
  63. Jian, H.; Pan, H.; Xiong, G.; Lin, X. The Impacts of Civil Airport layout to Yunnan Local Tourism Industry. Transp. Res. Procedia 2017, 25, 77–91. [Google Scholar] [CrossRef]
  64. Wang, R.; Tao, S.; Wang, W.; Liu, J.; Shen, H.; Shen, G.; Wang, B.; Liu, X.; Li, W.; Huang, Y.; et al. Black carbon emissions in China from 1949 to 2050. Environ. Sci. Technol. 2012, 46, 7595–7603. [Google Scholar] [CrossRef] [PubMed]
  65. Demuzere, M.; Orru, K.; Heidrich, O.; Olazabal, E.; Geneletti, D.; Orru, H.; Bhave, A.G.; Mittal, N.; Feliu, E.; Faehnle, M. Mitigating and adapting to climate change: Multi-functional and multi-scale assessment of green urban infrastructure. J. Environ. Manag. 2014, 146, 107–115. [Google Scholar] [CrossRef] [PubMed]
  66. Salmond, J.A.; Tadaki, M.; Vardoulakis, S.; Arbuthnott, K.; Coutts, A.; Demuzere, M.; Dirks, K.N.; Heaviside, C.; Lim, S.; MacIntyre, H.; et al. Health and climate related ecosystem services provided by street trees in the urban environment. Environ. Health 2016, 15, S36. [Google Scholar] [CrossRef] [PubMed]
  67. Armson, D.; Stringer, P.; Ennos, A.R. The effect of street trees and amenity grass on urban surface water runoff in Manchester, UK. Urban For. Urban Green. 2013, 12, 282–286. [Google Scholar] [CrossRef]
  68. McPherson, E.G.; Van Doorn, N.; De Goede, J. Structure, function and value of street trees in California, USA. Urban For. Urban Green. 2016, 17, 104–115. [Google Scholar] [CrossRef] [Green Version]
  69. Wang, X.; Yao, J.; Yu, S.; Miao, C.; Chen, W.; He, X. Street trees in a Chinese forest city: Structure, benefits and costs. Sustainability 2018, 10, 674. [Google Scholar] [CrossRef]
  70. Zölch, T.; Maderspacher, J.; Wamsler, C.; Pauleit, S. Using green infrastructure for urban climate-proofing: An evaluation of heat mitigation measures at the micro-scale. Urban For. Urban Green. 2016, 20, 305–316. [Google Scholar] [CrossRef]
  71. Meng, C. Mitigating the surface urban heat island: Mechanism study and sensitivity analysis. Asia-Pac. J. Atmos. Sci. 2017, 53, 327–338. [Google Scholar] [CrossRef]
  72. Ürge-Vorsatz, D.; Rosenzweig, C.; Dawson, R.J.; Sanchez Rodriguez, R.; Bai, X.; Barau, A.S.; Seto, K.C.; Dhakal, S. Locking in positive climate responses in cities. Nat. Clim. Chang. 2018, 8, 174–177. [Google Scholar] [CrossRef] [Green Version]
  73. Zhou, W.; Huang, G.; Cadenasso, M.L. Does spatial configuration matter? Understanding the effects of land cover pattern on land surface temperature in urban landscapes. Landsc. Urban Plan. 2011, 102, 54–63. [Google Scholar] [CrossRef]
  74. Zhao, C. Linking the local climate zones and land surface temperature to investigate the surface urban heat island, a case study of San Antonia, Texas, U.S. ISPRS Ann. Photogramm. Remote Sens. Spat. Inf. Sci. 2018, 4. [Google Scholar] [CrossRef]
  75. Alexander, P.J.; Mills, G. Local climate classification and Dublin’s urban heat island. Atmosphere 2014, 5, 755–774. [Google Scholar] [CrossRef]
  76. Stewart, I.D.; Oke, T.R.; Krayenhoff, E.S. Evaluation of the “local climate zone” scheme using temperature observations and model simulations. Int. J. Climatol. 2014, 34, 1062–1080. [Google Scholar] [CrossRef]
  77. Lehnert, M.; Geletič, J.; Husák, J.; Vysoudil, M. Urban field classification by “local climate zones” in a medium-sized Central European city: The case of Olomouc (Czech Republic). Theor. Appl. Climatol. 2015, 122, 531–541. [Google Scholar] [CrossRef]
  78. Fenner, D.; Meier, F.; Bechtel, B.; Otto, M.; Scherer, D. Intra and inter “local climate zone” variability of air temperature as observed by crowdsourced citizen weather stations in Berlin, Germany. Meteorol. Z. 2017, 26, 525–547. [Google Scholar] [CrossRef]
  79. Skarbit, N.; Stewart, I.D.; Unger, J.; Gál, T. Employing an urban meteorological network to monitor air temperature conditions in the ‘local climate zones’ of Szeged, Hungary. Int. J. Climatol. 2017, 37, 582–596. [Google Scholar] [CrossRef]
  80. Scally. Urban Re-Greening Effort to Include 37 New Kunming Parks; GoKunming: Kunming, China, 2017. [Google Scholar]
  81. Xiao, M.; Lin, Y.; Han, J.; Zhang, G. A review of green roof research and development in China. Renew. Sustain. Energy Rev. 2014, 40, 633–648. [Google Scholar] [CrossRef]
  82. Nace, T. China Shuts Down Tens of Thousands of Factories in Widespread Pollution Crackdown; Forbes: Jersey City, NJ, USA, 2017. [Google Scholar]
  83. Scally. How Bad Is Kunming’s Air? GoKunming: Kunming, China, 2013. [Google Scholar]
  84. Scally. River Diversion to Flush Pollution Out of Yunnan’s Dianchi Lake; GoKunming: Kunming, China, 2016. [Google Scholar]
  85. Verdonck, M.L.; Demuzere, M.; Hooyberghs, H.; Priem, F.; Van Coillie, F. Heat risk assessment for the Brussels capital region under different urban planning and greenhouse gas emission scenarios. J. Environ. Manag. 2019. accepted. [Google Scholar]
  86. Mora, C.; Dousset, B.; Caldwell, I.R.; Powell, F.E.; Geronimo, R.C.; Bielecki, C.R.; Counsell, C.W.; Dietrich, B.S.; Johnston, E.T.; Louis, L.V.; et al. Global risk of deadly heat. Nat. Clim. Chang. 2017, 7, 501. [Google Scholar] [CrossRef]
Figure 1. Larger Kunming area, with the Local Climate Zone (LCZ) region of interest in red. A, B, and C are respectively the centre, airport, and high-tech industrial development zone, respectively. Figure produced with [45].
Remotesensing 11 01731 g001
Figure 2. Abridged definitions for local climate zones [29]. ©American Meteorological Society. Used with permission.
Remotesensing 11 01731 g002
Figure 3. Examples of the different LCZs in Kunming.
Remotesensing 11 01731 g003
Figure 4. Overview of LCZ classification. Workflow A is default World Urban Database and Access Portal Tool (WUDAPT) protocol, while Workflow B is the modified workflow that uses a moving window to include neighbourhood information. Redesigned after Figure 3 in Reference [34]. Section numbers indicated in the boxes provide full overview of what is done in each step. Note that this procedure was repeated for years 2005, 2011, and 2017.
Remotesensing 11 01731 g004
Figure 5. LCZ maps for: (a) 2005 with kernel size 9 × 9, (b) 2011 with kernel size 5 × 5, and (c) 2017 with kernel size 7 × 7. Note that LCZ classes 7, 9, E, and F are not present in the maps.
Remotesensing 11 01731 g005
Figure 6. LCZ histograms for all years presenting the corresponding surface area (A) of each LCZ (A L C Z , i ) as the percentage of (a) the total surface area (A L C Z , a l l ) and (b) the total urban area ( L C Z , u r b a n ).
Remotesensing 11 01731 g006
Table 1. Landsat images information for the LCZ mapping.
Mapping PeriodLandsat Entity IDDate
2005LE07_L1TP_129043_20050406_20170116_01_T16 April 2005
LE07_L1TP_129043_20050201_20170116_01_T11 February 2005
LE07_L1TP_129043_20060103_20170111_01_T13 January 2006
2011LE07_L1TP_129043_20110306_20161209_01_T16 March 2011
LE07_L1TP_129043_20120120_20161203_01_T120 January 2012
LE07_L1TP_129043_20111117_20161205_01_T117 November 2011
2017LC08_L1TP_129043_20170109_20170311_01_T11 September 2017
LC08_L1TP_129043_20170314_20170328_01_T114 March 2017
LC08_L1TP_129043_20170501_20170515_01_T11 May 2017
LC08_L1TP_129043_20170109_20170311_01_T19 January 2017
Table 2. Number of training and validation polygons of each zone, for 2005, 2011, and 2017.
Training PolygonsValidation Polygons
200520112017200520112017
LCZ 1 Compact high-rise0010004
LCZ 2 Compact mid-rise242527111113
LCZ 3 Compact low-rise151216578
LCZ 4 Open high-rise011280412
LCZ 5 Open mid-rise131518766
LCZ 6 Open low-rise121319558
LCZ 8 Large low-rise2213191068
LCZ 10 Heavy industry01111055
LCZ A Dense trees2316161188
LCZ B Scattered trees151718777
LCZ C Bush, scrub1924208109
LCZ D Low plants252220121111
LCZ G Water141515777
LCZ H Agricultural greenhouse222221111111
Table 3. Total surface area (km 2 ) of each LCZ for the different years.
2005 (km 2 )2011 (km 2 )2017 (km 2 )
Urban LCZLCZ 1--13.6
LCZ 2197.5256.6150.6
LCZ 350.634.930.8
LCZ 4-82.6264.7
LCZ 560.573.5105.3
LCZ 663.7131.4215.1
LCZ 871.8221.2444.5
LCZ 10-46.220.9
Total urban area 444.2846.411245.5
Natural LCZLCZ A1402.41248.01260.5
LCZ B608.2582.3628.6
LCZ C590.4779.1696.6
LCZ D736.1402.6295.4
LCZ G467.3471.0475.4
LCZ H155.3119.2136.2

