Reflectance Properties of Hemiboreal Mixed Forest Canopies with Focus on Red Edge and Near Infrared Spectral Regions


Abstract
1. Introduction
2. Material and Methods
3. Results
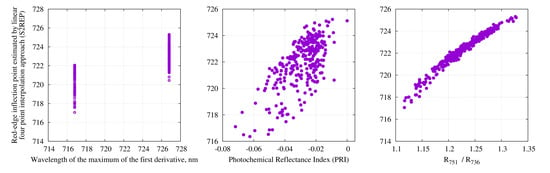
3.1. Comparison of Different Methods to Calculate Red-Edge Inflection Point
3.2. Correlation Between Single Band Reflectance Factors and Spectral Transformations
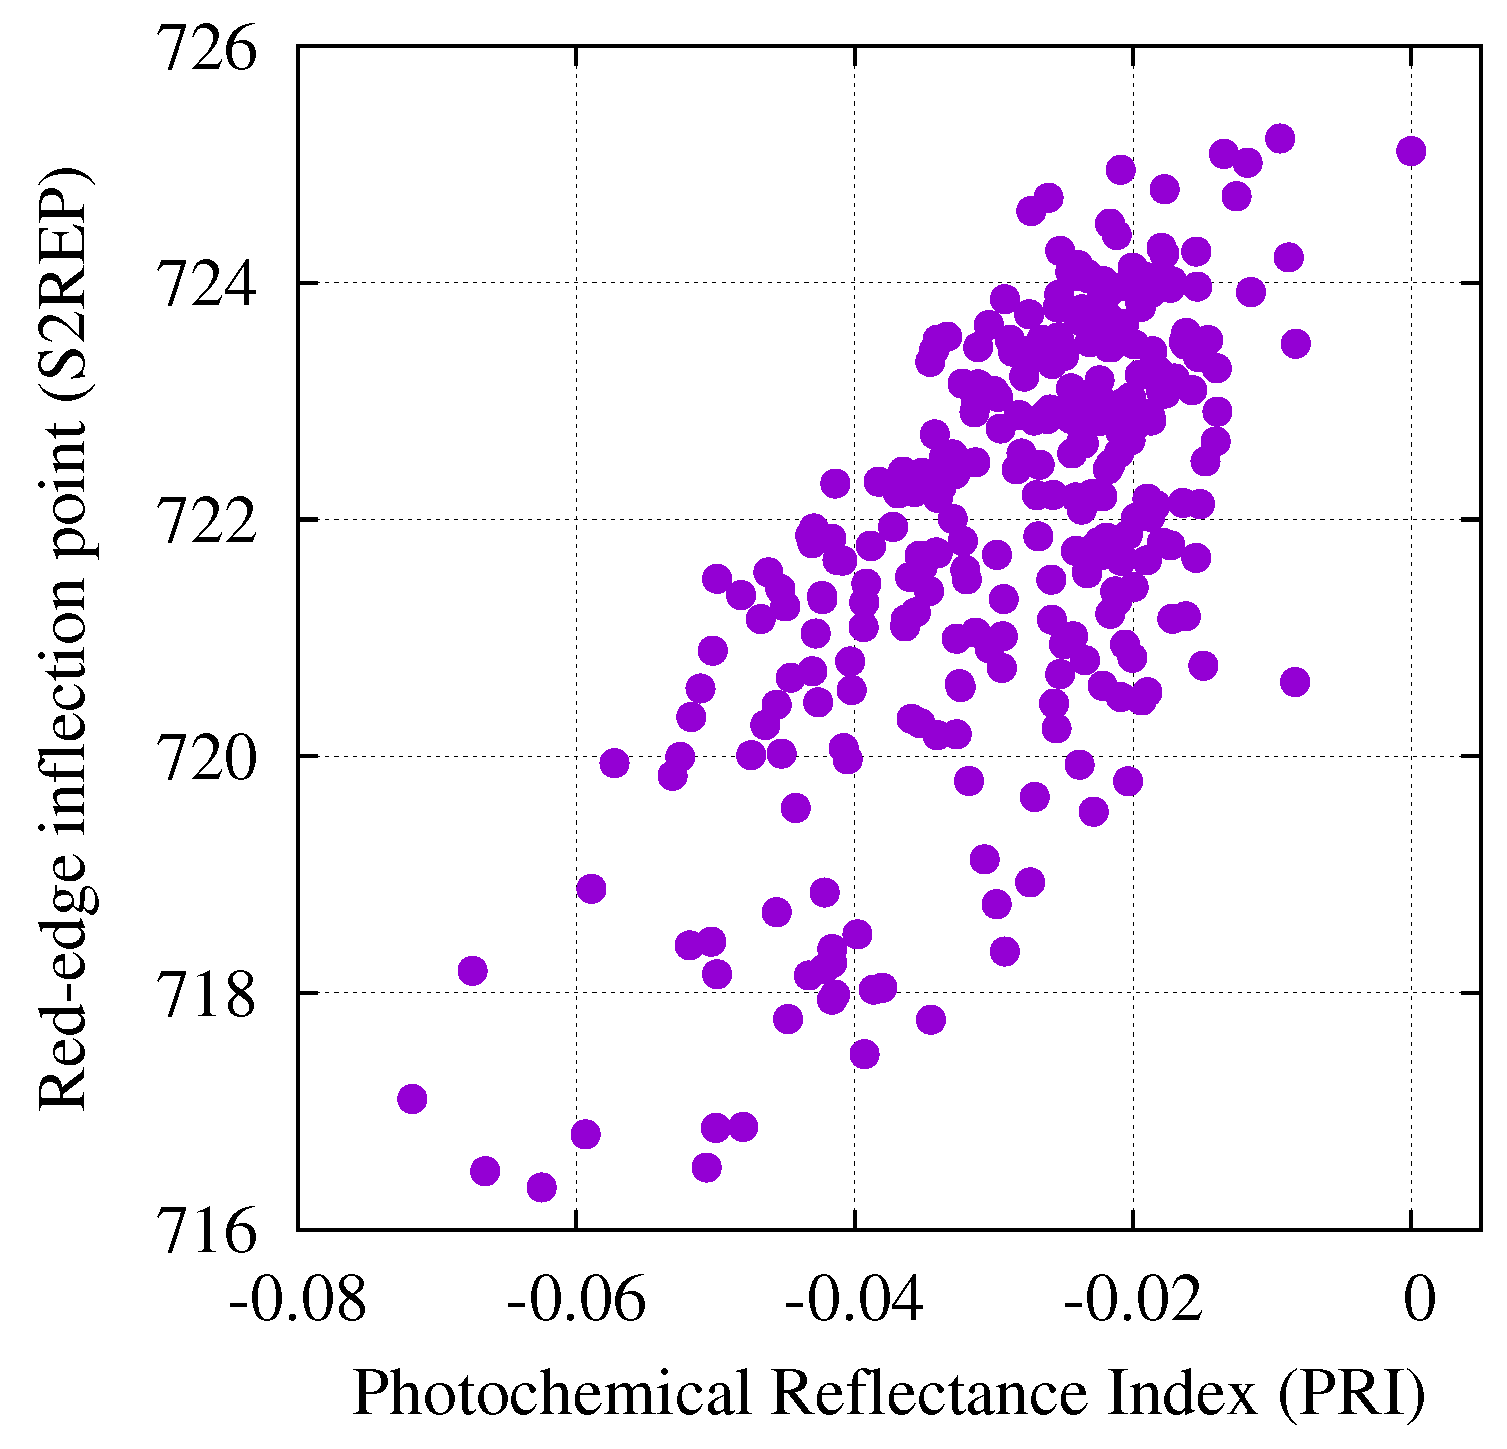
3.3. Relationships Between Spectral Transformations
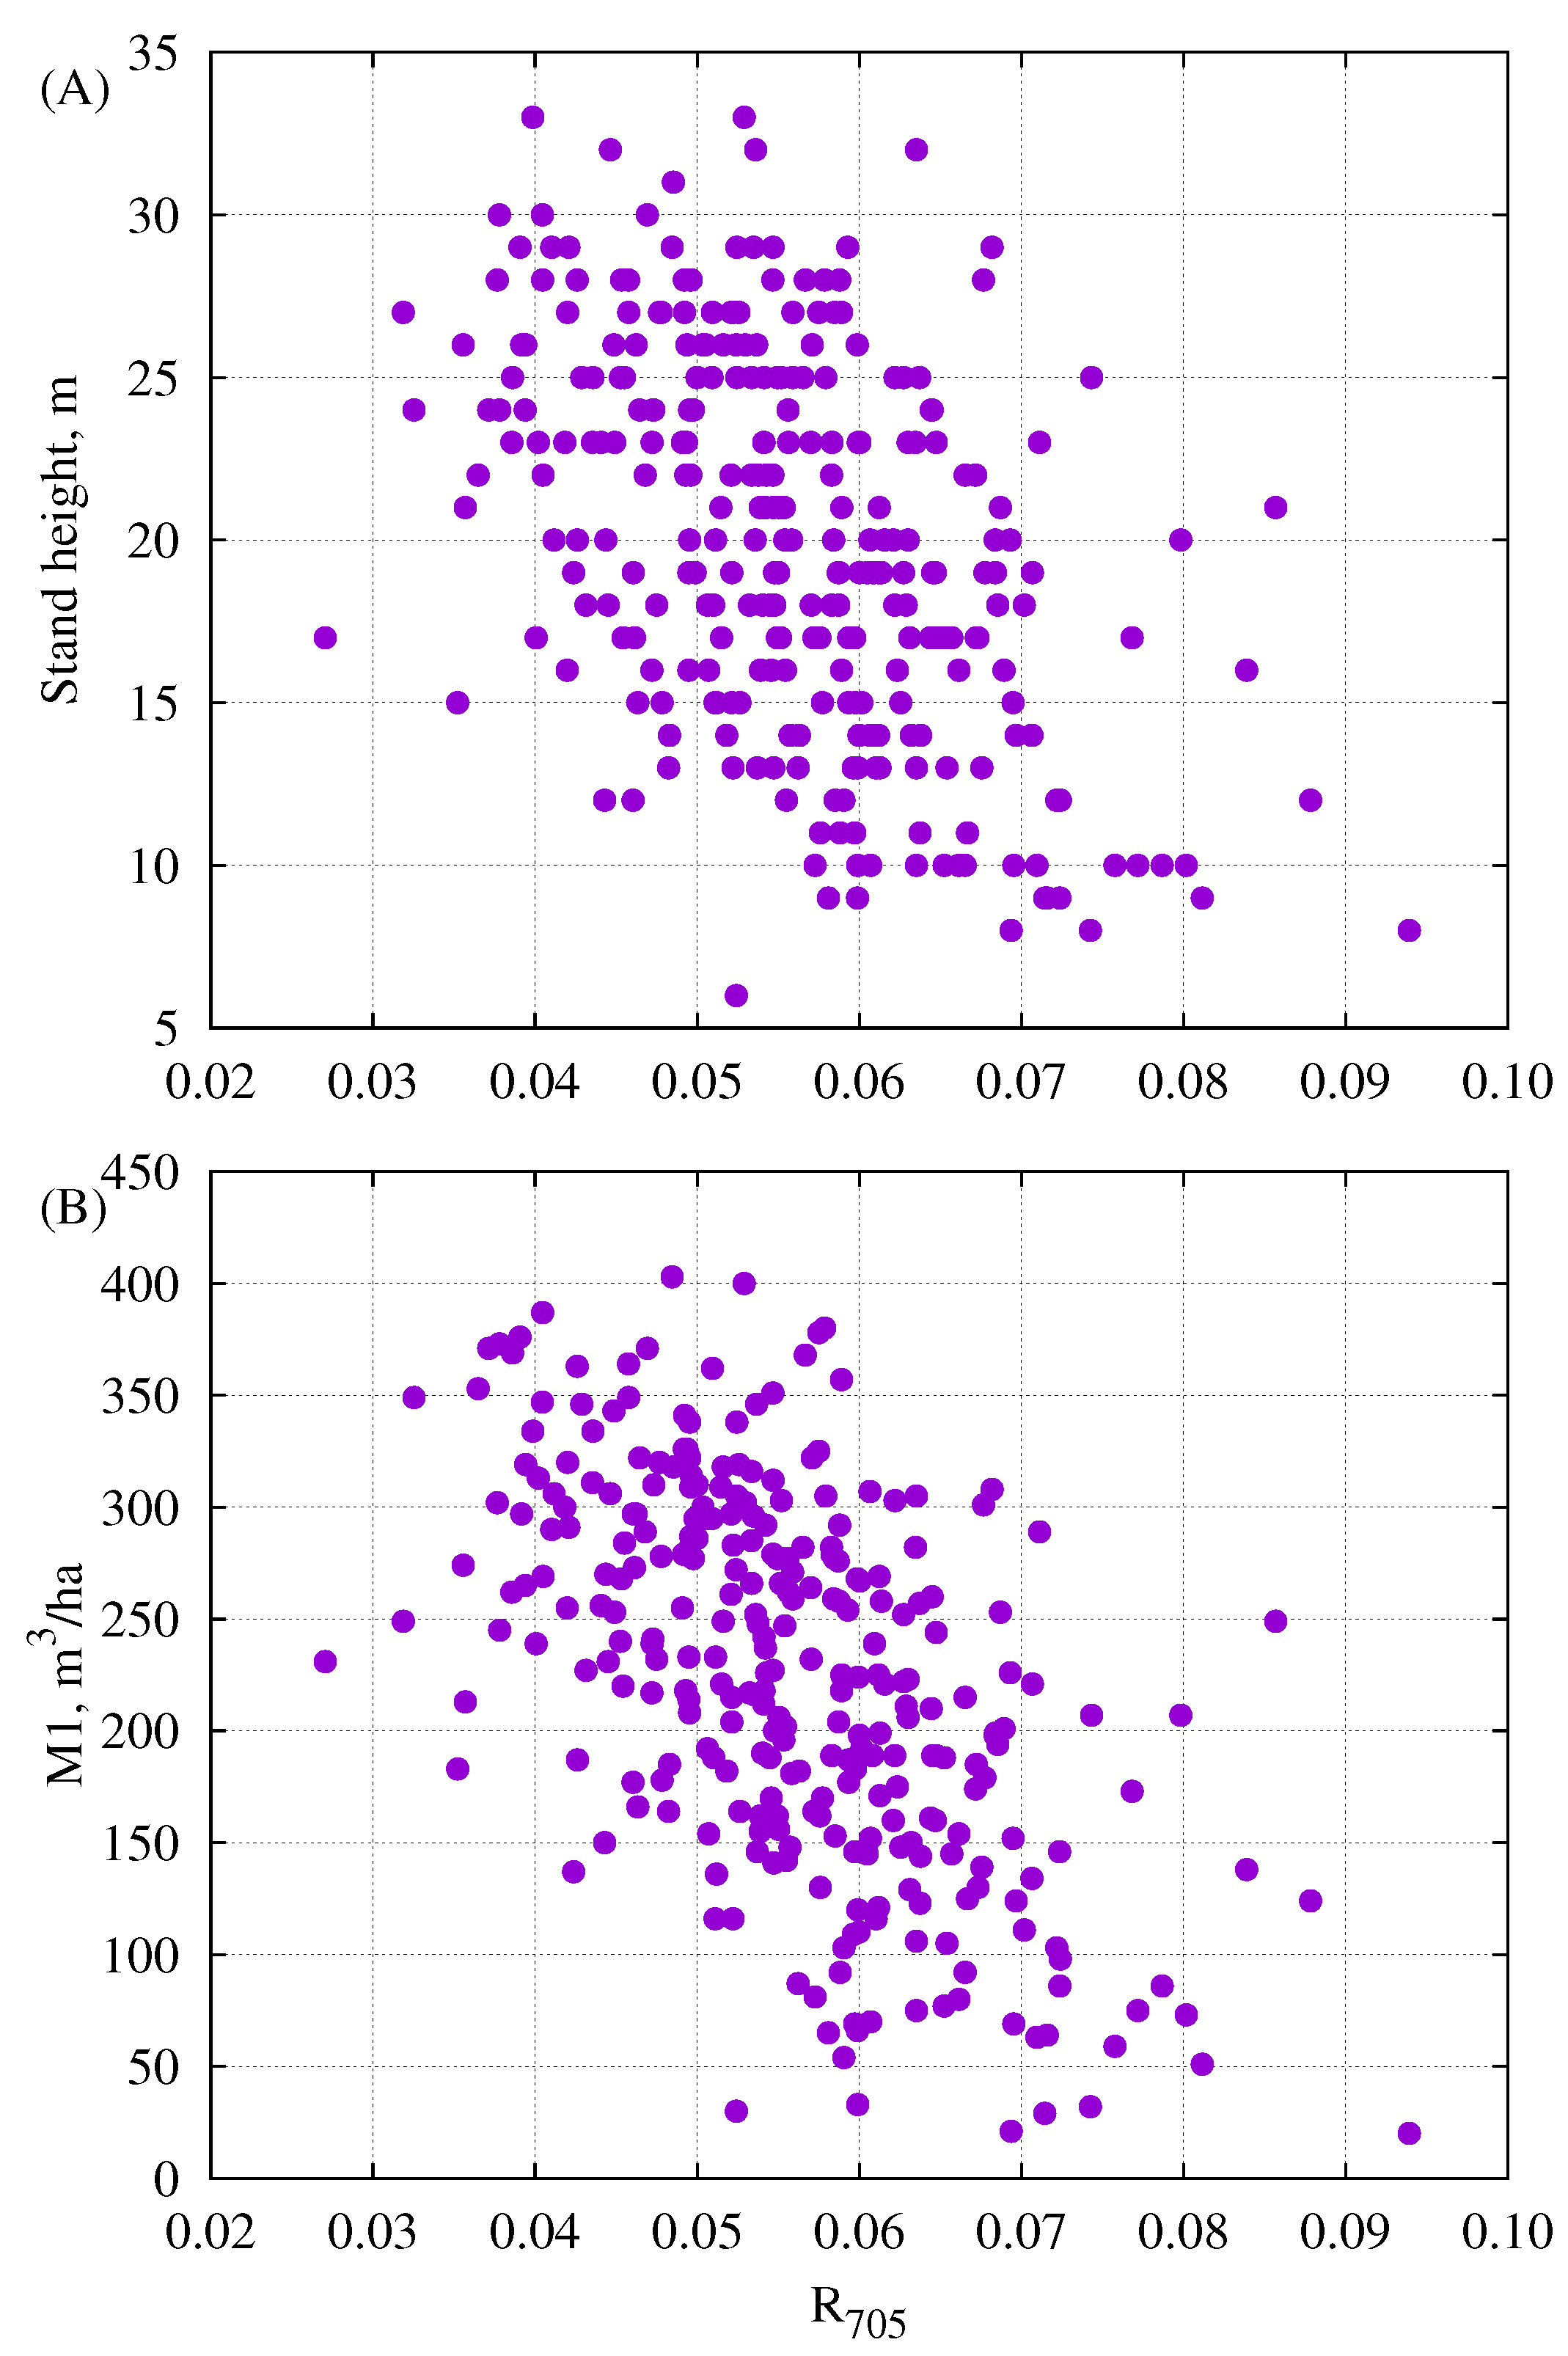
3.4. Relationships Between Reflectance and Some Parameters from Forest Inventory Data
4. Discussion
4.1. Comparison of Different Methods to Calculate Red-Edge Inflection Point
4.2. The In-Filling of the O-A Fraunhofer Line
4.3. The Relationships Between Vegetation Indices, Single Band Reflectance Factors and Forestry Parameters
4.4. Broad vs. Narrow Bandwidths
5. Conclusions
Author Contributions
Funding
Acknowledgments
Conflicts of Interest
References
- Sun, Y.; Frankenberg, C.; Jung, M.; Joiner, J.; Guanter, L.; Köhler, P.; Magney, T. Overview of Solar-Induced chlorophyll Fluorescence (SIF) from the Orbiting Carbon Observatory-2: Retrieval, cross-mission comparison, and global monitoring for GPP. Remote Sens. Environ. 2018, 209, 808–823. [Google Scholar] [CrossRef]
- Frankenberg, C.; Butz, A.; Toon, G. Disentangling chlorophyll fluorescence from atmospheric scattering effects in O2 A-band spectra of reflected sun-light. Geophys. Res. Lett. 2011, 38, L03801. [Google Scholar] [CrossRef]
- Guanter, L.; Frankenberg, C.; Dudhia, A.; Lewis, P.; Gómez-Dans, J.; Kuze, A.; Suto, H.; Grainger, R. Retrieval and global assessment of terrestrial chlorophyll fluorescence from GOSAT space measurements. Remote Sens. Environ. 2012, 121, 236–251. [Google Scholar] [CrossRef]
- Hallik, L.; Niinemets, Ü.; Kull, O. Photosynthetic acclimation to light in woody and herbaceous species: A comparison of leaf structure, pigment content and chlorophyll fluorescence characteristics measured in the field. Plant Biol. 2012, 14, 88–99. [Google Scholar] [CrossRef]
- Porcar-Castell, A.; Tyystjarvi, E.; Atherton, J.; van der Tol, C.; Flexas, J.; Pfundel, E.; Moreno, J.; Frankenberg, C.; Berry, J. Linking chlorophyll a fluorescence to photosynthesis for remote sensing applications: Mechanisms and challenges. J. Exp. Bot. 2014, 65, 4065–4095. [Google Scholar] [CrossRef]
- Bilger, W.; Bjorkman, O.; Thayer, S. Light-induced spectral absorbance changes in relation to photosynthesis and the epoxidation state of xanthophyll cycle components in cotton leaves. Plant Physiol. 1989, 91, 542–551. [Google Scholar] [CrossRef]
- Gamon, J.; Peñuelas, J.; Field, C. A narrow-waveband spectral index that tracks diurnal changes in photosynthetic efficiency. Remote Sens. Environ. 1992, 41, 35–44. [Google Scholar] [CrossRef]
- Filella, I.; Porcar-Castell, A.; Munné-Bosch, S.; Bäck, J.; Garbulsky, M.; Peñuelas, J. PRI assessment of long-term changes in carotenoids/chlorophyll ratio and short-term changes in de-epoxidation state of the xanthophyll cycle. Int. J. Remote Sens. 2009, 30, 4443–4455. [Google Scholar] [CrossRef]
- Gitelson, A.; Gamon, J.; Solovchenko, A. Multiple drivers of seasonal change in PRI: Implications for photosynthesis 2. Stand level. Remote Sens. Environ. 2017, 190, 198–206. [Google Scholar] [CrossRef]
- Mõttus, M.; Takala, T.; Stenberg, P.; Knyazikhin, Y.; Yang, B.; Nilson, T. Diffuse sky radiation influences the relationship between canopy PRI and shadow fraction. ISPRS J. Photogramm. Remote Sens. 2015, 105, 54–60. [Google Scholar] [CrossRef]
- Takala, T.; Mõttus, M. Spatial variation of canopy PRI with shadow fraction caused by leaf-level irradiation conditions. Remote Sens. 2016, 182, 99–112. [Google Scholar] [CrossRef]
- Damm, A.; Guanter, L.; Verhoef, W.; Schlapfer, D.; Garbari, S.; Schaepman, M. Impact of varying irradiance on vegetation indices and chlorophyll fluorescence derived from spectroscopy data. Remote Sens. Environ. 2015, 156, 202–215. [Google Scholar] [CrossRef]
- Atherton, J.; Nichol, C.; Porcar-Castell, A. Using spectral chlorophyll fluorescence and the photochemical reflectance index to predict physiological dynamics. Remote Sens. Environ. 2016, 176, 17–30. [Google Scholar] [CrossRef]
- Porcar-Castell, A.; Garcia-Plazaola, J.; Nichol, C.; Kolari, P.; Olascoaga, B.; Kuusinen, N.; Fernández-Marín, B.; Pulkkinen, M.; Juurola, E.; Nikinmaa, E. Physiology of the seasonal relationship between the photochemical reflectance index and photosynthetic light use efficiency. Oecologia 2012, 170, 313–323. [Google Scholar] [CrossRef]
- Alonso, L.; Moreno, J.; Moya, I.; Miller, J. A comparison of different techniques for passive measurement of vegetation photosynthetic activity: Solar-induced fluorescence, red-edge reflectance structure and photochemical reflectance indices. In Proceedings of the IGARSS 2003. 2003 IEEE International Geoscience and Remote Sensing Symposium. Proceedings (IEEE Cat. No.03CH37477), Toulouse, France, 21–25 July 2003; pp. 604–606. [Google Scholar] [CrossRef]
- Imanishi, J.; Nakayama, A.; Suzuki, Y.; Imanishi, A.; Ueda, N.; Morimoto, Y.; Yoneda, M. Nondestructive determination of leaf chlorophyll content in two flowering cherries using reflectance and absorptance spectra. Landsc. Ecol. Eng. 2010, 6, 219–234. [Google Scholar] [CrossRef]
- Hallik, L.; Kazantsev, T.; Kuusk, A.; Galmés, J.; Tomás, M.; Niinemets, Ü. Generality of relationships between leaf pigment contents and spectral vegetation indices in Mallorca (Spain). Reg. Environ. Chang. 2017, 17, 2097–2109. [Google Scholar] [CrossRef]
- Mõttus, M.; Sulev, M.; Hallik, L. Seasonal course of the spectral properties of alder and birch leaves. IEEE J. Sel. Top. Appl. Earth Obs. Remote Sens. 2014, 7, 2496–2505. [Google Scholar] [CrossRef]
- Cho, M.; Skidmore, A. A new technique for extracting the red edge position from hyperspectral data: The linear extrapolation method. Remote Sens. Environ. 2006, 101, 181–193. [Google Scholar] [CrossRef]
- Guyot, G.; Baret, F. Utilisation de la haute resolution spectrale pour suivre l’etat des couverts vegetaux. In Proceedings of the Spectral Signatures of Objects in Remote Sensing, ESA SP-287, Aussois, France, 18–22 January 1988; Guyenne, T., Hunt, J., Eds.; European Space Agency: Paris, France, 1988; pp. 279–286. [Google Scholar]
- Clevers, J.; de Jong, S.; Epema, G.; van der Meer, F.; Bakker, W.; Skidmore, A.; Addink, E. MERIS and the red-edge position. Int. J. Appl. Earth Obs. Geoinf. 2001, 3, 313–320. [Google Scholar] [CrossRef]
- Baret, F.; Jacquemoud, S.; Hanocq, J. About the soil line concept in remote sensing. Adv. Space Res. 1993, 13, 281–284. [Google Scholar] [CrossRef]
- Huete, A. A soil-adjusted vegetation index (SAVI). Remote Sens. Environ. 2004, 25, 259–309. [Google Scholar] [CrossRef]
- Haboudane, D.; Miller, J.; Tremblay, N.; Zarco-Tejada, P.; Dextraze, L. Hyperspectral vegetation indices and novel algorithms for predicting green LAI of crop canopies: Modeling and validation in the context of precision agriculture. Remote Sens. Environ. 2004, 90, 337–352. [Google Scholar] [CrossRef]
- Clevers, J. Application of the WDVI in estimating LAI at the generative stage of barley. ISPRS J. Photogramm. Remote Sens. 1991, 46, 37–47. [Google Scholar] [CrossRef]
- Liang, S. Quantitative Remote Sensing of Land Surfaces; Wiley-Interscience: Hoboken, NJ, USA, 2004; p. 534. [Google Scholar]
- Chen, J.; Leblanc, S.; Miller, J.; Freemantle, J.; Loechel, S.; Walthall, C.; Innanen, K.; White, H. Compact Airborne Spectrographic Imager (CASI) used for mapping biophysical parameters of boreal forests. J. Geophys. Res. D Atmos. 1999, 104, 27945–27958. [Google Scholar] [CrossRef]
- Schaepman, M.; Jehle, M.; Hueni, A.; D’Odorico, P.; Damm, A.; Weyermann, J.; Schnei der, F.; Laurent, V.; Popp, C.; Seidel, F.; et al. Advanced radiometry measurements and Earth science applications with the Airborne Prism Experiment (APEX). Remote Sens. Environ. 2015, 158, 207–219. [Google Scholar] [CrossRef]
- Resonon Inc. High-Precision Hyperspectral Imaging Systems for Research and Industrial Applications. Available online: https://resonon.com/airborne-remote-system (accessed on 17 June 2019).
- Raczko, E.; Zagajewski, B. Comparison of support vector machine, random forest and neural network classifiers for tree species classification on airborne hyperspectral APEX images. Eur. J. Remote Sens. 2017, 50, 144–154. [Google Scholar] [CrossRef]
- Kuusk, A.; Lang, M.; Nilson, T. Forest test site at Järvselja, Estonia. In Proceedings of the Third Workshop CHRIS/Proba, Frascati, Italy, 21–23 March 2005; Number SP-593. ESA Publication: Auckland, NZ, USA, 2005; pp. 1–7. [Google Scholar]
- Kuusk, J. Measurement of Forest Reflectance. Top-of-Canopy Spectral Reflectance of Forests for Developing Vegetation Radiative Transfer Models; Lambert Academic Publishing: Saarbrücken, Germany, 2011; p. 120. [Google Scholar]
- Kuusk, J. Dark signal temperature dependence correction method for miniature spectrometer modules. J. Sens. 2011, 2011, 608157. [Google Scholar] [CrossRef]
- Kostkowski, H.J. Reliable Spectroradiometry; Spectroradiometry Consulting: La Plata, MD, USA, 1997; p. 609. [Google Scholar]
- Kuusk, J.; Ansko, I.; Bialek, A.; Vendt, R.; Fox, N. Implication of illumination beam geometry on stray light and bandpass characteristics of diode array spectrometer. IEEE J. Sel. Top. Appl. Earth Obs. Remote Sens. 2018, 11, 2925–2932. [Google Scholar] [CrossRef]
- Labsphere Inc. Available online: https://www.labsphere.com (accessed on 27 June 2019).
- Rouse, J.; Haas, R.; Scheel, J.; Deering, D. Monitoring vegetation systems in the Great Plains with ERTS. In Proceedings of the 3rd Earth Resource Technology Satellite (ERTS) Symposium, Washington, DC, USA, 10–14 December 1973; Volume 1, pp. 48–62. [Google Scholar]
- Sims, D.; Gamon, J. Relationships between leaf pigment content and spectral reflectance across a wide range of species, leaf structures and developmental stages. Remote Sens. Environ. 2002, 81, 337–354. [Google Scholar] [CrossRef]
- Meroni, M.; Rossini, M.; Guanter, L.; Alonso, L.; Rascher, U.; Colombo, R.; Moreno, J. Remote sensing of solar-induced chlorophyll fluorescence: Review of methods and applications. Remote Sens. Environ. 2009, 113, 2037–2051. [Google Scholar] [CrossRef]
- Kuusk, A.; Lang, M.; Kuusk, J. Database of optical and structural data for the validation of forest radiative transfer models. In Light Scattering Reviews; Kokhanovsky, A., Ed.; Springer: Berlin/Heidelberg, Germany, 2013; Volume 7, pp. 109–148. [Google Scholar]
- R Core Team. R: A Language and Environment for Statistical Computing; R Foundation for Statistical Computing: Vienna, Austria, 2018. [Google Scholar]
- Vogelmann, J.; Rock, B.; Moss, D. Red edge spectral measurements from sugar maple leaves. Int. J. Remote Sens. 1992, 14, 1563–1575. [Google Scholar] [CrossRef]
- Kochubey, S.; Kazantsev, T. Changes in the first derivatives of leaf reflectance spectra of various plants induced by variations of chlorophyll content. J. Plant Physiol. 2007, 164, 1648–1655. [Google Scholar] [CrossRef]
- Le Maire, G.; François, C.; Dufrêne, E. Towards universal broad leaf chlorophyll indices using PROSPECT simulated database and hyperspectral reflectance measurements. Remote Sens. Environ. 2004, 89, 1–28. [Google Scholar] [CrossRef]
- Guanter, L.; Rossini, M.; Colombo, R.; Meroni, M.; Frankenberg, C.; Lee, J.; Joiner, J. Using field spectroscopy to assess the potential of statistical approaches for the retrieval of sun-induced chlorophyll fluorescence from ground and space. Remote Sens. Environ. 2013, 133, 52–61. [Google Scholar] [CrossRef]
- Rascher, U.; Alonso, L.; Burkart, A.; Cilia, C.; Cogliati, S.; Colombo, R.; Damm, A.; Drusch, M.; Guanter, L.; Hanus, J.; et al. Sun-induced fluorescence—A new probe of photosynthesis: First maps from the imaging spectrometer HyPlant. Glob. Chang. Biol. 2015, 21, 4673–4684. [Google Scholar] [CrossRef]
- Zarco-Tejada, P.; Catalina, A.; Gonzalez, M.; Martin, P. Relationships between net photosynthesis and steady-state chlorophyll fluorescence retrieved from airborne hyperspectral imagery. Remote Sens. Environ. 2013, 136, 247–258. [Google Scholar] [CrossRef]
- Damm, A.; Guanter, L.; Laurent, V.; Schaepman, M.; Schickling, A.; Rascher, U. FLD-based retrieval of sun-induced chlorophyll fluorescence from medium spectral resolution airborne spectroscopy data. Remote Sens. Environ. 2014, 147, 256–266. [Google Scholar] [CrossRef]
- Aasen, H.; Van Wittenberghe, S.; Sabater Medina, N.; Damm, A.; Goulas, Y.; Wieneke, S.; Hueni, A.; Malenovský, Z.; Alonso, L.; Pacheco-Labrador, J.; et al. Sun-induced chlorophyll fluorescence II: Review of passive measurement setups, protocols, and their application at the leaf to canopy level. Remote Sens. 2019, 11, 927. [Google Scholar] [CrossRef]
- Pacheco-Labrador, J.; Hueni, A.; Mihai, L.; Sakowska, K.; Julitta, T.; Kuusk, J.; Sporea, D.; Alonso, L.; Burkart, A.; Cendrero-Mateo, M.; et al. Sun-induced chlorophyll fluorescence I: Instrumental considerations for proximal spectroradiometers. Remote Sens. 2019, 11, 960. [Google Scholar] [CrossRef]
- Nilson, T.; Peterson, U. Age dependence of forest reflectance—Analysis of main driving factors. Remote Sens. Environ. 1994, 48, 319–331. [Google Scholar] [CrossRef]
- Lang, M.; Lilleleht, A.; Neumann, M.; Bronisz, K.; Rolim, S.; Seedre, M.; Uri, V.; Kiviste, A. Estimation of above-ground biomass in forest stands from regression on their basal area and height. For. Stud. 2016, 64, 70–92. [Google Scholar] [CrossRef]
- Rautiainen, M.; Lukeš, P.; Homolová, L.; Hovi, A.; Pisek, J.; Mõttus, M. Spectral properties of coniferous forests: A review of in situ and laboratory measurements. Remote Sens. 2018, 10, 207. [Google Scholar] [CrossRef]
- Lukeš, P.; Rautiainen, M.; Manninen, T.; Stenberg, P.; Mõttus, M. Geographical gradients in boreal forest albedo and structure in Finland. Remote Sens. Environ. 2014, 152, 526–535. [Google Scholar] [CrossRef]
- Lukeš, P.; Stenberg, P.; Mõttus, M.; Manninen, T.; Rautiainen, M. Multidecadal analysis of forest growth and albedo in boreal Finland. Int. J. Appl. Earth Obs. Geoinf. 2016, 52, 296–305. [Google Scholar] [CrossRef]
- Majasalmi, T.; Rautiainen, M. The potential of Sentinel-2 data for estimating biophysical variables in a boreal forest: Asimulation study. Remote Sens. Lett. 2016, 7, 427–436. [Google Scholar] [CrossRef]
- Räim, O.; Kaurilind, E.; Hallik, L.; Merilo, E. Why does needle photosynthesis decline with tree height in Norway spruce. Plant Biol. 2012, 14, 306–314. [Google Scholar] [CrossRef]
- Mänd, P.; Hallik, L.; Peñuelas, J.; Kull, O. Electron transport efficiency at opposite leaf sides: Effect of vertical distribution of leaf angle, structure, chlorophyll content and species in a forest canopy. Tree Physiol. 2013, 33, 202–210. [Google Scholar] [CrossRef]
- Markiet, V.; Hernández-Clemente, R.; Mõttus, M. Spectral similarity and PRI variations for a boreal forest stand using multi-angular airborne imagery. Remote Sens. 2017, 9, 1005. [Google Scholar] [CrossRef]


| PRI | NDVI | NDVI | R/R | S2REP | ||
|---|---|---|---|---|---|---|
| R | 0.10 ns | −0.48 *** | −0.34 *** | −0.43 *** | −0.49 *** | −0.47 *** |
| R | 0.35 *** | −0.47 *** | −0.08 ns | −0.27 *** | −0.35 *** | −0.37 *** |
| R | 0.32 *** | −0.56 *** | −0.12 * | −0.31 *** | −0.41 *** | −0.42 *** |
| R | −0.06 ns | −0.62 *** | −0.53 *** | −0.60 *** | −0.65 *** | −0.63 *** |
| R | 0.51 *** | −0.59 *** | 0.10 ns | −0.10 ns | −0.25 *** | −0.25 *** |
| R | 0.88 *** | −0.14 * | 0.69 *** | 0.55 *** | 0.39 *** | 0.40 *** |
| R | 0.89 *** | −0.09 ns | 0.73 *** | 0.59 *** | 0.44 *** | 0.45 *** |
| R | 0.91 *** | −0.03 ns | 0.77 *** | 0.65 *** | 0.51 *** | 0.52 *** |
| R | 0.91 *** | −0.01 ns | 0.79 *** | 0.67 *** | 0.53 *** | 0.54 *** |
| PRI | NDVI | NDVI | R/R | S2REP | ||
|---|---|---|---|---|---|---|
| 1 | ||||||
| PRI | −0.05 ns | 1 | ||||
| NDVI | 0.76 *** | 0.36 *** | 1 | |||
| NDVI | 0.66 *** | 0.50 *** | 0.94 *** | 1 | ||
| R/R | 0.53 *** | 0.64 *** | 0.85 *** | 0.95 *** | 1 | |
| S2REP | 0.54 *** | 0.60 *** | 0.85 *** | 0.97 *** | 0.99 *** | 1 |
| H (m) | Z (m/ha/year) | G1 (m/ha) | M1 (m/ha) | H (m) | LAI | Age (yr) | |
|---|---|---|---|---|---|---|---|
| R | −0.37 *** | −0.31 *** | −0.16 ** | −0.23 *** | −0.20 *** | −0.50 *** | 0.11 ns |
| R | −0.35 *** | −0.14 * | −0.38 *** | −0.48 *** | −0.45 *** | −0.39 *** | −0.17 ** |
| R | −0.40 *** | −0.17 ** | −0.40 *** | −0.50 *** | −0.46 *** | −0.41 *** | −0.15 ** |
| R | −0.41 *** | −0.33 *** | −0.14 * | −0.19 *** | −0.17 ** | −0.52 *** | 0.17 ** |
| R | −0.36 *** | −0.14 * | −0.50 *** | −0.57 *** | −0.47 *** | −0.33 *** | −0.25 *** |
| R | 0.02 ns | 0.12 * | −0.45 *** | −0.44 *** | −0.30 *** | −0.005 ns | −0.47 *** |
| R | 0.05 ns | 0.13 * | −0.43 *** | −0.42 *** | −0.28 *** | 0.02 ns | −0.47 *** |
| R | 0.10 ns | 0.16 ** | −0.40 *** | −0.39 *** | −0.25 *** | 0.05 ns | −0.48 *** |
| R | 0.11 ns | 0.17 ** | −0.39 *** | −0.38 *** | −0.24 *** | 0.06 ns | −0.48 *** |
| 0.18 ** | 0.24 *** | −0.29 *** | −0.30 *** | −0.20 *** | 0.15 ** | −0.46 *** | |
| PRI | 0.56 *** | 0.33 *** | 0.34 *** | 0.37 *** | 0.30 *** | 0.30 *** | −0.05 ns |
| NDVI | 0.31 *** | 0.30 *** | −0.19 *** | −0.18 ** | −0.09 ns | 0.32 *** | −0.46 *** |
| NDVI | 0.43 *** | 0.30 *** | −0.06 ns | 0.01 ns | 0.10 ns | 0.38 *** | −0.35 *** |
| R/R | 0.52 *** | 0.37 *** | 0.01 ns | 0.07 ns | 0.12 * | 0.42 *** | −0.34 *** |
| S2REP | 0.49 *** | 0.33 *** | 0.02 ns | 0.09 ns | 0.15 ** | 0.39 *** | −0.31 *** |
| Publication | Observation | Explanation |
|---|---|---|
| Rautiainen et al. (2018) [53] | Systematically higher reflectance of the immature spruce forest stand compared to the mature one at all spatial scales | For closed forest canopies, the canopy structure dominates, and crown-level multiple scattering, in contrast to leaf biochemistry, shows no distinctive spectral absorption features, but systematically decreases canopy reflectance. |
| Nilson & Peterson (1994) [51] | Similar decrease of reflectance in all spectral bands with increasing forest age (birch, pine and spruce dominated stands) | The amount of shade increases with stand age as increasing stand height increases the roughness of the forest canopy as a surface, changing the proportion of sunlit and shaded crowns. |
| Lukeš et al. (2014, 2016) [54,55] | Summer albedo was only weakly correlated with the traditional forest inventory variables. The broadband and spectral albedos in the near-infrared region were weakly negatively correlated with forest biomass, basal area and canopy cover. Stronger negative correlation in visible spectral region. | Low sensitivity after canopy closure. |
© 2019 by the authors. Licensee MDPI, Basel, Switzerland. This article is an open access article distributed under the terms and conditions of the Creative Commons Attribution (CC BY) license (http://creativecommons.org/licenses/by/4.0/).
Share and Cite
Hallik, L.; Kuusk, A.; Lang, M.; Kuusk, J. Reflectance Properties of Hemiboreal Mixed Forest Canopies with Focus on Red Edge and Near Infrared Spectral Regions. Remote Sens. 2019, 11, 1717. https://doi.org/10.3390/rs11141717
Hallik L, Kuusk A, Lang M, Kuusk J. Reflectance Properties of Hemiboreal Mixed Forest Canopies with Focus on Red Edge and Near Infrared Spectral Regions. Remote Sensing. 2019; 11(14):1717. https://doi.org/10.3390/rs11141717
Chicago/Turabian StyleHallik, Lea, Andres Kuusk, Mait Lang, and Joel Kuusk. 2019. "Reflectance Properties of Hemiboreal Mixed Forest Canopies with Focus on Red Edge and Near Infrared Spectral Regions" Remote Sensing 11, no. 14: 1717. https://doi.org/10.3390/rs11141717
APA StyleHallik, L., Kuusk, A., Lang, M., & Kuusk, J. (2019). Reflectance Properties of Hemiboreal Mixed Forest Canopies with Focus on Red Edge and Near Infrared Spectral Regions. Remote Sensing, 11(14), 1717. https://doi.org/10.3390/rs11141717