Article

Comparison of Mature Douglas-Firs’ Crown Structures Developed with Two Quantitative Structural Models Using TLS Point Clouds for Neighboring Trees in a Natural Regime Stand

College of Forestry, Oregon State University, 3100 Jefferson Way, Corvallis, OR 97333, USA
*
Author to whom correspondence should be addressed.
Remote Sens. 2019, 11(14), 1661; https://doi.org/10.3390/rs11141661
Submission received: 24 May 2019 / Revised: 1 July 2019 / Accepted: 10 July 2019 / Published: 12 July 2019
(This article belongs to the Special Issue Lidar for Ecosystem Science and Management)

Abstract

:
The Douglas fir crown structure serves important ecological functions in regulating the ecosystem of the Pacific Northwest (PNW). Mapping and modeling of the Douglas-fir crown has traditionally focused on young plantations or old-growth forests. The crown description in natural regime forests is limited by data availability. Terrestrial laser scanning (TLS) enables the acquisition of crown structural attributes, even in dense forests, at a fine scale. The certical and horizontal distributions of the fine-scale branch attributes, such as branch diameter, branch length, and branch insertion angle, will reflect the crown behaviors towards light resources availability, as a result of neighborhood competition. The main objective of the study is to compare crown structural models of a group of neighboring trees developed with two TLS-based procedures, namely: semi-automatic (Cyclone software) and automatic (TreeQSM) procedures. The estimated crown attributes are the branch diameter, branch length, branch insertion angle, height of branch insertion point, and branch azimuth. The results show that branch azimuth distribution does not differ between TreeQSM and Cyclone for most of the sample trees. However, the TreeQSM and Cyclone identified branches exhibit different distributions of insertion height. A paired t-test indicates no difference between the mean branch diameter of Cyclone and TreeQSM at an individual tree level. However, Cyclone estimated that the branch length and branch insertion angle are 0.49 m and 9.9° greater than the TreeQSM estimates, respectively. Repeat measurements of the analysis of variance (ANOVA) suggest that the height along the stem is an influential factor of the difference between the Cyclone and TreeQSM branch diameter estimates. To test whether TLS-based estimates are within the ranges of the previous observations, we computed the tree crown attributes of second- and old-growth trees using Monte Carlo simulations for diameter at breast height (DBH) class 50–55 cm, 60–65 cm, and 85–105 cm. We found that the crown attributes estimated from both of the TLS-based methods are between the simulated second- and old-growth trees, except for DBH 85–105 cm. The TLS-based crown structural models show increasingly diverse distributions of branch insertion angles and increasing branch exclusion as DBH increases. Cyclone-based crown structural models are consistent with previous studies. However, TreeQSM-based crown structural models omitted a significant number of branches and generated crown structures with reduced plausibility.

Graphical Abstract

1. Introduction

The crown structure of Douglas-fir forests plays an important role in shaping abiotic arrangements, and eventually determines the biodiversity of the temperate forest ecosystem in the Pacific Northwest [1,2,3]. Characterizing the canopy architecture will significantly enhance the understanding of the forest microclimate variability [4,5], foliage distribution [6,7], epiphyte abundance [8,9,10,11], growth productivity [12,13,14], and distribution of wildlife habitats [15]. Furthermore, knowledge of the forest structural dynamics, particularly of the crown, guides the silvicultural practices aimed at achieving economic, social, and ecological benefits [13,16,17,18].
The crowns of young- to mid-age Douglas-fir plantation trees have been successfully modeled with allometric equations focused on the branch diameter [19,20,21], branch length [22], branch insertion angle [22], and foliage mass [23,24,25]. In comparison, applications of allometric equations in describing old-growth Douglas-fir crown were less fruitful, as more uncertainties are induced by the complex structural variability caused by canopy closure and stratification [1]. In such cases, the crown architectures were conceptually [26,27,28,29] and numerically [30,31] documented almost exclusively for individual “big trees.” Descriptions of the mature crowns of trees from natural regime stands are constrained by the difficulties in the acquisition of the branch attributes. Therefore, the crown development of trees located inside unmanaged stands is limited.
The point clouds produced by terrestrial laser scanning (TLS) provide a reliable source of data for 3D forest measurements [32,33,34]. At the stand level, TLS can successfully estimate the stand basal area, stem mean diameter, canopy height, and gap fraction [35,36]. At the tree level, TLS has also been proven to successfully measure the tree crown width, diameter at breast height (DBH), total height, and leaf area distribution [35,37,38]. Point clouds convey the spatial coordinates and laser intensity of the reflecting surfaces, with reduced information on the type of surface. Therefore, fine-scale crown geometric measurements, such as the branch diameter, branch length, and branch insertion angle, are difficult to be automatically retrieved without external human input or the use of advanced algorithms. Such algorithms are the quantitative structural models (QSM), which extract the tree woody structure based on the topographic relationship between points and the approximate tree skeleton with cylinder models [39,40,41,42]. QSM has effectively reconstructed stems and branches for broadleaf trees, and accurately measured tree height [43], DBH [43], branch diameter [44], branch length [44], and stem and branch volumes [44,45]. The accurate stem and branch volume estimations from QSM also enable rapid biomass estimation at tree level [46,47]. From an ecological perspective, QSM also reveals the tree structural development in response to ecosystem conditions [48,49].
Despite the successful applications of QSM in estimating the big branches of broadleaf trees, QSM tends to overestimate the diameters of smaller branches [41,44], because QSM is sensitive to noise, leaf-on points, and disconnected point clouds, which cause a poor reconstruction of branch models. Therefore, the application of QSM to coniferous species is challenged by the small leaves on branches. For coniferous trees, TLS-based crown structure studies focus on depicting the general crown profile [50,51], rather than describing the inside canopy details, particularly the branch arrangements and dimensions. To date, few studies have characterized the Douglas-fir branch architecture of average trees from stands that experienced limited management [8,20,27]. The overarching objective of the present study is to numerically describe the crown architecture of average Douglas-fir trees from point clouds. Because the size and location of branches can be estimated using automatic procedures such as QSM, or semi-automatic ones such as Cyclone-based, a primary objective of our study is to test the utility of QSM for Douglas-fir crown measurements.
Under similar environmental conditions, Douglas-firs’ crown structure reflect the results of the light availability [27]. For mature crowns, as the crowns expand, competition among neighboring crowns triggers the branch exclusion and diversification of the branch insertion angles and branch size [1], in order to ensure a sufficient light resource. Previous crown structural modeling has been focused on unrelated individual trees [27,28,30,31,52]. However, neighborhood density in the canopy is a significant factor on the crown dynamic [53,54,55]. In this study, we attempt to develop the crown structures of a group of neighboring trees with a variety of sizes using TLS point clouds. A set of plausible crown structural models will reflect the neighborhood impact on crown development as the tree size increases. Therefore, the secondary objective of our study is to examine whether a TLS-based crown structure will reflect the light-induced neighboring competition’s impact on the crown structure of varying sized trees.
To achieve the two major objectives, we are interested in addressing the following four subobjectives:
  • To describe the crown of the average (understood as not-special) dominant and co-dominant Douglas-fir, from different DBH classes using point clouds.
  • To examine whether or not the TLS-based estimates of the crown fit within the range of existing observations for second-growth plantations and old-growth stands.
  • To compare the branch dimensions estimated using Cyclone, the semi-automatic approach, with the values supplied by TreeQSM, the automatic approach.
  • To examine the neighborhood impact on Douglas-fir crown structure development based on conceptual crown models developed with TLS point clouds.

2. Data and Methods

2.1. Study Sites and Data Collection

The study was conducted in a Douglas-fir stand located in the west side of the Cascades, Oregon, in the H.J. Andrews Experimental Forest. Inside the stand, an 80 m × 100 m plot (Figure 1b) with trees at an average of 38 m tall (standard deviation of 11.5 m) was scanned from 22 locations with a RIEGL VZ400i scanner. The first scan was located at the center of the plot and was programmed for the execution of a complete rotation (i.e., 360°) in 10-min, whereas all of the subsequent scans took only 5 min. A set of 76 tie-points were placed inside the plot and their coordinates were surveyed with a Trimble RTS633 total station. The registration of the individual scans was performed in Leica Cyclone [56]. The scans were aligned using cloud-to-cloud comparison, constrained by the 76 tie-points. The mean absolute error of the constraint and cloud-to-cloud alignments are 0.009 and 0.016 m, respectively. The sample trees selected in this study meet the following four conditions: (1) the trees are composed of an abundance of point clouds, at least for the lower-middle crown; (2) the trees belong to the dominant and codominant crown classes [57]; (3) the trees are neighbors; (4) the trees are composed of several DBH classes—at least 10 trees fulfilled the first two conditions. Therefore, we randomly selected the point clouds of 10 dominant and codominant trees with adjacent crowns (Figure 1a,c). The points associated with each tree were visually delineated in Cyclone (Figure 1a,c). The visual extraction of the sample trees is difficult at the middle section of crowns, where a significant number of interlocking branches are found within the adjacent crowns. To ensure a clear view of point clouds rendering in Cyclone, individual crowns were roughly divided into sublayers, crown delineation was performed at a sublayer level, and then, the point clouds of the sublayers were eventually integrated as an individual tree. The visual delineation of individual crowns largely depends on the connective relationship between the stem and branch points. Points rendering based on intensity segregates the stem, branch, and leaf points, and supports the visual identification of the stem and its connected branches. The major errors of the visual extraction of the crowns are the omissions of the entire or partial branches, and the inclusion of branches from neighboring crowns. To reduce the sample tree segregation errors, visual delineations were performed from different angles.

2.2. Cyclone-Based Estimation of Stems and Branch Dimensions

For each tree, we directly measured the tree DBH, height, branch diameter (BD), branch length (BL), branch insertion angle (α), branch azimuth (θ), and height of the branch insertion point (Table 1), using crown structural models constructed in Leica Cyclone (Figure 2). We also computed five attributes, some of which are commonly used in forest modeling, namely crown length (CL), crown ratio (CR), branch relative height inside the crown (BRH), branch depth inside the crown (DINC), and branch relative depth into the crown (RDINC).
All of the branch and stem estimates were based on the region growth algorithm [58], which requires sufficient points in order to fit cylinders (Figure 2a). At the top of the crown, not enough points were available for fitting cylinder models (Figure 2b). Therefore, the top stem diameter was determined by assuming that the top segment is cone-shaped, with the cone’s base diameter equal to the stem diameter of the highest available cylinder model. The axis of the top stem segment was aligned with the highest available stem cylinder. The branches at the top of the crown were manually traced with line segments. Thus, the branches at the top of the crown were still measured for their height, length, insertion angle, azimuth, and crown radius, but no diameters were estimated.
For the best accuracy, we only measured the first-order live branches that were directly attached to the stems, which were only fitted with cylinders at the insertion point for measuring the basal diameter (Figure 2c). For each cylinder, the extreme coordinates were recorded (i.e., start and end), as well as the axis, diameter, and length. We fitted the tree stems with cylinders that were 1–1.5 m long (Figure 2e), for which the taper is negligible with respect to the measurement errors. The dead branches were visually identified in the point cloud, considering that few leaves, and consequently points, were attached to the woody tissue in this case (Figure 2f).
We computed the tree height as the difference between the z-values of the highest identified point, and the start point of the stem base. We traced the branch skeletons with segments, whose length was summed from the insertion point to the end of the branch, and estimated its linear extent (Figure 2d). We computed the branch azimuth with respect to the axis of the base cylinder, while the branch insertion angle was the angle between the axis of the branch base cylinder and the axis of the stem cylinder (Figure 2c). We determined the crown radius of a branch as the horizontal distance between the end point of the branch and the stem (Figure 2d).

2.3. Automatic Estimates of Stems and Branches Dimensions Using TreeQSM

QSM provides an automation process of constructing 3D models from point clouds (Figure 3). It segments tree branches by using cover sets, which are connected patches of the tree surface [42]. Among the QSM models available to 3D model the trees, such as SimpleTree [41], pypetree [40], or TreeQSM [42,59], we chose TreeQSM. Our software selection was based on the operability and the validity of the results, as only TreeQSM was able to render realistic trees in a feasible amount of time. The other software either were not operational, in the case of pypetree, or required a large amount of time to provide valid results, in the case of SimpleTree. We used the following parameters to generate the cover sets in TreeQSM:
  • Patch diameter for the first cover: 0.1–0.15 m.
  • Minimum patch diameter for the second cover: 0.02–0.03 m.
  • Maximum patch diameter for the second cover: 0.06–0.08 m.
For each tree, we estimated the same attributes with TreeQSM as we did with Cyclone, as listed in Table 1.

2.4. Cleaning TreeQSM Estimates

We noticed that the tree models constructed with TreeQSM produced significantly more branches than Cyclone. As the accuracy of TreeQSM is sensitive to the density of the points, and consequently, to the proportion of noise points [42], higher order branches located at the upper portion of the crowns commonly contained large errors. Therefore, the branches that were apparently wrongly created were removed. To eliminate the wrongly constructed branches, we used a series of ad-hoc criteria, which were developed by trial and error, as follows:
  • branches with a base diameter above 15 cm;
  • branches with a total length less than 1 m;
  • branch height below the lowest identified branch in Cyclone;
  • insertion angle less than 30 degrees;
  • insertion angle less than 50 degrees and length greater than 3 m.
Because TreeQSM wrongly classified some first-order branches as second order, we reexamined all of the second-order branches, which were re-classified as first-order branches if the distance between the insertion point and the stem axis was less than the stem radius, d (Equation (1)), as follows:
{ ( x branch x stem ) 2 + ( y branch y stem ) 2 2 d 2   z branch = z stem
where, x branch , y branch , and z branch are the starting coordinates of a second-order branch, x stem , y stem , and z stem are the coordinates of the stem center.

2.5. Comparison of the Cyclone and TreeQSM Estimates

2.5.1. Estimate Aggregations by Height Section

As one of the interests of this study is the similarities of the trees depicted by the two TLS-based producers (i.e., Cyclone and TreeQSM), we aimed at a pair-wise comparison of the branches. However, only 8% of the branches identified with Cyclone and TreeQSM could be paired using visualization and coordinates proximity. Therefore, we compared the aggregated attribute values by height sections of each individual tree, rather than comparing paired individual branches. The comparison of the aggregated values would reveal whether the two procedures generated similar tree structural estimates at an individual tree level. The ordinal variable height section was determined based on the following two criteria: (1) the length of each section was <5 m, except for the bottom and top of the crown, and (2) the number of branches located within each section is relatively equal. The division of the height section is summarized in Table 2. For each height section, the branch variables were aggregated by computing the mean (Equation (2)), as follows:
y ¯ method H ij = k = 1 n method H ij y H ijk n method H ij
where y ¯ method H ij is the average variable (e.g., BD, BL, and α) of the height section j of tree i, y H ijk is the individually measured branch variable within height section j of tree i, n method H ij is the number of branches measured by Cyclone or TreeQSM in height section j of tree i, and the estimation method is either Cyclone or TreeQSM.
For comparing the branch locational variables insertion height and azimuth, we used a nonparametric Kolmogorov–Smirnov test to compare the Cyclone and the TreeQSM estimates, using the R package “stats” [56].

2.5.2. Measures for Comparing the Cyclone and TreeQSM Estimates

We assessed the differences between the two TLS-based branch estimates with the following four measures:
MD Hij = mean   difference   by   height   sec tion = y ¯ Cyclone H ij y ¯ TreeQSM H ij
MPD Hij = Mean   percent   difference   by   height   sec tion = MD Hij y ¯ Cyclone H ij 100   [ % ]
MAD Hij =   Mean   absolute   by   height   sec tion = | y ¯ Cyclone H ij y ¯ TreeQSM H ij |
MAPD Hij = Mean   percent   absolute   difference   = | y ¯ Cyclone H ij y ¯ TreeQSM H ij | y ¯ Cyclone H ij 100   [ % ]
We used a paired t-test to access the overall difference between the attribute estimates from Cyclone and TreeQSM. The null hypothesis of the paired t-test is that the mean difference (MD) equals zero. The paired t-test will reveal whether MD follows a normal distribution, namley: N ( 0 ,   σ A 2 ) , where σ A 2 is the variance of MD of attribute estimate A (A could be the branch diameter, branch length, or branch insertion angle).
The point cloud density decreases with increasing height, suggesting that the height section is a possible factor affecting the difference in estimates. Furthermore, the branches belonging to the same stem can be viewed as repeated measurements; therefore, we also used a repeated measures analysis of variance (ANOVA) [60] to evaluate the differences between the Cyclone and TreeQSM estimates. To identify the structure of the covariance matrix (required by the repeated measures framework), we considered the following three structures: autoregressive of order 1 (AR(1)), unstructured variance, and compound symmetry, as recommended by Diggle et al. [61] and Fitzmaurice et al. [62]. The ANOVA equation used to test the difference by height section is as follows:
MD H ij = Height   Sec tion   Order j + ε ij
The covariance structure for the AR(1) is cov ( ε ij , ε ij - s ) = ρ s σ 2 , for the unstructured variance is cov ( ε ij , ε ij - s ) =   σ ji - s 2 , and for the compound symmetry is cov ( ε ij , ε ij - s ) = σ 1 2 [62], where cov stands for the covariance matrix, ε ij and ε ij - s are the model residual of tree i at height section of j and j-s, respectively, j s , ρ is the correlation between two measurements of 1 unit apart, and σ 2 is the overall variance of all of the measurements.

2.6. Simulation of Crown Architecture

In addition to directly comparing the estimations of the branch dimensions and locations with two procedures, we conducted a simulation analysis to find whether or not the TLS-based crown estimates can fit in the ranges of the documented Douglas-fir profiles [27,30,52]. Most Douglas-fir crown modeling studies have been conducted for plantations or old-growth forests [20,22,30,31]. The models for trees with similar crown development stages and sizes as our sample trees are not readily available. Thus, we used both second- [20,22] and old-growth [31] crown models to develop simulated crowns and to compare the simulated crown attributes with TLS-based estimates. Our sample trees were located within a natural regime stand with closed canopy and mixed DBH classes. We expected the crown attributes of our sample trees to be at the transitional stage between second- and old-growth trees. As the field measurements were not available, the comparisons between the TLS-based estimates and the exiting observations also served as a justification of TLS-based estimation.

2.6.1. Second-Growth Branch Size Models

Maguire et al. [20] developed maximum BD models for managed stands. Among all of the equations of Maguire et al. [20], we selected the constrained variable-exponent model to simulate BD, as follows:
BD ij = ( λ 1 CW λ 2 + δ i ) W C + ε ij
CW = MCW CR 0.01431509 CL + 0.07224024 DBH Ht
MCW = 1.4081 +   0.22111 DBH 0.00053438 DBH 2
W = 1 BRH 0.5
C = λ 3 BRH λ 4
BRH = h i h BC CL
λ 1 , λ 2 , λ 3 , and λ 4 are the coefficients fitted by Maguire et al. [20]. CW is the stand-grown maximum crown width, MCW is the open-grown maximum crown width, CR is the crown ratio, BRH is the branch relative height inside the crown, h i is the height of branch insertion point, and h BC is the height of crown base. δ i and ε ij are the random errors of the tree level and individual branch level, following distribution δ i ~ N ( 0 , δ 2 ) and ε ij ~ N ( 0 ,   σ 2 ) , respectively.
Roeh and Maguire [22] developed a set of crown profile models for coastal Douglas-firs, in which the estimated attributes were simultaneously corrected across the equations. An examination of the symmetrically modeled BD and BL in Roeh and Maguire revealed that BD and BL are smaller than the estimates from the point clouds of this study. Therefore, we only selected an individually developed BL model for the simulation [22], as follows:
BL ij = e d 1 DINC d 2 e d 3 DINC BD d 4 THT d 5
where the variables are defined in Table 1, and BD is the estimated branch diameter from Equation (8).

2.6.2. Old-Growth Branch Size Models

Unlike young plantation trees, the branches of old-growth trees are less constrained by tree size, and more determined by the depth of the crown. Ishii and Wilson [31] developed crown models for old-growth Douglas-firs, which could adapt to the variation of the branch forms. The branch size equation used in this study is as follows:
Z ij = aRDINC ij b ( 1 RDINC ij ) c
RDINC ij = THT i h ij THT i h BC i = DINC ij CL i
where Zij is the size of branch j from tree i (BD or BL), RDINCij is the relative depth into the crown, a is a coefficient, b and c are the scaling exponents, THT i is the total height of tree i, h ij is the branch j insertion height, and h BC i is the height of the crown base.
The final crown equation is fitted as a piecewise function, as at the lower end of the crown, the equation cannot capture the variability of the branch size.
{   Z ij = aRDINC ij b ( 1 RDINC ij ) c ,   DINC ij < h Z ij = ah b ( 1 h ) c ,   RDINC ij h
Previous studies have shown the existence of a relatively simple allometric relationship between BD and BL [30,63,64], as follows: BL = aBD b , where a and b are coefficients. To determine a and b, we used a pre-simulation to decide the range of a and b based on the BD and BL models of Ishii and Wilson. The final estimates of the branch length model is described as follows:
BL ij = 1.6971 × BD ij 0.6237

2.6.3. Simulation Algorithm

The simulation was performed for three DBH classes, each following a uniform distribution, as follows: DBH 1 j ~ U ( 50 ,   55 ) , DBH 2 j ~ U ( 60 ,   65 ) , and DBH 3 j ~ U ( 85 ,   105 ) . The selected boundaries cover the DBH range of sample trees, and represent the crown development at different stages. The number of sample trees within DBH classes 50–55, 60–65, and 85–105 cm were five, three, and two respectively. Although the trees of DBH classes 50–55 and 60–65 cm behaved similarly in the crown structural development, the sample trees were not evenly distributed within the entire DBH range of 50–65 cm, and the separation of the DBH classes would better approximate the transition of crown development. For each size class, we generated 10,000 simulated trees, and their crown attributes were estimated with both second- and old-growth models, as described above [20,22,31,65]. See Figure 4.
The steps of the synthetically generating crown attributes are as follows:
Step 1. Select DBH
A random number is drawn from the uniform distribution of DBH for each class.
Step 2. Compute tree height from DBH
An empirical height-DBH equation is used to determine the tree total height [66]:
THT = 1.3 + e ( a + b × DBH c ) + ε
where a = 5.7567, b = −6.7792, c = −0.2795, and ε is a random error, ε   ~   N ( 0 ,   σ ε 2 ) .
Step 3. Compute crown length
The crown ratio (CR) is generated from a uniform distribution, CR   ~   U ( 0.3 ,   0.7 ) . The selection of the crown ratio distribution is based on the observation of our sample trees. Then, the crown length is determined from its definition, as follows:
CL = CR × THT
Step 4. Select the number of branches and branch insertion height
The number of first ordered branches is established, assuming that it follows a uniform distribution, NB i ~ U ( 60 ,   140 ) , where NB i is the number of branches of simulated tree i. The boundaries of the uniform distribution of NB is determined by the observation of the sample trees.
The branch insertion height is determined by the BRH, which follows a beta distribution. A pre-simulation was executed to decide parameters α and β of an assumed beta distribution, which yielded the following ranges for α and β:
{ α   ~   U ( 1 ,   3 ) β   ~   U ( 1 ,   3 ) β 1.5 × α
We simulated BRH following the distribution BRH ij ~ Beta ( α ,   β ) , where BRH ij is the ith branch relative height above crown for jth simulated tree.
Step 5. Compute the branch diameter and branch length
For a second-growth tree, the branch diameter is determined by Equation (8) and branch length are determined by Equation (14). For an old-growth tree, the branch diameter is determined by Equation (17) and branch length is determined by Equation (18).

3. Results

3.1. Tree Level Estimates

We found no bias in the TreeQSM estimates of DBH (Table 3). However, TreeQSM estimated the total height to be consistently smaller than Cyclone, by approximately 10%. For tree #3, a large discrepancy was present between the Cyclone and TreeQSM estimated DBH and height, in which TreeQSM overestimated DBH by 17 cm (20%) and underestimated the tree height by 10 m (18.5%) (Table 3). The difference between the Cyclone and TreeQSM crown length estimates ranges from 0.2–3.92 m (Table 3). A major difference between the two procedures is that TreeQSM identifies fewer first order branches than Cyclone, sometime as low as 31%.

3.2. Estimation of Branch Attributes

3.2.1. Branches Azimuth and Insertion Height

The majority of the branches identified by TreeQSM were located in the lower portion of the crown, whereas Cyclone generated widely spread branch distribution along the height of the tree (Figure 5). The distributions of azimuths for both procedures were similar. The majority of identified branches were facing south, with azimuth ranging from 90° to 270°, except for trees #3 and #4, whose DBHs (>80 cm) were greater than the other trees (Figure 5). The distribution of the branch azimuth by the DBH class is primarily determined by the light condition of the canopy. For small trees, most branches are south facing where light abounds, while for large trees, some branches are facing north where branch exclusion allows some light.
The distribution of the branch insertion height exhibits an obvious shift between the Cyclone estimates and TreeQSM estimates, suggesting that automatic procedures supplied values lower than the Cyclone procedure (Figure 6). The Kolmogorov–Smirnov test confirms the difference between the branch insertion height estimated by the two procedures, as no tree was found with a similar distribution (p-value < 0.05; Figure 6). The largest disagreement in the distribution of the branch insertion height occurred between 17–36 m. In contrast to the branch insertion height, the distributions of the estimated azimuths were much more similar for Cyclone and TreeQSM (Figure 7). The Kolmogorov–Smirnov test confirmed the similarities of the branch azimuth distributions estimated by the two procedures, as only one tree (i.e., four) had different distributions (p-value < 0.05).

3.2.2. Branches Diameter.

TreeQSM estimated that the mean BD was greater than the Cyclone estimates, below an insertion height of 29 m (Table 4 and Figure 8a). Above 29 m, the TreeQSM estimates were smaller than the Cyclone estimates (Table 4 and Figure 8a). The normality of the paired t-test was met for the BD estimates. The paired t-test indicated no difference between the overall mean of the Cyclone and TreeQSM BD estimates (p-value = 0.96) by individual trees over the entire tree profile.
The section-wise comparison revealed that the repeated measurement framework with the AR(1) structure yielded the smallest Akaike information criterion (AIC)value (Table 5), suggesting that branch diameter estimates along the stem were not independent, but correlated with the insertion height. The Cyclone BD estimates were relatively constant across the height sections. In contrast, the TreeQSM BD estimates decreased with the increase in the height section. The largest discrepancy between the BD estimates of the two procedures was at the height section of 35–37 m (Table 4), where TreeQSM underestimated the mean BD by 2.34 cm (40.08%). The underestimation was probably the result of the unsuccessful construction of a branch structure due to sparse point clouds. Although the abundance of points is supposed to yield similar estimates for the branch diameter, the second largest difference was found at the height section below 15 m, where the average BD computed with TreeQSM was 1.53 cm (28.75%) greater than the Cyclone value (Table 4). The overestimation of the small size branches by TreeQSM was also found by previous studies [44,67], where plenty of points were available.

3.2.3. Branch Length Estimates

Both Cyclone and TreeQSM yielded the longest mean BL estimates at the base of the crown (Figure 9). The paired t-test indicates that the Cyclone mean BL estimate was significantly larger than the TreeQSM estimate (i.e., 0.49 m) by aggregation of the height sections (p-value < 0.001). The largest discrepancy in length estimates occurred at the height section of 26–29 m (Figure 9), where the mean difference and mean absolute difference were 1.34 m (33.4%) and 1.52 m (37.7%), respectively (Table 6). ANOVA does not indicate the difference in length estimates in response to the height section (i.e., p-value is 0.25). The normality assumption, required for ANOVA, was met, but the homoscedasticity was not, as the variance of the difference between the estimated BL for height section 15–18, 23–26, and 29–32 m was relatively higher than for the other height sections (Figure 9).

3.2.4. Branch Insertion Angle Estimates

Both angle estimates did not show a strong correlation with the height section (Figure 10). The paired t-test indicated that the mean Cyclone estimated angle was 9.916° (i.e., 10.52%) greater than the TreeQSM estimates by aggregation of height sections (i.e., p-value < 0.001). The largest mean difference between the two estimates occurred at 18–23 m (Table 7), and is 20.90° (i.e., 22.63%). ANOVA suggests that the difference between the angle estimates also did not vary across height sections (i.e., p-value is 0.087). As the height is below 18 m, the Cyclone mean estimated insertion angles were smaller than the TreeQSM estimates. For a height above 18 m, the Cyclone estimated mean insertion angles were greater than the TreeQSM estimates, except for the height section of 29–32 m (Figure 10b).

3.3. Simulated Crowns

The TLS-based estimates for BD and BL were compared with the same attributes from the simulated trees, without differentiating the whorl from the epicormic branches. Therefore, we used the maximums to reflect the key attributes of the crown profile, usually defined by the whorl branches [20,65], and the means to consider all of the branches. Furthermore, the crown profiles derived from Cyclone and TreeQSM were compared in order to test whether TreeQSM could develop average tree structures that are comparable with Cyclone.

3.3.1. Branch Diameter

Simulated old-growth trees have wider ranges of mean and maximum BD compared with second-growth trees (Figure 11), because of the greater variability of old-growth crowns. As the fitted polynomial curves show, both the Cyclone and TreeQSM estimated mean BD profiles were slightly greater than the simulated second-growth trees (Figure 11a,b), except for DBH at 85–105 cm. The mean BD profiles of the Cyclone and TreeQSM estimates were consistent with the simulated second-growth trees, in which the largest mean BDs were located in the middle-lower crown, and the smallest mean BDs were located at the top of the crown (Figure 11a–c). In comparison with the Cyclone mean BD estimates, the variance of the TreeQSM mean BD estimates were greater. For the DBH class of 50–55 cm, TreeQSM yielded greater mean BD estimates than Cyclone at the lower crown (Figure 11a). For a DBH class of 60–65 and 85–105 cm, the Cyclone and TreeQSM BD estimates show better agreement.
For both Cyclone and TreeQSM, the maximum BD estimates were similar to the simulated old-growth trees for DBH classes 50–55 and 60–65 cm (Figure 11a,e), with mean difference less than 1 cm. However, for DBH class 85–105 cm, the overall simulated old-growth trees’ maximum BDs were 8.51 and 9.60 cm averagely greater than Cyclone and TreeQSM estimates, respectively. Instead, the mean differences between the simulated second-growth trees’ maximum BD and TLS-based estimates were within 1.5 cm for the DBH class of 85–105 cm (Figure 11f). Similar to the mean BD estimates, the TreeQSM maximum BD estimates were more variable than the Cyclone estimates. TreeQSM generated greater maximum BD estimates than Cyclone for DBH class 50–55 cm.

3.3.2. Branch Length

Overall, both the simulated second- and old-growth trees had longer mean BL estimates than the TLS-based estimates (Figure 12a–c). The fitted curves on the Cyclone mean BL estimates suggested the presence of three crown shapes, namely: ellipsoid crown for DBH class 50–55 cm, where the longest branches were at the middle-lower crown (Figure 12a); conic crown for DBH class 60–65 cm, where the longest branches were at the bottom (Figure 12b); and cylindrical crown for DBH class 85–105 cm, where the branch lengths were relatively constant along the canopy (Figure 12c). In comparison with Cyclone, the mean BL estimates supplied by TreeQSM underestimated the mean BL for DBH class 50–55 and 85–105 cm by 0.3 and 1.12 m, respectively (Figure 12a–c).
For the maximum BL, both the Cyclone and TreeQSM estimates were close to the simulated old-growth trees for DBH classes 50–55 and 60–65 cm, with a mean difference less than 1 m (Figure 12d,e). However, great difference is present between TLS-based maximum BL estimates and simulated old- and second-growth trees for the trees with a DBH ≥85 cm (Figure 12f). Unlike the ellipsoidal shapes of the maximum BL estimates for DBH 50–55 and 60–65 cm, the round crown shapes were present for DBH 85–105 cm, irrespective the procedure, in which the longest BLs were present in the middle–upper crown. Both simulated second- and old-growth trees had longer maximum BL estimates than the Cyclone and TreeQSM estimates for DBH class 85–105 cm, and the difference was greater than 2 m.

4. Discussion

4.1. Comparison of TreeQSM and Cyclone Crown Attribute Estimates

TreeQSM reduced the time and effort of the Cyclone procedure, but the results were still significantly different. In total, the semi-automatic procedure using Cyclone identified 761 branches for the 10 trees, whereas TreeQSM identified only 38% of branches with comparable dimensions and similar locations, mainly for the lower crown. However, for the upper crown where the point cloud was sparse, considerable branches were missed by TreeQSM. For all of the sample trees, TreeQSM failed to construct accurate stem models above 15 m (Figure 13b), where the disconnection of point clouds happened because of an obstruction of the scan view and a reduction of the point cloud density. The stem model construction was terminated before the process reached the top of the crown, as insufficient point clouds were available for the modeling process. TreeQSM might yield underestimated tree height for tall trees like tree #3 because of incomplete stem models. However, the region grow function in Cyclone could still accurately approximate the remaining point patches for the stem model construction at the higher portion of the crown (Figure 13a). TreeQSM miscategorized some first-order branches as second-order (Figure 13c). We examined the miscategorized branches, included the miscategorized second-order branches, and cleaned the branches that were wrongly categorized as first-order. TreeQSM failed to construct structural models of the stems with an irregular form and strong inclination, such as tree #3 (Figure 13f), resulting in an incorrect DBH estimation. In Cyclone, the stem model construction was controlled with human assistance. The stem cylindrical models were manually adjusted to approximate the point clouds (Figure 13e). TreeQSM also misidentified some stem points as branch points, and incorrectly constructed nonexistent branches (Figure 13h).
For both the Cyclone and TreeQSM estimated BD, the accuracy was constrained by the application of the pipe models, as real branches have irregular shapes rather than perfect cylinders. With the human-aid computation, Cyclone is believed to generate more accurate BD estimates, especially for complex understory canopy, because the noise and leaf points are manually excluded from the pipe model construction. TreeQSM could accurately construct pipe models for the broadleaf tree stems and branches [42,44,68,69], particularly for branches and stem diameters greater than 10 cm [68]. For branches smaller than 10 cm in diameter, TreeQSM was prone to overestimation [44,67]. However, the BD estimation with TreeQSM was challenging, as the average branch diameter was smaller than 7 cm in this study. Whereas the TreeQSM estimates of BD were questionable, the DBH was not, considering that the trees used in this study were mature, with a large DBH. Therefore, TreeQSM supplied reliable DBH, as no significant difference was found from the Cyclone values.
Our results suggest that branch height plays a significant role in the accuracy of TreeQSM estimation of BD, because branch height is directly related to the point cloud density and the abundance of information carried in the point clouds [69]. Inside the lower crown, where sufficient points were available, TreeQSM yielded greater mean BD estimates than Cyclone, which is probably as a result of an error introduced by the leaves and noise points. Inside the upper crown, TreeQSM provided smaller diameters than Cyclone, because an insufficient point density was available to construct and connect the cylinder models. Consequently, the overall means of the BD estimates along the entire crown profile were not different between TreeQSM and Cyclone at an individual tree level.
Cyclone estimated BL depends only on the identification of the few points defining the overall skeleton of the branches. In contrast, BL estimation with TreeQSM requires enough points for cylinder model construction through the entire branch extent. Thus, BL estimation with TreeQSM is very sensitive to the density of the points. False bifurcations caused by noise points and patches of points terminate the branch model construction, resulting in BL estimation errors. The average BL was almost 0.5 m greater in Cyclone than TreeQSM. Our results are consistent with Lau et al. [44], who found that TreeQSM is more reliable for estimating branch diameter than branch length.
Cyclone estimated that the branch insertion angle would be more accurate in the lower crown, as both the branch and stem were fitted with sufficient points. For the upper crown sections, the accuracy of the branch angle estimation depended not only on the determination of the branch skeleton, but also on the accuracy of the projected stem cylinder from the lower section. The average TreeQSM estimated branch insertion angle was 9° smaller than the Cyclone values. As the accuracy of the angle estimates was associated with the availability of points, we were surprised to find minute differences in the angle estimates between TreeQSM and Cyclone across the canopy height. We hypothesize that unlike the branch length, which relies on the successful construction of the pipe model for the entire branch, angle estimation is only determined by the main skeleton at the branch base.

4.2. Crown Architecture and Development Stage Derived with TLS-Based Estimates

The simulations confirmed our expectation that TLS-based crown estimates would be within the range between second- and old-growth trees. For trees of DBH classes 50–55 and 60–65 cm, the TLS-based mean BD and BL estimates were similar to the second-growth trees, whereas, the maximum BD and BL estimates fitted in the range of the old-growth trees, indicating a transitional crown development stage [1]. However, crown expansion was not present in the trees of DBH class 85–105 cm, as the crown size was significantly smaller than for the simulated second- and old-growth trees, which is probably associated with the branch exclusion caused by canopy closure [1].
Conceptual crown architectures are drawn based on TreeQSM and Cyclone crown estimates by DBH classes (Figure 14 and Figure 15). TreeQSM depicted similar crown form with Cyclone for trees with DBH between 50–55 cm. However, TreeQSM omitted large numbers of branches for trees with DBH ≥60 cm. As the tree grows, branch exclusion occurs on the lower crown given the limited light, resulting in upward migration of crown mass. Therefore, TreeQSM could less accurately retrieve crown attributes for trees with DBH ≥60, in which the majority of branches are located at the higher portion of crowns than trees with DBH ≤55 cm. Consistent with greater variances of TreeQSM estimated BL and insertion angle, TreeQSM also derived more irregular crown profiles than Cyclone (Figure 13), supporting the uncertainties in the estimation of crown attributes using TreeQSM.
The conceptual crown architectures (Figure 15) developed based on Cyclone are supported by a previous study of age-related crown development [52]. Our results suggest transitions of ellipsoid and conic crown shapes to a cylindrical crown with the increase in DBH, as well as increasing gaps from branch loss due to light competition [1] (Figure 15). For DBH classes of 50–55 cm and 60–65 cm, canopy gaps were mainly found in lower crowns facing north, which likely were caused by the absence of enough light (Figure 15a,b). However, extraordinarily long isolated branches were also found in low canopy gaps, probably as a result of increasing the light availability from the neighboring branch exclusion (Figure 15a,b). In addition, the variation of the insertion angle increased with the growing tree size (Figure 15c). The diversity of the insertion angle eventually will increase the light resource for the neighboring branches. For trees with DBH ≥85 cm, most branches are surprisingly north facing, possibly because of the light competition from neighboring trees that challenges south-facing branch expansion.
Our findings suggest that point clouds can provide fine scale crown architectural estimates comparable with field measurements. The crown attributes generated from the human-aid TLS estimation procedure are consistent with existing studies [20,27,31,52]. The comparison of crown attributes by DBH classes provides numerical support for crown development, driven by the light condition defined by neighboring trees.

5. Conclusions

This study evaluated the accuracy of two TLS-based estimation procedures of mature Douglas-fir crown attributes of neighboring dominant and codominant mature trees. Additionally, we assessed the ability of the estimation procedures to describe the crown attributes of mature unmanaged Douglas-firs. The two procedures are a semi-automatic approach, Cyclone, and an automation process, TreeQSM. Although limited human interference is required in TreeQSM processes, the uncertainty of the TreeQSM estimated crown attributes challenges its application in dense conifer forests. Therefore, significantly more work is needed to implement an operational automatic crown measurement algorithm, similar to TreeQSM, for tall Douglas-firs. We expect that comparable conclusions would be found for other coniferous species, as similar crown architecture is present. Among the estimated attributes, the branch diameters computed by TreeQSM are the closest to the Cyclone values, whereas the branch lengths are significantly shorter than the Cyclone values. The simulated trees based on the TLS estimates suggest an intermediate developmental stage of the trees, as they are between the second- and old-growth stands. The conceptual crown architectures developed based on TLS estimates are similar to other studies, supporting the finding that crown development is driven by light availability.

Author Contributions

Conceptualization, B.M.S. and R.F.; Methodology, R.F.; Software, R.F.; Validation, Rong Fang and B.M.S.; Formal Analysis, R.F.; Investigation, R.F.; Resources, B.M.S.; Data Curation, R.F.; Writing-Original Draft Preparation, R.F.; Writing-Review & Editing, B.M.S.; Visualization, R.F.; Supervision, B.M.S.; Project Administration, B.M.S.; Funding Acquisition, B.M.S.

Funding

This research was funded by the National Institute of Food and Agriculture, U.S. Department of Agriculture, McIntire Stennis project OREZ-FERM-875 and by the H. J. Andrews Experimental Forest thru the Fellowship program (submitted by Thomas Hilker).

Acknowledgments

We gratefully acknowledge the field assistance from Michael Olsen. We thank the H. J. Andrews Experimental Forest for providing accommodation and support in collecting the data.

Conflicts of Interest

The authors declare no conflict of interest.

References

  1. Franklin, J.F.; Spies, T.A.; Van Pelt, R.; Carey, A.B.; Thornburgh, D.A.; Berg, D.R.; Lindenmayer, D.B.; Harmon, M.E.; Keeton, W.S.; Shaw, D.C. Disturbances and structural development of natural forest ecosystems with silvicultural implications, using Douglas-fir forests as an example. For. Ecol. Manag. 2002, 155, 399–423. [Google Scholar] [CrossRef]
  2. Ishii, H.T.; Tanabe, S.; Hiura, T. Exploring the Relationships Among Canopy Structure, Stand Productivity, and Biodiversity of Temperate Forest Ecosystems. For. Sci. 2004, 50, 342–355. [Google Scholar]
  3. Spies, T.A.; Hemstrom, M.A.; Youngblood, A.; Hummel, S. Conserving Old-Growth Forest Diversity in Disturbance-Prone Landscapes. Conserv. Biol. 2006, 20, 351–362. [Google Scholar] [CrossRef]
  4. Chen, J.; Franklin, J. Growing-season microclimate variability within an old-growth Douglas-fir forest. Clim. Res. 1997, 8, 21–34. [Google Scholar] [CrossRef] [Green Version]
  5. Aussenac, G. Interactions between forest stands and microclimate: Ecophysiological aspects and consequences for silviculture. Ann. For. Sci. 2000, 57, 287–301. [Google Scholar] [CrossRef]
  6. Parker, G.G. Canopy Structure and Light Environment of an Old-Growth Douglas-Fir/Western Hemlock Forest; Smitsonian Environmental Research Center: Edgewater, MD, USA, 1997. [Google Scholar]
  7. Brunner, A.; Nigh, G. Light absorption and bole volume growth of individual Douglas-fir trees. Tree Physiol. 2000, 20, 323–332. [Google Scholar] [CrossRef]
  8. Clement, J.P.; Shaw, D.C. Crown structure and the distribution of epiphyte functional group biomass in old-growth Pseudotsuga menziesii trees. Ecoscience 1999, 6, 243–254. [Google Scholar] [CrossRef]
  9. Sillett, S.C.; Bailey, M.G. Effects of tree crown structure on biomass of the epiphytic fern Polypodium scouleri (Polypodiaceae) in redwood forests. Am. J. Bot. 2003, 90, 255–261. [Google Scholar] [CrossRef]
  10. Sillett, S.; Neitlich, P.N. Emerging Themesin epiphyte researchin westside forestswith special referenceto cyanolichens. Northwest Sci. 1996, 70, 54–60. [Google Scholar]
  11. Lyons, B.; Nadkarni, N.M.; North, M.P. Spatial distribution and succession of epiphytes on Tsuga heterophylla (Western Hemlock) in an old-growth Douglas-fir forest. Can. J. Bot. 2000, 78, 957–968. [Google Scholar]
  12. Briggs, D.; Ingaramo, L.; Turnblom, E. Number and diameter of breast-height region branches in a Douglas-fir spacing trial and linkage to log quality. For. Prod. J. 2007, 57, 28. [Google Scholar]
  13. Barbour, R.J.; Johnston, S.; Hayes, J.P.; Tucker, G.F. Simulated stand characteristics and wood product yields from Douglas-fir plantations managed for ecosystem objectives. For. Ecol. Manag. 1997, 91, 205–219. [Google Scholar] [CrossRef]
  14. Maguire, D.A.; Brissette, J.C.; Gu, L. Crown structure and growth efficiency of red spruce in uneven-aged, mixed-species stands in Maine. Can. J. For. Res. 1998, 28, 1233–1240. [Google Scholar] [CrossRef]
  15. Michel, A.K.; Winter, S. Tree microhabitat structures as indicators of biodiversity in Douglas-fir forests of different stand ages and management histories in the Pacific Northwest, U.S.A. For. Ecol. Manag. 2009, 257, 1453–1464. [Google Scholar] [CrossRef]
  16. Swanson, F.J.; Franklin, J.F. New Forestry Principles from Ecosystem Analysis of Pacific Northwest Forests. Ecol. Appl. 1992, 2, 262–274. [Google Scholar] [CrossRef] [PubMed]
  17. Davis, L.R.; Puettmann, K.J.; Tucker, G.F. Overstory Response to Alternative Thinning Treatments in Young Douglas-fir Forests of Western Oregon. Northwest Sci. 2007, 81, 1–14. [Google Scholar] [CrossRef]
  18. Bauhus, J.; Puettmann, K.; Messier, C. Silviculture for old-growth attributes. For. Ecol. Manag. 2009, 258, 525–537. [Google Scholar] [CrossRef] [Green Version]
  19. Maguire, D.A.; Kershaw, J.A.; Hann, D.W. Predicting the effects of silvicultural regime on branch size and crown wood core in Douglas-fir. For. Sci. 1991, 37, 1409–1428. [Google Scholar]
  20. Maguire, D.A.; Johnston, S.R.; Cahill, J. Predicting branch diameters on second-growth Douglas-fir from tree-level descriptors. Can. J. For. Res. 1999, 29, 1829–1840. [Google Scholar] [CrossRef]
  21. Maguire, D.; Moeur, M.; Bennett, W. Models for describing basal diameter and vertical distribution of primary branches in young Douglas-fir. For. Ecol. Manag. 1994, 63, 23–55. [Google Scholar] [CrossRef]
  22. Roeh, R.L.; Maguire, D.A. Crown profile models based on branch attributes in coastal Douglas-fir. For. Ecol. Manag. 1997, 96, 77–100. [Google Scholar] [CrossRef]
  23. Kershaw, J.A., Jr.; Maguire, D.A. Crown structure in western hemlock, Douglas-fir, and grand fir in western Washington: Horizontal distribution of foliage within branches. Can. J. For. Res. 1996, 26, 128–142. [Google Scholar] [CrossRef]
  24. Mori, S.; Hagihara, A. Crown profile of foliage area characterized with the Weibull distribution in a hinoki (Chamaecyparis obtusa) stand. Trees-Struct. Funct. 1991, 5, 149–152. [Google Scholar] [CrossRef]
  25. Maguire, D.A.; Bennett, W.S. Patterns in vertical distribution of foliage in young coastal Douglas-fir. Can. J. For. Res. 1996, 26, 1991–2005. [Google Scholar] [CrossRef]
  26. Van Pelt, R.; North, M.P. Analyzing canopy structure in Pacific Northwest old-growth forests with a stand-scale crown model. Northwest Sci. 1996, 70, 15–30. [Google Scholar]
  27. Pelt, R.V.; Sillett, S.C. Crown development of coastal Pseudotsuga menziesii, including a conceptual model for tall conifers. Ecol. Monogr. 2008, 78, 283–311. [Google Scholar] [CrossRef]
  28. Van Pelt, R.; O’Keefe, T.C.; Latterell, J.J.; Naiman, R.J. Riparian forest stand development along the Queets river in Olympic National Park, Washington. Ecol. Monogr. 2006, 76, 277–298. [Google Scholar] [CrossRef]
  29. Ishii, H.; Ford, E.D. Persistence of Pseudotsuga menziesii (Douglas-fir) in temperate coniferous forests of the Pacific Northwest Coast, USA. Folia Geobot. 2002, 37, 63–69. [Google Scholar] [CrossRef]
  30. Ishii, H.; Clement, J.P.; Shaw, D.C. Branch growth and crown form in old coastal Douglas-fir. For. Ecol. Manag. 2000, 131, 81–91. [Google Scholar] [CrossRef]
  31. Ishii, H.; Wilson, M.E. Crown structure of old-growth Douglas-fir in the western Cascade Range, Washington. Can. J. For. Res. 2001, 31, 1250–1261. [Google Scholar] [CrossRef]
  32. Danson, F.M.; Hetherington, D.; Morsdorf, F.; Koetz, B.; Allgower, B. Forest Canopy Gap Fraction from Terrestrial Laser Scanning. IEEE Geosci. Remote Sens. Lett. 2007, 4, 157–160. [Google Scholar] [CrossRef]
  33. Coops, N.C.; Hilker, T.; Wulder, M.A.; St-Onge, B.; Newnham, G.; Siggins, A.; Trofymow, J.T. Estimating canopy structure of Douglas-fir forest stands from discrete-return LiDAR. Trees 2007, 21, 295. [Google Scholar] [CrossRef]
  34. Hilker, T.; van Leeuwen, M.; Coops, N.C.; Wulder, M.A.; Newnham, G.J.; Jupp, D.L.; Culvenor, D.S. Comparing canopy metrics derived from terrestrial and airborne laser scanning in a Douglas-fir dominated forest stand. Trees 2010, 24, 819–832. [Google Scholar] [CrossRef]
  35. Moskal, L.M.; Zheng, G. Retrieving Forest Inventory Variables with Terrestrial Laser Scanning (TLS) in Urban Heterogeneous Forest. Remote Sens. 2012, 4, 1–20. [Google Scholar] [CrossRef]
  36. García, M.; Danson, F.M.; Riaño, D.; Chuvieco, E.; Ramirez, F.A.; Bandugula, V. Terrestrial laser scanning to estimate plot-level forest canopy fuel properties. Int. J. Appl. Earth Obs. Geoinf. 2011, 13, 636–645. [Google Scholar] [CrossRef]
  37. Srinivasan, S.; Popescu, S.C.; Eriksson, M.; Sheridan, R.D.; Ku, N.-W. Terrestrial Laser Scanning as an Effective Tool to Retrieve Tree Level Height, Crown Width, and Stem Diameter. Remote Sens. 2015, 7, 1877–1896. [Google Scholar] [CrossRef] [Green Version]
  38. Moorthy, I.; Miller, J.R.; Berni, J.A.J.; Zarco-Tejada, P.; Hu, B.; Chen, J. Field characterization of olive (Olea europaea L.) tree crown architecture using terrestrial laser scanning data. Agric. For. Meteorol. 2011, 151, 204–214. [Google Scholar] [CrossRef]
  39. Zeide, B.; Pfeifer, P. A method for estimation of fractal dimension of tree crowns. For. Sci. 1991, 37, 1253–1265. [Google Scholar]
  40. Delagrange, S.; Jauvin, C.; Rochon, P. PypeTree: A tool for reconstructing tree perennial tissues from point clouds. Sensors 2014, 14, 4271–4289. [Google Scholar] [CrossRef]
  41. Hackenberg, J.; Spiecker, H.; Calders, K.; Disney, M.; Raumonen, P. SimpleTree—an efficient open source tool to build tree models from TLS clouds. Forests 2015, 6, 4245–4294. [Google Scholar] [CrossRef]
  42. Raumonen, P.; Kaasalainen, M.; Åkerblom, M.; Kaasalainen, S.; Kaartinen, H.; Vastaranta, M.; Holopainen, M.; Disney, M.; Lewis, P. Fast Automatic Precision Tree Models from Terrestrial Laser Scanner Data. Remote Sens. 2013, 5, 491–520. [Google Scholar] [CrossRef] [Green Version]
  43. Ghimire, S.; Xystrakis, F.; Koutsias, N. Using Terrestrial Laser Scanning to Measure Forest Inventory Parameters in a Mediterranean Coniferous Stand of Western Greece. PFG–J. Photogramm. Remote Sens. Geoinf. Sci. 2017, 85, 213–225. [Google Scholar] [CrossRef]
  44. Lau, A.; Bentley, L.P.; Martius, C.; Shenkin, A.; Bartholomeus, H.; Raumonen, P.; Malhi, Y.; Jackson, T.; Herold, M. Quantifying branch architecture of tropical trees using terrestrial LiDAR and 3D modelling. Trees 2018, 32, 1219–1231. [Google Scholar] [CrossRef] [Green Version]
  45. Burt, A.; Disney, M.; Raumonen, P.; Armston, J.; Calders, K.; Lewis, P. Rapid Characterisation of Forest Structure from TLS and 3D Modelling; IEEE: Piscataway, NJ, USA, 2013; pp. 3387–3390. [Google Scholar]
  46. Raumonen, P.; Casella, E.; Calders, K.; Murphy, S.; Åkerbloma, M.; Kaasalainen, M. Massive-scale tree modelling from tls data. ISPRS Ann. Photogramm. Remote Sens. Spat. Inf. Sci. 2015, II-3/W4, 189–196. [Google Scholar] [CrossRef]
  47. Gonzalez de Tanago, J.; Lau, A.; Bartholomeus, H.; Herold, M.; Avitabile, V.; Raumonen, P.; Martius, C.; Goodman, R.C.; Disney, M.; Manuri, S.; et al. Estimation of above-ground biomass of large tropical trees with terrestrial LiDAR. Methods Ecol. Evol. 2018, 9, 223–234. [Google Scholar] [CrossRef]
  48. Jackson, T.; Shenkin, A.; Wellpott, A.; Calders, K.; Origo, N.; Disney, M.; Burt, A.; Raumonen, P.; Gardiner, B.; Herold, M.; et al. Finite element analysis of trees in the wind based on terrestrial laser scanning data. Agric. For. Meteorol. 2019, 265, 137–144. [Google Scholar] [CrossRef]
  49. Malhi, Y.; Jackson, T.; Patrick Bentley, L.; Lau, A.; Shenkin, A.; Herold, M.; Calders, K.; Bartholomeus, H.; Disney, M.I. New perspectives on the ecology of tree structure and tree communities through terrestrial laser scanning. Interface Focus 2018, 8, 20170052. [Google Scholar] [CrossRef] [Green Version]
  50. Ferrarese, J.; Affleck, D.; Seielstad, C. Conifer crown profile models from terrestrial laser scanning. Silva Fenn 2015, 49, 1106. [Google Scholar] [CrossRef]
  51. van Leeuwen, M.; Coops, N.C.; Hilker, T.; Wulder, M.A.; Newnham, G.J.; Culvenor, D.S. Automated reconstruction of tree and canopy structure for modeling the internal canopy radiation regime. Remote Sens. Environ. 2013, 136, 286–300. [Google Scholar] [CrossRef]
  52. Ishii, H.; McDowell, N. Age-related development of crown structure in coastal Douglas-fir trees. For. Ecol. Manag. 2002, 169, 257–270. [Google Scholar] [CrossRef]
  53. Getzin, S.; Wiegand, K.; Schumacher, J.; Gougeon, F.A. Scale-dependent competition at the stand level assessed from crown areas. For. Ecol. Manag. 2008, 255, 2478–2485. [Google Scholar] [CrossRef]
  54. Kramer, R.D.; Sillett, S.C.; Van Pelt, R.; Franklin, J.F. Neighborhood competition mediates crown development of Picea sitchensis in Olympic rainforests: Implications for restoration management. For. Ecol. Manag. 2019, 441, 127–143. [Google Scholar] [CrossRef]
  55. Getzin, S.; Wiegand, K. Asymmetric tree growth at the stand level: Random crown patterns and the response to slope. For. Ecol. Manag. 2007, 242, 165–174. [Google Scholar] [CrossRef]
  56. Leica Geosystems Leica Cyclone Register 360; Leica Geosystems: Gallen, Switzerland, 2019.
  57. Nyland, R.D. Silviculture. Concepts and Applications; McGraw-Hill: New York, NY, USA, 1996. [Google Scholar]
  58. Pal, N.R.; Pal, S.K. A review on image segmentation techniques. Pattern Recognit. 1993, 26, 1277–1294. [Google Scholar] [CrossRef]
  59. Raumonen, P.; Casella, E.; Disney, M.; Åkerblom, M.; Kaasalainen, M. Fast Automatic Method for Constructing Topologically and Geometrically Precise Tree Models from TLS Data. In Proceedings of the International Conference on Function-Structural Plant Models, Saariselkä, Finland, 2013; pp. 89–91. [Google Scholar]
  60. Crowder, M.J.; Hand, D.J. Analysis of Repeated Measures; Monographs on Statistics and Applied Probability; Chapman and Hall: London, UK, 1990. [Google Scholar]
  61. Diggle, P.; Heagerty, P.; Liang, K.Y.; Zeger, S.L. Analysis of Longitudinal Data; Oxford University Press: New York, NY, USA, 2002. [Google Scholar]
  62. Fitzmaurice, G.M.; Laird, N.M.; Ware, J.H. Applied Longitudinal Analysis; Wiley: Hoboken NJ, USA, 2004; ISBN 978-0-471-21487-8. [Google Scholar]
  63. McMahon, T.A.; Kronauer, R.E. Tree structures: Deducing the principle of mechanical design. J. Theor. Biol. 1976, 59, 443–466. [Google Scholar] [CrossRef]
  64. Bertram, J.E.A. Size-dependent differential scaling in branches: The mechanical design of trees revisited. Trees 1989, 3, 241–253. [Google Scholar] [CrossRef]
  65. Hann, D.W. An Adjustable Predictor of Crown Profile for Stand-Grown Douglas-Fir Trees. For. Sci. 1999, 45, 217–225. [Google Scholar]
  66. Temesgen, H.; Hann, D.W.; Monleon, V.J. Regional Height–Diameter Equations for Major Tree Species of Southwest Oregon. West. J. Appl. For. 2007, 22, 213–219. [Google Scholar]
  67. Hackenberg, J.; Wassenberg, M.; Spiecker, H.; Sun, D. Non Destructive Method for Biomass Prediction Combining TLS Derived Tree Volume and Wood Density. Forests 2015, 6, 1274–1300. [Google Scholar] [CrossRef]
  68. Lau, A.; Martius, C.; Bartholomeus, H.; Shenkin, A.; Jackson, T.; Malhi, Y.; Herold, M.; Bentley, L.P. Estimating architecture-based metabolic scaling exponents of tropical trees using terrestrial LiDAR and 3D modelling. For. Ecol. Manag. 2019, 439, 132–145. [Google Scholar] [CrossRef]
  69. Calders, K.; Origo, N.; Burt, A.; Disney, M.; Nightingale, J.; Raumonen, P.; Åkerblom, M.; Malhi, Y.; Lewis, P. Realistic Forest Stand Reconstruction from Terrestrial LiDAR for Radiative Transfer Modelling. Remote Sens. 2018, 10, 933. [Google Scholar] [CrossRef]
Figure 1. LiDAR point clouds. (a) Rendering of the segmented sample tree point clouds; (b) point clouds of the entire plot and the locations of the 10 sample trees within the plot; (c) nadir view of the sample tree crowns.
Remotesensing 11 01661 g001
Figure 2. Crown measurements in Cyclone. (a) The point clouds of a sample tree. (b) Incomplete point clouds of the top section of crown. (c) Cylinder models of a branch. Branch insertion angle is measured as the angle between the stem axis and branch cylinder axis. (d) Branch length measurements: sum of the length of line segments. The maximum horizontal distance from the stem is the branch projected distance. (e) Cylinder model of the stem. (f) Dead branch without leaves attaches on it.
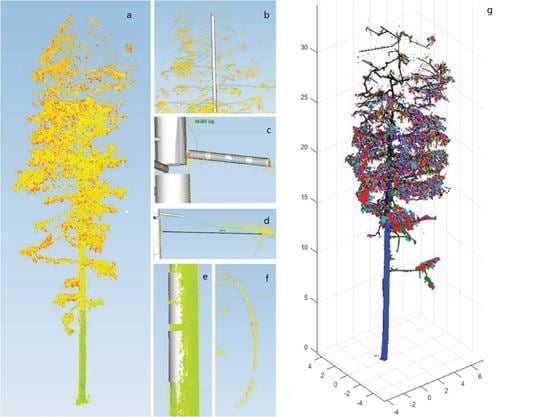
Remotesensing 11 01661 g002
Figure 3. An example of a quantitative structural models (QSM) created tree model. Different colors represent segments.
Remotesensing 11 01661 g003
Figure 4. The algorithm used to simulate individual trees crown using existing models.
Remotesensing 11 01661 g004
Figure 5. Terrestrial laser scanning (TLS) identified individual branches by insertion height and azimuth.
Remotesensing 11 01661 g005
Figure 6. Cumulative probability of branch insertion height. The p-values are for the Kolmogorov–Smirnov test used to compare the branch insertion height distribution of TreeQSM and Cyclone. The null hypothesis of the test is that two sets of values have the same distribution. Red dots mark the height at which the largest difference in the cumulative probability of the Cyclone and TreeQSM measured height is found.
Remotesensing 11 01661 g006
Figure 7. Cumulative probability of branch azimuth. The p-values are for the Kolmogorov–Smirnov test used to compare the branch azimuth distributions estimated by TreeQSM and Cyclone. The null hypothesis of the test is that two sets of values have the same distribution. Red dots mark the azimuth at which the largest difference in the cumulative probability of the Cyclone and TreeQSM estimates are found.
Remotesensing 11 01661 g007
Figure 8. Branch diameter estimates at insertion point by height section. (a) Comparison of branch diameter estimates of Cyclone and TreeQSM by height section; reference lines connect the mean of the aggregated estimates. (b) The difference of the branch diameter estimates between Cyclone and TreeQSM by height section.
Remotesensing 11 01661 g008
Figure 9. Branch length estimates by height section. (a) Estimates for Cyclone and TreeQSM; reference lines connect the mean of the aggregated estimates. (b) Difference between the branch length estimates of Cyclone and TreeQSM. The dots represent the outliers identified with the quantile approach.
Remotesensing 11 01661 g009
Figure 10. Branch angle estimates by height section. (a) Estimates for Cyclone and TreeQSM; reference lines connect the mean of the aggregated estimates. (b) Difference between branch insertion angle estimates of Cyclone and TreeQSM by height section.
Remotesensing 11 01661 g010
Figure 11. (ac) Mean and (df) maximum branch diameter of the 10 trees by diameter at breast height (DBH) class as a function of depth into the crown. The reference lines are second-order polynomial regression lines fit to the simulations and observations. Green and red lines are the simulated trees with second- and old-growth models, namely Ishii and Wilson (2001), and Maguire (1999) models. The shades represent the 95% confidence intervals of the simulated results of 10,000 trees.
Remotesensing 11 01661 g011
Figure 12. (ac) Mean and (df) maximum branch length of the 10 trees by DBH class as a function of depth into the crown. The reference lines are second order polynomial regression lines fit to the individual simulations and observations. Green and red lines are the simulated trees with second- and old-growth models, namely Ishii and Wilson (2001), and Maguire (1999) models. The shades represent the 95% confidence intervals of the simulated results of 10,000 trees.
Remotesensing 11 01661 g012
Figure 13. Comparisons of quantitative structural models constructed with TreeQSM and Cyclone. Identification of some typical errors of structural models developed with TreeQSM. (a) Accurate stem model (silver cylinder) developed in Cyclone. (b) Inaccurate stem models developed with TreeQSM (blue cylinders). (c) A first-order branch was categorized as second-order in TreeQSM (red cylinder). (d) Cyclone rendering of the point clouds of the same branch shown in (c). (e) Stem models at the breast height of tree #3 in Cyclone. (f) Incorrect stem models at breast height of tree #3 in TreeQSM. Cylindrical models (blue cylinder) deviate from the stem point clouds resulting in the overestimation of DBH. (g) Accurate stem model (silver cylinder) constructed in Cyclone. (h) TreeQSM misidentified the stem points as the branch points and constructed models for a nonexistent branch (green cylinders shown in the right).
Remotesensing 11 01661 g013
Figure 14. Conceptual Douglas-fir tree architectures developed based on TreeQSM crown attribute estimates by DBH classes. (a). Conceptual crown structure of a tree with DBH of 52 cm, height of 42 m, and crown length of 27 m. (b). Conceptual crown structure of a tree with DBH of 63 cm, height of 40 m, and crown length of 21 m. (c). Conceptual crown structure of a tree with DBH of 106 cm, height of 45 m, and crown length of 20 m.
Remotesensing 11 01661 g014
Figure 15. Conceptual Douglas-fir tree architectures developed based on the Cyclone crown attribute estimates by the DBH classes. (a). Conceptual crown structure of a tree with DBH of 51 cm, height of 42 m, and crown length of 30 m. (b). Conceptual crown structure of a tree with DBH of 63 cm, height of 42 m, and crown length of 30 m. (c). Conceptual crown structure of a tree with DBH of 93 cm, height of 51 m, and crown length of 22 m.
Remotesensing 11 01661 g015
Table 1. Summary of the involved crown attributes.
AttributeAbbreviationFormula
Diameter at breast heightDBH
Total Tree height THT
Branch diameter BD
Branch length BL
Branch insertion angle α
Branch azimuth θ
Height of branch i’s insertion point h i
Height of crown base h BC
Crown Length CL CL = THT h BC
Branch depth into the crownDINC DINC = THT h i
Table 2. Summary of the number of branches by height section.
Height of the Section (m)Number of Branches
CycloneTreeQSM
<152322
15–182830
18–238451
23–265846
26–298850
29–3210633
32–3511927
35–3811624
38–431015
>43340
Table 3. Semi-automatic (Cyclone) and automatic (TreeQSM) tree attribute estimates.
TreeDBH (cm)Tree Height (m)Crown Length (m)No. of Branches (First Order)
CycloneTreeQSMCycloneTreeQSMCycloneTreeQSMCycloneTreeQSM
1646540.5036.6030.5826.669649
2605844.0044.6535.1538.3012267
38410153.9943.8330.3429.918732
411011345.0045.8120.7121.684736
5565338.0637.1224.6221.353712
6636044.9344.3922.9524.308727
7505245.8346.7827.3727.577750
8525144.7641.2028.7028.829859
9494739.0035.2930.2726.717434
10515440.7840.1226.3326.613915
Average63.965.443.6941.5827.727.1976.438.1
Table 4. Summary of mean branch diameter estimates by height section.
HeightProcedureDifferenceAbsolute Difference
(m)Cyclone (cm)TreeQSM (cm)(cm)(%)(cm)(%)
<155.366.89−1.53−28.751.5328.75
15–176.206.40−0.20−5.100.6511.82
18–225.386.54−1.16−24.821.7535.32
23–255.926.04−0.12−4.121.3622.71
26–285.645.95−0.31−10.361.7831.53
29–315.755.090.674.561.4824.18
32–345.384.620.7613.652.1744.04
35–376.223.882.3440.802.3440.80
38–424.102.891.2129.511.2129.51
Table 5. Difference in branch diameter estimates between Cyclone and TreeQSM as a function of height section, within a repeated measurements framework. Akaike information criterion (AIC) is defined as: AIC = 2 k 2 ln L ^ , where k is the number of parameters, and L ^ is the maximum value of the likelihood function. Bayesian information criterion (BIC) is defined as: BIC = k × ln n 2 ln L ^ , where k is the number of parameters, n is the number of observations, and L ^ is the maximum value of the likelihood function.
Model TypeAICBIC
Unstructured161.8796175.6169
Repeated measures—AR(1)153.6215168.8851
Repeated measures—Compound Symmetry156.865172.1286
Table 6. Summary of branch length estimates by height section.
HeightProcedureDifferenceAbsolute Difference
(m)Cyclone (m)TreeQSM (m)(m)(%)(m)(%)
<154.965.06−0.100.370.5210.52%
15–183.622.930.690.581.0834.24%
18–233.183.42−0.24−13.870.4118.36%
23–263.532.840.6912.410.9624.90%
26–293.962.621.3433.381.5237.72%
29–323.383.370.02−2.440.8924.57%
32–353.102.620.498.580.8834.61%
35–383.682.641.0425.531.2632.37%
38–432.652.400.258.190.5721.09%
Table 7. Summary of branch angle estimates by height section.
Height SectionTreeQSMCycloneDifferenceAbsolute Difference
(m)Angle (°)Angle (°)(°)(%)(°)(%)
<1588.4577.27−11.18−21.4512.1622.49
15–1889.3084.17−5.12−9.8510.3815.37
18–2382.92103.8220.9018.9120.9018.91
23–2689.81103.4613.6511.8616.7515.27
26–3287.6096.528.918.3210.069.62
32–3583.6097.9814.3715.0618.9620.08
35–3885.3595.259.9010.0819.4320.53
38–4378.9485.856.916.6322.6826.37

