Article

A Deep Learning-Based Approach for Automated Yellow Rust Disease Detection from High-Resolution Hyperspectral UAV Images

1
School of Computing, Mathematics and Digital Technology, Manchester Metropolitan University, Manchester M1 5GD, UK
2
Key Laboratory of Digital Earth Science, Aerospace Information Research Institute, Chinese Academy of Sciences, Beijing 100094, China
3
School of Medicine, Tongji University, Shanghai 200092, China
4
Department of Computer Science, Loughborough University, Loughborough LE11 3TU, UK
5
CABI, Egham TW20 9TY, UK
6
Department of Forest Engineering, ERSAF, University of Cordoba, 14071 Córdoba, Spain
*
Author to whom correspondence should be addressed.
Remote Sens. 2019, 11(13), 1554; https://doi.org/10.3390/rs11131554
Submission received: 18 April 2019 / Revised: 24 June 2019 / Accepted: 25 June 2019 / Published: 29 June 2019
(This article belongs to the Section Remote Sensing in Agriculture and Vegetation)

Abstract

:
Yellow rust in winter wheat is a widespread and serious fungal disease, resulting in significant yield losses globally. Effective monitoring and accurate detection of yellow rust are crucial to ensure stable and reliable wheat production and food security. The existing standard methods often rely on manual inspection of disease symptoms in a small crop area by agronomists or trained surveyors. This is costly, time consuming and prone to error due to the subjectivity of surveyors. Recent advances in unmanned aerial vehicles (UAVs) mounted with hyperspectral image sensors have the potential to address these issues with low cost and high efficiency. This work proposed a new deep convolutional neural network (DCNN) based approach for automated crop disease detection using very high spatial resolution hyperspectral images captured with UAVs. The proposed model introduced multiple Inception-Resnet layers for feature extraction and was optimized to establish the most suitable depth and width of the network. Benefiting from the ability of convolution layers to handle three-dimensional data, the model used both spatial and spectral information for yellow rust detection. The model was calibrated with hyperspectral imagery collected by UAVs in five different dates across a whole crop cycle over a well-controlled field experiment with healthy and rust infected wheat plots. Its performance was compared across sampling dates and with random forest, a representative of traditional classification methods in which only spectral information was used. It was found that the method has high performance across all the growing cycle, particularly at late stages of the disease spread. The overall accuracy of the proposed model (0.85) was higher than that of the random forest classifier (0.77). These results showed that combining both spectral and spatial information is a suitable approach to improving the accuracy of crop disease detection with high resolution UAV hyperspectral images.

Graphical Abstract

1. Introduction

Yellow rust, caused by Puccinia striiformis f. sp. Tritici (Pst), is a devastating foliar disease of wheat occurring in temperate climates across major wheat growing regions worldwide [1,2]. It is one of the most common epidemics of winter wheat, resulting in significant yield losses globally. The estimated yield losses by yellow rust are at least 5.5 million tons per year at a global level [3], a recent survey of yield losses by pathogens and pests for five major crops [4] showed that the estimated wheat loss due to yellow rust was 2.08% globally and 2.16% in China. Outbreaks of yellow rust have been reported worldwide. In China, the world’s largest producer of wheat, yellow rust has been considered the most serious disease of wheat since the first major epidemic in 1950 [5]. It led to a significant yield loss and affected more than 67,000 square kilometers of cropland between 2000 and 2016 due to the massive extension of the epidemic [6].
Considering the relevance of yellow rust to wheat production, its accurate and timely detection plays a significant role in sustainable crop production and food security globally [7]. The existing standard methods of disease detection in practice mainly depend on visual inspections by trained surveyors [8]. The visible symptoms of the disease on wheat plants are observed and identified with the naked eye, which is time consuming, costly and often causes a delay in protection against it at an early stage [9,10]. It becomes very difficult to timely detect the disease in a large field. Moreover, the accuracy of disease identification is affected by the experience and the levels of domain knowledge of each individual surveyor [11]. Therefore, it is crucial to develop more objective and automated approaches for fast and reliable disease detection. Furthermore, these new approaches must be effective for early stage infection detection, in order to ensure effective prevention and an early intervention before the disease spreads to unmanageable levels requiring high usage of pesticide and herbicide treatments [12].
A variety of image-based methods integrating image acquisition and analysis have shown great potential for crop disease detection, including RGB (red, green and blue), thermal, chlorophyll fluorescence, multispectral, and hyperspectral sensors. For instance, the RGB digital photographic image was used to detect the biotic stress in crop through different color spaces and spatial information [9,13,14,15,16,17,18,19,20,21]. A thermal infrared sensor was used to detect crop diseases by measuring temperature which has been proven to be related to crop water status and microclimate [13,14]. However, RGB and thermal infrared images only carry three and one band information, respectively, and their quality is susceptible to the camera angle and distance, thus affecting the accuracy of plant disease detection [15]. The chlorophyll fluorescence sensor is a new technology that has been used to monitor the photosynthesis of plants [16,17], and to identify some crop diseases, such as rust and other fungal infections [18,19]. However, the chlorophyll fluorescence technique for plant disease detection requires that the sensor has a very high spectral resolution (always <1 nm) and plants need to be in a confined observation environment. Thus, this method is difficult to implement at a field or larger scale [20]. Beyond the usual RGB digital imaging, multispectral (5–12 bands) and hyperspectral sensors (hundreds of bands) provide information from the visible range to the invisible near infra-red (NIR) range of the electromagnetic spectrum [22]. They use high-fidelity color reflectance information and can acquire a large range of light spectrum, becoming a potential source to identify crop diseases. Specifically, multispectral images have been used to successfully monitor the growth cycle of wheat, encompassing information about the crop photosynthetic light-use efficiency, leaf chlorophyll content and water stress [23,24,25]. With a much higher band number and narrower bandwidth, hyperspectral data could provide more detailed spectral information and could discriminate objects that may be unwittingly grouped by multispectral sensors [26,27,28].
Some existing studies have utilized the spectral characteristics of foliage from hyperspectral imagery for yellow rust detection. Devadas et al. [29] evaluated the performance of ten spectral vegetation indices on identifying rust infection in individual wheat leaves. Ashourloo et al. [30] studied the effects of different wheat rust disease symptoms on vegetation indices based on hyperspectral measurements. The results showed that some indices had the ability for effective detection of yellow rust. Shi et al. [6] applied the wavelet-based technique to extract rust spectral features for identifying yellow rust based on hyperspectral images. Neural network based approaches have also been proposed to detect yellow rust from hyperspectral imagery [27].
Hyperspectral sensors are usually mounted on hand-held devices that can be used to obtain the spectrum at the leaf/canopy scale. With the development of technologies in unmanned aerial vehicles (UAVs) and hyperspectral sensors [22,31,32,33], hyperspectral sensors can now be mounted on UAVs, which allows monitor to the crop on a large scale at a certain height above wheat fields. Compared to hand-held or ground-based devices, the hyperspectral sensor on UAVs can acquire both spatially and spectrally continuous data represented with three dimensions by adding spatial information. Spatial information has been proven to be a very important feature on object recognition with remote sensing imagery [34,35]. Focusing on hyperspectral data classification for different applications, several studies have shown significant improvement to the performance of the classification algorithms using both spectral and spatial information. Among them, deep convolutional neural network (DCNN)-based approaches using convolution layers to deal with joint spatial-spectral information achieved high performance [36]. However, existing studies based on deep learning approaches usually worked on a low spatial resolution image with a small region of neighboring pixels (3 × 3, 5 × 5 or 7 × 7) as model input [36,37,38]. Such small neighbor regions may not be wide enough to describe the context and texture features of the object in high spatial resolution images captured by UAVs, whose resolutions vary from 0.01 m to 0.1 m depending on the flight altitude. Moreover, high spatial resolution may lead to the increase of intraclass variation and the decrease of interclass variation, causing great difficulty in the pixel classification [39]. Therefore, we expect that a DCNN-based deep learning approach with a suitable larger region of neighbouring pixels as input can be a major improvement for the classification of high spectral and spatial resolution imagery.
In this paper, we proposed a new DCNN-based deep learning method for automated detection of yellow rust from hyperspectral images with high spatial resolution. The new DCNN structured approach handled the joint spatial-spectral information extracted from high-resolution hyperspectral images and introduced multiple Inception-Resnet layers for deep feature extraction. We tested the proposed model against a comprehensive dataset acquired from winter wheat fields under a controlled field experiment across a whole crop cycle. Finally, the performance of the DCNN model was compared with a random forest-based classifier, a representative of traditional spectral-based classification methods. The remaining part of this paper is organized as follows: Section 2 describes study area, data description and methods; Section 3 presents results; Section 4 provides discussions and; finally, Section 5 summarizes this work and highlights future works.

2. Materials and Methods

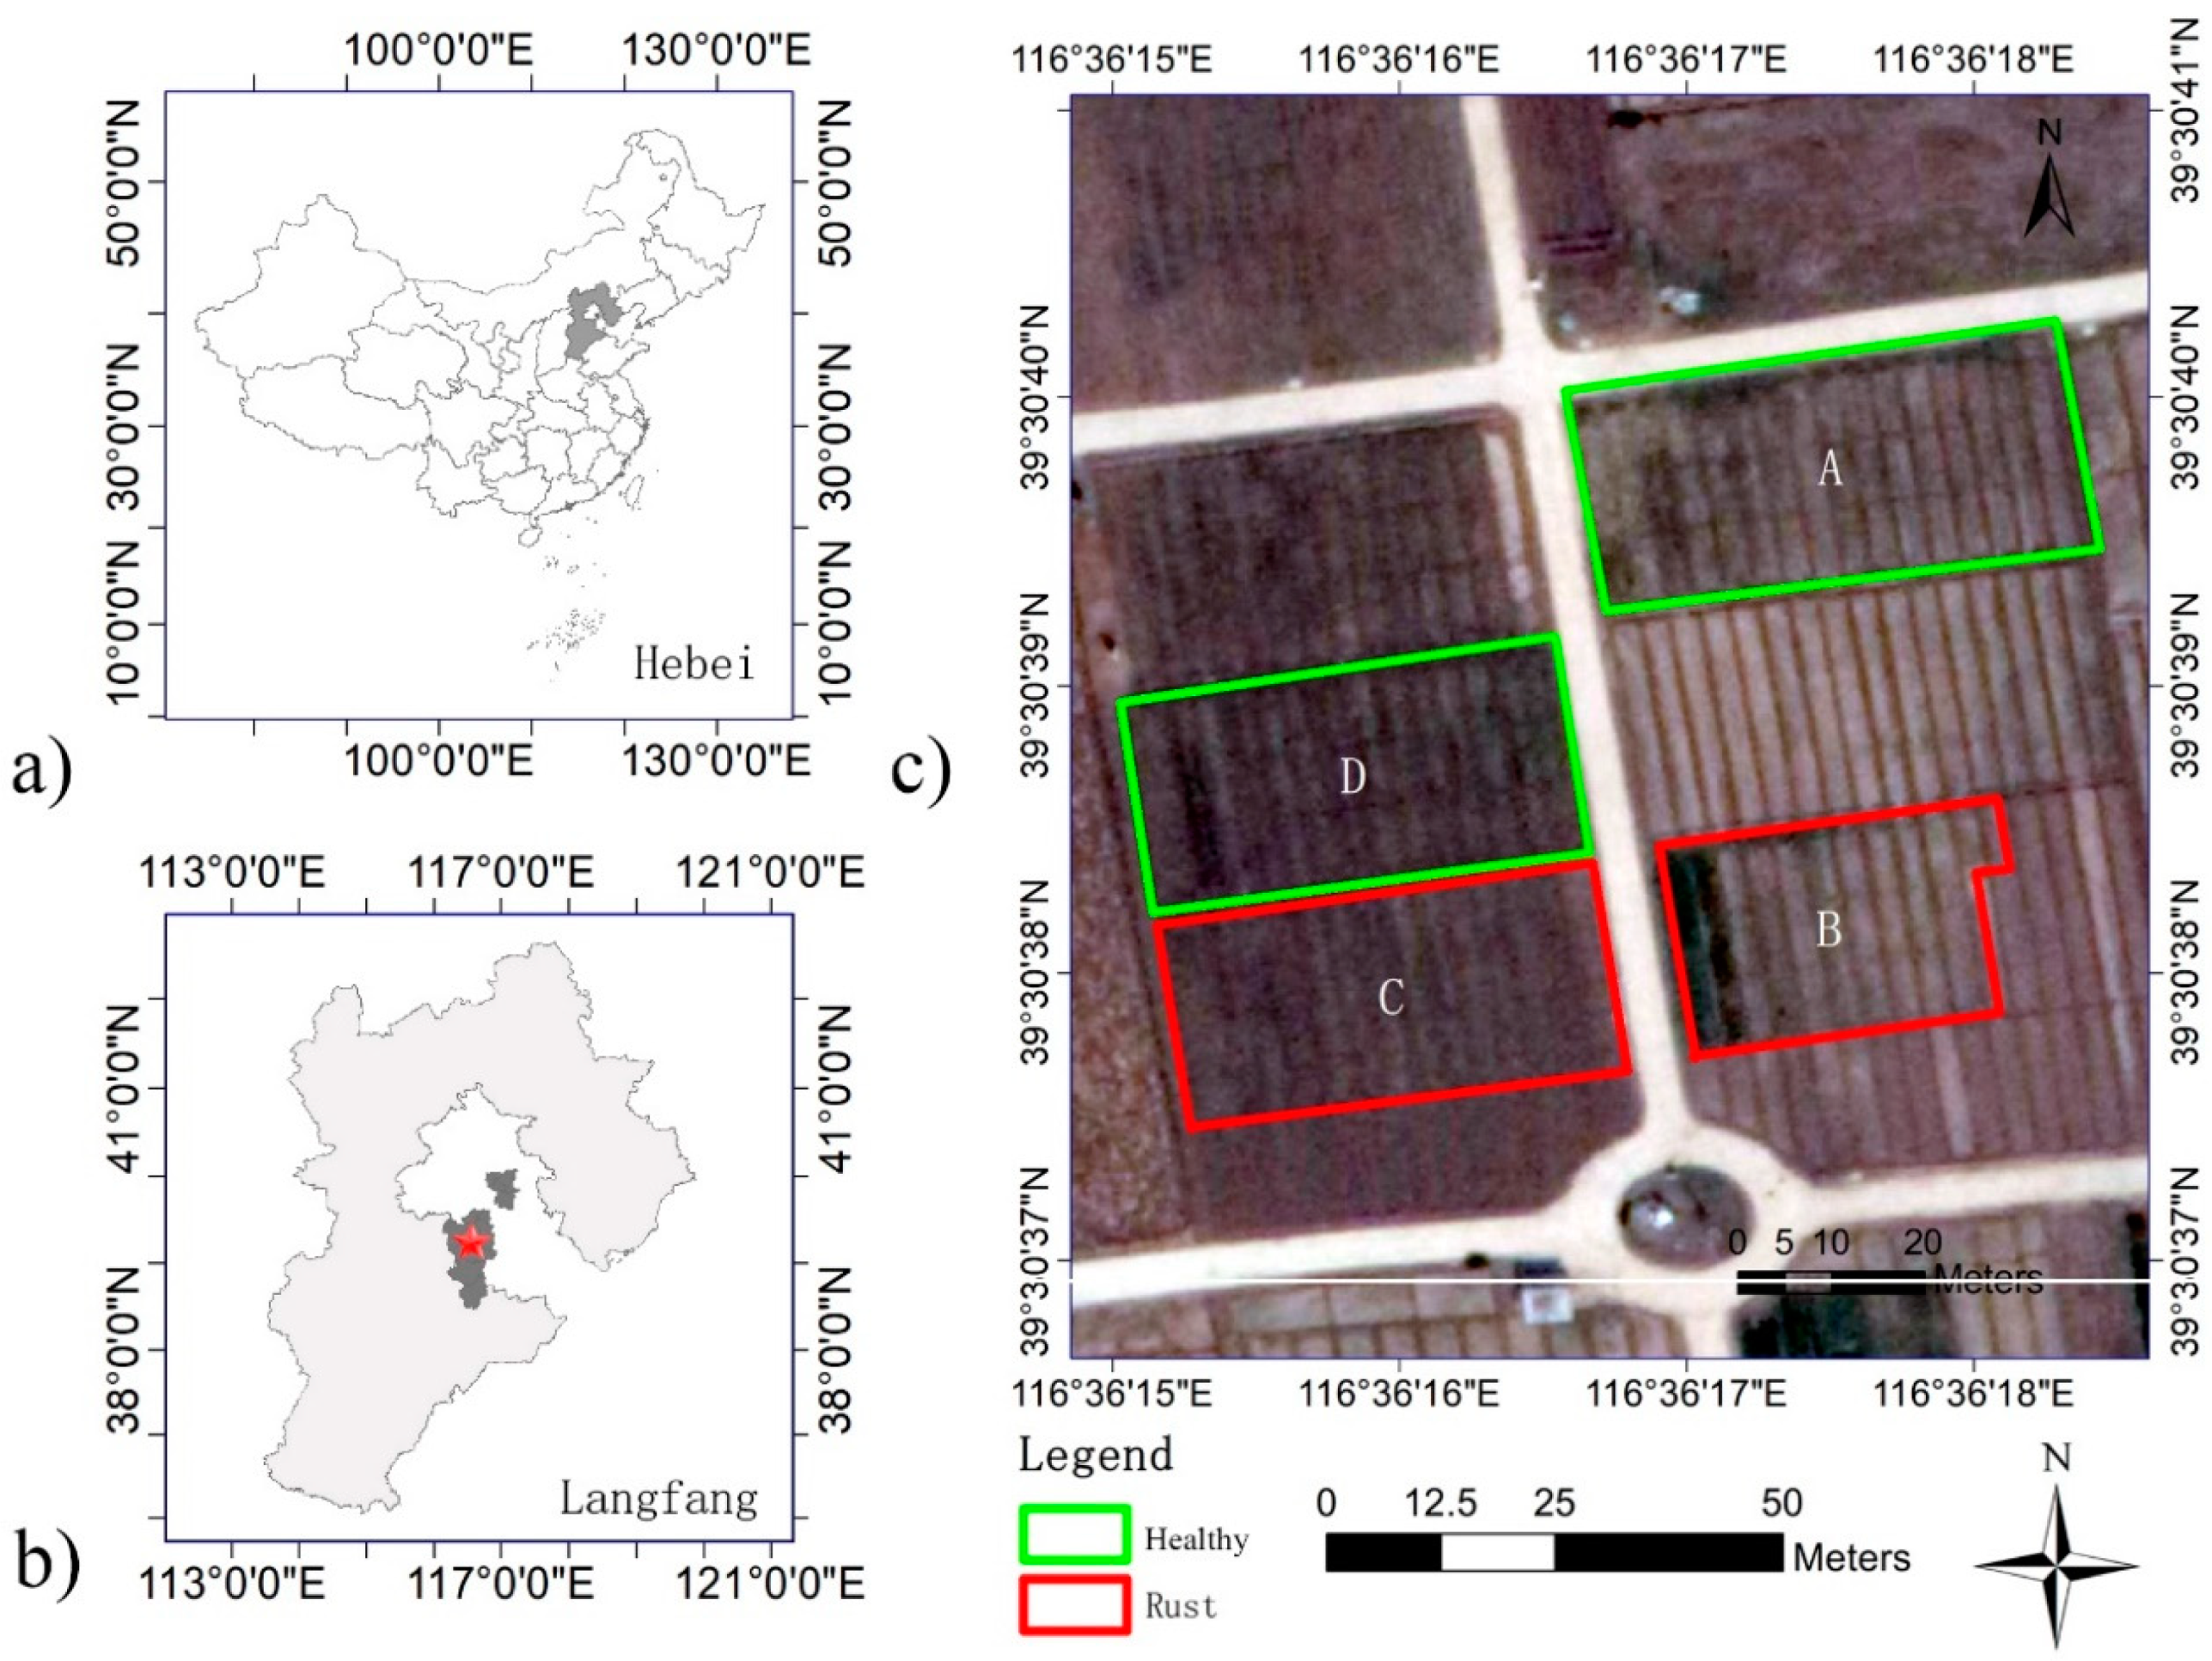
2.1. Study Area and Data Description

2.1.1. Study Area

Four controlled wheat plots at the Scientist Research and Experiment Station of China Academy of Agricultural Science in Langfang, Hebei Province, China (39°30’40”N, 116°36’20”E) were selected as the study area (Figure 1). Each of the four plots occupied about 220 m2, two of them were infected with yellow rust wheat and the other two remained uninfected as healthy wheat. The average temperature during the wheat growing period was between 5 °C to 24 °C corresponding to the suitable occurrence environment of yellow rust [7].

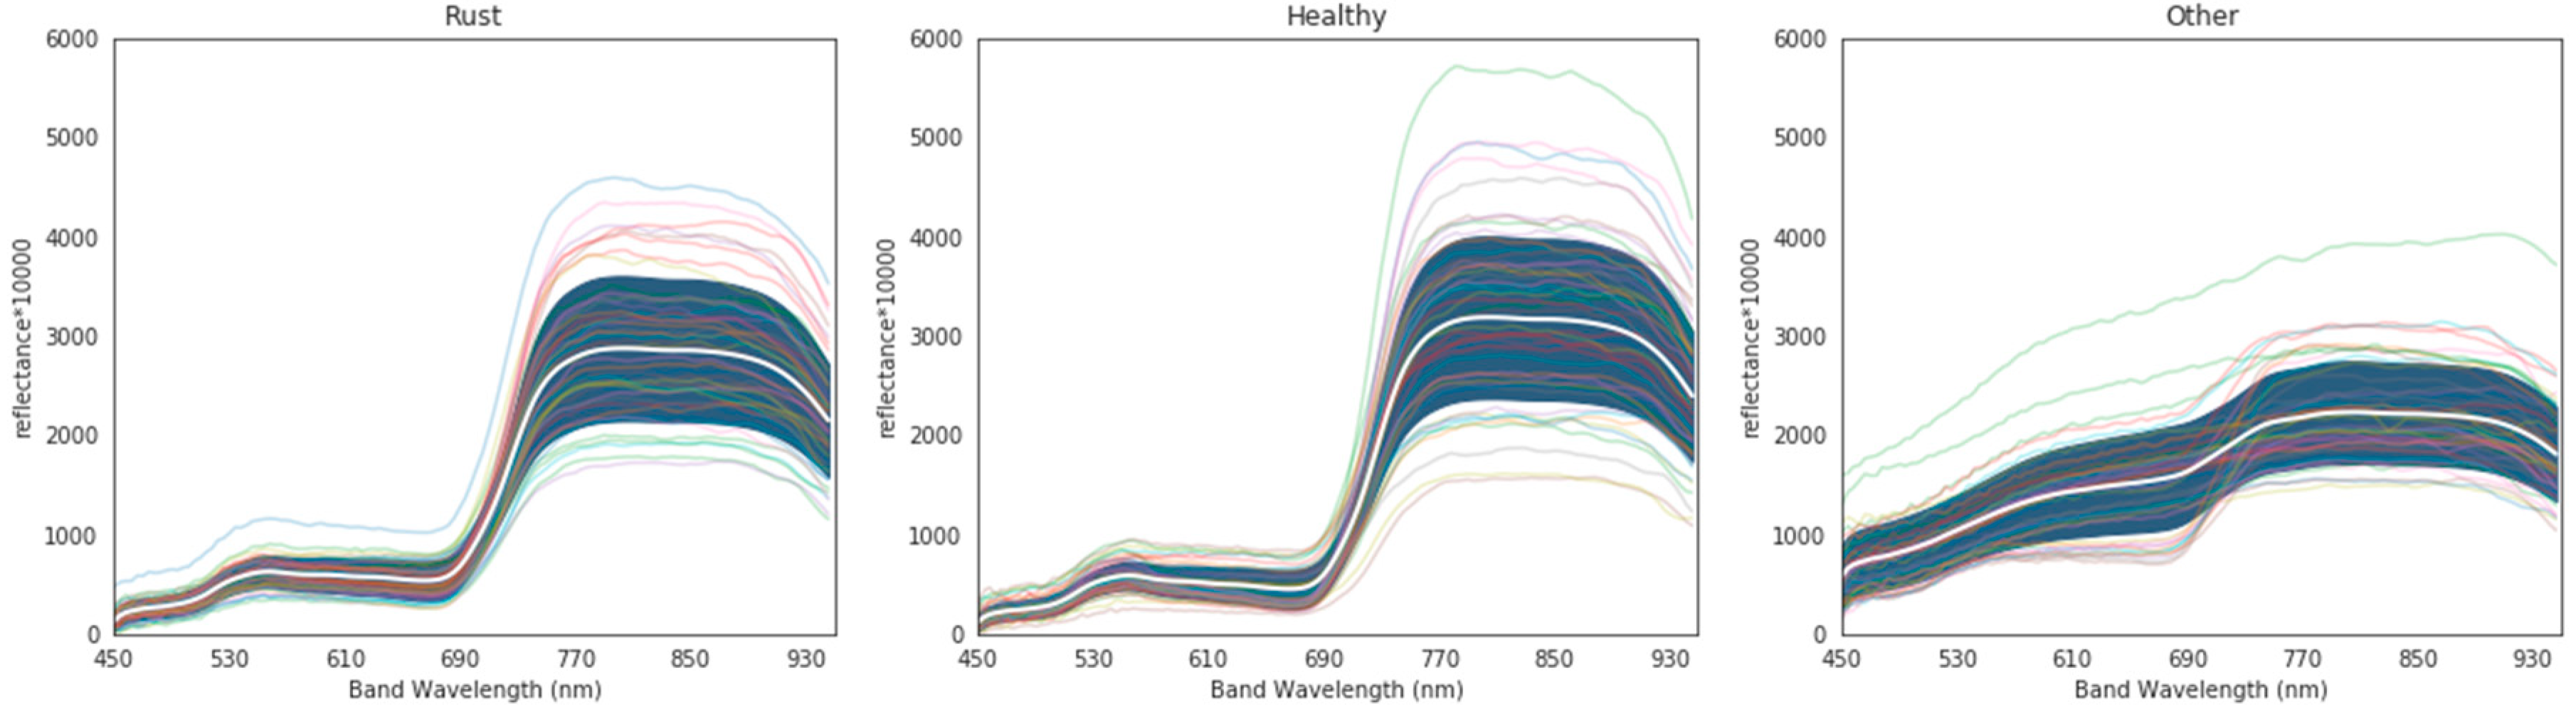
2.1.2. Data Description
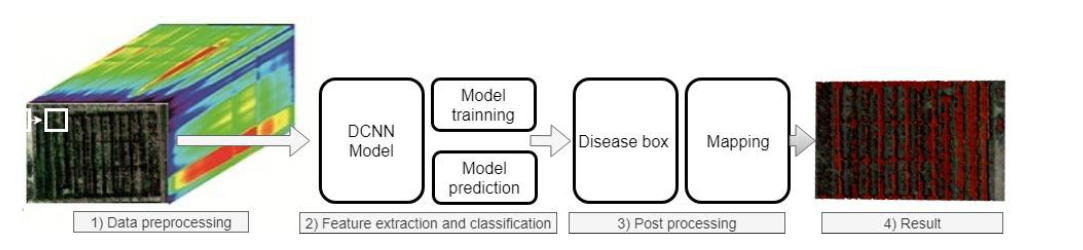
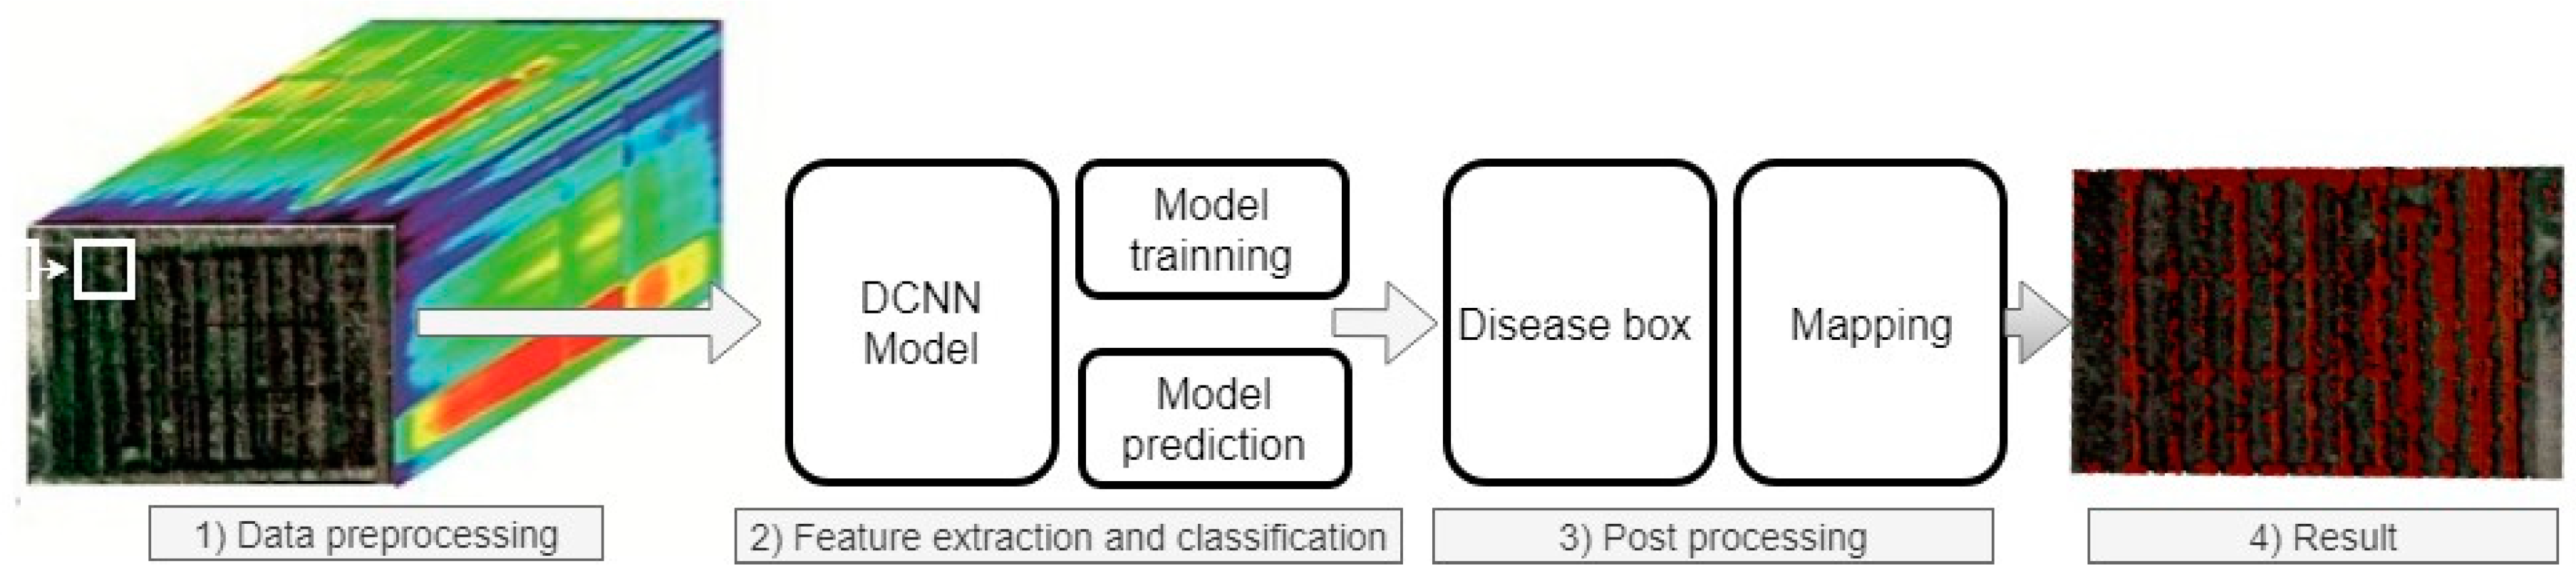
During the entire growing season of winter wheat, a series of observations were conducted between 18 April and 30 May 2018. Hyperspectral imaging was conducted five times (25 April 2018; 4 May 2018; 8 May 2018; 15 May 2018 and 18 May 2018). A DJI S1000 UAV system (SZ DJI Technology Co Ltd., Gungdong, China) [40] with a snapshot hyperspectral sensor was used for data acquisition. The model of the hyperspectral sensor was a UHD 185 Firefly (Cubert GmbH, Ulm, Baden-Württemberg, Germany) which can obtain reflected radiation from visible to near-infrared bands between 450 and 950 nm. The spectral resolution was 4 nm. Raw data were recorded as a 1000 × 1000 px panchromatic image and a 50 × 50 px hyperspectral image with 125 bands. With a data fusion processed with Cubert software [41], the output was a 1000 × 1000 px image with 125 bands, and the image was also mosaicked and orthorectified. In this work, all the images were obtained at a flight height of 30 m, with a spatial resolution close to 2 cm per pixel. The data sizes covering all the four plots were around 16,279 × 14,762 px with 125 bands. Hyperspectral images were labelled for each pixel based on their corresponding plots and normalized difference vegetation index (NDVI) [29]. The NDVI which is calculated from the reflectance of the planet in near-infrared and red bands (Equation (1)), is a standardized way to assess whether a pixel observed is vegetation or not. In general, the value of NDVI ranging from 0.3–1.0 was considered as vegetation, otherwise it was considered bare soil or water. In this case, a pixel in rust or healthy plots with an NDVI value greater than 0.3 was labelled as rust or healthy, otherwise was labelled as other:
NDVI = N i r R e d N i r + R e d

2.2. Methods

The aim of this work was to detect rust areas based on joint spectral and spatial information. This is a typical classification task, i.e., classifying a 3D hyperspectral block into one of three classes: rust, healthy or others. In this study, we proposed a DCNN-based approach for this aim, in which a new DCNN architecture was constructed and detailed in Section 2.2.2. As shown in Figure 2, it includes four major steps: (1) data preprocessing where 3D data blocks is extracted from original data with a sliding window method; (2) feature extraction and classification where the segmented 3D data blocks from the first step are fed to the proposed DCNN model; (3) post processing where a rust disease map is generated based on the mapping and aggregation of each predicted image block; and (4) result output and visualization.

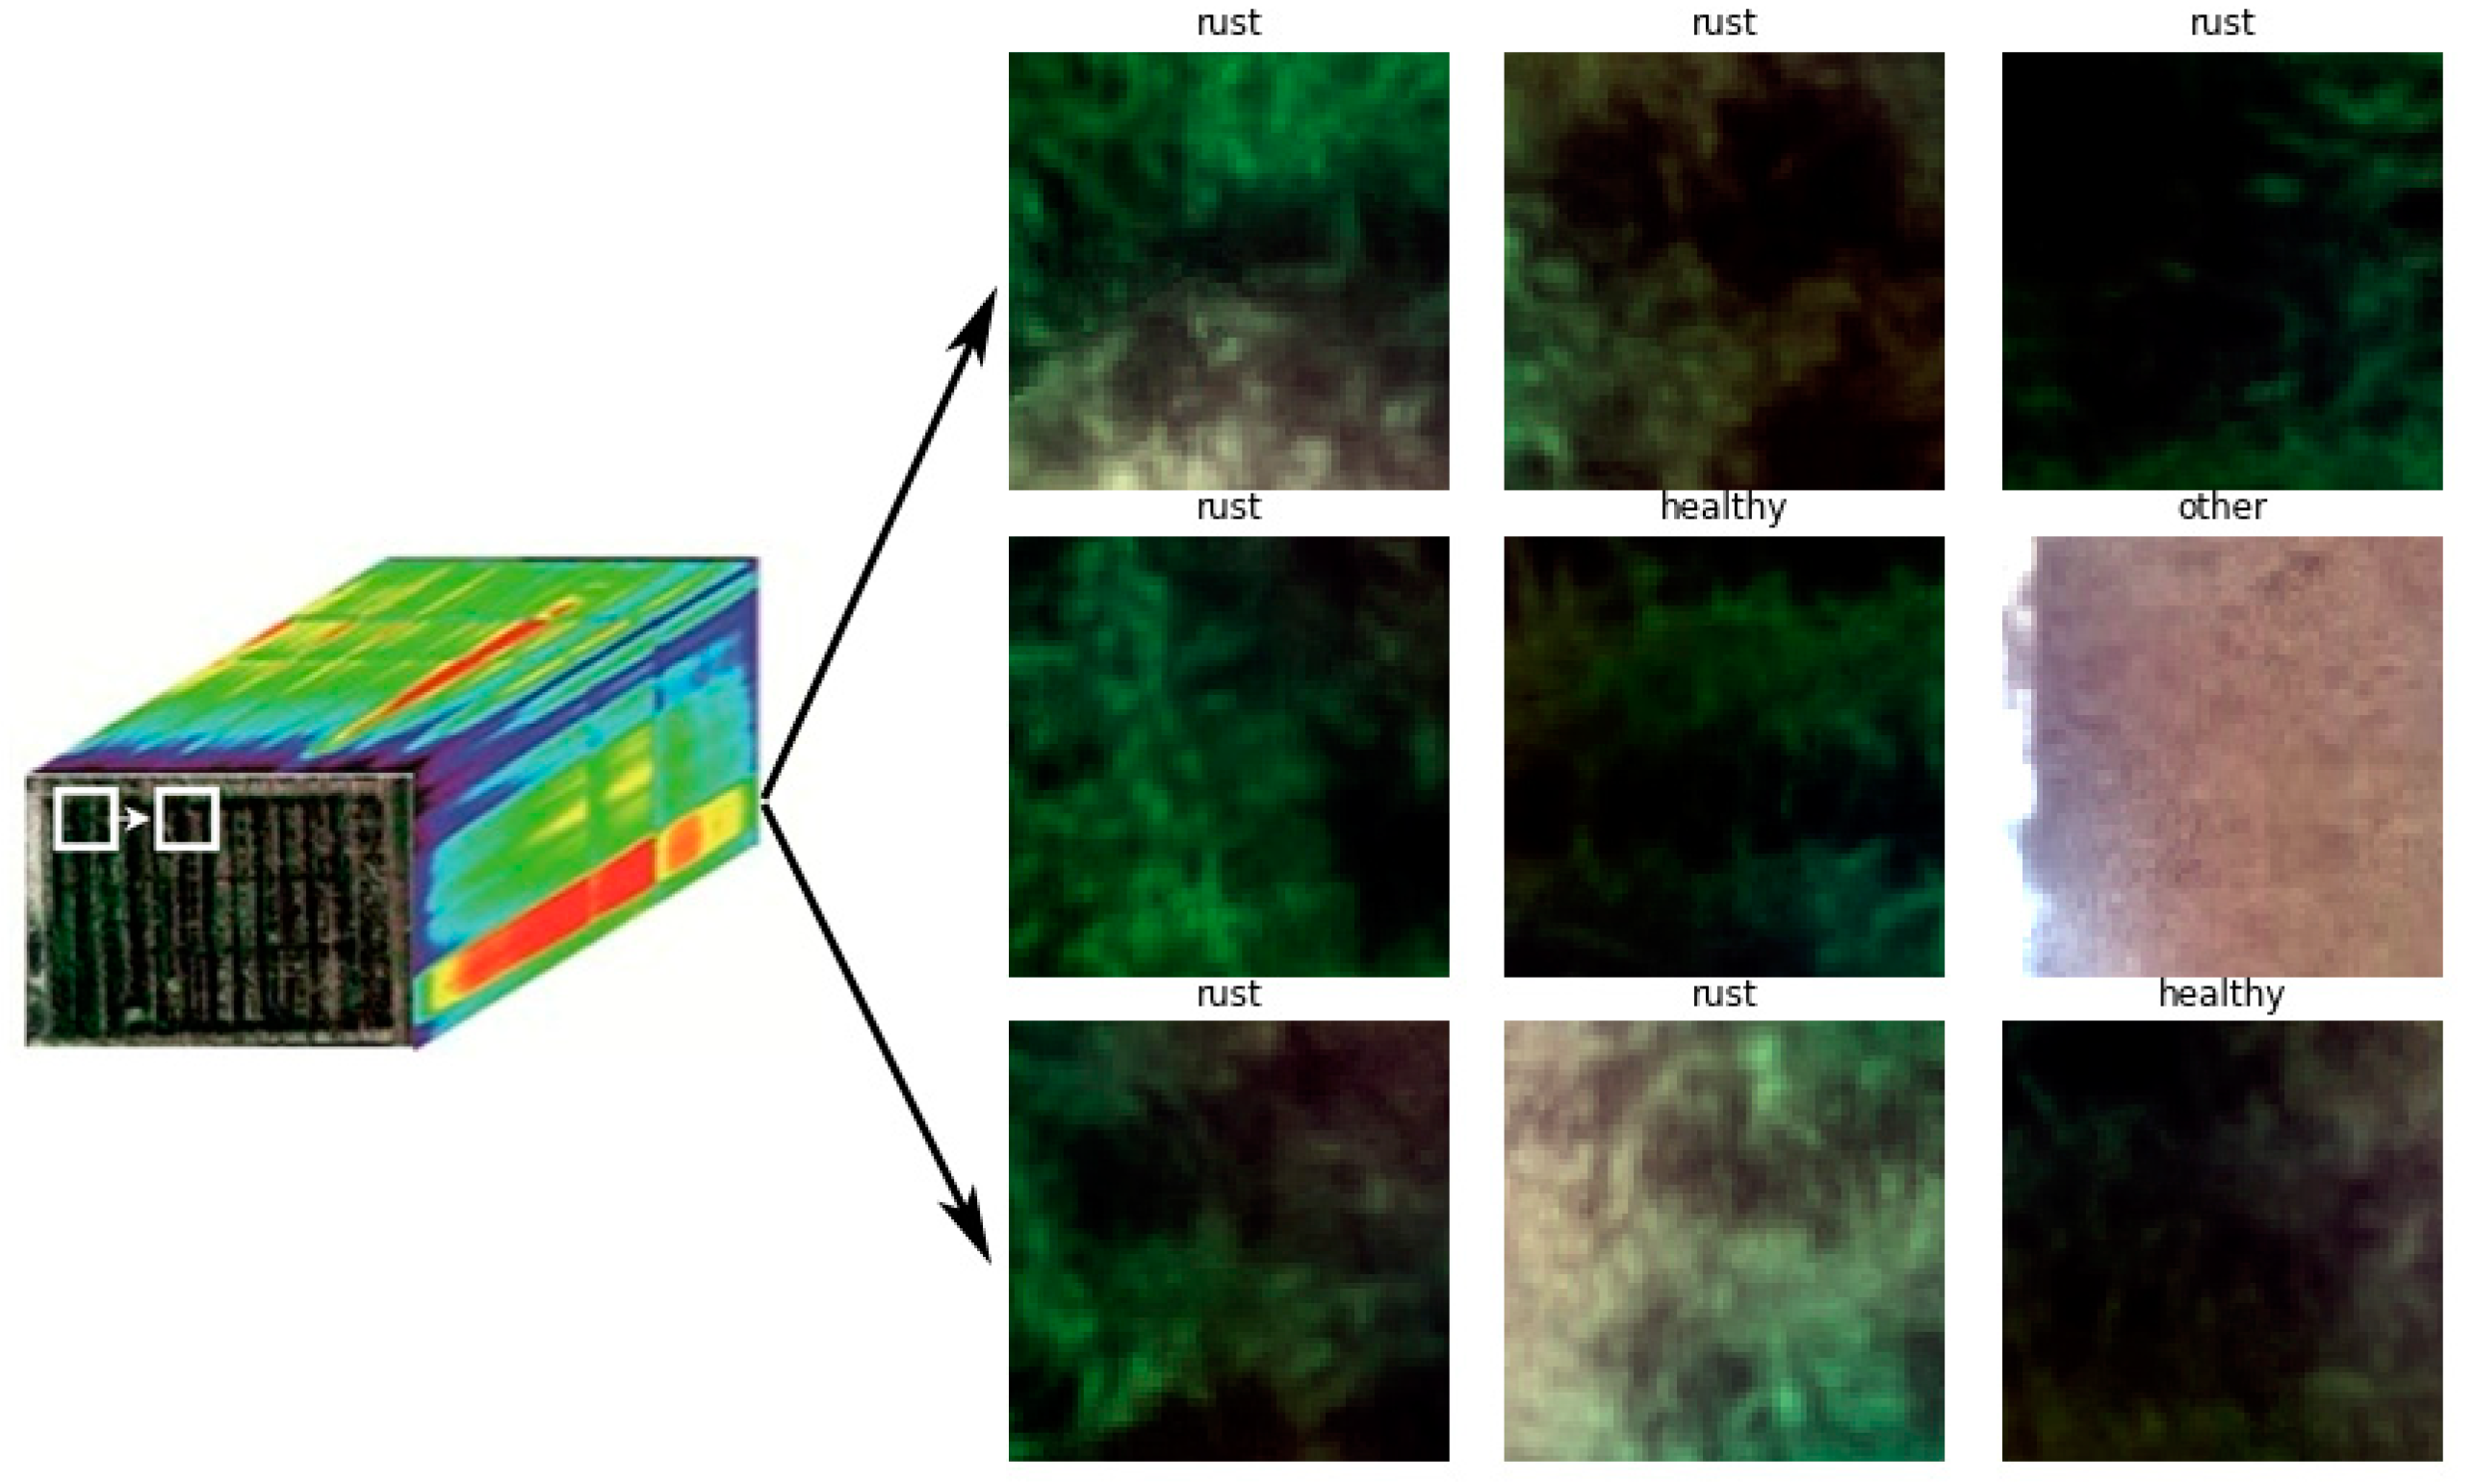
2.2.1. Data Preprocessing

The sliding-window method [42] was used to extract spatial and spectral information from hyperspectral imagery. The sliding-window method is an exhaustive search image segmentation algorithm by moving a window with a fixed size at a fixed interval across an image. It was first used in object detection [43], and later used to extract spatial and spectral information for remote sensing classification [36]. With the sliding-window segmentation, 3D data blocks from original hyperspectral imagery were extracted and then fed into the proposed DCNN model. Normally, the input sizes of a DCNN classification model varied from 224 × 224 px to 299 × 299 px due to GPU RAM limitations [44,45]. In this work, Hyperspectral imagery had 125 bands, so we had to adjust the sizes of these blocks to adapt to GPUs. We chose 64 × 64 × 125 as the input size of the DCNN model. To train the DCNN model, these blocks were labelled with one of three classes based on the plots they belong to: (i) Rust area class, (ii) healthy area class, or (iii) other class (including bare soil and road labelled by the average vegetation index of each block) (see Figure 3).

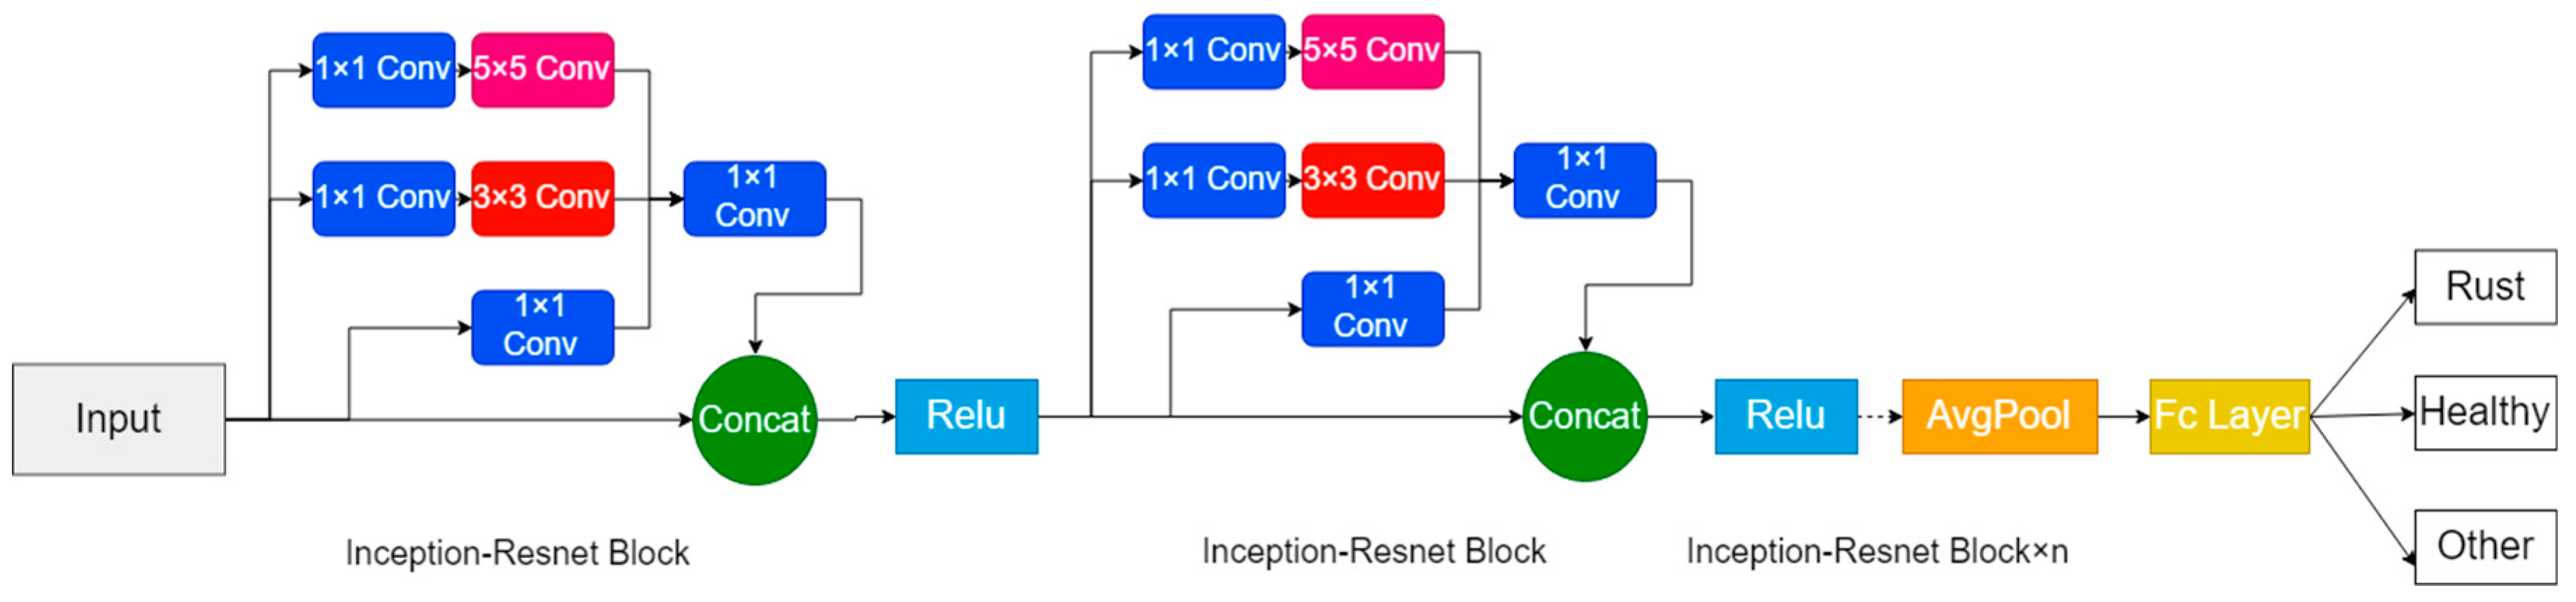
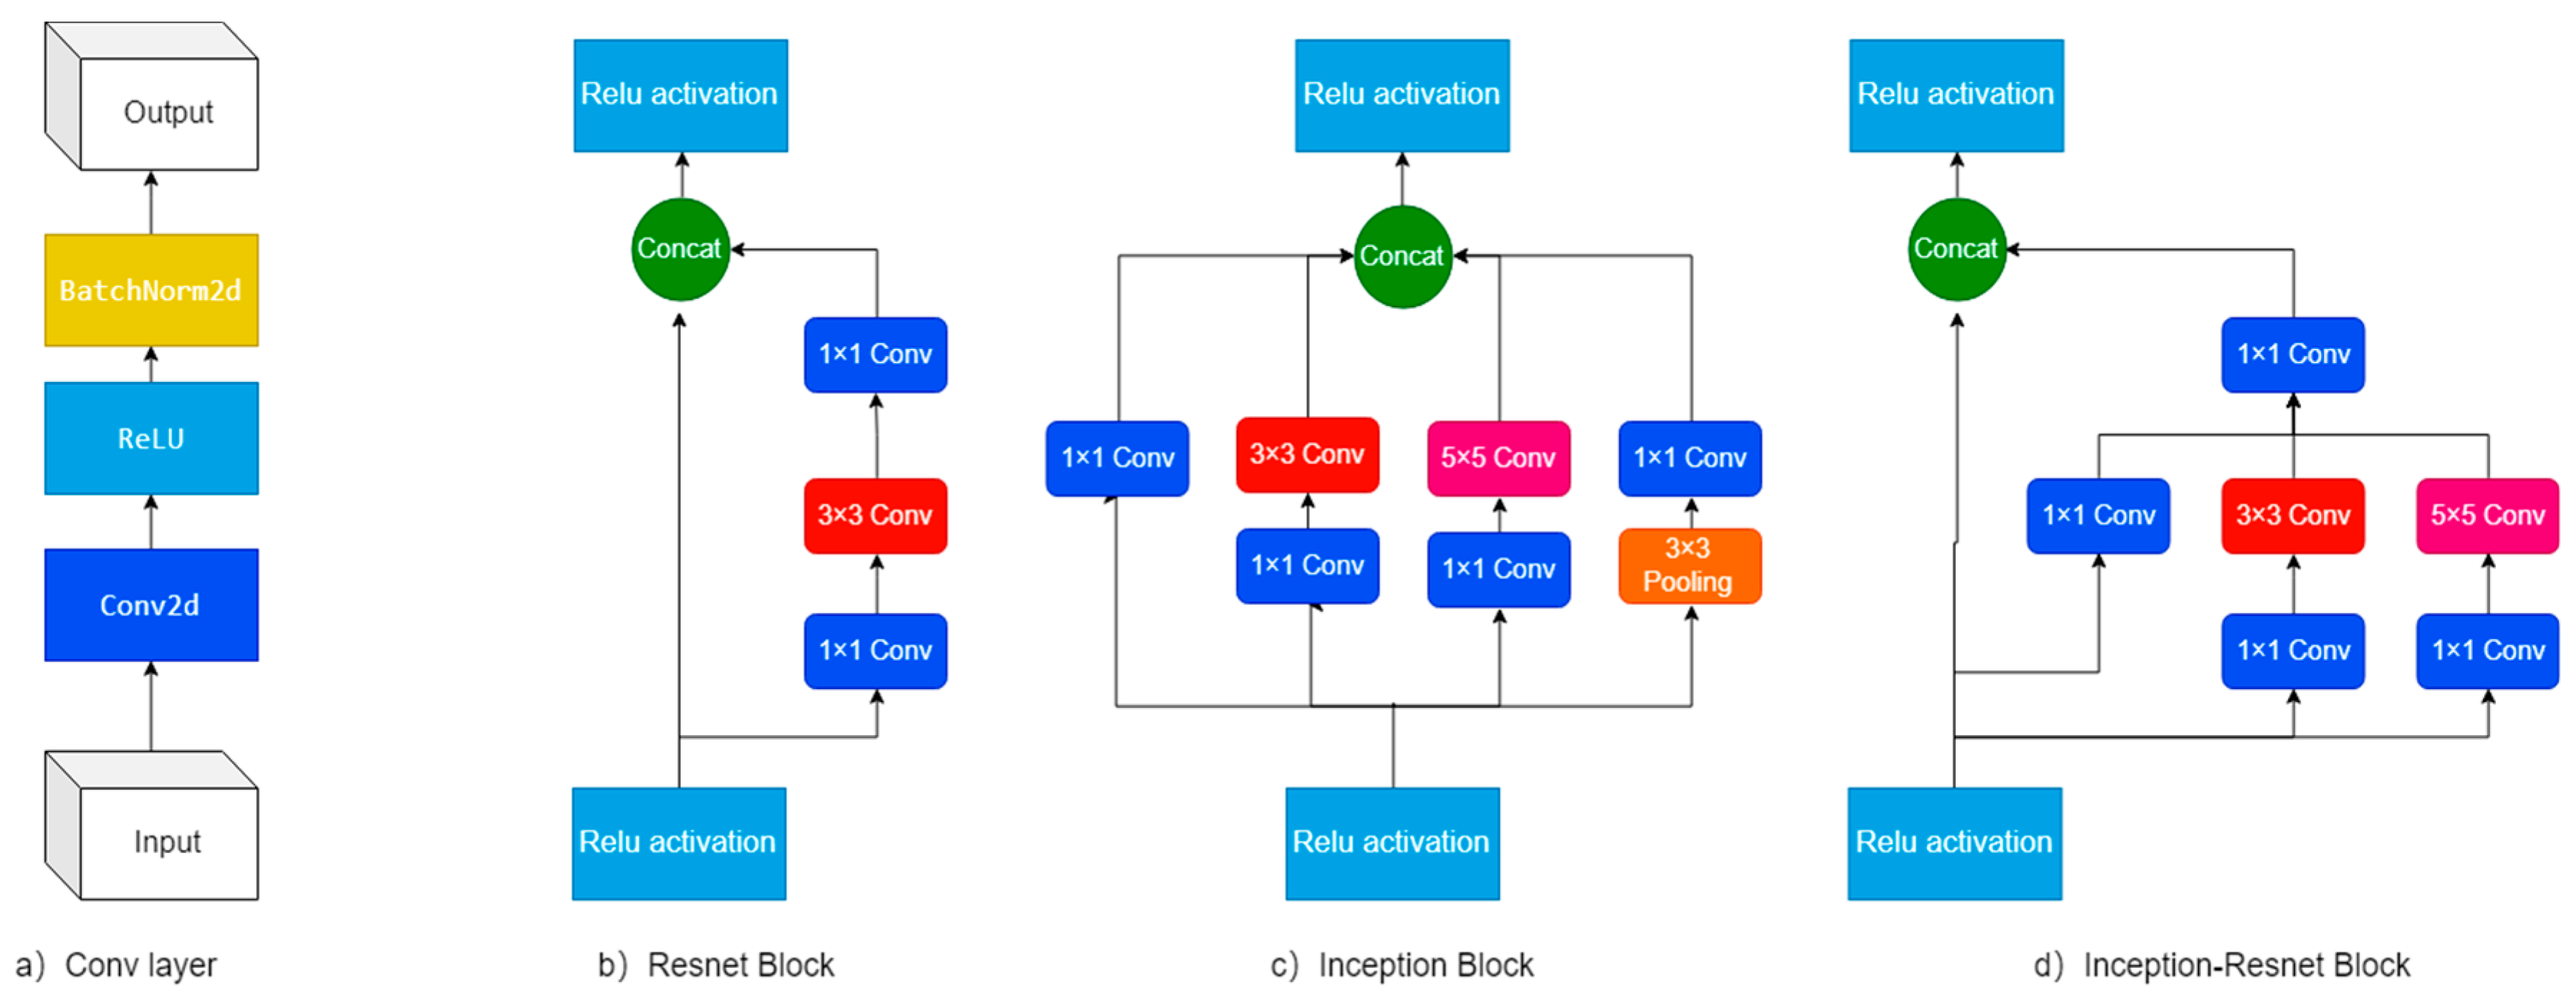
2.2.2. Feature Extraction and Classification

Feature extraction and classification were performed on the 3D blocks extracted in the Data preprocessing step with a new DCNN architecture. Figure 4 shows the architecture of the proposed DCNN model, it includes multiple Inception-Resnet blocks combining and optimising two well-known architectures: Inception [46] and Resnet [44] for deep feature extraction. The number of Inception-Resnet blocks is used to control the depth of the model. After deep feature extraction with Inception-Resnet blocks, an average pooling layer and a fully connected layer are used to transform the feature maps into a three-class classifier: rust, healthy and other.
The model design rationale for combining these two architectures included:
(1)
The Resnet block was designed to build a deep model as thin as possible in favour of increasing its depth and having fewer parameters for performance enhancement. Existing works [44] have shown that residual learning can ease the problem of vanishing/exploding gradients when a network goes deeper.
(2)
Since the width and kernel size of a filter also influenced the performance of a DCNN model, an Inception structure with multiple kernel sizes [46] was selected to address this issue.
The detailed architecture of an Inception-Resnet block is shown in Figure 5d. It takes advantages of convolution layer (Conv) (see Figure 5a), Resnet (see Figure 5b) and Inception (see Figure 5c). The Conv used here is a basic convolution layer [47] and its structure is shown in Figure 5a. This Conv layer structure begins with a 2D convolutional (Conv 2d) layer, and followed by a rectified linear unit (ReLU) layer [48] and a 2D batch normalization (BatchNorm2d) layer [49]. Using multiple Conv layers had been proved quite successful in improving the performance of the classification model [50]. However, with the increase in the number of layers, the number of parameters to be learned will also increase dramatically, which may lead to exploding gradients in the training stage. The Resnet block [46] was designed to ease the exploding gradient problem. As shown in Figure 5b, a basic Resnet block adds a 1 × 1 convolution layer before and after a 3 × 3 convolution layer to reduce the number of connections (parameters) without degrading the performance of a network too much. Furthermore, a shortcut connection is added to link the input with the output, thus the Resnet learns the residual of input. Inception [51] was designed to improve the utilization of computing resources inside a network and increase both the depth and width without getting into computational difficulties. As shown in Figure 5c, an Inception block performs convolution with three different sizes of filters (1 × 1, 3 × 3, 5 × 5) to increase the network width. To decrease training parameters so that more layers can be trained into one model, an extra 1 × 1 convolution is added for reducing the dimension of input before 3 × 3 and 5 × 5 convolutions.
Inception-Resnet block [45] was designed to take advantages of both Resnet and Inception blocks. As illustrated in Figure 5d, this block merges an Inception unit at the top and a shortcut connection in a Resnet block by concatenation. A 3 × 3 convolution layer in the Resnet block is replaced by a 3 × 3 and a 5 × 5 convolution layers in the Inception Block. A 1 × 1 convolution layer is added immediately after multiscale convolution layers, which is used to control the number of trained parameters and output channels.

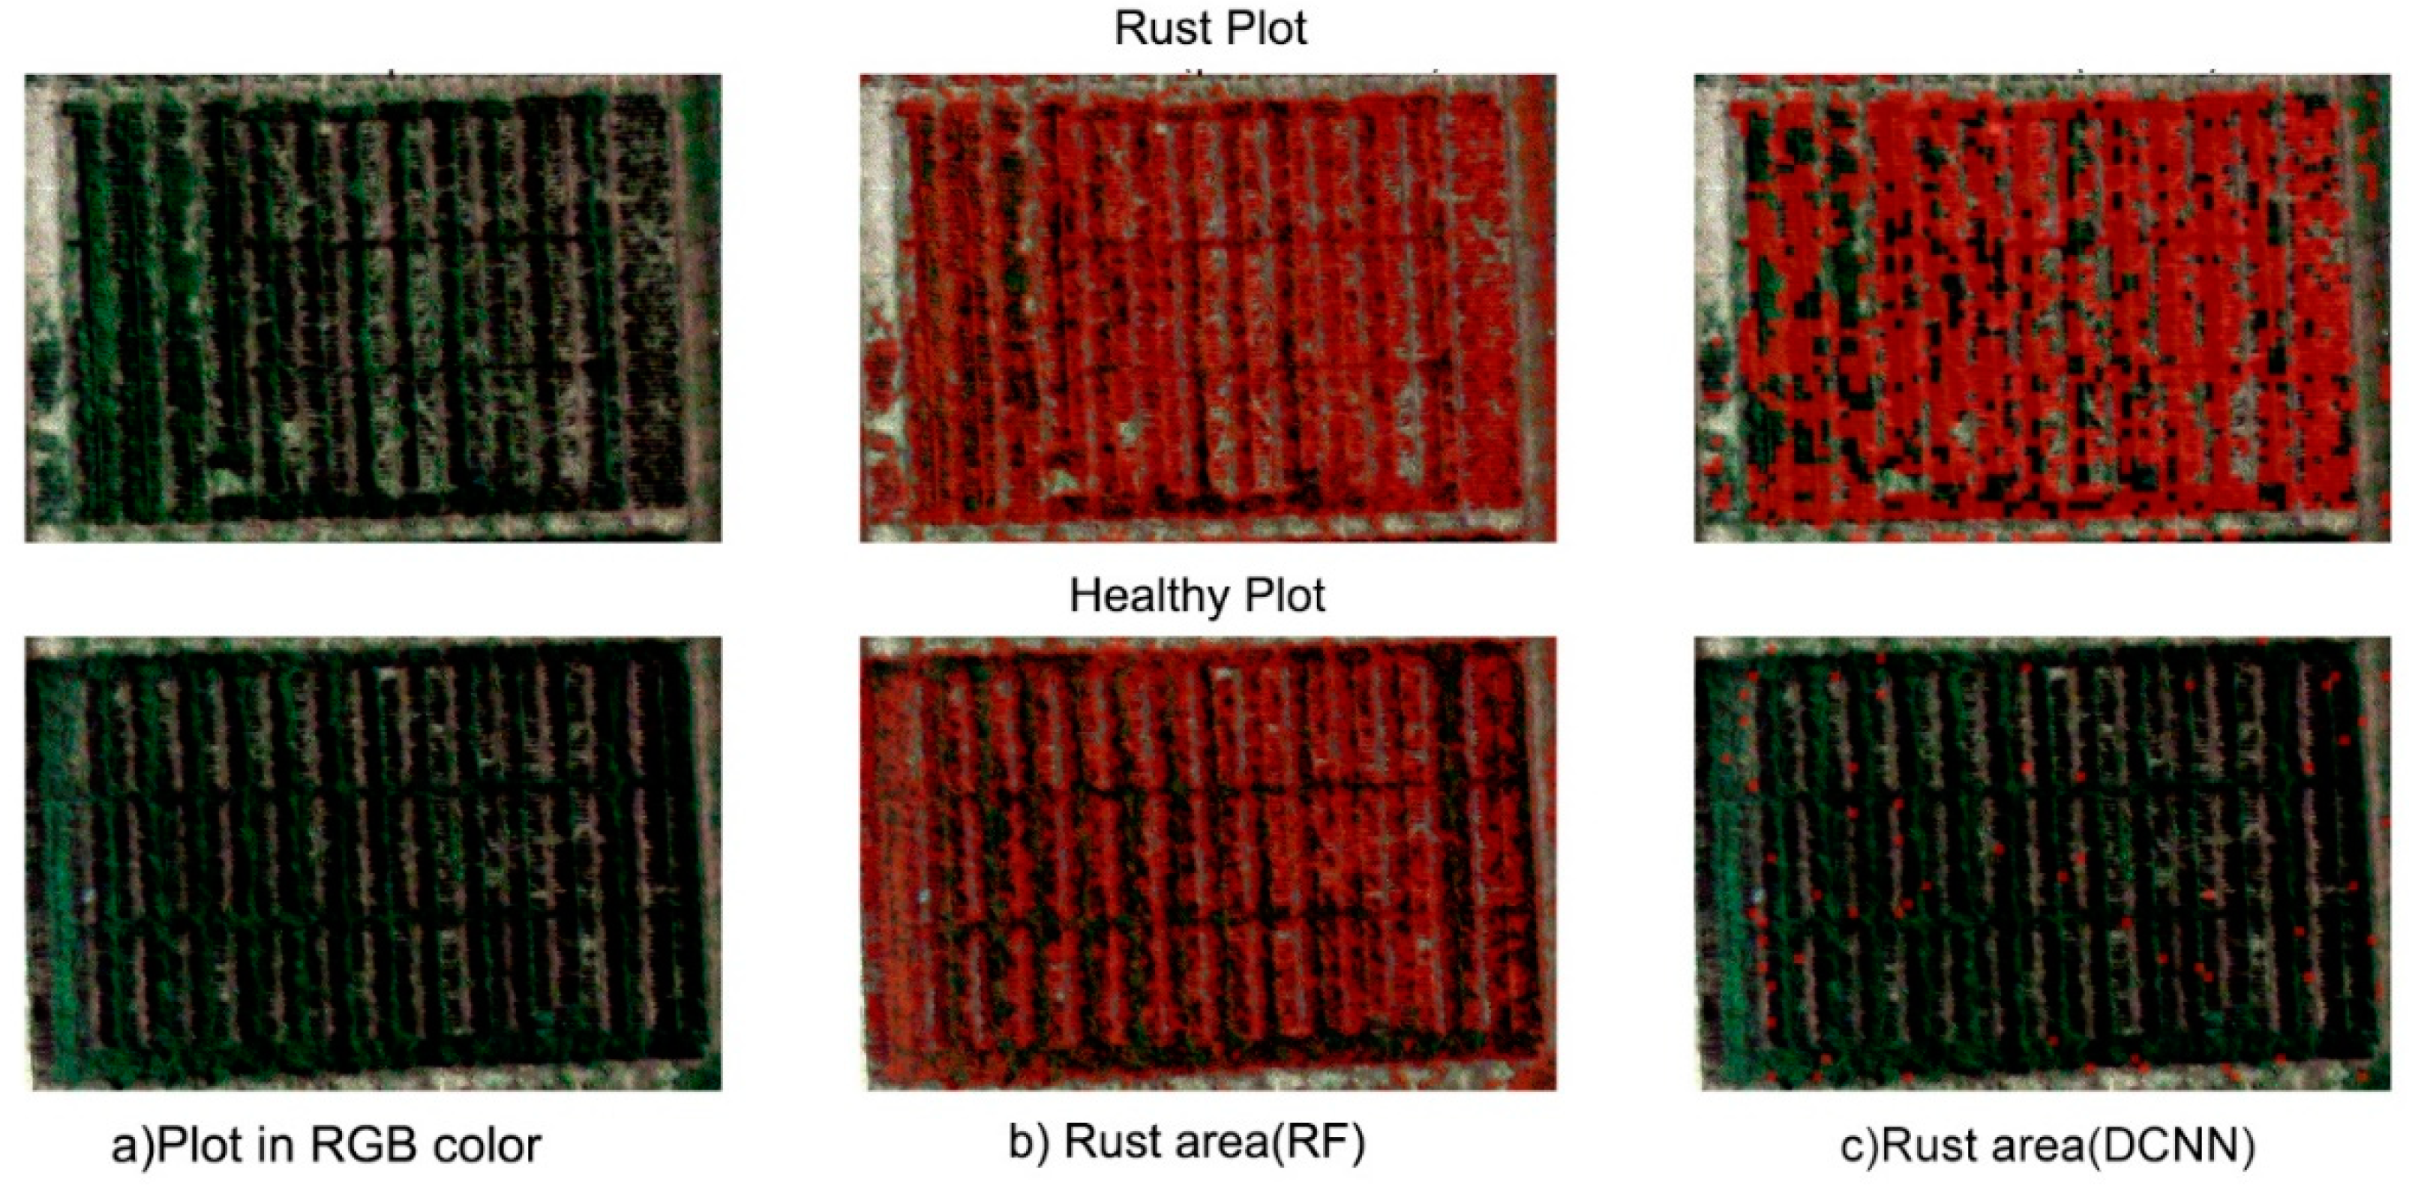
2.2.3. Post Processing and Visualization

After training the proposed DCNN model with 3D hyperspectral image blocks extracted in the data preprocessing step, the trained model was used for yellow rust detection with full-hyperspectral images. Each image was divided into blocks with a size of 64 × 64 by using the sliding window method. Then the blocks were identified by the trained model and the predicted rust infected blocks were mapped based on their locations in the original data for visualization.

2.3. Experimental Evaluation

2.3.1. Experimental Design
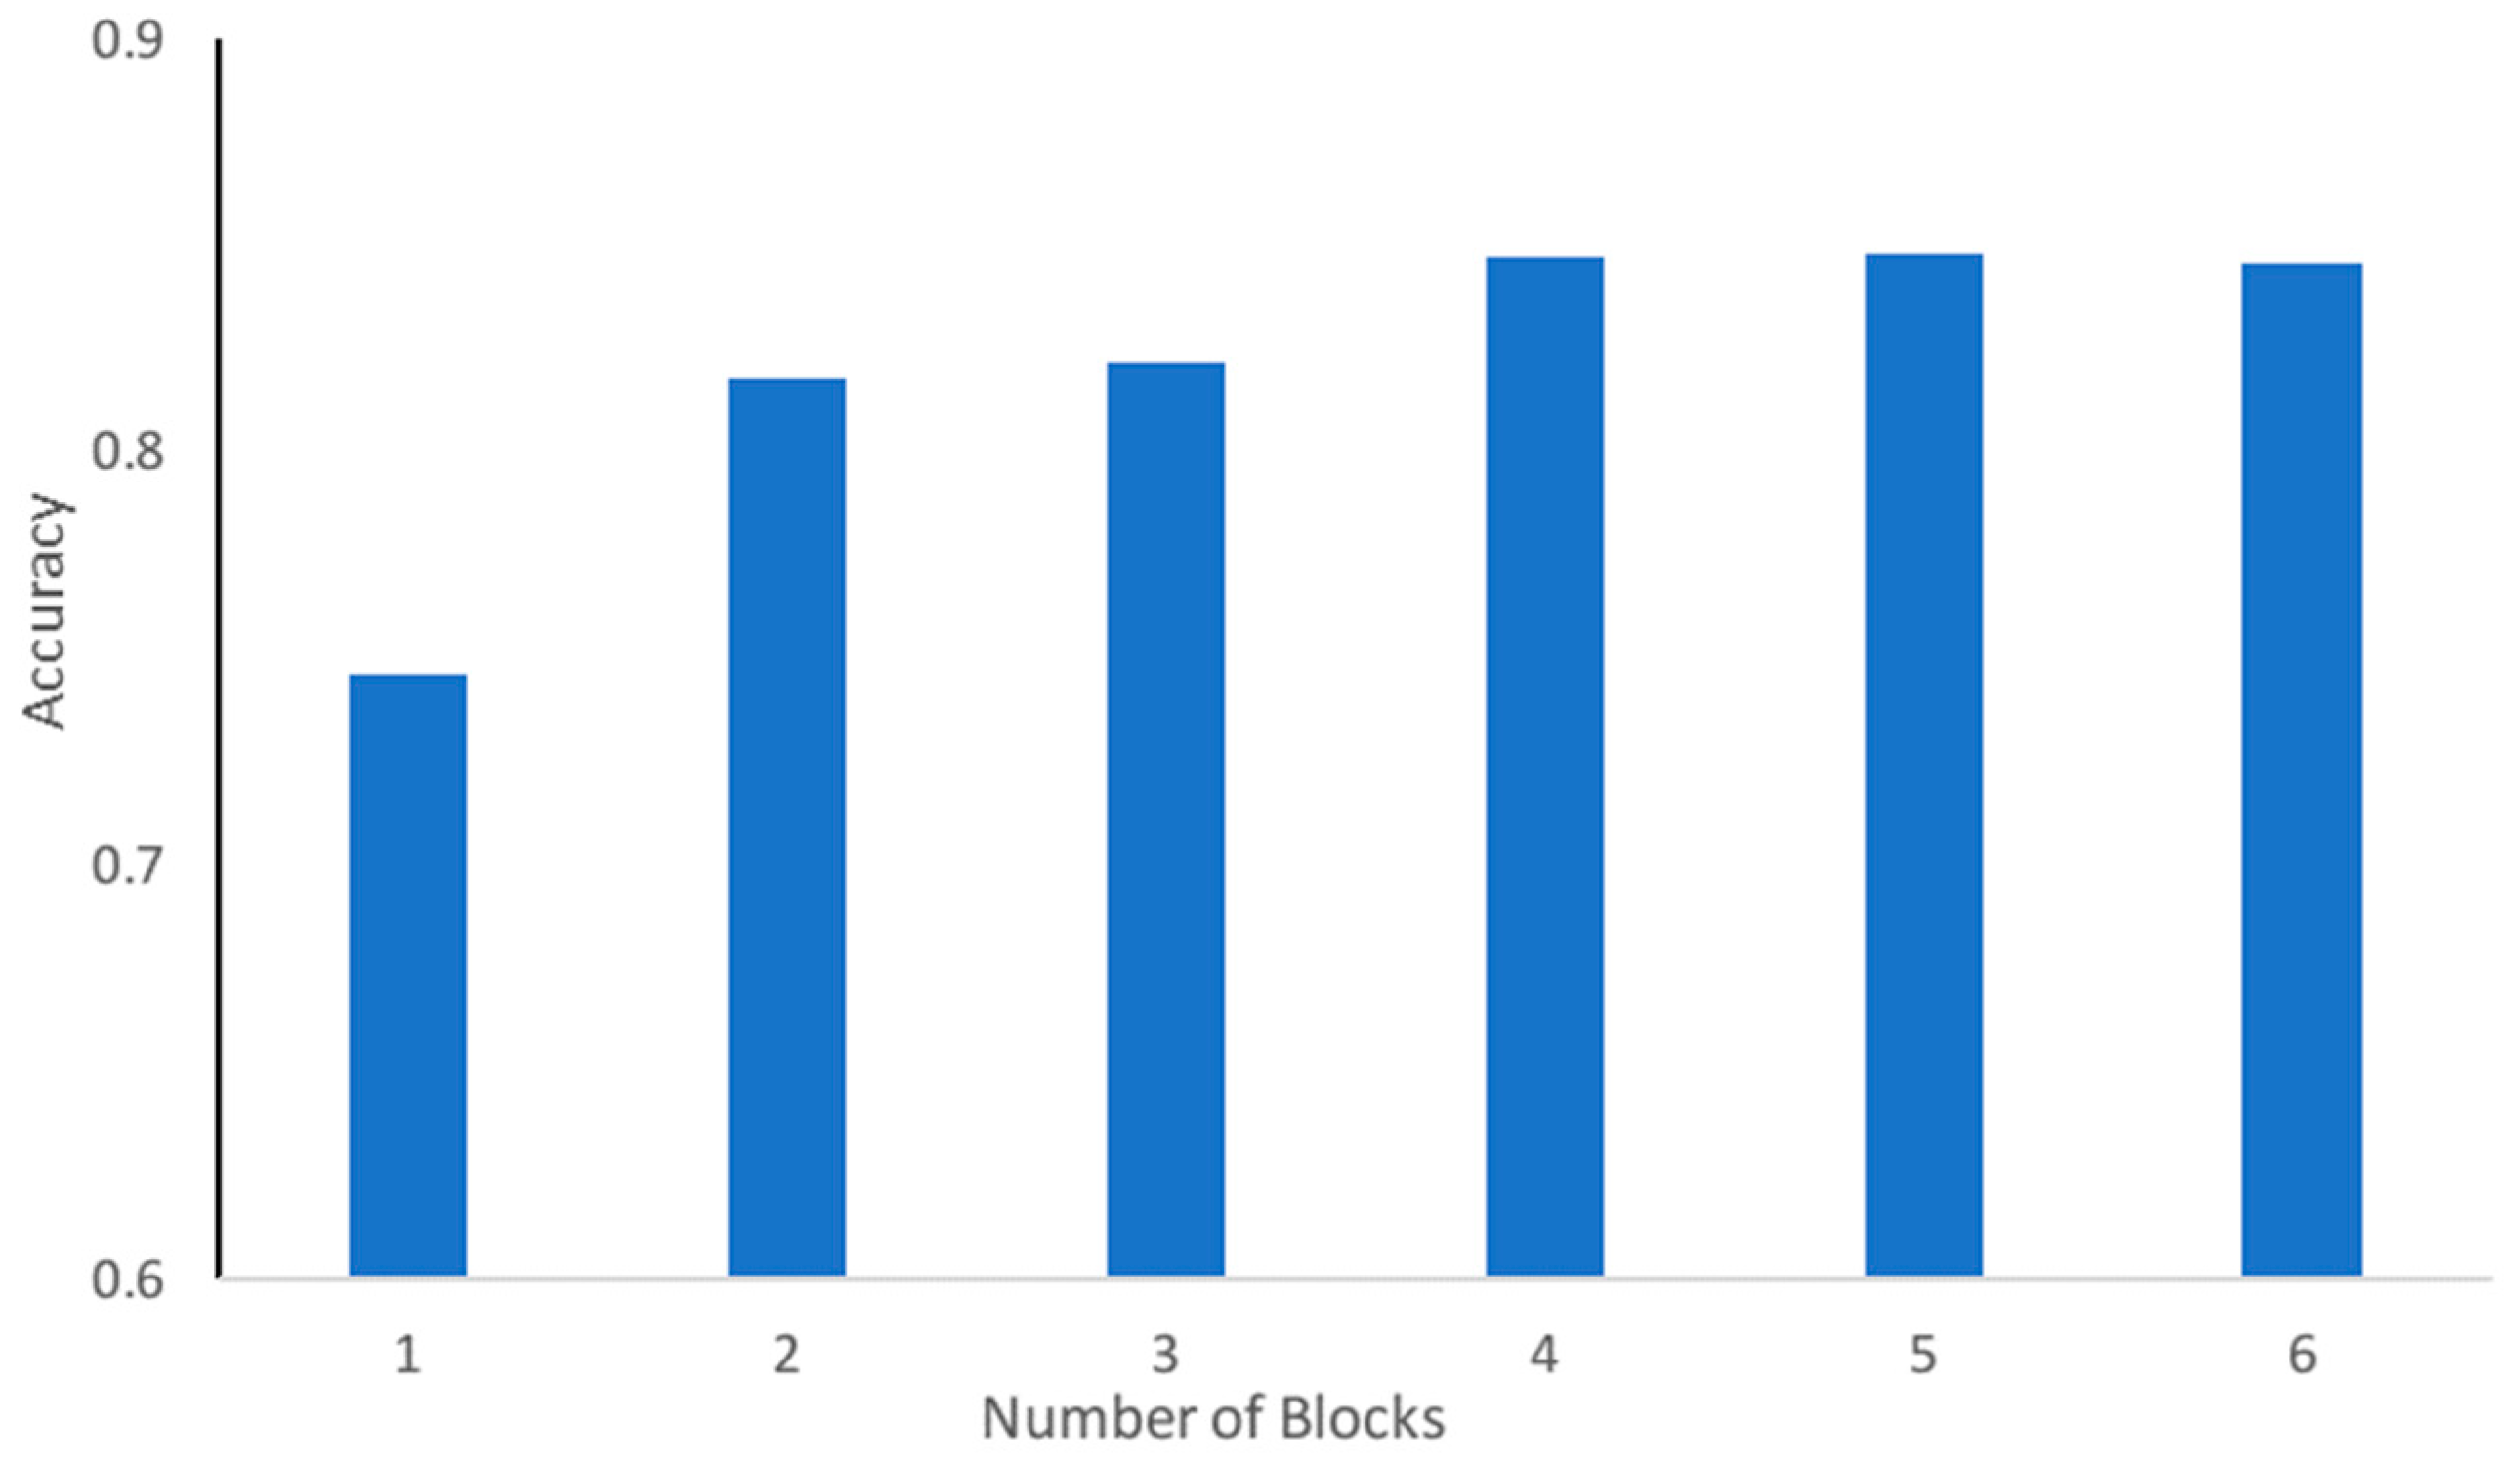
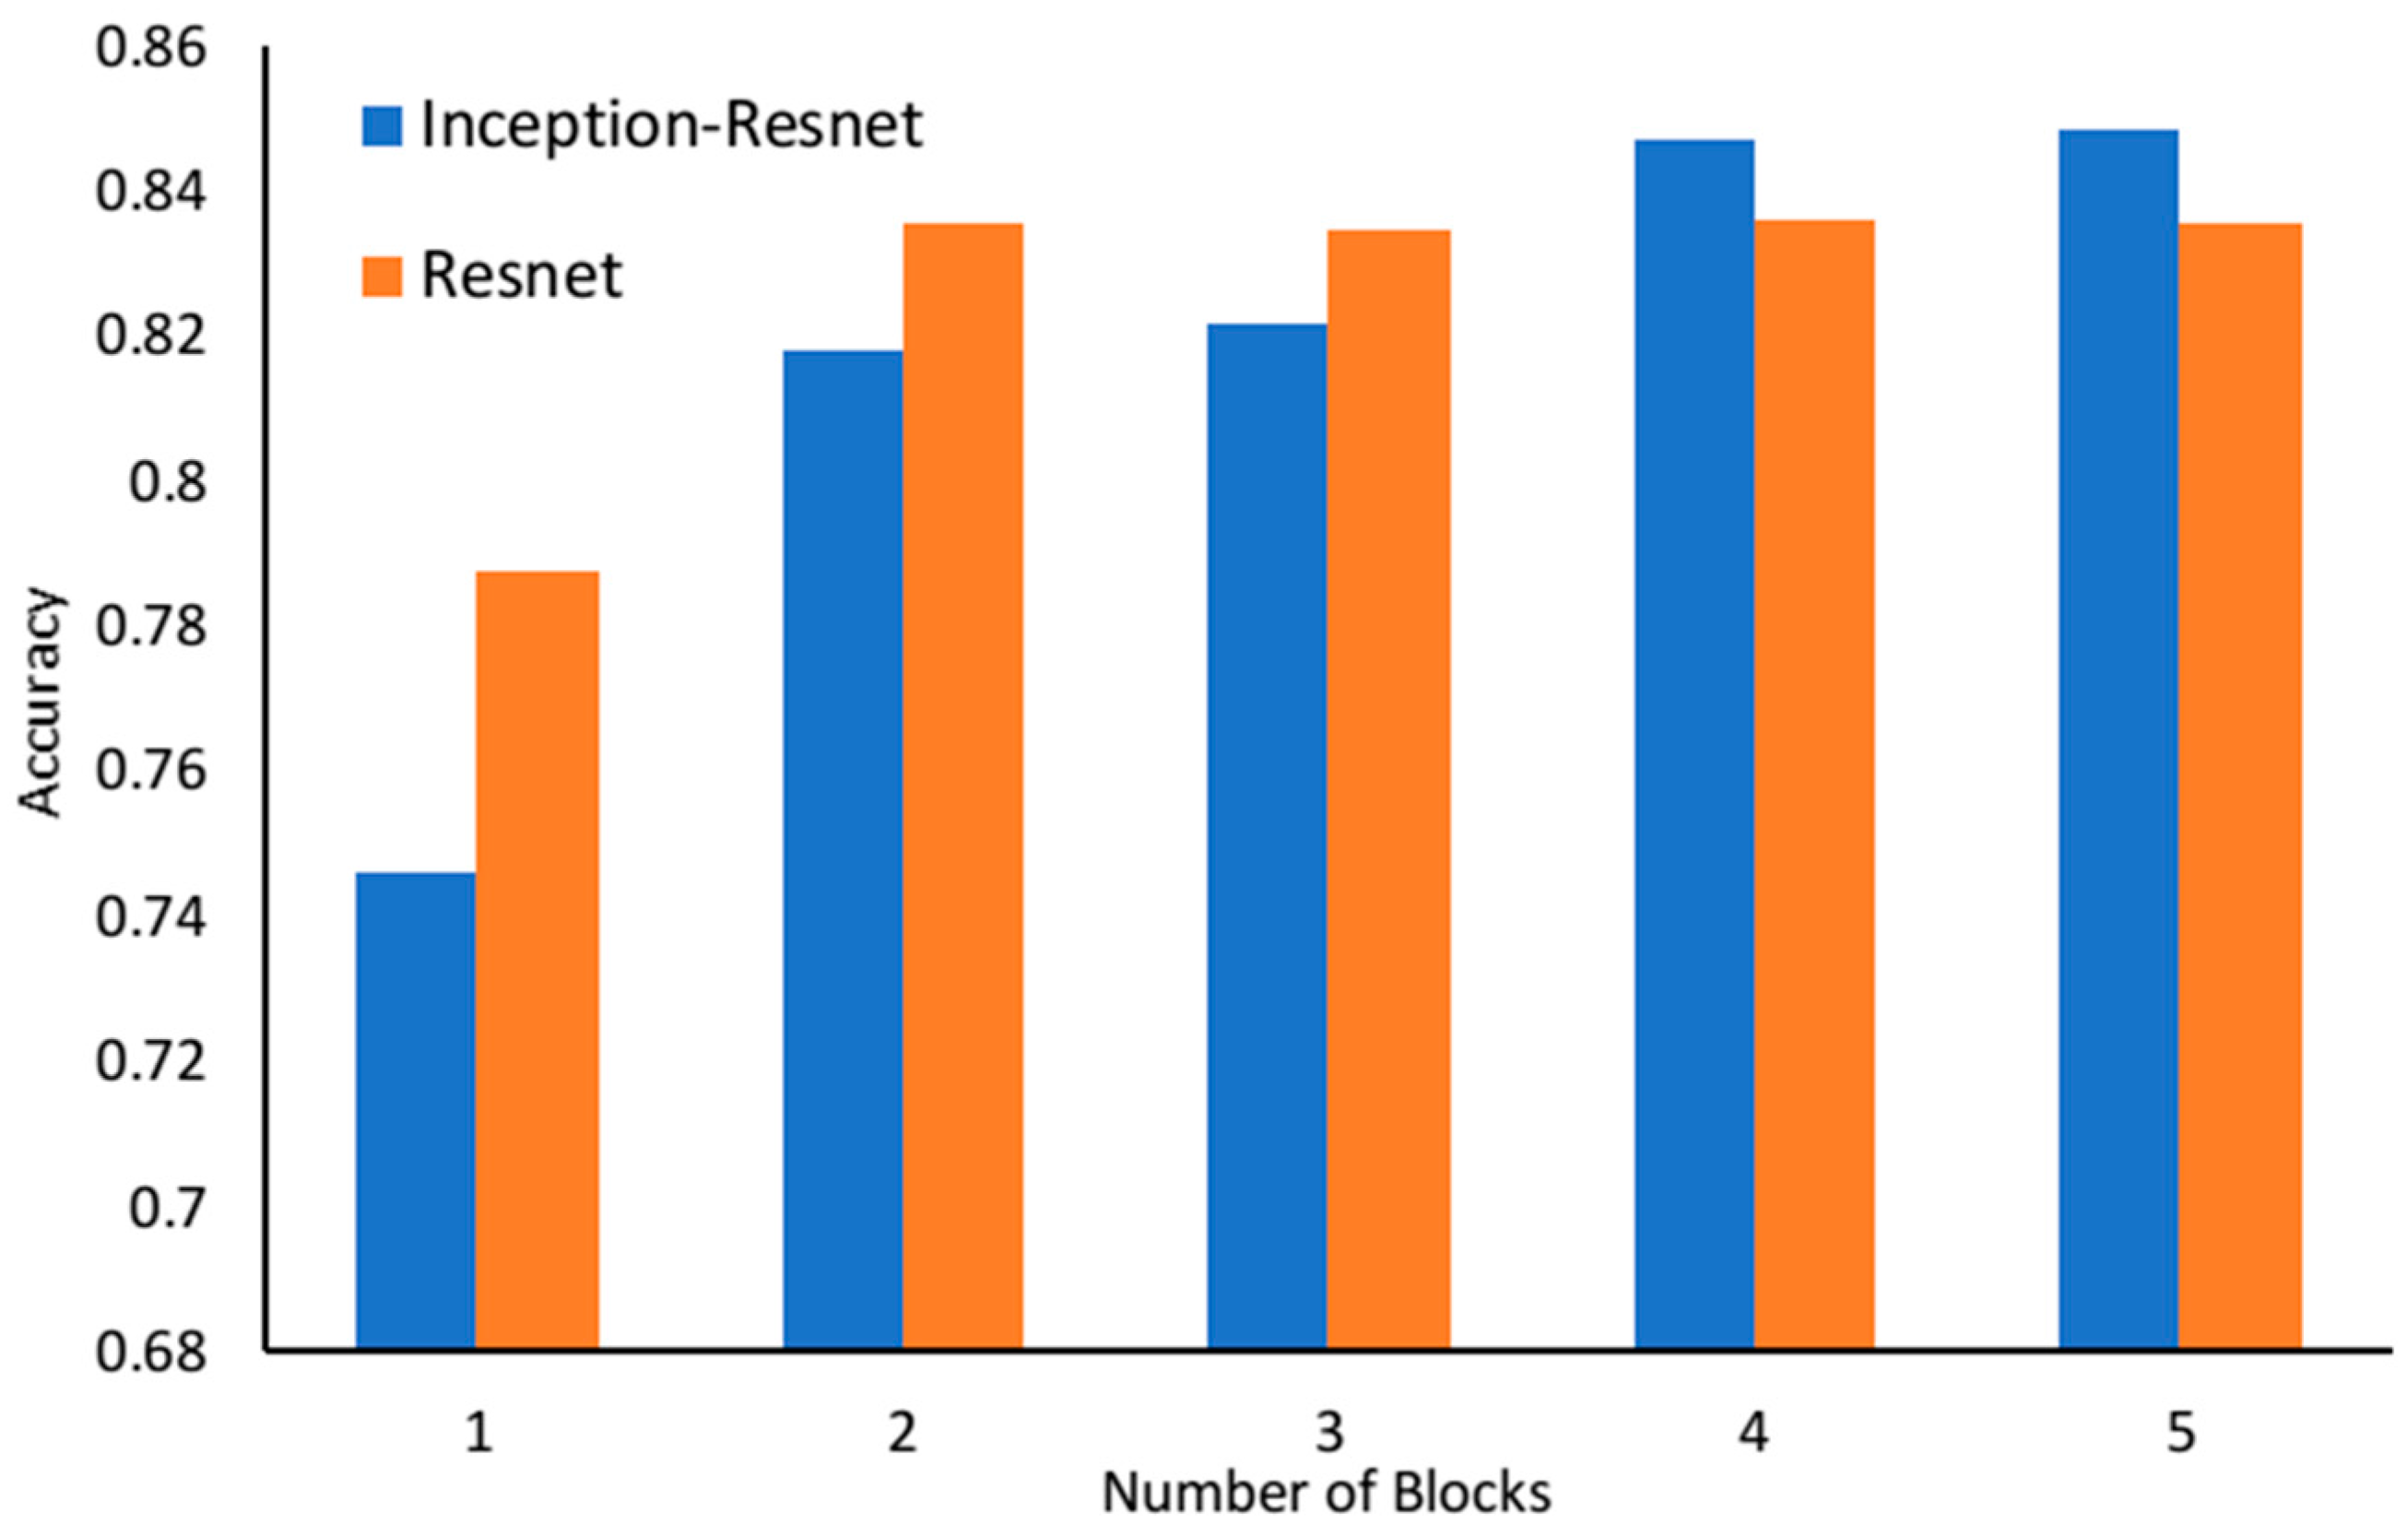
To evaluate the proposed approach, a series of experiments were conducted, focusing on the following three aspects:
(1)
The DCNN model sensitivity to the depth and width of the DCNN network;
(2)
A comparison between a representative of traditional spectral-based machine learning classification methods and the proposed DCNN method based on joint spatial-spectral information
(3)
The accuracy of the model for yellow rust detection in different observation periods across the whole growing season.
To investigate the effect of the depth and width of the network on the classification accuracy, we firstly changed the number of Inception-Resnet blocks in the proposed model to control the depth of the model. Then, we compared a model with multiple Resnet blocks and a model with multiple Inception-Resnet blocks for evaluating the effect of the network width. The configurations of convolution layers for Resnet block and Inception-Resnet blocks have been presented in Figure 5b,d, respectively. An Inception-Resnet block is wider than a Resnet block in terms of feature spaces extracted with multiscale convolution kernels. For each configuration, we trained ten times and used the model showing the best accuracy.
To investigate the effect of joint spatial-spectral information on yellow rust detection, we compared a representative of traditional machine learning classification methods only considering spectral information in datasets and the proposed DCNN based model considering both spatial and spectral information. Here, one of the most popular traditional machine learning method, random forest [52], was chosen as a representative. In this work, the random forest model used the central pixel value of each block and took a 125-dimensional data as input, while the proposed DCCN model used the values of each block with a size of 64 × 64 × 125 as input. After training, the performance of both models on yellow rust detection was evaluated on test datasets.
Timeliness and accuracy are two most important indicators for crop disease monitoring. Detecting the disease in early stages can effectively allow farmers to be prepared to reduce losses. Therefore, we also tested the performance of the proposed model on yellow rust detection in different observation periods during the whole growing season.

2.3.2. Training Network

In this work, we extracted a total of 15,000 blocks with a size of 64 × 64 × 125 from five hyperspectral images covering the whole growing season of winter wheat through the sliding window method. A total of 10,000 of these blocks were randomly chosen for training and validation (80% for training and the rest for validation), and the remaining 5000 blocks were used as test data for evaluating the performance of the proposed network. To prevent overfitting due to a limited supply of data and improve the model’s generalization, data augmentations through small random transformations with rotate, flip and mirror, were used on blocks for each epoch. Adam [53], a stochastic optimization algorithm, with a batch size of 64 samples, was used for optimization to train the proposed network. We initially set a base learning rate as 1 × 10⁻³. The base learning rate was decreased to 1 × 10⁻⁶ with increased iterations. CrossEntropy was selected as the loss function for this task which was commonly used for multi-class classification by combining LogSoftmax and negative log likelihood loss (NLLLoss) [54]. All the experiments were implemented based on pytorch 1.0 (Paszke et al., 2017) and executed on a PC with an Intel(R) Xeon(R) CPU E5-2650, NVIDIA TITAN × (Pascal) and 64 GB memory.

2.3.3. Performance Metrics

To evaluate the classification performance of the proposed architecture, overall accuracy, recall, precision and F1 scores were selected as the accuracy performance metrics. The overall accuracy is the ratio of the total number of correctly classified samples to the total number of samples of all classes. In this study, the samples are blocks extracted from hyperspectral images. Recall, precision and F1 scores can be calculated from the true positives (TP), the true negatives (TN), the false positives (FP) and the false negatives (FN). The metrics were calculated as follows:
Recall = T P T P + F N
Precision = T P T P + F P
F 1   score = 2 T P 2 T P + F N + F P
Accuracy = T P + T N T P + T N + F P + F N

3. Results

As described in Section 2.3.2, we randomly selected 10,000 blocks with a size of 64 × 64 × 125 extracted from five hyperspectral images as training datasets (80% for training and 20% for validation) for model training, and the remaining 5000 blocks as test datasets for evaluating the performance of models.

3.1. The DCNN Model Sensitivity to the Depth and Width of the Neural Network

Figure 6 shows a comparison of accuracy with different configurations of the number of Inception-Resnet blocks in the proposed model. It can be observed that there is no further obvious improvement in accuracy after the number of Inception-Resnet blocks reaches 4. Therefore, four Inception-Resnet blocks were chosen in our proposed model.
Figure 7 shows an accuracy comparison between two models, one with Inception-Resnet blocks and the other one with Resnet blocks. The model with one Resnet block has a higher accuracy than that of the model with one Inception-Resnet block. With the increase in the number of blocks, i.e., the increase of the network depth, both models show a performance improvement, but the model with Inception-Resnet blocks shows better performance than the model with Resnet-blocks.

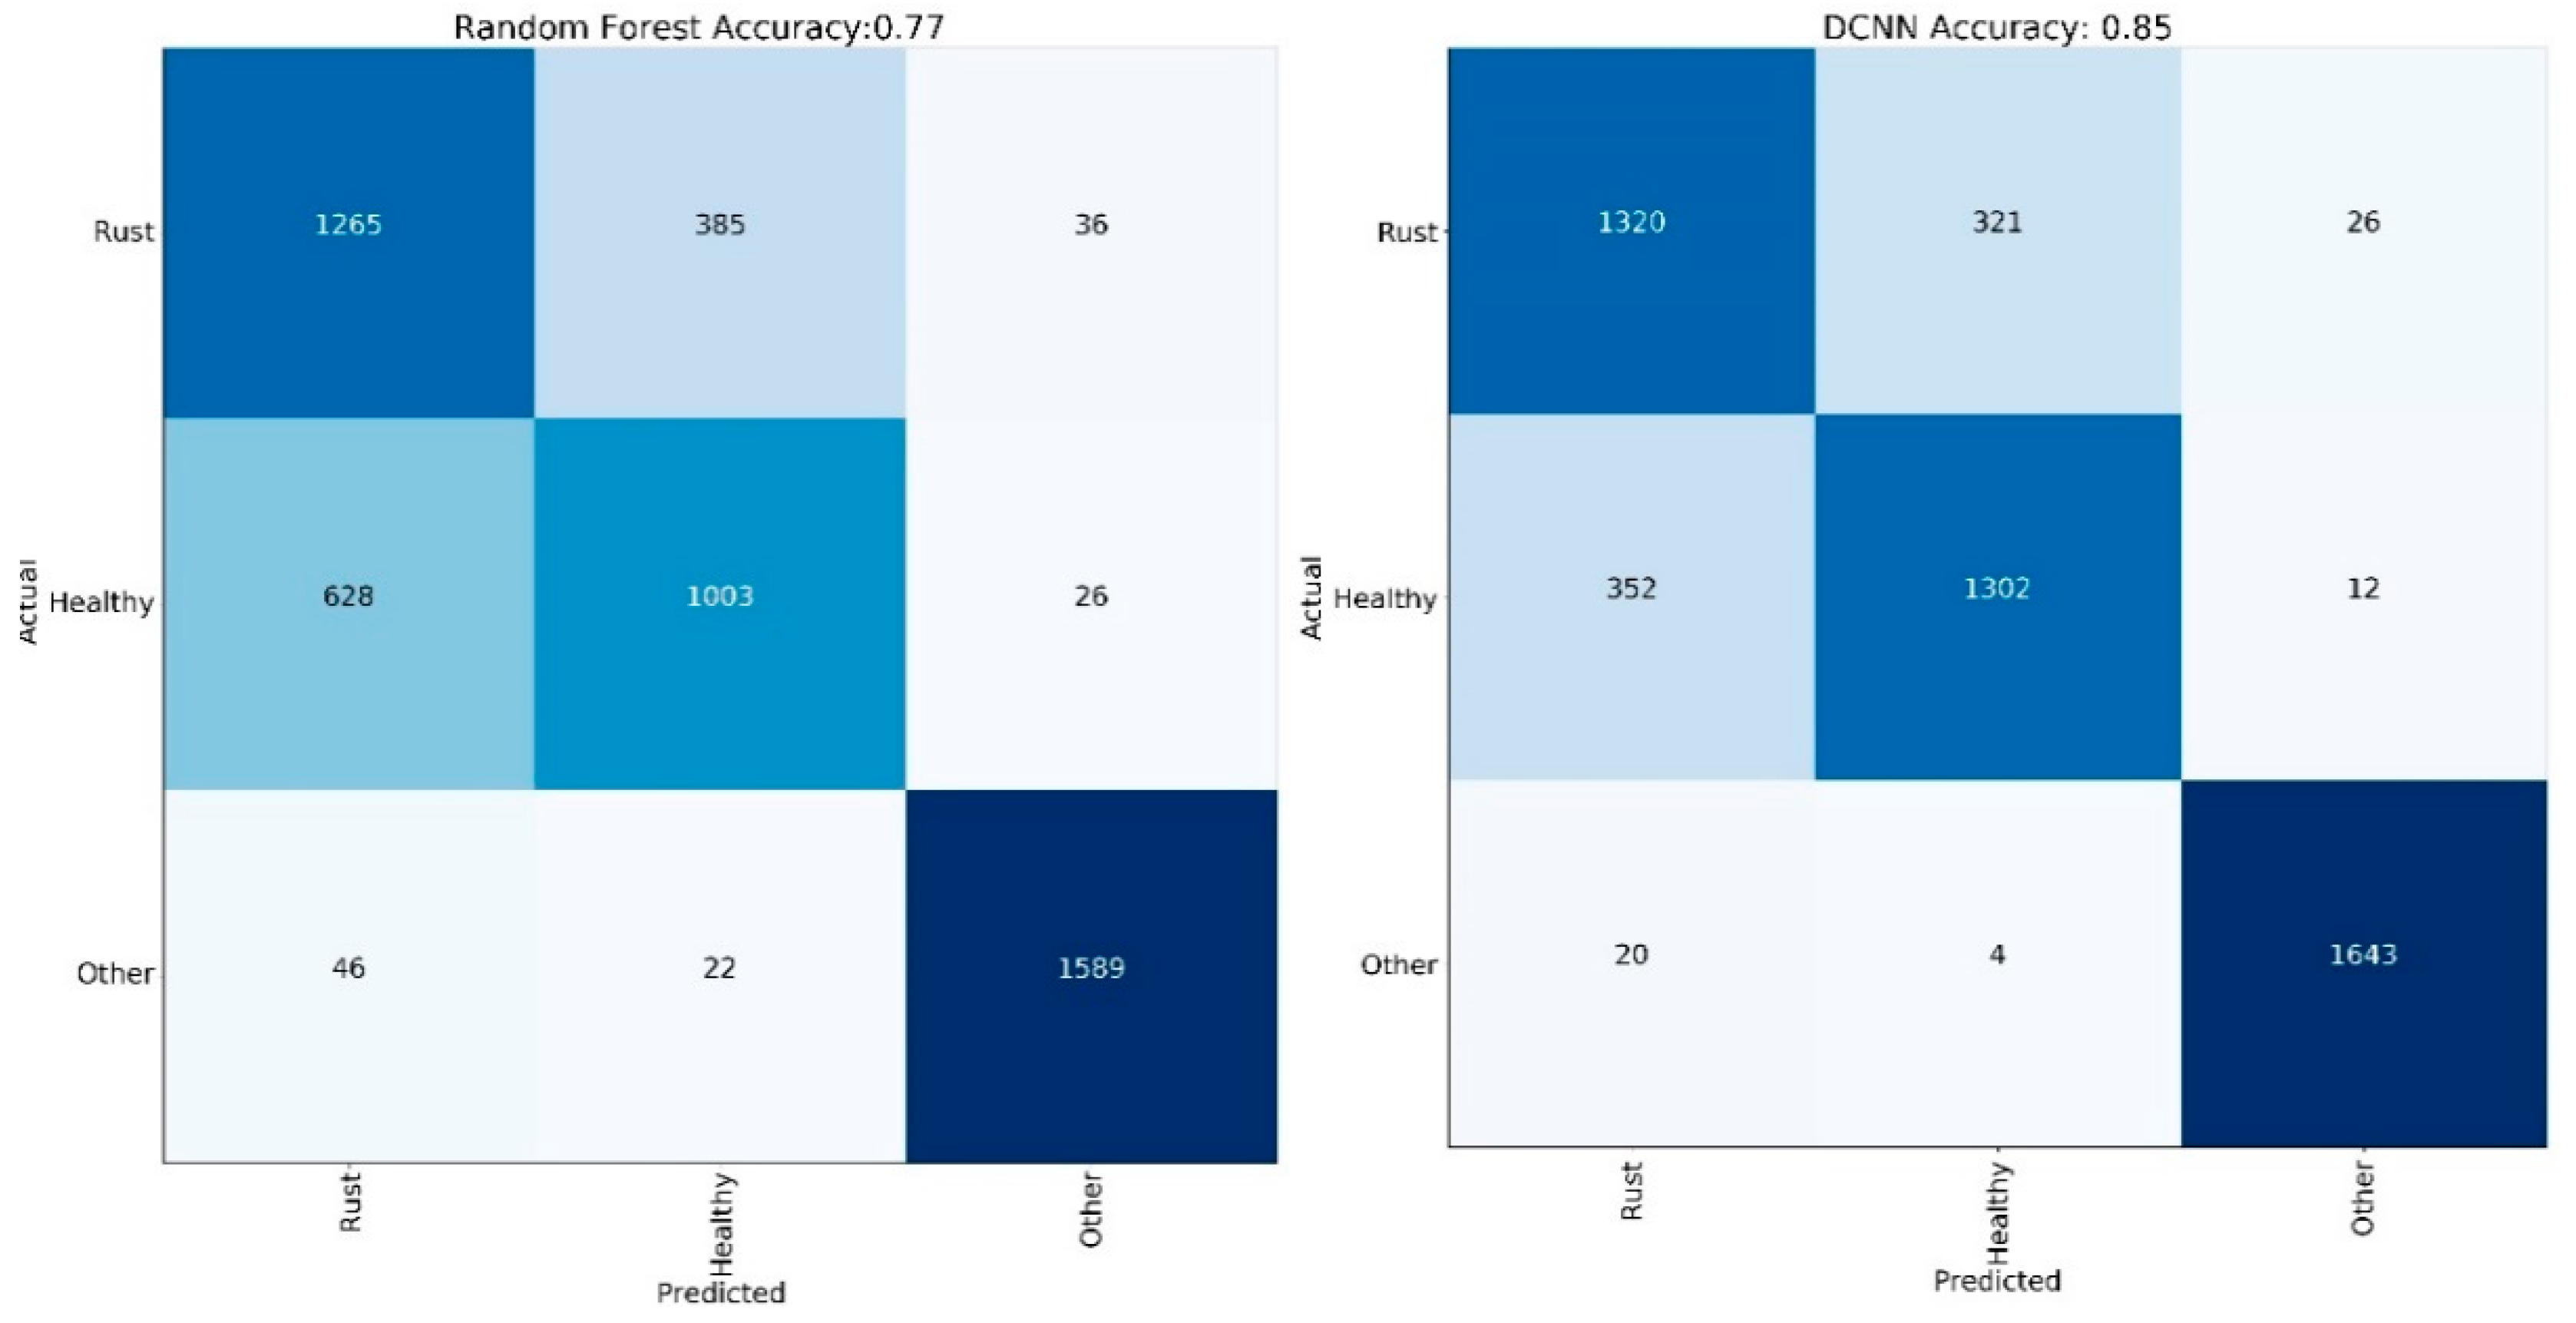
3.2. A Comparison between a Representative of Spectral-Based Traditional Machine Learning Classification Methods and the Proposed DCNN Method

Figure 8 provides the results of accuracy and confusion matrix for two models. One is a representative of spectral-based traditional machine learning classification method, random forest, and the other is our model. The random forest model achieves an accuracy of 0.77 while the proposed model achieves an accuracy of 0.85. The performance of the proposed model considering joint spatial-spectral information is better than the random forest model only considering spectral information.

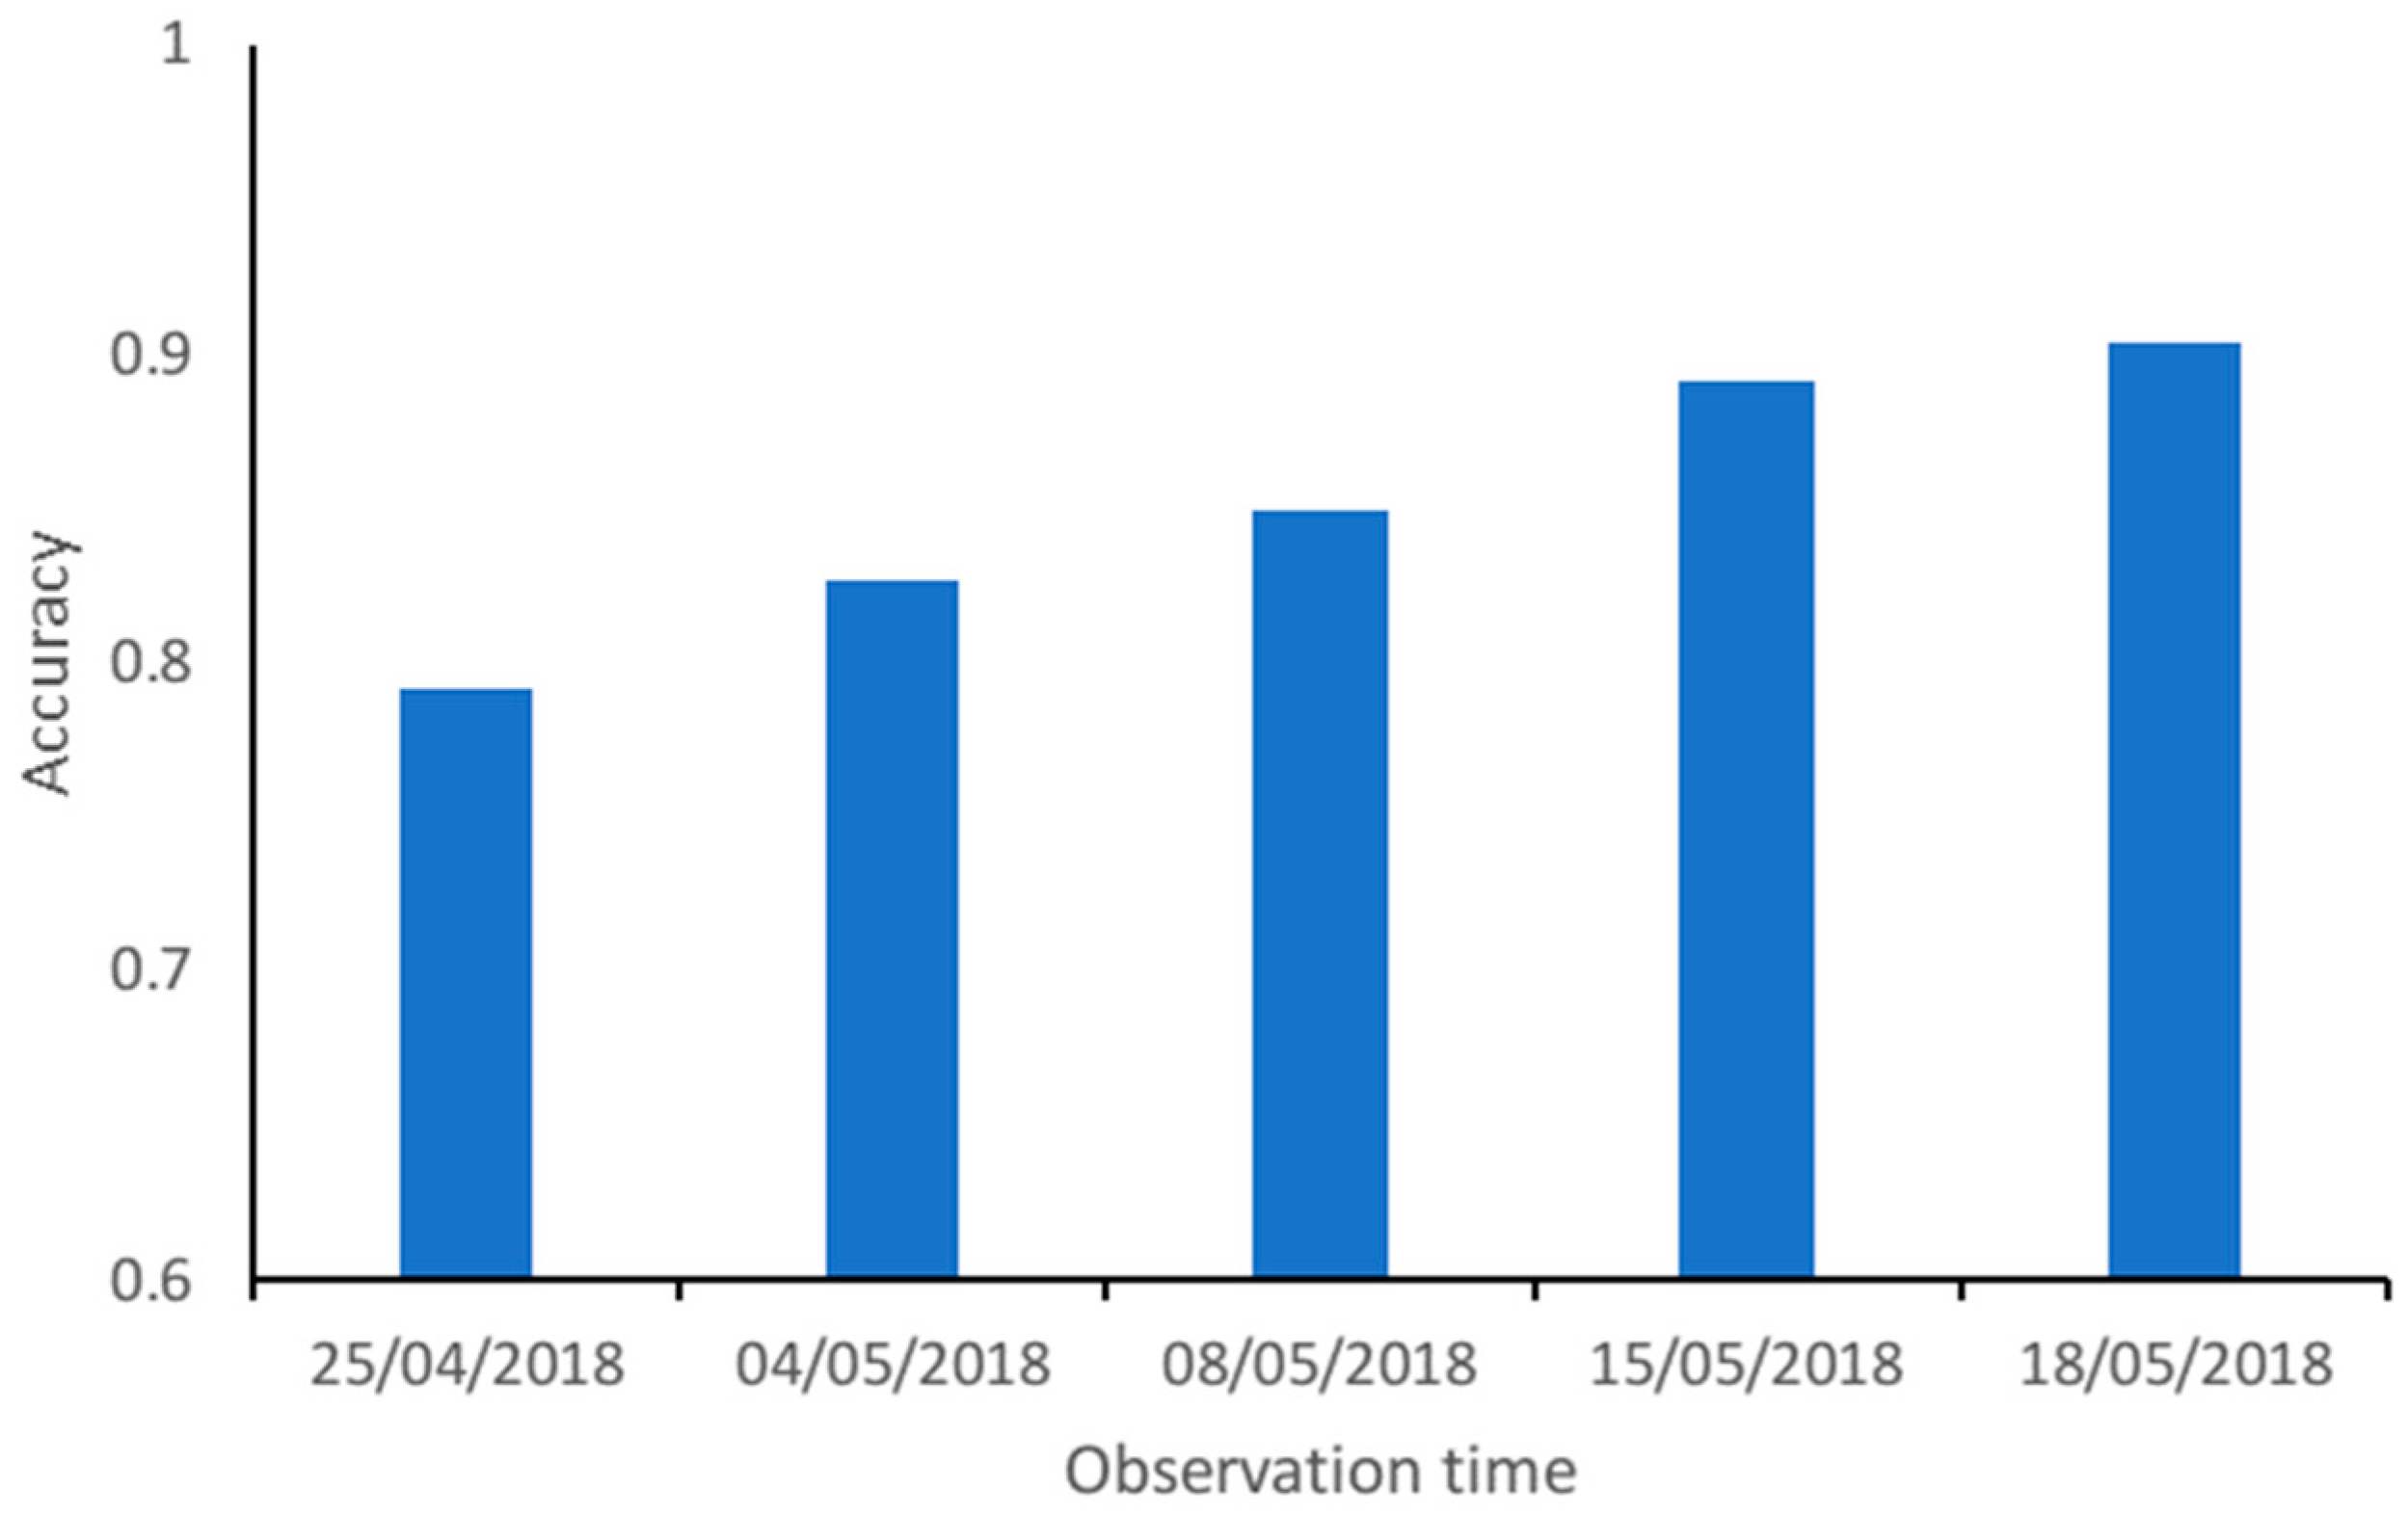
3.3. The Accuracy of the Model for Yellow Rust Detection in Different Observation Periods across the Whole Growing Season

Figure 9 presents the overall accuracy results of the proposed model for yellow rust detection in different observation periods across the whole growing season. It can be observed that the proposed model provides more accurate detections on datasets collected at a later stage of the crop growth. For instance, the accuracy of the model is 0.79 for the datasets collected on 25 April 2018, but close to 0.90 for those collected on 15 May and 18 May 2018. Table 1 lists the classification results across different periods. All metrics for class “other” are much higher (>0.95) than class “Rust” and class “Healthy”. Over 85% rust area were detected from the datasets collected on 15 May 2018 and 18 May 2018 (the recall rates of rust class reach 0.86 and 0.85, respectively).

4. Discussion

In this paper, we proposed a new DCNN based approach for automated yellow dust detection, which could exploit both spatial and spectral information of very high-resolution hyperspectral images captured with UAVs. Since the depth, width and filter size of a DCNN-based network [44,50,55,56] could affect its performance, we introduced multiple Inception-Resnet layers to consider all three factors in the proposed neural network architecture. To ensure the accuracy and the computing efficiency, the effects of the depth, width and filter size on network performance were investigated based on a series of experiments. The results showed that there was no further obvious improvement in accuracy after the model depth (i.e., the number of Inception-Resnet layers) reached 4. We also found after Inception-Resnet layers were replaced with Resnet layers in our model, that is, reducing the width and the variety in filter size, the model performance was reduced. This demonstrated that increasing the network width and using multi-scale filters could improve the classification performance on high-resolution hyperspectral imagery, which was consistent with previous studies [45,46,51,57,58].
Previous studies have shown significant improvement in performance by using joint spatial-spectral information for plant disease detection [35,36,37,38,59]. To investigate how the yellow rust detection could benefit from using joint spatial-spectral information of high-resolution UAV hyperspectral imagery, we compared our model with random forest, a representative of traditional machine learning methods considering only spectral information. An accuracy of 0.85 was achieved for our model versus 0.77 for the random forest classifier. To understand why using joint spatial-spectral information was better than only using spectral information, we analysed the spectral profiles of hyperspectral images. Figure 10 illustrates the spectrums of 10,000 pixels randomly chosen from rust, healthy and other areas of hyperspectral images, respectively. We can observe that the spectral profiles of hyperspectral data captured with UAVs are highly variable. Therefore, it would be difficult to identity rust and healthy fields only from spectral information. However, a high-resolution hyperspectral image contains crucial spatial information, it was a very important feature for object recognition in remote sensing images [34,35].
To visually display the benefit of joint spatial-spectral information for rust detection, we also compared the mapping results after detection from our DCNN model and the random-forest. Figure 11 shows the rust detection mapping results of two plots from the two models. The detection results of the rust infected areas are overlaid on the original images. The two images were captured on the 18 May 2018, one from a wheat plot with rust disease (see the image at the first row of Figure 11a) and the other from a healthy wheat plot (see the image at the second row of Figure 11a). The accuracy of rust detection on the rust plot was 0.85 for our DCNN model and 0.77 for the random-forest classifier, the mapping results of the two models were similar (see the image at the first row of both Figure 11b,c). The accuracy of rust detection on the healthy wheat plot was 0.86 for our DCNN model and 0.71 for the random-forest classifier. A total of 29% of areas in the image of the healthy wheat plot (see the image at the second row of Figure 11b) are misclassified as rust-infected areas by the random-forest classifier due to higher variances in spectrum in healthy wheat regions (see Figure 10). However, the misclassification of our DCNN model (see the image at the second row of Figure 11c) is much less than that of the random-forest classifier (see the image at the second row of Figure 11b). Overall, benefiting from the joint spatial-spectral information, our DCNN model performed better on yellow rust detection than the random-forest classifier. This further confirmed that using the joint spatial-spectral information could potentially improve the accuracy of yellow rust detection from high-resolution hyperspectral images [37,38,59].
Previous studies [60,61] showed that the detection accuracy of yellow rust at a leaf scale could reach around 0.88. In general, at a field scale, not all the leaves in infected fields had yellow rust, hence the accuracy of labelling pixels representing healthy leaves in infected fields was limited. This may partially explain why the accuracy at the field scale from our model (0.85) was slightly lower than the accuracy at the leaf scale reported before.

5. Conclusions

In this work, we have proposed a deep convolutional neural network (DCNN)-based approach for automated detection of yellow rust in winter wheat fields from UAV hyperspectral images. We have designed a new DCNN model by introducing multiple Inception-Resnet layers for deep feature extraction, and the model was optimized to establish the most suitable depth and width. Benefiting from the ability of convolution layers to handle three-dimensional data, the model could use both spatial and spectral information for yellow rust detection. The model has been validated with real ground truth data and compared with random forest, a representative of the traditional spectral-based machine learning classification method. The experimental results have demonstrated that combining both spectral and spatial information could significantly improve the accuracy of yellow dust detection on very high spatial resolution hyperspectral images across the whole growing stages of winter wheat. This study further confirmed that the proposed deep learning architecture has potential for crop disease detection. The future work will be to validate the proposed model on more UAV hyperspectral image datasets with various crop fields and different types of crop diseases. In addition, new dimensionality reduction algorithms on large hyperspectral images will also be further developed for efficient data analysis.

Author Contributions

Conceptualization: all authors; methodology: X.Z., L.H. (Liangxiu Han) and L.H. (Lianghao Han); data acquisition: Y.D. (Yingying Dong), Y.S., W.H. (Wenjiang Huang) and L.H. (Liangxiu Han); software: X.Z.; analysis: X.Z., L.H. (Liangxiu Han) and L.H. (Lianghao Han); writing—original draft preparation: X.Z.; writing—review and editing: all authors; supervision: L.H. (Liangxiu Han).

Funding

This research is supported Agri-Tech in the China Newton Network+ (ATCNN)—Quzhou Integrated Platform (QP003), BBSRC (BB/R019983/1), BBSRC (BB/S020969/1), National Key R and D Program of China (2017YFE0122400) and the STFC Newton Agritech Programme (ST/N006712/1). The work is also supported by Newton Fund Institutional Links grant, ID 332438911, under the Newton-Ungku Omar Fund partnership (The grant is funded by the UK Department of Business, Energy and Industrial Strategy (BEIS) and the Malaysian Industry-Government Group for High Technology and delivered by the British Council. For further information, please visit www.newtonfund.ac.uk).

Acknowledgments

We thank the anonymous reviewers for reviewing the manuscript and providing comments to improve the manuscript.

Conflicts of Interest

The authors declare no conflict of interest.

References

  1. Singh, R.P.; William, H.M.; Huerta-Espino, J.; Rosewarne, G. Wheat Rust in Asia: Meeting the Challenges with Old and New Technologies. In Proceedings of the 4th International Crop Science Congress, Brisbane, Australia, 26 September–1 October 2004; The Regional Institute Ltd Gosford: Warragul, Australia, 2004; Volume 26. [Google Scholar]
  2. Wellings, C.R. Global status of stripe rust: A review of historical and current threats. Euphytica 2011, 179, 129–141. [Google Scholar] [CrossRef]
  3. Beddow, J.M.; Pardey, P.G.; Chai, Y.; Hurley, T.M.; Kriticos, D.J.; Braun, H.-J.; Park, R.F.; Cuddy, W.S.; Yonow, T. Research investment implications of shifts in the global geography of wheat stripe rust. Nat. Plants 2015, 1, 15132. [Google Scholar] [CrossRef] [PubMed]
  4. Savary, S.; Willocquet, L.; Pethybridge, S.J.; Esker, P.; McRoberts, N.; Nelson, A. The global burden of pathogens and pests on major food crops. Nat. Ecol. Evol. 2019, 3, 430–439. [Google Scholar] [CrossRef] [PubMed]
  5. Kang, Z.; Zhao, J.; Han, D.; Zhang, H.; Wang, X.; Wang, C.; Guo, J.; Huang, L. Status of wheat rust research and control in China. In Proceedings of the BGRI 2010 Technical Workshop Oral Presentations, St. Petersburg, Russia, 30–31 May 2010. [Google Scholar]
  6. Shi, Y.; Huang, W.; González-Moreno, P.; Luke, B.; Dong, Y.; Zheng, Q.; Ma, H.; Liu, L. Wavelet-Based Rust Spectral Feature Set (WRSFs): A Novel Spectral Feature Set Based on Continuous Wavelet Transformation for Tracking Progressive Host–Pathogen Interaction of Yellow Rust on Wheat. Remote Sens. 2018, 10, 525. [Google Scholar] [CrossRef]
  7. Wan, A.M.; Chen, X.M.; He, Z.H. Wheat stripe rust in China. Aust. J. Agric. Res. 2007, 58, 605–619. [Google Scholar] [CrossRef]
  8. Sindhuja, S.; Ashish, M.; Reza, E.; Cristina, D. A review of advanced techniques for detecting plant diseases. Comput. Electron. Agric. 2010, 72, 1–13. [Google Scholar]
  9. Bock, C.H.; Poole, G.H.; Parker, P.E.; Gottwald, T.R. Plant disease severity estimated visually, by digital photography and image analysis, and by hyperspectral imaging. Crit. Rev. Plant Sci. 2010, 29, 59–107. [Google Scholar] [CrossRef]
  10. Moshou, D.; Bravo, C.; West, J.; Wahlen, S.; McCartney, A.; Ramon, H. Automatic detection of ‘yellow rust’ in wheat using reflectance measurements and neural networks. Comput. Electron. Agric. 2004, 44, 173–188. [Google Scholar] [CrossRef]
  11. Mirik, M.; Jones, D.C.; Price, J.A.; Workneh, F.; Ansley, R.J.; Rush, C.M. Satellite remote sensing of wheat infected by Wheat streak mosaic virus. Plant Dis. 2011, 95, 4–12. [Google Scholar] [CrossRef]
  12. Han, L.; Haleem, M.S.; Taylor, M. Automatic Detection and Severity Assessment of Crop. Diseases Using Image Pattern Recognition; Springer International Publishing: Cham, Switzerland, 2016. [Google Scholar]
  13. Lenthe, J.-H.; Oerke, E.-C.; Dehne, H.-W. Digital infrared thermography for monitoring canopy health of wheat. Precis. Agric. 2007, 8, 15–26. [Google Scholar] [CrossRef]
  14. Jones, H.G.; Stoll, M.; Santos, T.; de Sousa, C.; Chaves, M.M.; Grant, O.M. Use of infrared thermography for monitoring stomatal closure in the field: Application to grapevine. J. Exp. Bot. 2002, 53, 2249–2260. [Google Scholar] [CrossRef] [PubMed]
  15. Mahlein, A.-K. Plant disease detection by imaging sensors–parallels and specific demands for precision agriculture and plant phenotyping. Plant Dis. 2016, 100, 241–251. [Google Scholar] [CrossRef] [PubMed]
  16. Meroni, M.; Rossini, M.; Guanter, L.; Alonso, L.; Rascher, U.; Colombo, R.; Moreno, J. Remote sensing of solar-induced chlorophyll fluorescence: Review of methods and applications. Remote Sens. Environ. 2009, 113, 2037–2051. [Google Scholar] [CrossRef]
  17. Zarco-Tejada, P.J.; Berni, J.A.; Suárez, L.; Sepulcre-Cantó, G.; Morales, F.; Miller, J.R. Imaging chlorophyll fluorescence with an airborne narrow-band multispectral camera for vegetation stress detection. Remote Sens. Environ. 2009, 113, 1262–1275. [Google Scholar] [CrossRef]
  18. Scholes, J.D.; Rolfe, S.A. Chlorophyll fluorescence imaging as tool for understanding the impact of fungal diseases on plant performance: A phenomics perspective. Funct. Plant Biol. 2009, 36, 880–892. [Google Scholar] [CrossRef]
  19. Tischler, Y.K.; Thiessen, E.; Hartung, E. Early optical detection of infection with brown rust in winter wheat by chlorophyll fluorescence excitation spectra. Comput. Electron. Agric. 2018, 146, 77–85. [Google Scholar] [CrossRef]
  20. Cogliati, S.; Rossini, M.; Julitta, T.; Meroni, M.; Schickling, A.; Burkart, A.; Pinto, F.; Rascher, U.; Colombo, R. Continuous and long-term measurements of reflectance and sun-induced chlorophyll fluorescence by using novel automated field spectroscopy systems. Remote Sens. Environ. 2015, 164, 270–281. [Google Scholar] [CrossRef]
  21. Xu, P.; Wu, G.; Guo, Y.; Chen, X.; Yang, H.; Zhang, R. Automatic Wheat Leaf Rust Detection and Grading Diagnosis via Embedded Image Processing System. Procedia Comput. Sci. 2017, 107, 836–841. [Google Scholar] [CrossRef]
  22. Adão, T.; Hruška, J.; Pádua, L.; Bessa, J.; Peres, E.; Morais, R.; Sousa, J.J. Hyperspectral Imaging: A Review on UAV-Based Sensors, Data Processing and Applications for Agriculture and Forestry. Remote Sens. 2017, 9, 1110. [Google Scholar] [CrossRef]
  23. Zarco-Tejada, P.J.; Miller, J.R.; Mohammed, G.H.; Noland, T.L.; Sampson, P.H. Vegetation stress detection through chlorophyll a + b estimation and fluorescence effects on hyperspectral imagery. J. Environ. Qual. 2002, 31, 1433–1441. [Google Scholar] [CrossRef]
  24. Hilker, T.; Coops, N.C.; Wulder, M.A.; Black, T.A.; Guy, R.D. The use of remote sensing in light use efficiency based models of gross primary production: A review of current status and future requirements. Sci. Total Environ. 2008, 404, 411–423. [Google Scholar] [CrossRef] [PubMed] [Green Version]
  25. Boegh, E.; Søgaard, H.; Broge, N.; Hasager, C.B.; Jensen, N.O.; Schelde, K.; Thomsen, A. Airborne multispectral data for quantifying leaf area index, nitrogen concentration, and photosynthetic efficiency in agriculture. Remote Sens. Environ. 2002, 81, 179–193. [Google Scholar] [CrossRef]
  26. Borengasser, M.; Hungate, W.S.; Watkins, R.; Hungate, W.S.; Watkins, R. Hyperspectral Remote Sensing: Principles and Applications; CRC Press: Boca Raton, FL, USA, 2007; ISBN 978-1-4200-1260-6. [Google Scholar]
  27. Golhani, K.; Balasundram, S.K.; Vadamalai, G.; Pradhan, B. A review of neural networks in plant disease detection using hyperspectral data. Inf. Process. Agric. 2018, 5, 354–371. [Google Scholar] [CrossRef]
  28. Yao, Z.; Lei, Y.; He, D. Early Visual Detection of Wheat Stripe Rust Using Visible/Near-Infrared Hyperspectral Imaging. Sensors 2019, 19, 952. [Google Scholar] [CrossRef] [PubMed]
  29. Devadas, R.; Lamb, D.W.; Simpfendorfer, S.; Backhouse, D. Evaluating ten spectral vegetation indices for identifying rust infection in individual wheat leaves. Precis. Agric. 2009, 10, 459–470. [Google Scholar] [CrossRef]
  30. Ashourloo, D.; Mobasheri, M.R.; Huete, A. Evaluating the Effect of Different Wheat Rust Disease Symptoms on Vegetation Indices Using Hyperspectral Measurements. Remote Sens. 2014, 6, 5107–5123. [Google Scholar] [CrossRef] [Green Version]
  31. Gennaro, S.F.D.; Battiston, E.; Marco, S.D.; Facini, O.; Matese, A.; Nocentini, M.; Palliotti, A.; Mugnai, L. Unmanned Aerial Vehicle (UAV)—based remote sensing to monitor grapevine leaf stripe disease within a vineyard affected by esca complex. Phytopathol. Mediterr. 2016, 55, 262–275. [Google Scholar]
  32. Li, X.; Wang, J.; Strahler, A.H. Scale effects and scaling-up by geometric-optical model. Sci. China Ser. E Technol. Sci. 2000, 43, 17–22. [Google Scholar] [CrossRef]
  33. Zeggada, A.; Melgani, F.; Bazi, Y. A Deep Learning Approach to UAV Image Multilabeling. IEEE Geosci. Remote Sens. Lett. 2017, 14, 694–698. [Google Scholar] [CrossRef]
  34. Fauvel, M.; Chanussot, J.; Benediktsson, J.A.; Sveinsson, J.R. Spectral and spatial classification of hyperspectral data using SVMs and morphological profiles. In Proceedings of the 2007 IEEE International Geoscience and Remote Sensing Symposium, Barcelona, Spain, 23–28 July 2007; pp. 4834–4837. [Google Scholar]
  35. Gao, F.; Wang, Q.; Dong, J.; Xu, Q. Spectral and Spatial Classification of Hyperspectral Images Based on Random Multi-Graphs. Remote Sens. 2018, 10, 1271. [Google Scholar] [CrossRef]
  36. Chen, Y.; Lin, Z.; Zhao, X.; Wang, G.; Gu, Y. Deep Learning-Based Classification of Hyperspectral Data. IEEE J. Sel. Top. Appl. Earth Obs. Remote Sens. 2014, 7, 2094–2107. [Google Scholar] [CrossRef]
  37. Fang, L.; Li, S.; Kang, X.; Benediktsson, J.A. Spectral–Spatial Classification of Hyperspectral Images with a Superpixel-Based Discriminative Sparse Model. IEEE Trans. Geosci. Remote Sens. 2015, 53, 4186–4201. [Google Scholar] [CrossRef]
  38. Liu, J.; Wu, Z.; Wei, Z.; Xiao, L.; Sun, L. Spatial-Spectral Kernel Sparse Representation for Hyperspectral Image Classification. IEEE J. Sel. Top. Appl. Earth Obs. Remote Sens. 2013, 6, 2462–2471. [Google Scholar] [CrossRef]
  39. Duro, D.C.; Franklin, S.E.; Dubé, M.G. A comparison of pixel-based and object-based image analysis with selected machine learning algorithms for the classification of agricultural landscapes using SPOT-5 HRG imagery. Remote Sens. Environ. 2012, 118, 259–272. [Google Scholar] [CrossRef]
  40. DJI—About Us. Available online: https://www.dji.com/uk/company (accessed on 16 May 2019).
  41. Hyperspectral Firefleye S185 SE. Cubert-GmbH. Available online: http://cubert-gmbh.de/ (accessed on 29 June 2019).
  42. Li, W.; Fu, H.; Yu, L.; Cracknell, A. Deep Learning Based Oil Palm Tree Detection and Counting for High-Resolution Remote Sensing Images. Remote Sens. 2016, 9, 22. [Google Scholar] [CrossRef]
  43. Lienhart, R.; Maydt, J. An extended set of Haar-like features for rapid object detection. In Proceedings of the Proceedings International Conference on Image Processing, Rochester, NY, USA, 22–25 September 2002; Volume 1, p. I. [Google Scholar]
  44. He, K.; Zhang, X.; Ren, S.; Sun, J. Deep Residual Learning for Image Recognition. arXiv 2015, arXiv:151203385. [Google Scholar]
  45. Szegedy, C.; Ioffe, S.; Vanhoucke, V.; Alemi, A. Inception-v4, Inception-ResNet and the Impact of Residual Connections on Learning. arXiv 2016, arXiv:160207261. [Google Scholar]
  46. Szegedy, C.; Liu, W.; Jia, Y.; Sermanet, P.; Reed, S.; Anguelov, D.; Erhan, D.; Vanhoucke, V.; Rabinovich, A. Going Deeper with Convolutions. arXiv 2014, arXiv:14094842. [Google Scholar]
  47. Alom, M.Z.; Taha, T.M.; Yakopcic, C.; Westberg, S.; Sidike, P.; Nasrin, M.S.; Van Esesn, B.C.; Awwal, A.A.S.; Asari, V.K. The History Began from AlexNet: A Comprehensive Survey on Deep Learning Approaches. arXiv 2018, arXiv:180301164. [Google Scholar]
  48. Hinton, G.E. Rectified linear units improve restricted boltzmann machines vinod nair. In Proceedings of the ICML’10 Proceedings of the 27th International Conference on International Conference on Machine Learning, Haifa, Israel, 21–24 June 2010. [Google Scholar]
  49. Ioffe, S.; Szegedy, C. Batch Normalization: Accelerating Deep Network Training by Reducing Internal Covariate Shift. arXiv 2015, arXiv:150203167. [Google Scholar]
  50. Krizhevsky, A.; Sutskever, I.; Hinton, G.E. ImageNet classification with deep convolutional neural networks. In Proceedings of the International Conference on Neural Information Processing Systems, Lake Tahoe, NV, USA, 3–6 December 2012; pp. 1097–1105. [Google Scholar]
  51. Lee, Y.; Kim, H.; Park, E.; Cui, X.; Kim, H. Wide-residual-inception networks for real-time object detection. In Proceedings of the 2017 IEEE Intelligent Vehicles Symposium (IV), Redondo Beach, CA, USA, 11–14 June 2017; pp. 758–764. [Google Scholar]
  52. Belgiu, M.; Drăguţ, L. Random forest in remote sensing: A review of applications and future directions. ISPRS J. Photogramm. Remote Sens. 2016, 114, 24–31. [Google Scholar] [CrossRef]
  53. Kingma, D.P.; Ba, J. Adam: A Method for Stochastic Optimization. arXiv 2014, arXiv:1412.6980. [Google Scholar]
  54. de Boer, P.-T.; Kroese, D.; Mannor, S.; Rubinstein, R.Y. A Tutorial on the Cross-Entropy Method. Ann. Oper. Res. 2005, 134, 19–67. [Google Scholar] [CrossRef]
  55. LeCun, Y.; Bottou, L.; Bengio, Y.; Haffner, P. Gradient-based learning applied to document recognition. Proc. IEEE 1998, 86, 2278–2324. [Google Scholar] [CrossRef] [Green Version]
  56. ImageNet Large Scale Visual Recognition Competition 2012 (ILSVRC2012). Available online: http://image-net.org/challenges/LSVRC/2012/index (accessed on 20 February 2019).
  57. Zagoruyko, S.; Komodakis, N. Wide Residual Networks. arXiv 2016, arXiv:1605.07146. [Google Scholar] [Green Version]
  58. Hamida, A.B.; Benoit, A.; Lambert, P.; Amar, C.B. 3-D Deep Learning Approach for Remote Sensing Image Classification. IEEE Trans. Geosci. Remote Sens. 2018, 56, 4420–4434. [Google Scholar] [CrossRef] [Green Version]
  59. Bernabe, S.; Marpu, P.R.; Plaza, A.; Mura, M.D.; Benediktsson, J.A. Spectral–Spatial Classification of Multispectral Images Using Kernel Feature Space Representation. IEEE Geosci. Remote Sens. Lett. 2014, 11, 288–292. [Google Scholar] [CrossRef]
  60. Shi, Y.; Huang, W.; Luo, J.; Huang, L.; Zhou, X. Detection and discrimination of pests and diseases in winter wheat based on spectral indices and kernel discriminant analysis. Comput. Electron. Agric. 2017, 141, 171–180. [Google Scholar] [CrossRef]
  61. Mahlein, A.-K.; Rumpf, T.; Welke, P.; Dehne, H.-W.; Plümer, L.; Steiner, U.; Oerke, E.-C. Development of spectral indices for detecting and identifying plant diseases. Remote Sens. Environ. 2013, 128, 21–30. [Google Scholar] [CrossRef]
Figure 1. Study area: (a) the location of Hebei Province (dark grey region in the map); (b) the location of Langfang (dark grey region), Hebei Province, and the location of data collection (red star); (c) an image of winter wheat fields captured with UAVs. Four plots of winter wheat are identified with rectangular borders, two yellow rust plots within red rectangular borders and two healthy wheat plots within green rectangular borders.
Remotesensing 11 01554 g001
Figure 2. Schematic of identifying yellow rust areas in winter wheat fields with four steps: (1) Data preprocessing, (2) Feature extraction and classification, (3) Post processing and (4) Result output.
Remotesensing 11 01554 g002
Figure 3. Schematic of image segmentation process via a sliding-window method. Each of the segmented blocks with a size of 64 × 64 × 125 was labelled as rust area, healthy area or other.
Remotesensing 11 01554 g003
Figure 4. Schematic of the architecture of the proposed DCNN model for yellow rust detection.
Remotesensing 11 01554 g004
Figure 5. Architectures of (a) the convolution layer; (b) Resnet block; (c) Inception Block, and (d) Inception-Resnet Block.
Remotesensing 11 01554 g005
Figure 6. Effect of the number of Inception-Resnet blocks in the proposed DCNN model on classification accuracy.
Remotesensing 11 01554 g006
Figure 7. An accuracy comparison between the model with Inception-Resnet blocks and the model with Resnet blocks.
Remotesensing 11 01554 g007
Figure 8. The classification accuracy and confusion matrix of the random forest classification method and the proposed DCNN model on a test dataset of 5000 blocks.
Remotesensing 11 01554 g008
Figure 9. The overall accuracy of the proposed DCNN model for rust detection in five different stages covering the whole growing season of winter wheat. Hyperspectral data for evaluation were captured on 25 April, 4 May, 8 May, 15 May and 18 May 2018, respectively.
Remotesensing 11 01554 g009
Figure 10. The spectrum profiles of randomly chosen 1000 pixels in rust, healthy and other (bare soil) regions of the images captured on the 18 May 2018. The white curve represents the mean value of all pixels.
Remotesensing 11 01554 g010
Figure 11. The rust detection mapping results of two plots from the random forest (RF) model and the proposed DCNN method: (a) original images of rust and healthy wheat plots in RGB colour; (b) the rust detection results of random forest model overlaid on original images; (c) the rust detection results of the DCNN model overlaid on the original images. The label in red colour denotes the detection results of rust infected areas.
Remotesensing 11 01554 g011
Table 1. The performance of the proposed model at different observation times across the wheat growing season.
Observation TimePhenological StageCategoryPrecisionRecallF1 Score
2018/4/25 Rust0.70.680.69
JointingHealthy0.70.690.7
Other0.9710.98
2018/5/4 Rust0.720.810.76
FloweringHealthy0.820.710.77
Other0.950.950.95
2018/5/8 Rust0.790.760.77
HeadingHealthy0.770.780.78
Other0.9810.99
2018/5/15 Rust0.850.840.85
GroutingHealthy0.850.860.85
Other0.990.990.99
2018/5/18 Rust0.850.850.85
GroutingHealthy0.860.860.86
Other10.991

