Abstract
On August 2016, the Milena (E14) and Doresa (E18) satellites started to broadcast ephemeris in navigation message for testing purposes. As the Galileo constellation is not yet complete. It is very important to have two more satellites available since the position accuracy increases as the number of visible satellites increases. In this article, we examine how the inclusion of the Milena (E14) and Doresa (E18) satellites impacts the position accuracy. The analysis was carried out on 20 days of 1-Hz observations collected by a receiver placed in YEL2IGS (International GNSS service) station. Two different scenarios are considered: the first excludes the measurements coming from the analyzed satellites, while the second one includes them. The analysis was conducted by using a suitable software tool developed in the MATLAB® environment able to compute satellites position from both the broadcast and precise ephemerides, to assess DOP (Dilution Of Precision) parameters and to compute single-point positioning for all Galileo frequencies. The analyses are conducted by using both broadcast and precise ephemeris. The inclusion of the two satellites improves the system availability, varying it from 94.1–97.94%, the DOP parameters, and the percentages of achieved positioning solutions by about 5% regardless of the frequency used. Nevertheless, in the positioning domain, when the broadcast ephemerides are used, the inclusion of the satellites worsens both the horizontal and vertical accuracy of the solution. The deterioration of the horizontal accuracy goes from 0.17 m with E5a frequency measurements to 0.74 m with E1 measurements. The reduction of vertical accuracy goes from 0.68 m for E5a to 1.2 m for E1 measurements. However, if precise ephemerides are used, both the horizontal and the vertical accuracy remain stable, actually for the E5b frequency, the DRMS (Distance Root Mean Squared) improves by almost 0.5 m. The results achieved show that the real drawback to overcome is related to the quality of broadcast ephemeris as, when precise ephemeris are used, the number of solutions achieved is increased by about 5% with an accuracy similar to that obtained when the satellites are excluded.
1. Introduction
On 15 December 2016, with 18 satellites in orbit, Europe’s satellite navigation system Galileo was declared operational and started offering its initial services to public authorities, businesses, and citizens. When Galileo will be fully operational, the constellation will consist of 24 satellites plus spares in Medium Earth Orbit (MEO) at an altitude of 23,222 km. Eight active satellites will occupy each of three orbital planes inclined at an angle of 56 degrees to the Equator. The satellites will be spread evenly around each plane and will take about 14 h to orbit the Earth. Two further satellites in each plane will be a spare on stand-by should any operational satellite fail.
Currently (April 2019), Galileo is in its Full Operational Capability (FOC) phase; 22 FOC satellites were launched up to the start of 2019 in addition to the four IOV (In-Orbit Validation) launched between 2011 and 2012. The navigation signals of these satellites are transmitted on five frequencies, E1, E5a, E5b, E5, and E6. Only three IOV satellites are operational because E20 was declared unavailable since 27 May 2014 [1] when a power anomaly led the E5 and E6 signals to a permanent loss of power. After this failure, all IOV satellites were backed-off, and thus, their signals have less transmitted power than the FOC satellites. Nineteen FOC satellites were declared operational; one (E22) was removed from active service on December 2017 for constellation management purposes, while the first two FOC satellites, Doresa (E14) and Milena (E18), were under test. These two satellites were launched on 22 August 2014 at 9:27 local time in French Guiana by a Soyuz STrocket. The two satellites were left in a non-nominal highly-elliptical orbit characterized by an apogee of 25,900 km and a perigee of 13,713 km, with an inclination with respect to the Equator of 49.69 degrees instead of planned circular medium-Earth orbits at an altitude of 23,222 km with an inclination of 55.04 degrees. The wrong injection orbits made the two satellites not usable for navigation missions; thus, the European Space Agency (ESA) planned a rescue mission to make the two satellites usable [2,3]. Starting from November 2014–February 2015, the satellites made a series of maneuvers in order to raise the low point of their orbits by 3500 km and making their orbits more circular. Satellites in new orbits overfly the same location on the ground every 20 days. This is different from a normal Galileo repeat pattern of 10 days; however, it makes possible a synchronization of their ground tracks with the rest of the Galileo constellation. Thus, the revised orbit (reported in Table 1) allowed ESA to switch on the satellites’ navigation payload. On 5 August 2016, beginning at 00:00 UTC, GSAT0201 (E18) and GSAT0202 (E14) started broadcasting navigation messages for testing purposes (for details, see the notice advisory to Galileo users https://www.gsc-europa.eu/notice-advisory-to-galileo-users-nagu-2016030).

Table 1.
Galileo satellite orbital parameters. IOV, In-Orbit Validation; FOC, Full Operational Capability.
At the end of the mission, the European Space Agency on 8 October 2016 requested to provide feedback on usage of these satellites (http://galileognss.eu/tag/sat-6/).
GNSS errors can be divided into errors that can be corrected by using differential techniques or not. The ephemeris error belongs to the first group [4], while the multipath error to the second. Therefore, before proceeding to the analysis performed in the positioning domain, the authors already analyzed these satellites considering these two aspects. They analyzed Milena (E14) and Doresa (E18) broadcast ephemeris in [5,6] and their code multipath error [7] by using the short time Fourier transform and wavelet analysis [8] showing that multipath performance of Milena (E14) and Doresa (E18) satellites are the same as the other Galileo FOC satellites also when a mobile phone is used as the receiver [9]. In 2017, Zaminpardaz and Teunissen analyzed Galileo E5’s RTK performance [10]. They showed that instantaneous ambiguity resolution is possible if a multipath correction is done, but in their analysis, they excluded both the Milena (E14) and Doresa (E18) satellites; Li et al. [11] tested the performance of a single-frequency L5/E5a array-aided state-space RTK algorithm including in the solution also the Doresa (E18) satellite. In 2018, Paziewski et al. [12] investigated the potential use of the Milena (E14) and Doresa (E18) satellites for positioning purposes. They evaluated the applicability of these satellites to precise GNSS positioning focusing on relative kinematic positioning as an instantaneous solution in multi-baseline mode. Their study revealed that the Milena (E14) and Doresa (E18) satellites were fully usable in most geodetic surveying when precise ephemerides of the satellites are provided. Wang et al. [13] studied the formal and the empirical ambiguity success rates for long baselines with different frequency combinations of Galileo signals including both the Milena (E14) and Doresa (E18) satellites.
Actually, it is very important to have two additional satellites available since currently, the Galileo system is not yet complete and the accuracy in the position increases as the number of visible satellites increases. Indeed, an in-depth study on the use of these satellites in the single-point positioning domain has not yet been carried out, and this prompted us to undertake this study.
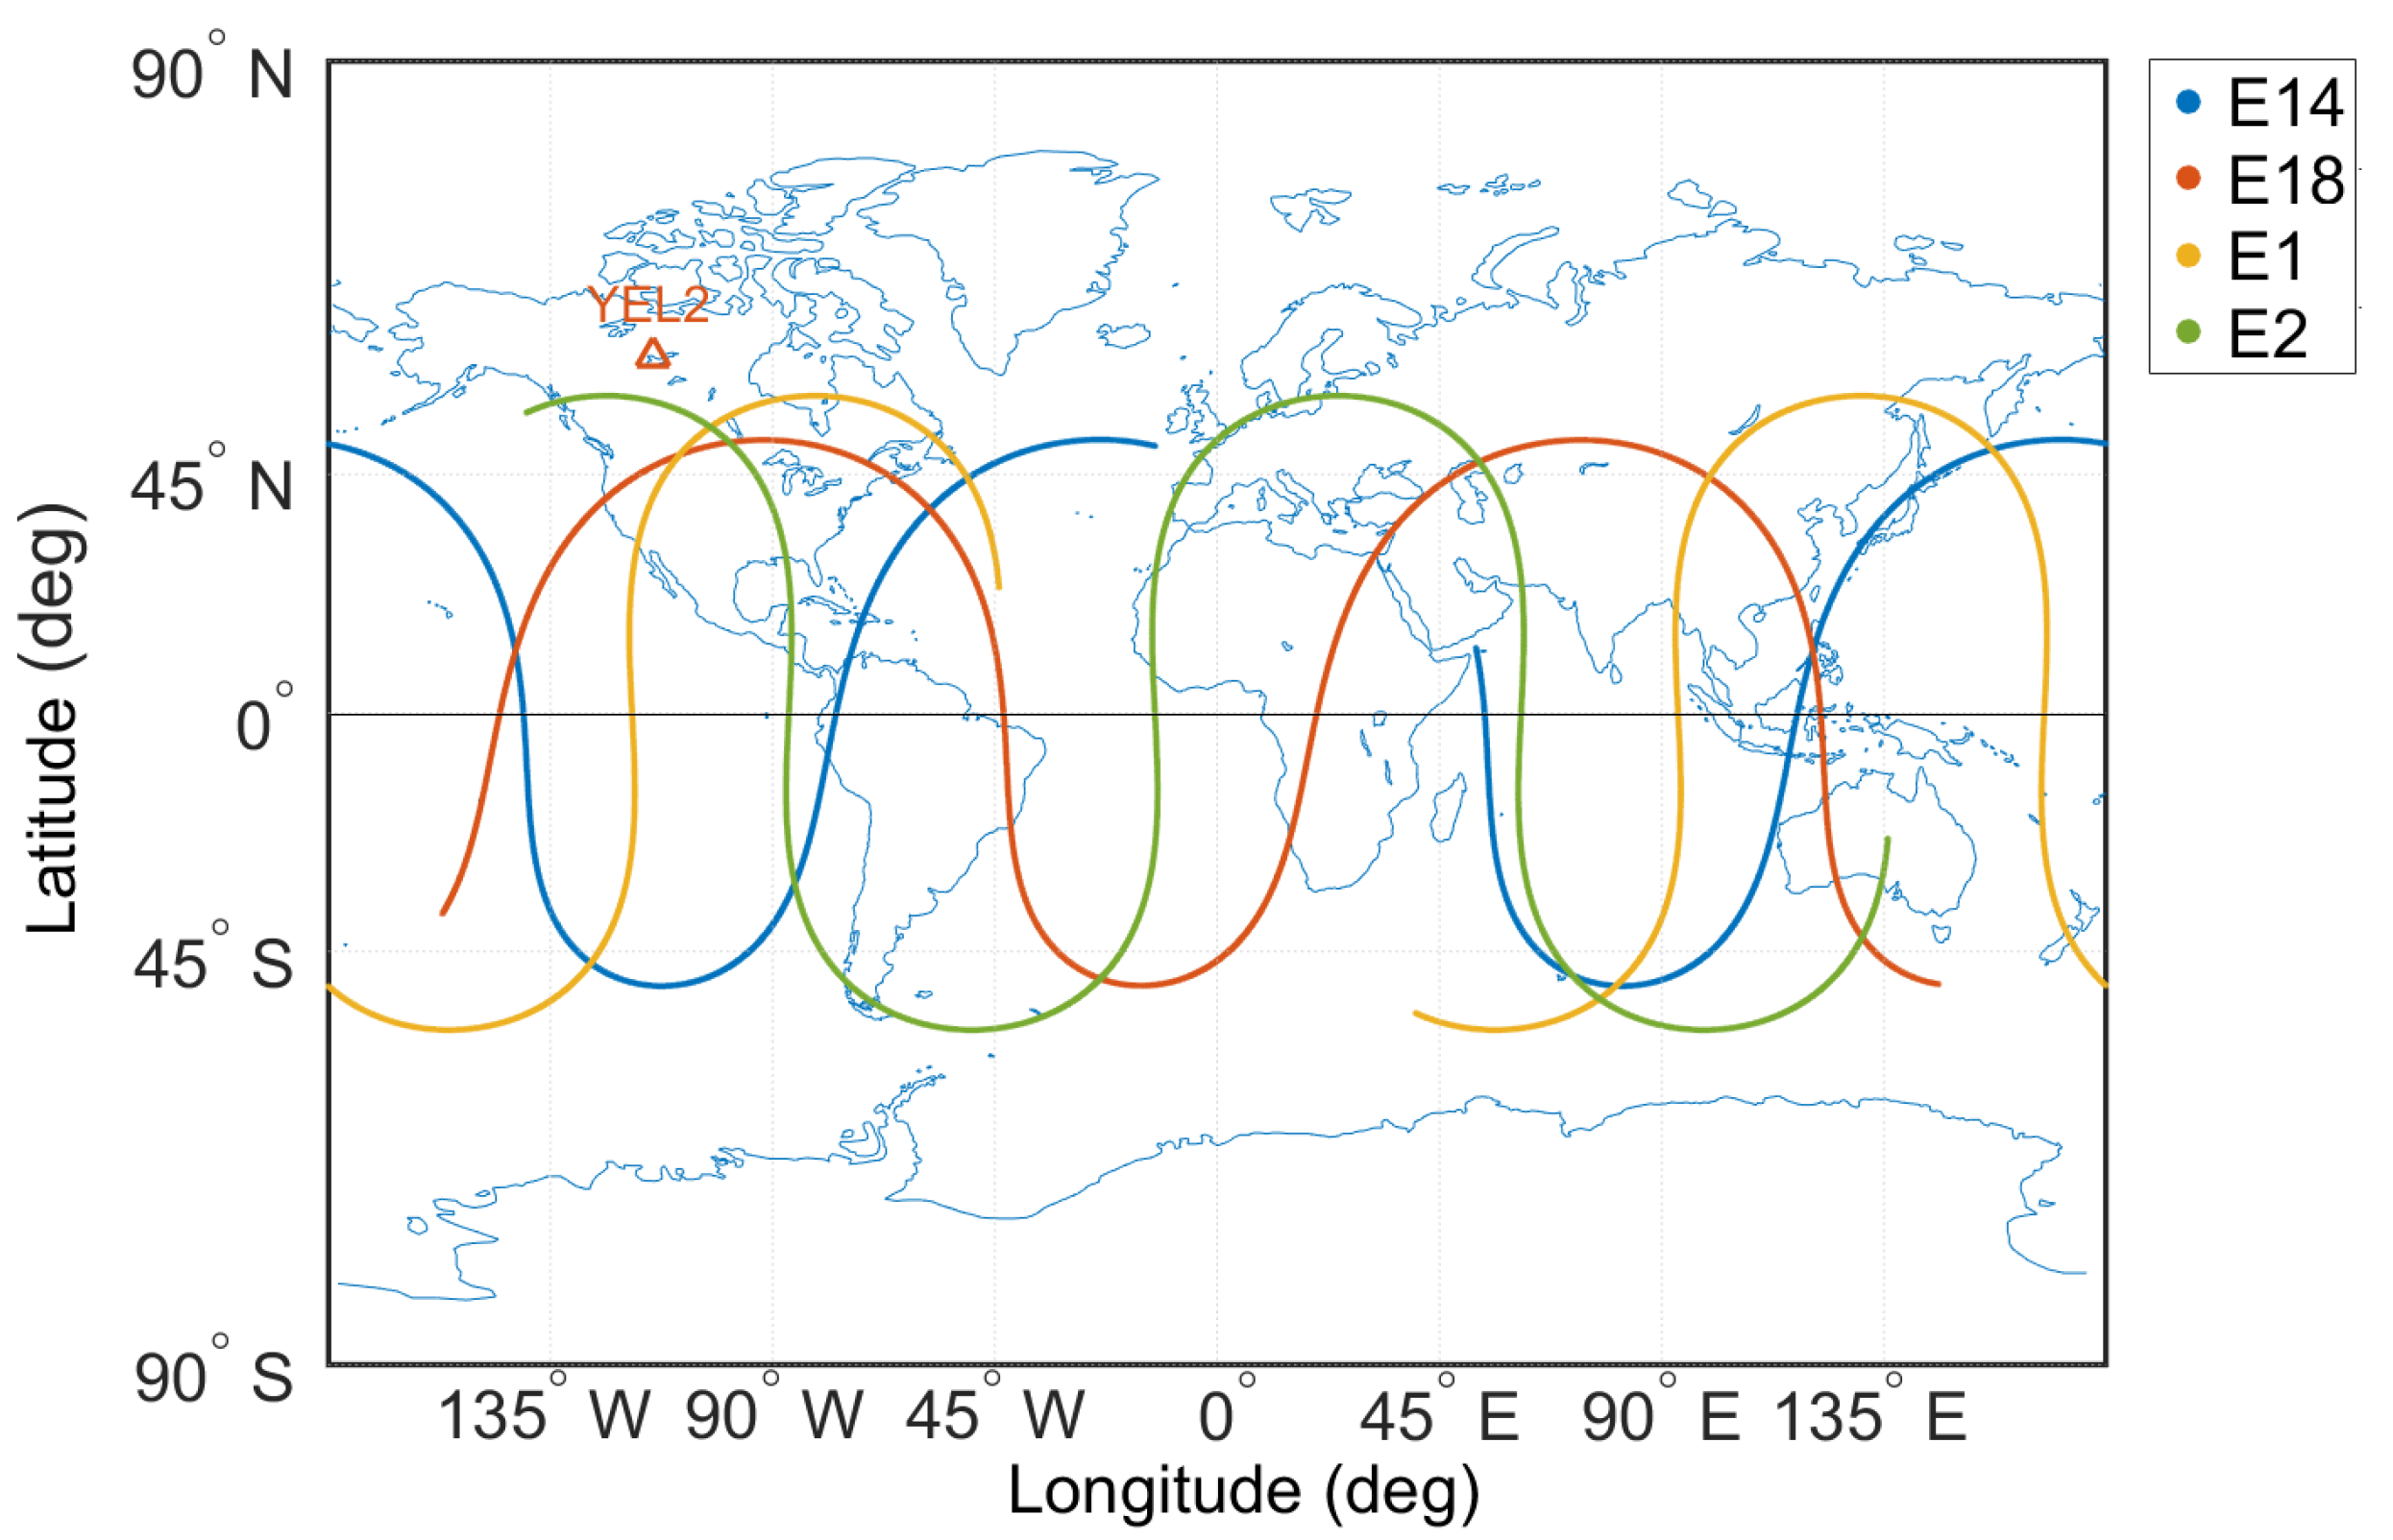
Figure 1 shows the ground track of Milena (E14) plotted in blue, Doresa (E18) plotted in red, E1 plotted in yellow, and E2 plotted in green, over a period of 24 h on DOY 52 2018. From the figure, it can be noted that the maximum latitude of the Milena (E14) and Doresa (E18) satellites is smaller than that of the other two Galileo satellites depicted. This is due to the lower inclination of the Milena (E14) and Doresa (E18) orbits of 49.850 degrees with respect to the 56.0 degrees of the other Galileo satellites; indeed the maximum latitude of a satellite ground track is equal to the orbital inclination angle. For an ideal Keplerian orbit, the orbital period T is set by:
where a is the semi-major axis of the orbit and is the product of the universal gravitational constant and the mass of the Earth. Thus, the Galileo satellites in nominal orbit have an orbital period of about 14.08 h. The Milena (E14) and Doresa (E18) satellites instead, due to the lower semi-major axis (see Table 1) of the orbit, show an orbital period of 12.97 h. The effects of the different orbital periods can be noticed by looking at the figure: the nodes (i.e., points where the trace intersects the Equator line) are unequally spaced in the tracks of the Milena and Doresa satellites with respect to the other FOC satellites represented (Sosnica et al. [14]).
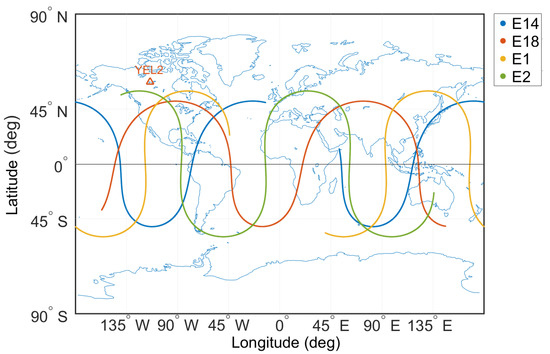
Figure 1.
Ground tracks of the Milena (E14), Doresa (E18), E1, and E2 Galileo satellites depicted in blue, red, yellow, and green, respectively, on DOY 52 2018. In the figure, for better readability, only four satellites are shown.
The main objective of this paper is the evaluation of the Milena (E14) and Doresa (E18) satellites’ performance in the single-point positioning domain for the E1, E5a, E5b, and E5 signals. In order to provide a good indication of the positioning performance of elliptical satellites, we first evaluated the availability in terms of the number of visible satellites, of the Dilution of Precision parameters (DOP), and the percentage of time span over which the position solutions can be acquired. After this analysis, the single-point positioning solution was calculated every second for the E1, E5a, E5b, and E5 frequencies by using first broadcast ephemerides and then precise ones. The above mentioned analysis was carried out on 20 days of 1-Hz observations collected by a receiver placed in YEL2IGS (International GNSS service) station located in Yellowknife Geophysical Observatory, Northwest Territories, Canada. This station located at high latitude also allowed us to test the accuracy of the Galileo system, as ESA declares that the Galileo navigation signals will provide good coverage even at latitudes up to 75 degrees north [15]. To achieve this goal, the specifications defined in the Galileo Signal in Space Interface Control Document (ICD) were used to develop a suitable software tool in the MATLAB® environment. The tool is able to compute satellites’ position from both the broadcast and precise ephemerides, to assess GDOP (Geometric Dilution Of Precision), PDOP (Position Dilution Of Precision), HDOP (Horizontal Dilution Of Precision), and VDOP (Vertical Dilution Of Precision) values and to compute single-point positioning on all Galileo frequencies.
2. Materials and Methods
2.1. Methodology
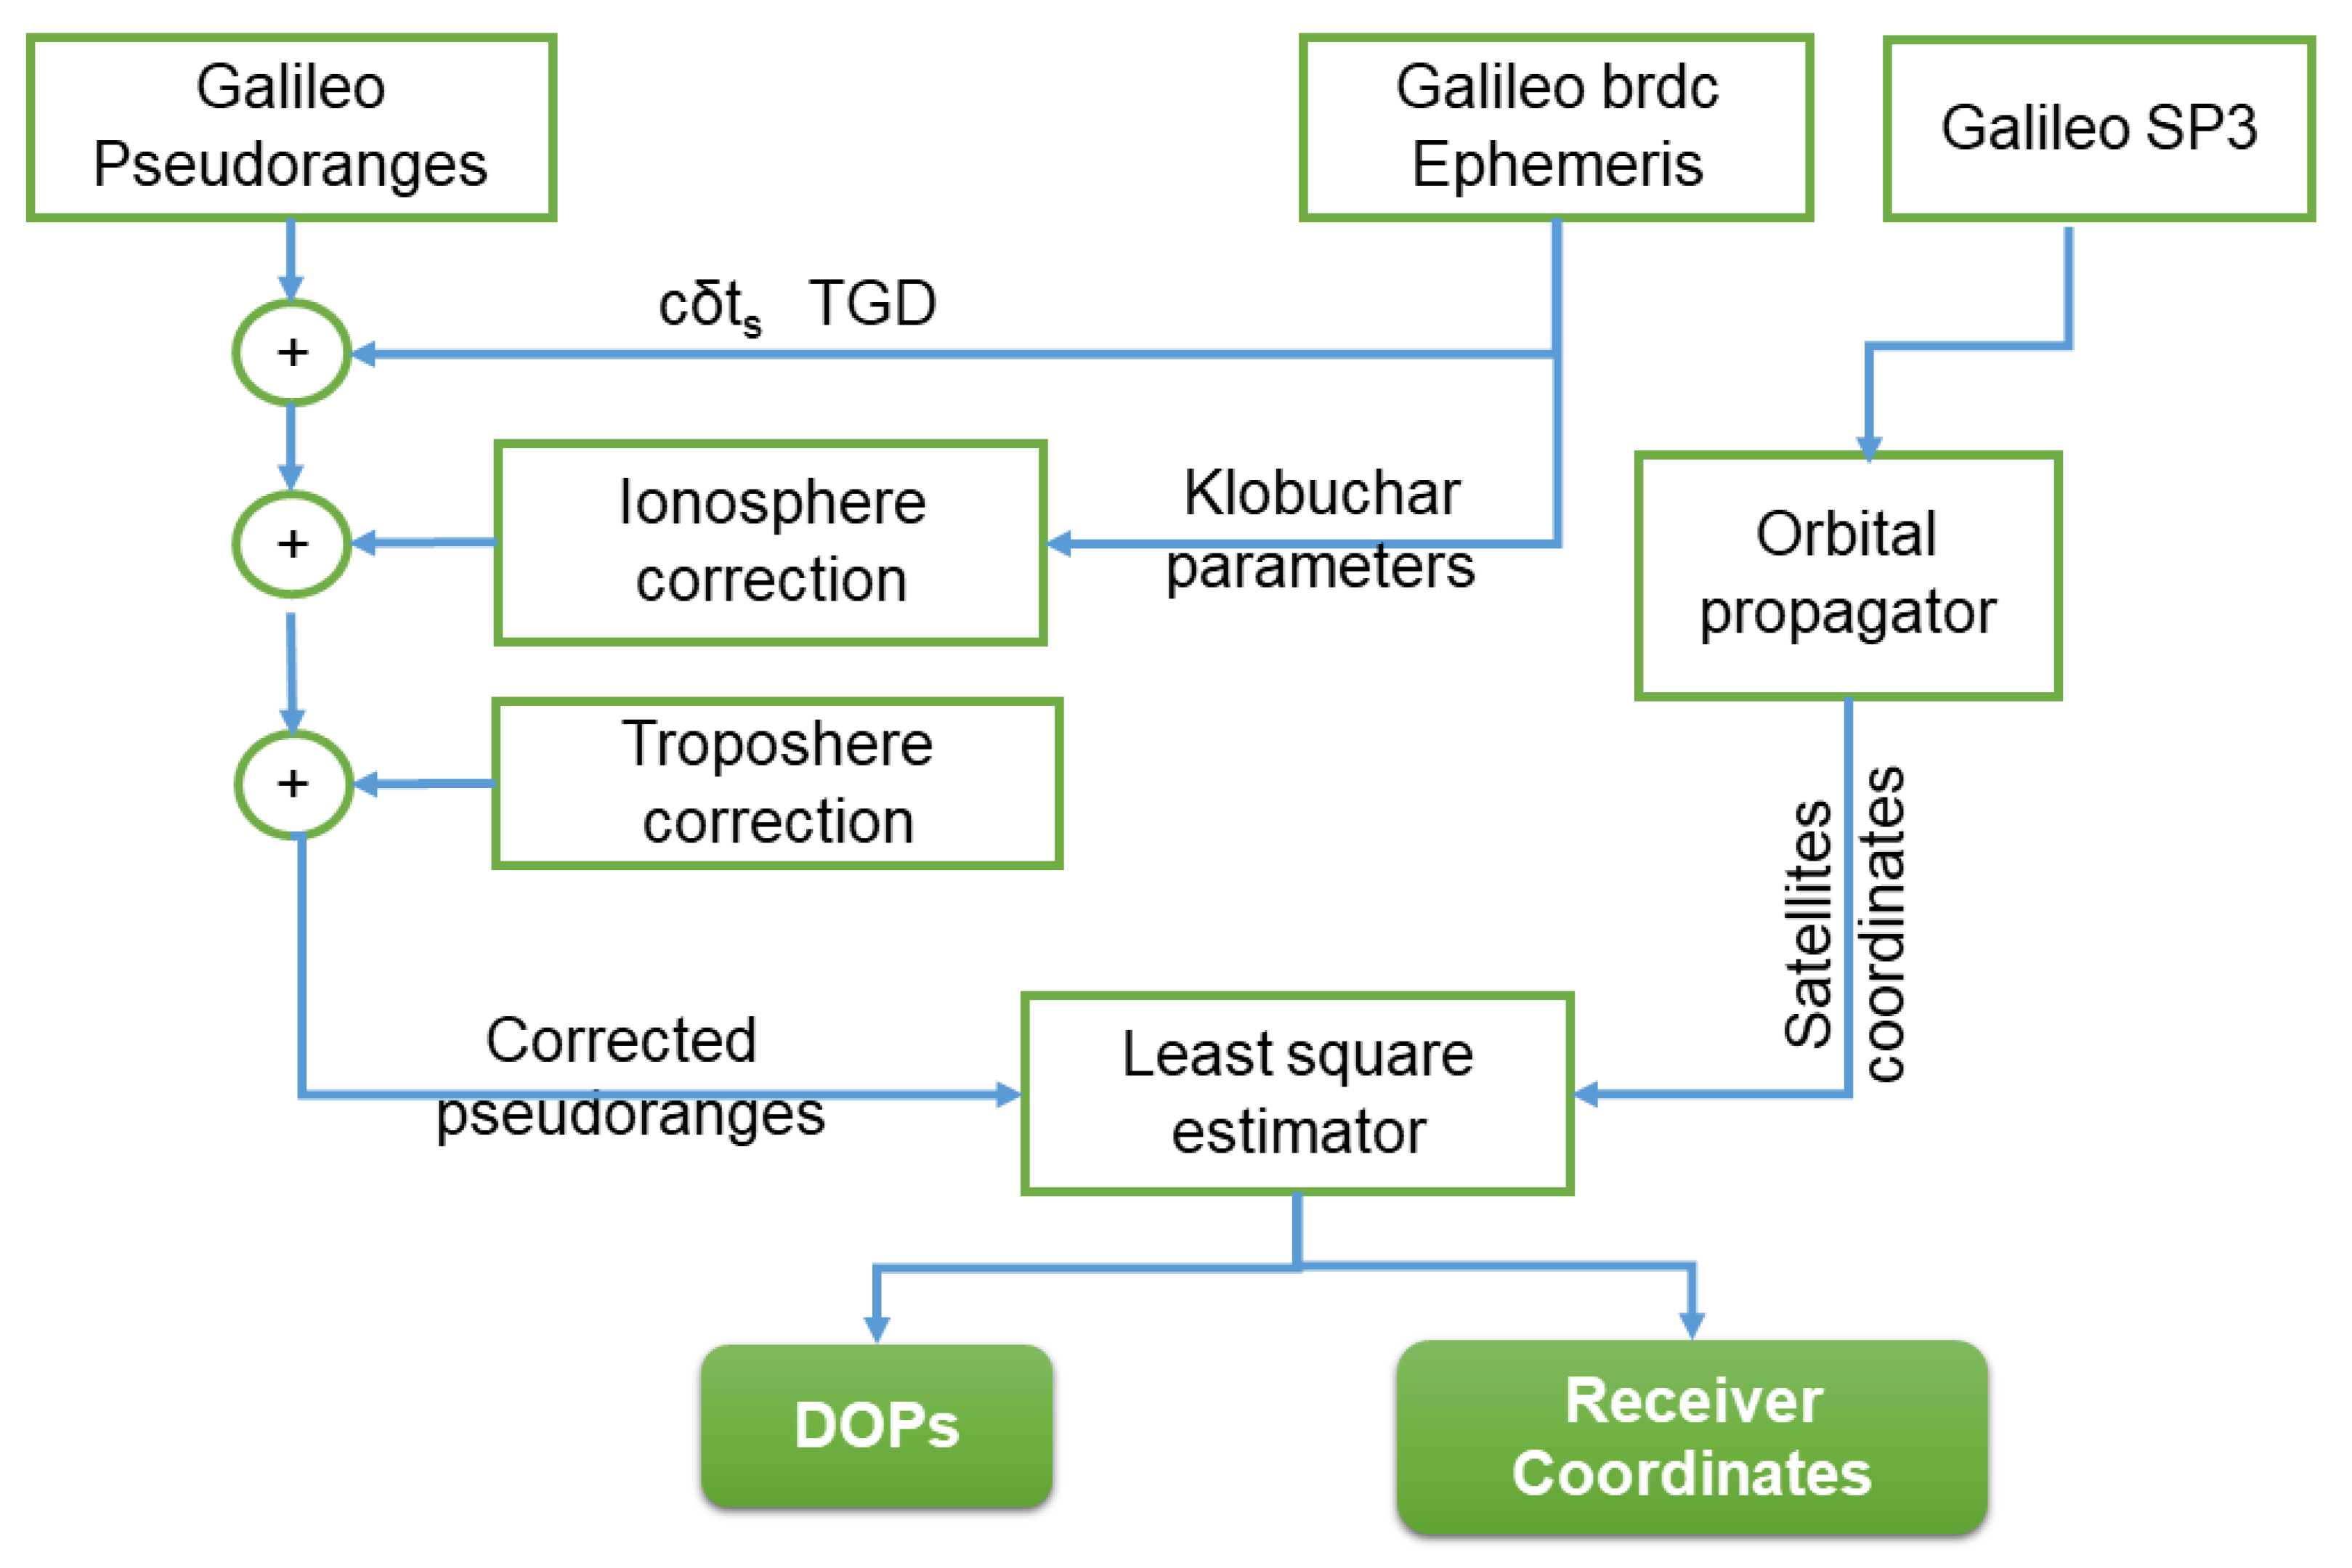
The methodology used to achieve single-point positioning with GNSS pseudoranges is well known and widely described [16,17]. However, a brief recall is provided here to describe the algorithms used to implement the software developed according to flowchart shown in Figure 2.
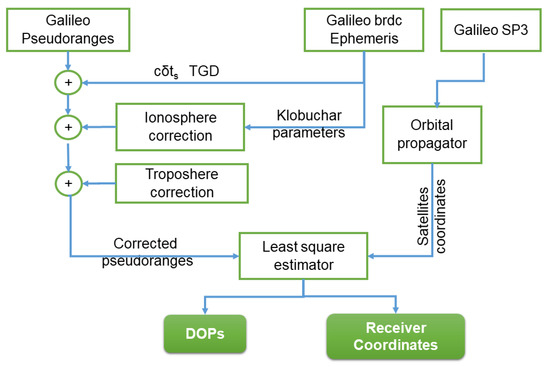
Figure 2.
Flowchart representation of the algorithm developed for the determination of receiver position and Dilution Of Precision (DOP) parameters; TGD stands for Time Group Delay, while brdc for broadcast.
GNSS receivers provide four types of measurements for each frequency: pseudorange, Doppler, carrier phase, and carrier-to-noise. The first three measurements are used to achieve receiver position [7], while the carrier-to-noise density provides an indication of the accuracy of the tracked GNSS satellite observations and the noise density as seen by the receiver’s front-end [9]. It also indicates the level of noise present in the measurements. The pseudorange measurement P is expressed by the following relation:
where is the geometrical distance, is the receiver clock offset, is the satellite clock offset including the time group delay Tgd, T is the tropospheric delay, I is the ionospheric delay, is the code multipath, is the delay due to the Sagnac effect, and comprises the receiver hardware delays and receiver noise of the code measurements. Satellite clock offset correction parameters are transmitted in navigation data, while ionosphere and troposphere delays were estimated by using the Klobuchar and Hopfield models, respectively. To achieve the receiver coordinates and offset, at least four equations that express the distance between unknown receiver position and the known ith satellite position are necessary; they can be linearized around an a priori value obtaining:
where: (n x 1) is the difference vector between the n raw pseudoranges and a priori information (with n number of Galileo observations), is the design matrix, is the state vector, and is the residuals vector, which includes all unmodeled errors (measurement noise, multipath, and so on).
The explicit forms of H and are the following:
where n is the number of Galileo simultaneous measurements, the subscript indicates the ith Galileo satellite used, denotes the approximate position of the receiver, denotes the position of the the ith Galileo satellite, is the approximate a priori range between the ith Galileo satellite and receiver, , , are the differences between “true” and approximate receiver X, Y, and Z coordinates, and is the receiver clock offset relative to the time scale of the Galileo system.
The set of Equations (3) is solved for by means of the Weighted Least Squares (WLS) method, and the solution is given by the equation:
where: is the weighting matrix. It can be set as the inverse of the measurement co-variance matrix R, weighting the accurate measurements more and the noisy ones less. Here, all pseudorange errors were considered independent, thus the co-variance matrix was set equal to the diagonal matrix with the weights calculated as a function of the satellite elevation angle.
The weighted least squares estimation was used to update the a priori value:
where is the updated least squares solution. In order to find the optimal solution, the process was iterated. During the software testing period, we found that residuals began to remain stable after the fifth iteration; thus, we stopped the process after five iterations. The dimensionless GDOP parameter represents the geometry contribution on positioning accuracy, and it is considered a figure of merit for Galileo system geometry analysis. Starting from Q matrix:
The elements of the matrix Q are a function of the satellite and receiver geometry only. The GDOP parameter is defined in Equation (8):
Low GDOP values coincide with good geometries, while high values to poor geometries; satellite geometry with GDOP values up to 3 are considered excellent, while GDOP up to 6 are good. A GDOP value of 8 is considered the limit for a moderate geometry. Thus, GDOP takes into account the quality of overall solution, but we may prefer to look at the specific components such as the three-dimensional receiver position coordinates (PDOP), the horizontal coordinates (HDOP), the vertical coordinate (VDOP), or the clock offset (TDOP) [18], whose expressions are reported in Equations (9)–(12), respectively.
We developed a suitable software tool in the MATLAB® environment able to compute the single-point positioning solution using Galileo measurements on the E1, E5a, E5b, and E5 frequencies. The tool is provided with an orbital propagator able to use both transmitted and precise ephemeris in sp3 format. As output, the software provides also the DOP values.
2.2. Experimental Setup
The experiment was carried out on the E1, E5a, E5b, and E5 Galileo signals. In detail, we processed the measurements captured by the YEL2 (Canada) station of the International GNSS Service (IGS) network [19]. It is a low-multipath site in conformity with IGS site guidelines [20]. The experiment was carried out using the RINEX3.0 file of measurements acquired by the LEICA GR10 receiver (E5 filter bandwidth of 51 MHz), fed by the LEIAR25.R3choke ring antenna and the LEITradome. IGS is a voluntary association made up of universities, space agencies, and geodetic agencies whose mission is “to provide the highest-quality GNSS data and products in support of the terrestrial reference frame, Earth rotation, Earth observation and research, positioning, navigation and timing and other applications that benefit society” [19]. IGS products are generated at several Analysis Centers (ACs) with strict quality control and proper weighting, thus having the highest quality and internal consistency. The dataset consists of the data received in the days from 21 February 2018 (DOY 52) to 12 March 2018 (DOY 71). Data were obtained from the Federal Agency for Cartography and Geodesy (BKG) GNSS data center web-site (https://igs.bkg.bund.de/dataandproducts/rinexsearch). It is a regional IGS data center that collects observational and navigational data from several operational centers and stations, maintains a local archive of the data received, and provides on-line access to these data to the user community. We used a dataset of twenty days because the ground track of the Galileo FOC satellites E14 and E18 repeats every 20 sidereal days, and therefore, the Milena (E14) and Doresa (E18) satellites do not reach the whole range of elevations during one single day. All the analyses were carried out by discarding the satellites with an elevation angle lower than 5 degrees and with a Carrier-to-Noise density ratio C/N0 below 30 dB/Hz.
3. Results
As reported in the Introduction, Galileo E20 was declared unavailable since 27 May 2014; thus, it was not been considered in the following analysis.
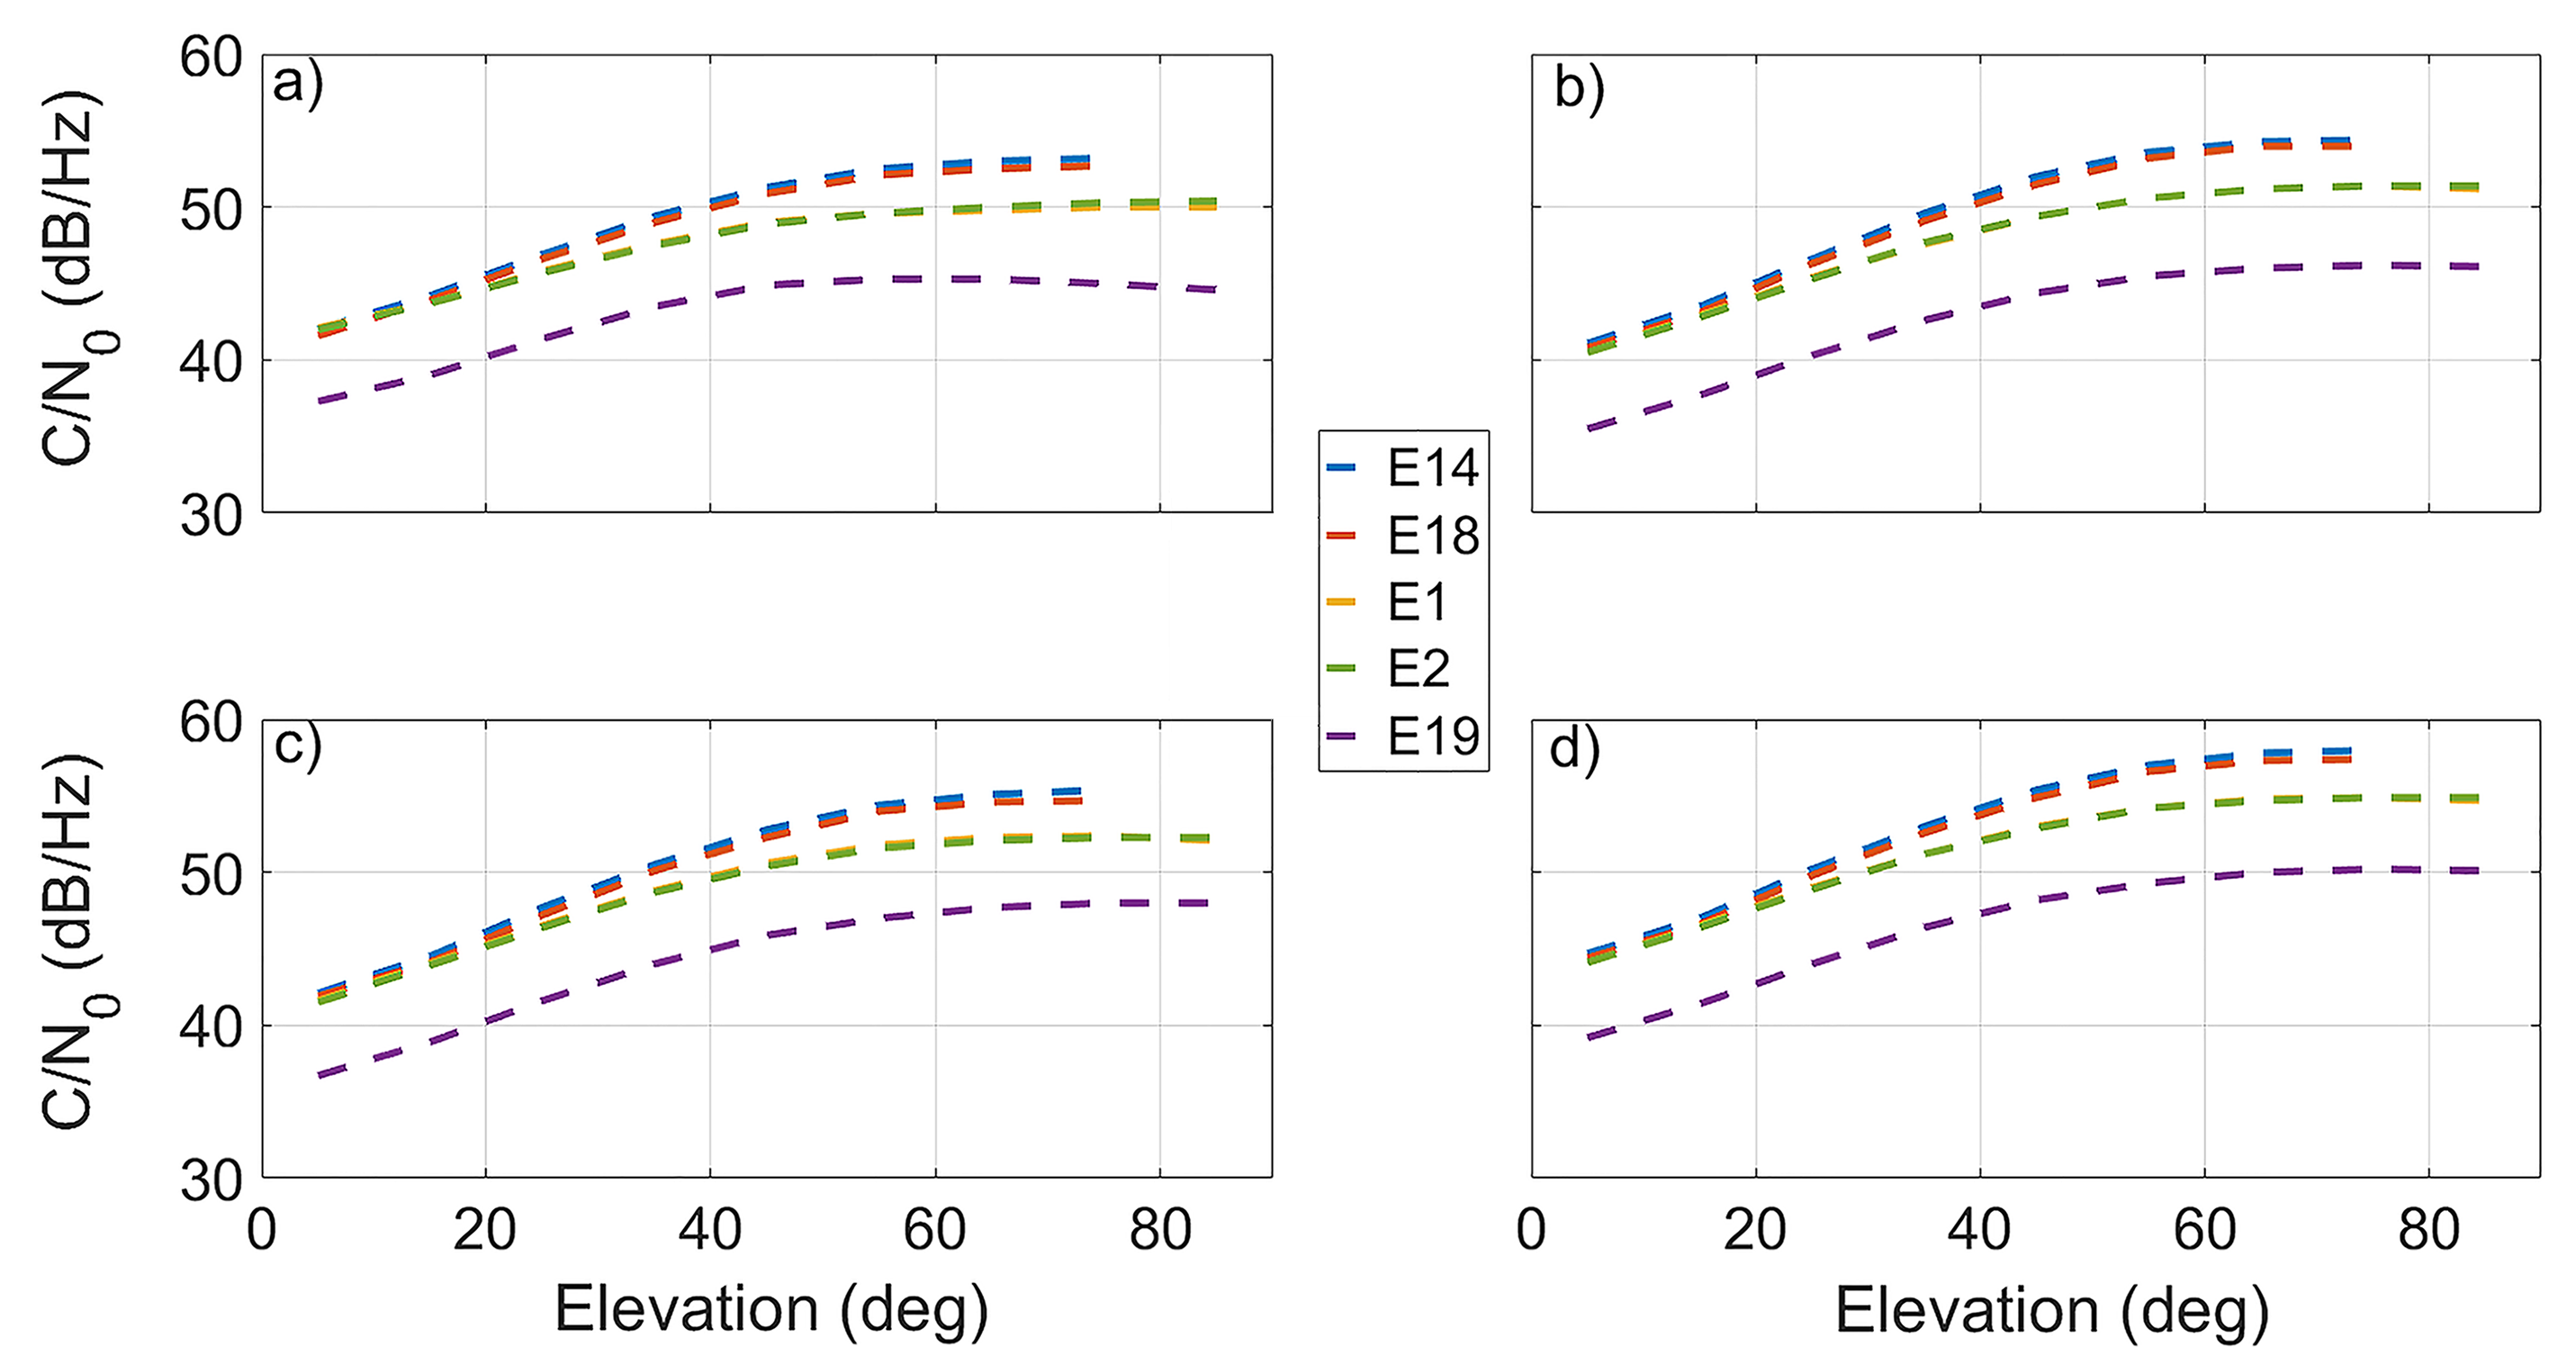
Figure 3 shows the evolution of the Carrier-to-Noise density ratio (C/N0) of the Milena (E14), Doresa (E18), E1, E2, and E19 (IOV) Galileo satellites with respect to satellite elevation angle for the different frequencies E1, E5a, E5b, and E5 depicted in Panels (a)–(d), respectively, during DOYs 52–71 of 2018. Each panel shows the average of C/N0 over elevation bins of 10 degrees. In the figure, the E19 satellite was added as representative of IOV satellites. The signals transmitted by the E19 satellite showed a lower level of C/N0 than those transmitted by the FOC satellites. This occurred because IOV satellites have less transmission power than FOC satellites since 27 May 2014 [1], when a power anomaly on the E20 satellite led the E5 and E6 signals to a permanent loss of power. After this failure, all IOV satellites were backed-off, and thus, their signals have less transmitted power than the FOC satellites. The evolution of the C/N0 of the E14 and E18 satellites is similar to that of the other FOC satellites in the YEL2 site. As expected, the Milena (E14) and Doresa (E18) satellites showed a higher C/N0 with respect to the other FOC satellites, confirming results shown by Paziewski et al. [12]. This behavior is due to lower altitude of Milena (E14) and Doresa (E18) caused by their elliptical orbit.
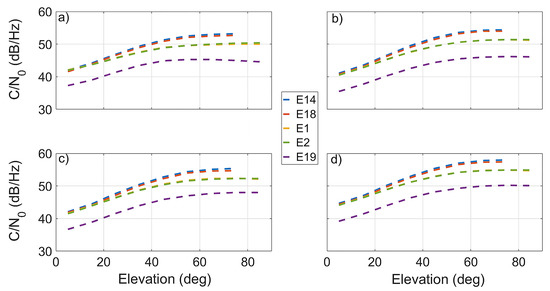
Figure 3.
Carrier-to-Noise density ratio (C/N0) of the Milena (E14), Doresa (E18), E1, E2, and E19 (IOV) Galileo satellites (depicted in blue, red, yellow, green, and purple dotted lines, respectively) on different frequencies as a function of satellite elevation. The E1, E5a, E5b, and E5 frequencies are reported in (a–d), respectively. Each panel shows the average of C/N0 over elevation bins of 10 degrees. Data plotted refer to DOYs 52–71 of 2018.
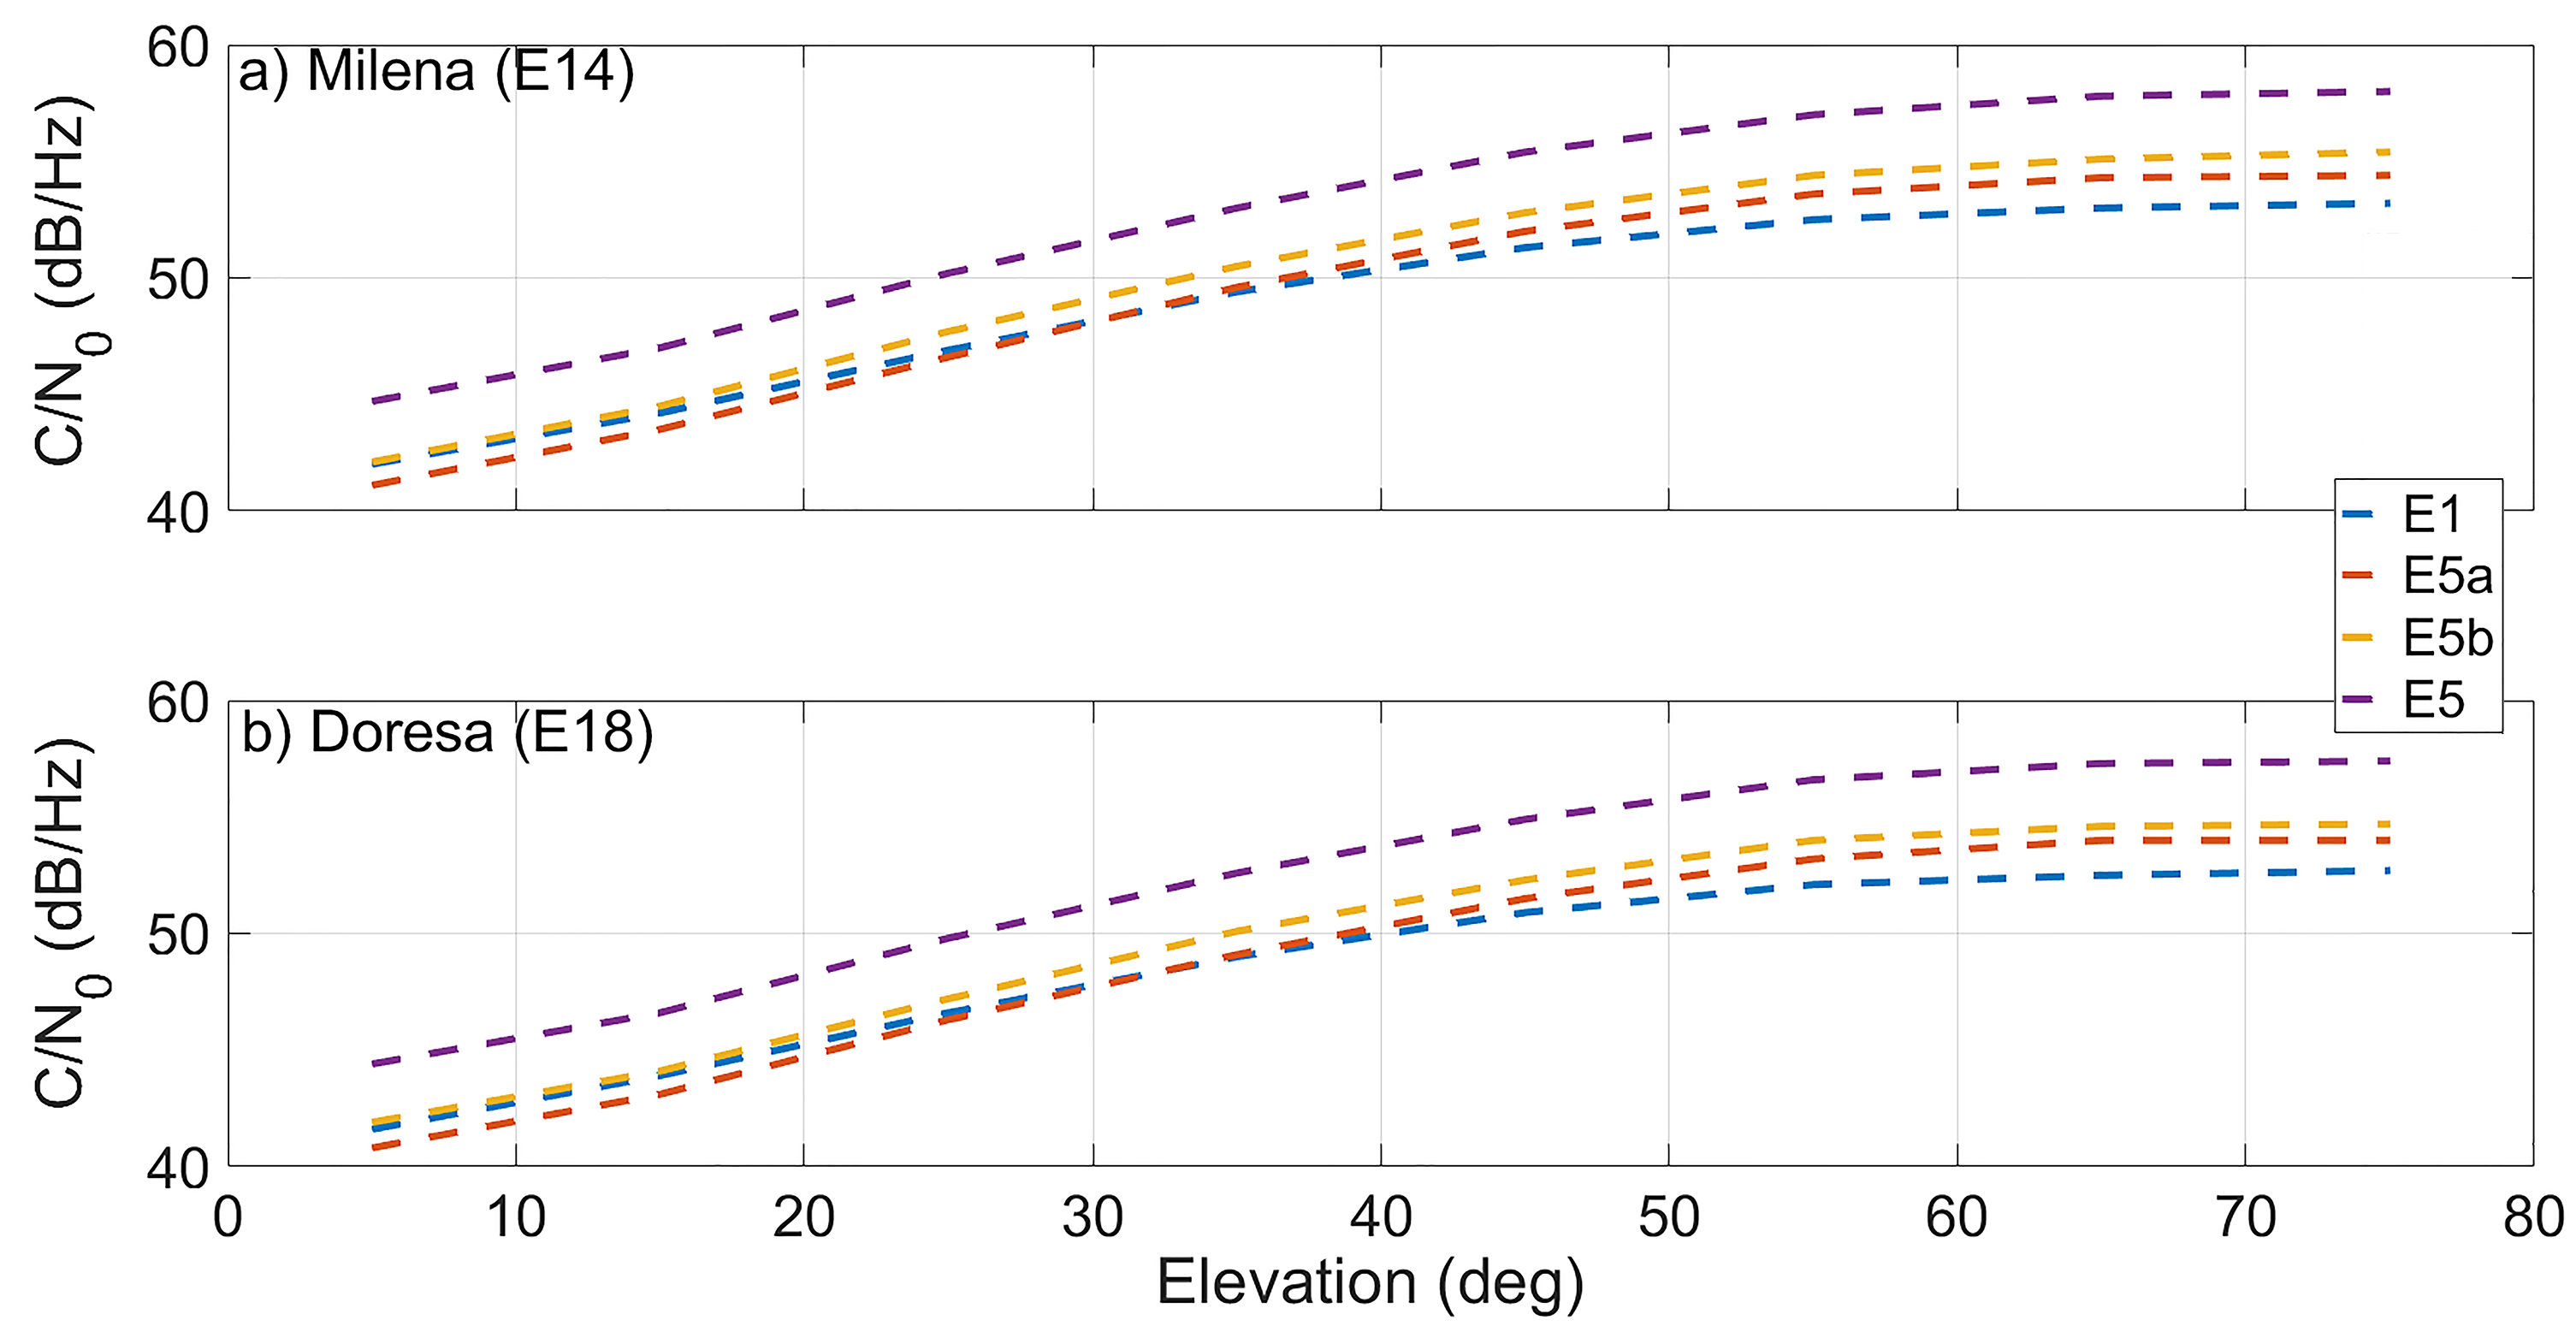
Figure 4 shows the comparison between the carrier-to-noise density ratio (C/N0) at the different frequencies of the Milena (E14) and Doresa (E18) satellites. Panel (a) is related to the Milena (E14) satellite, while Panel (b) to Doresa (E18). In both panels, the E1, E5a, E5b, and E5 signals are plotted in blue, red, yellow, and purple, respectively. The E1 signal had a C/N0 higher than the E5a signal up to 30 degrees. Between 30 degrees and 35 degrees, the two signals showed the same C/N0, and then, starting from 40 degrees, E5a had a C/N0 higher than the E1 signal. Results reported in figure confirm the results reported by Zaminpardaz [10] with the exception of the E1 and the E5a signals at low elevation angles.
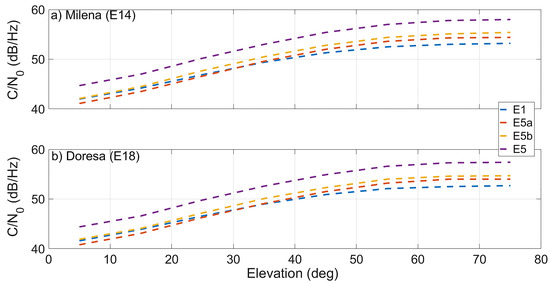
Figure 4.
Carrier-to-noise density ratio (C/N0) of the Milena (E14) and Doresa (E18) satellites on different frequencies, E1 (blue), E5a (red), E5b (yellow), and E5 (purple), as a function of satellite elevation plotted in (a,b) respectively.
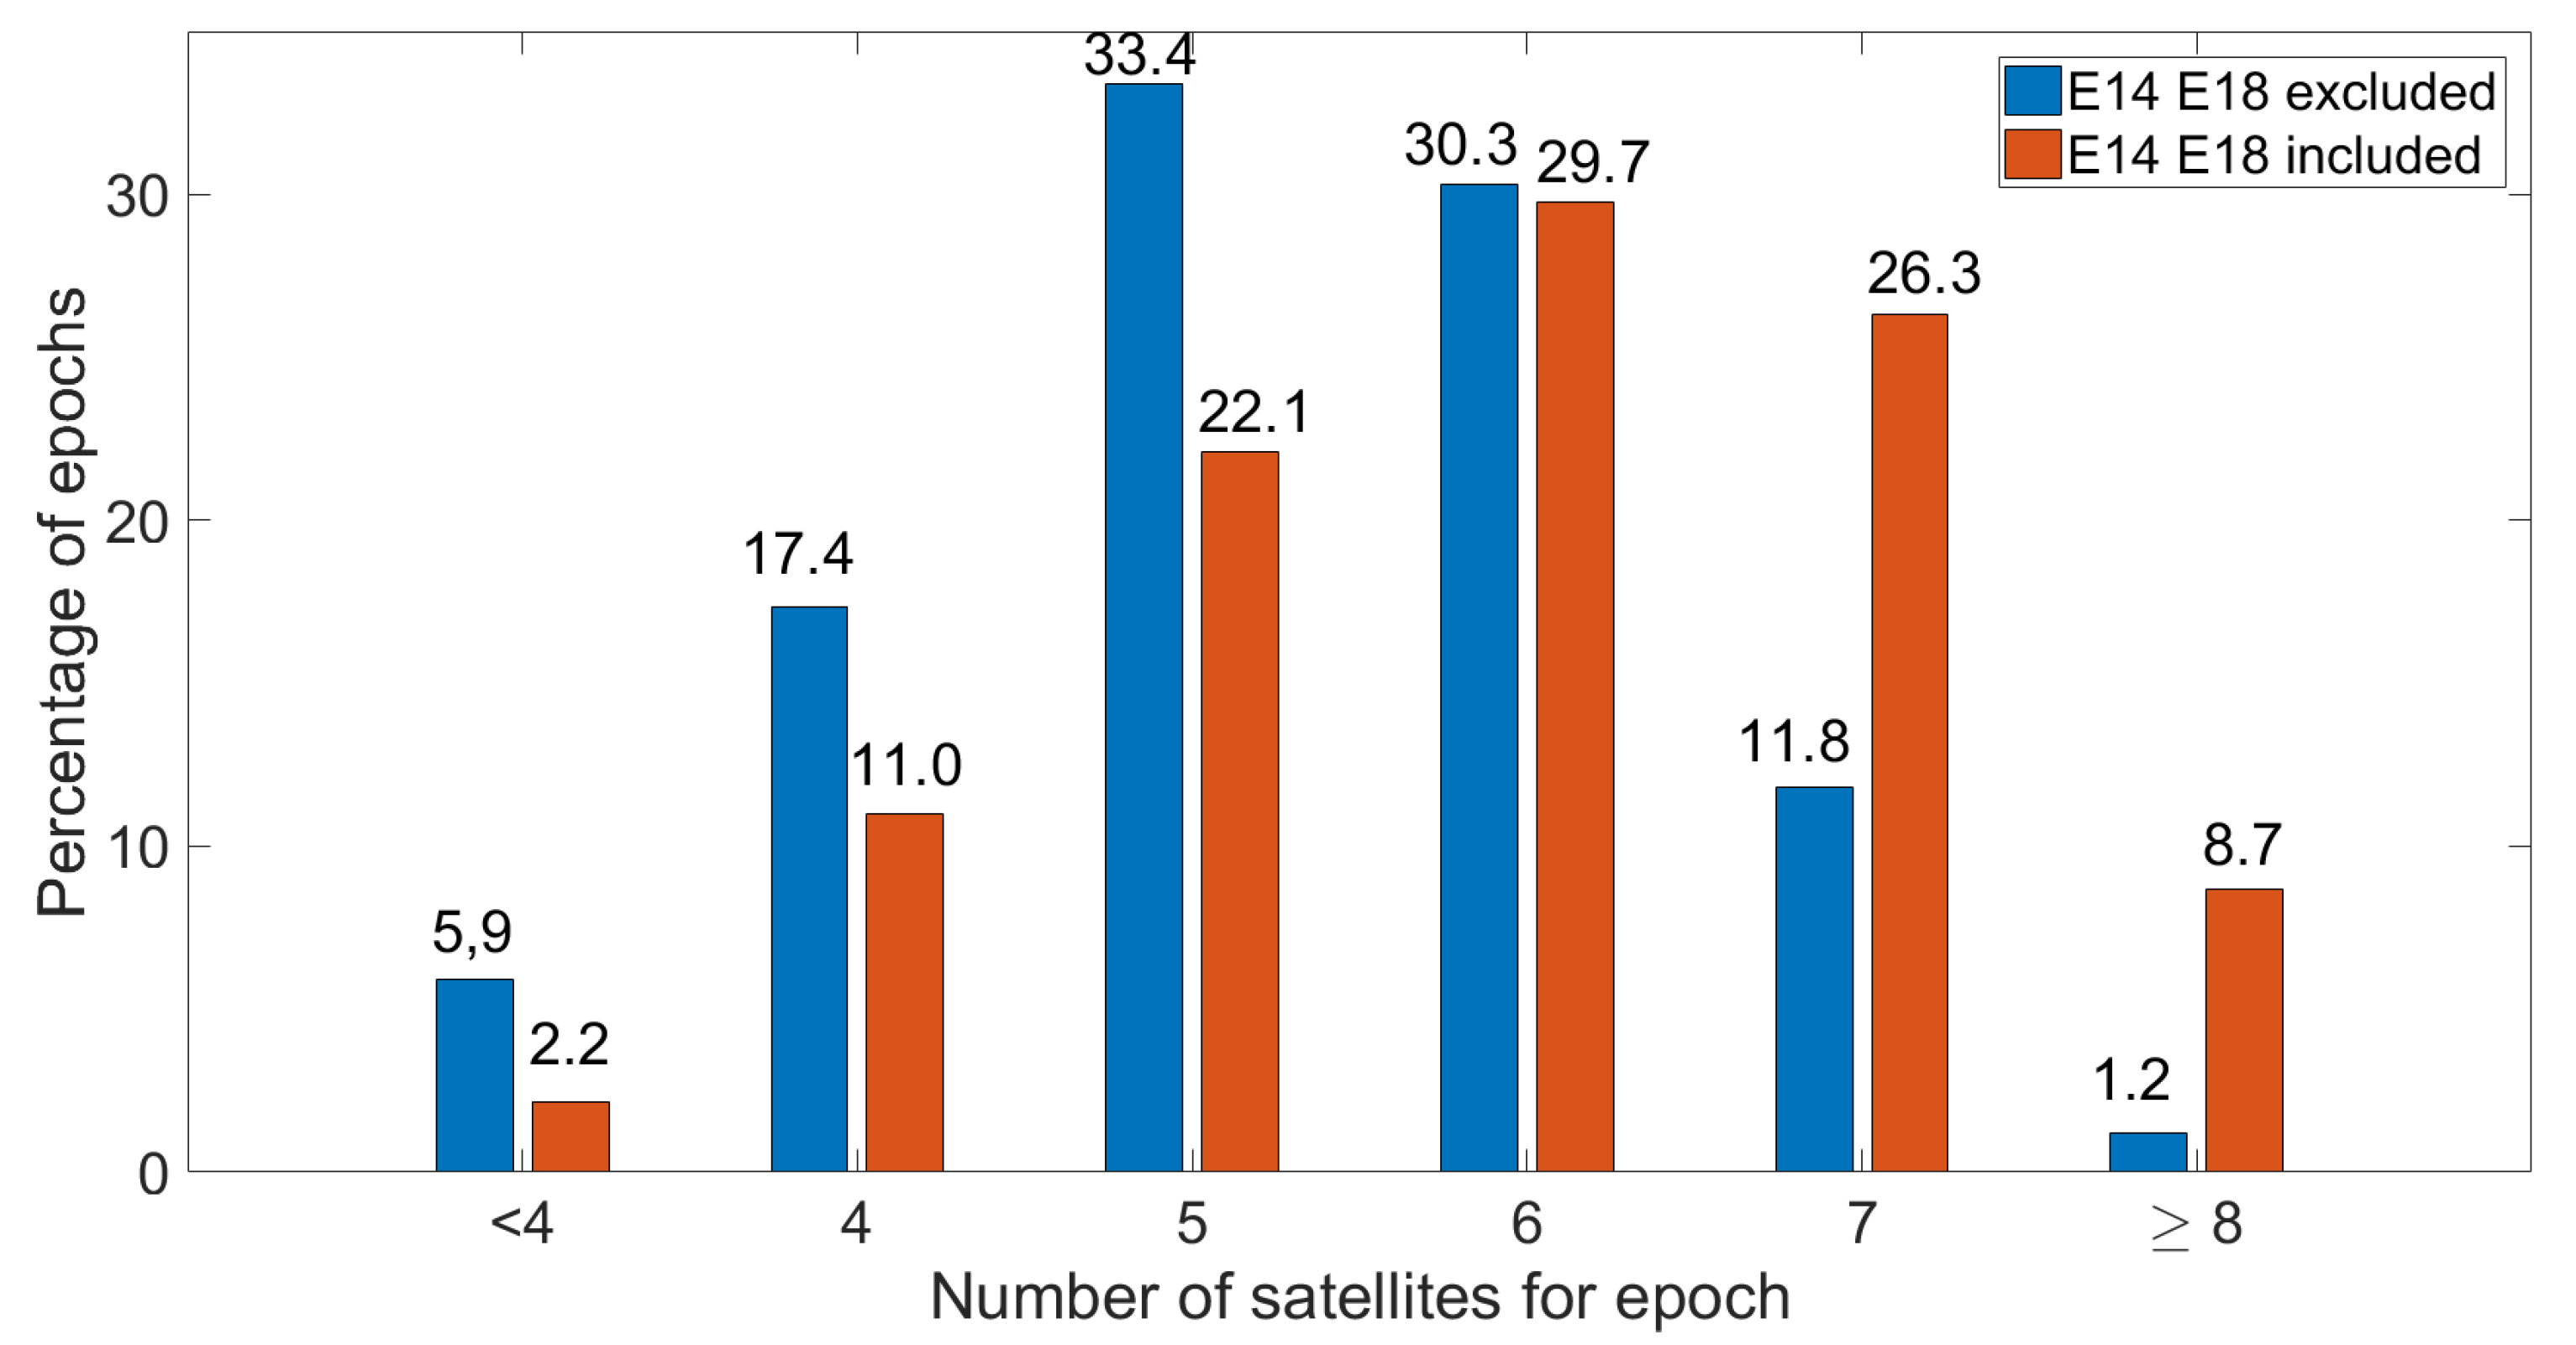
Figure 5 shows the percentage of epochs with the same satellite number reported on the x axis. Blue bars refer to the Galileo configuration without the Milena (E14) and Doresa (E18) satellites, while red bars refer to the Galileo constellation including them. The figure shows that, when the Milena (E14) and Doresa (E18) satellites were included, the percentage of epochs with seven or more visible satellites was greater than the percentage one obtains when they were excluded. Consequently, excluding the Milena (E14) and Doresa (E18) satellites, the percentage of epochs with a number of visible satellites less than seven was higher. Particularly, the exclusion of the Milena (E14) and Doresa (E18) satellites increased the percentage of epochs with less than four visible satellites, decreasing the system availability. The system availability is defined as the epoch percentage where the number of satellites is greater than four, and it does not indicate the percentage of epochs where a single code position solution can be achieved. This parameter can be considered as an upper bound: the percentage of epochs where the position solution could be achieved is always lower than system availability since the errors that afflict the pseudorange and the goodness of the ephemeris have not been considered. The inclusion of the Milena (E14) and Doresa (E18) satellites increased the system availability, varying it from 94.1–97.8%.
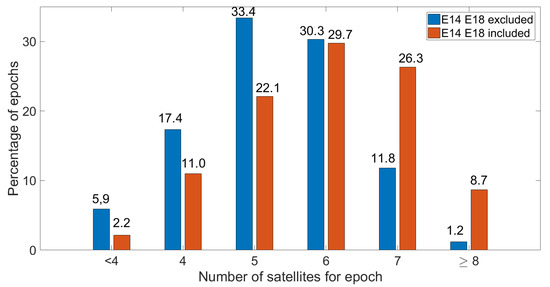
Figure 5.
Percentage of epochs with the same satellite number. The height of each bin represents the percentage of epochs with the number of satellites indicated on the xaxis. Blue bars refer to the Galileo configuration without the Milena (E14) and Doresa (E18) satellites, while red bars refer to the Galileo constellation including the Milena (E14) and Doresa (E18) satellites.
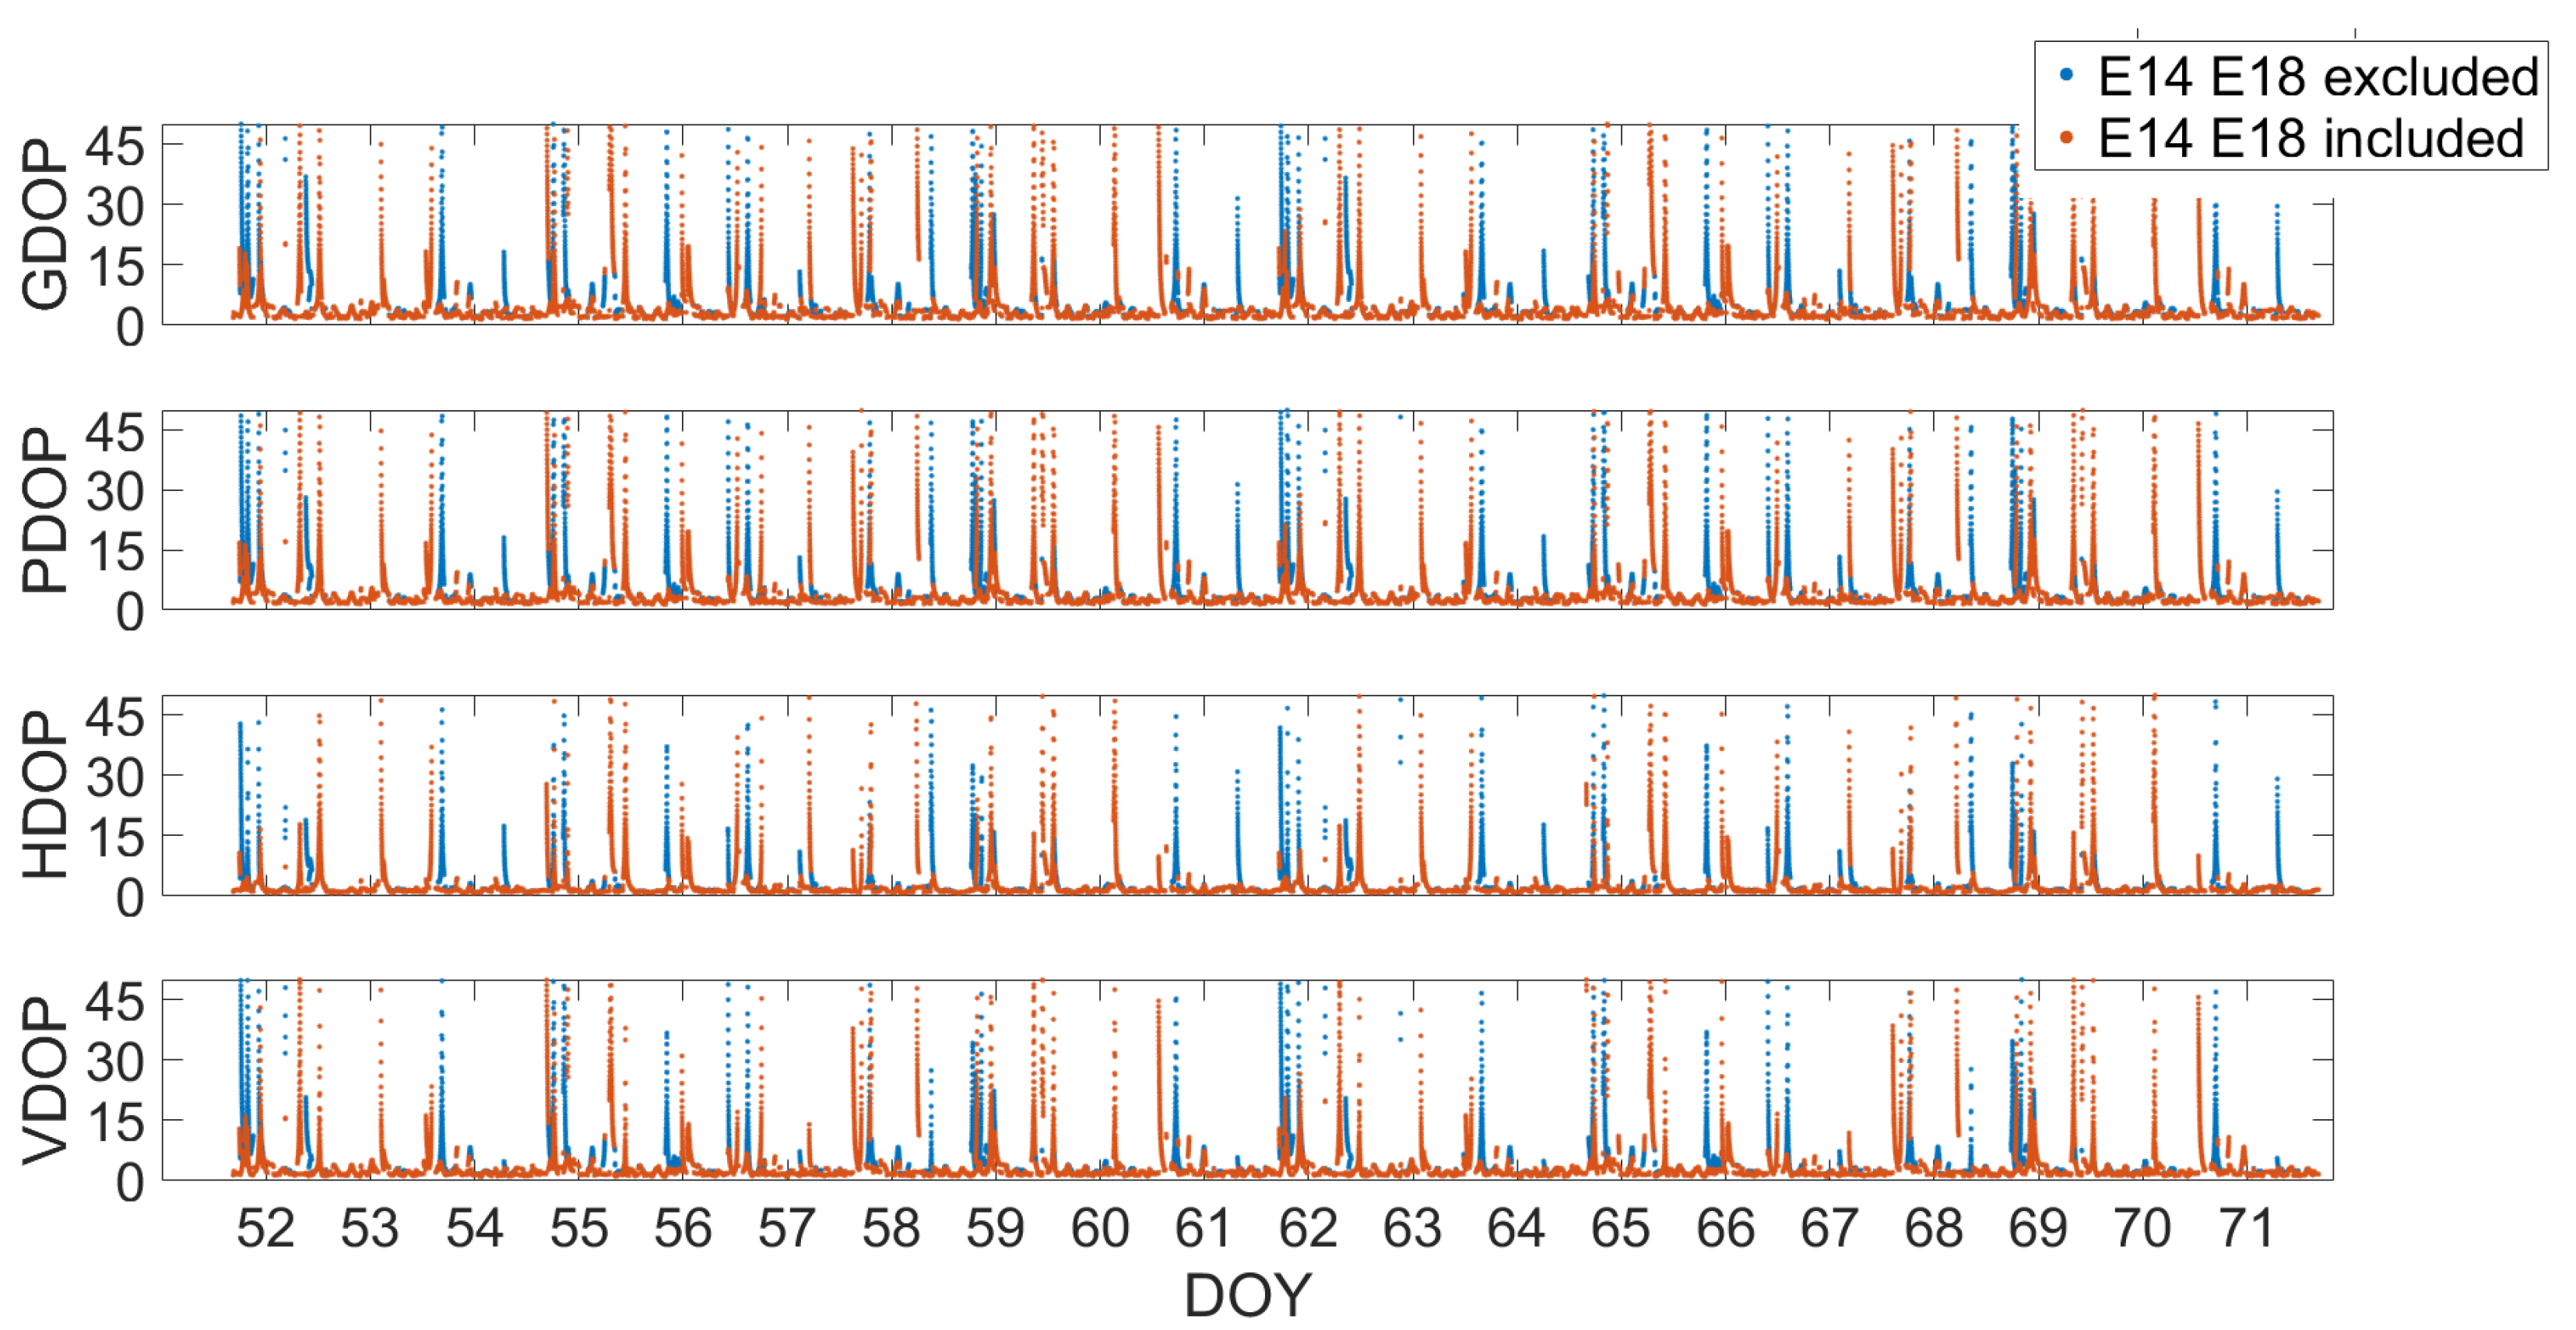
Figure 6 shows the evolution of dilution of precision parameters of the Galileo constellation in the YEL2 location. The blue points represent DOP values occurring when the Milena (E14) and Doresa (E18) satellites were excluded. The red points represent DOP values obtained including the Milena (E14) and Doresa (E18) satellites. The exclusion of the satellites led to an increase of the DOP parameters, as expected.
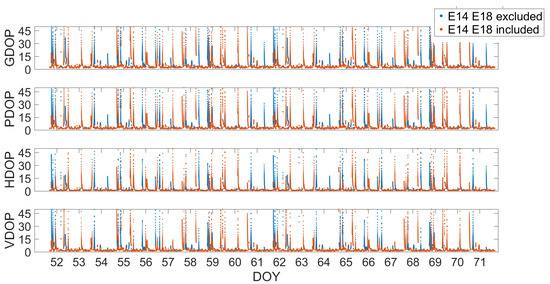
Figure 6.
Time evolution of the dilution of precision parameters of the Galileo constellation in the YEL2location. The blue points represent DOP values occurring when the Milena (E14) and Doresa (E18) satellites were excluded. The red points represent DOP values obtained including the Milena (E14) and Doresa (E18) satellites. The ticks on the x axis are spaced 86,400 s (equal to one day); in this way, each tick corresponds to a day.
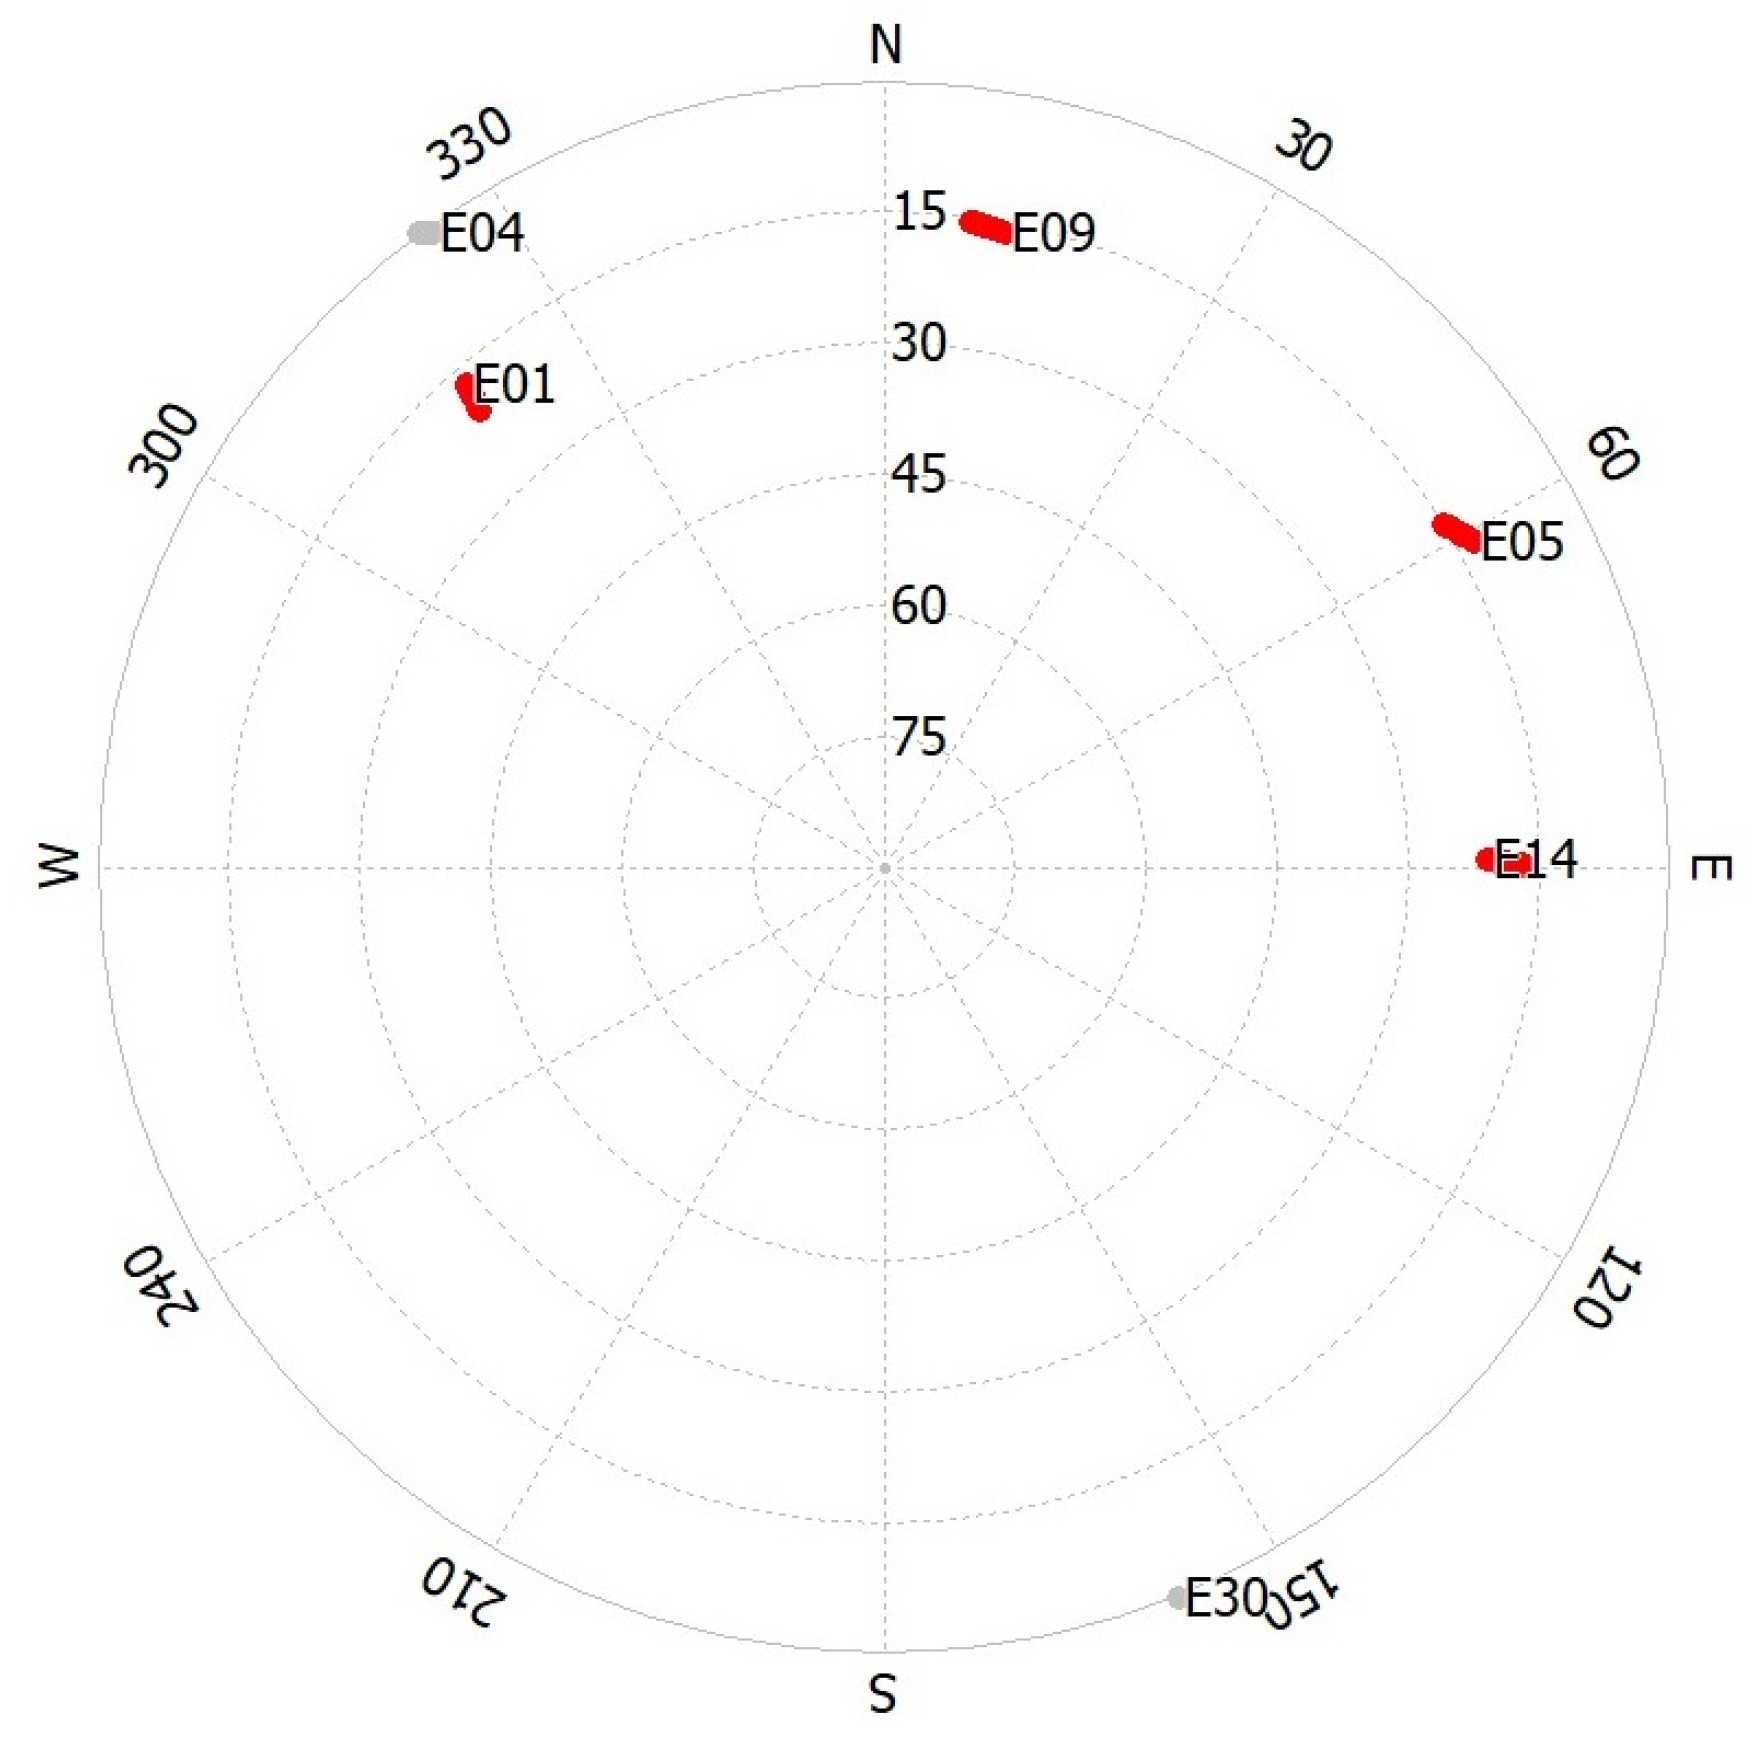
The very high values of the DOP in Figure 6 must be attributed to the fact that the Galileo constellation is not yet complete. There were, in fact, epochs where the low number of visible satellites and their non-optimal spatial disposition caused these high values. An example is reported in Figure 7.
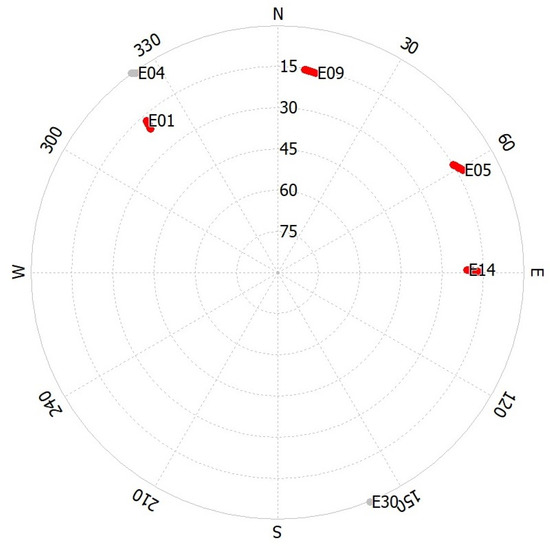
Figure 7.
Galileo system skyplot in the YEL2 site on DOY 55 from 4:40–5:00 UTC.
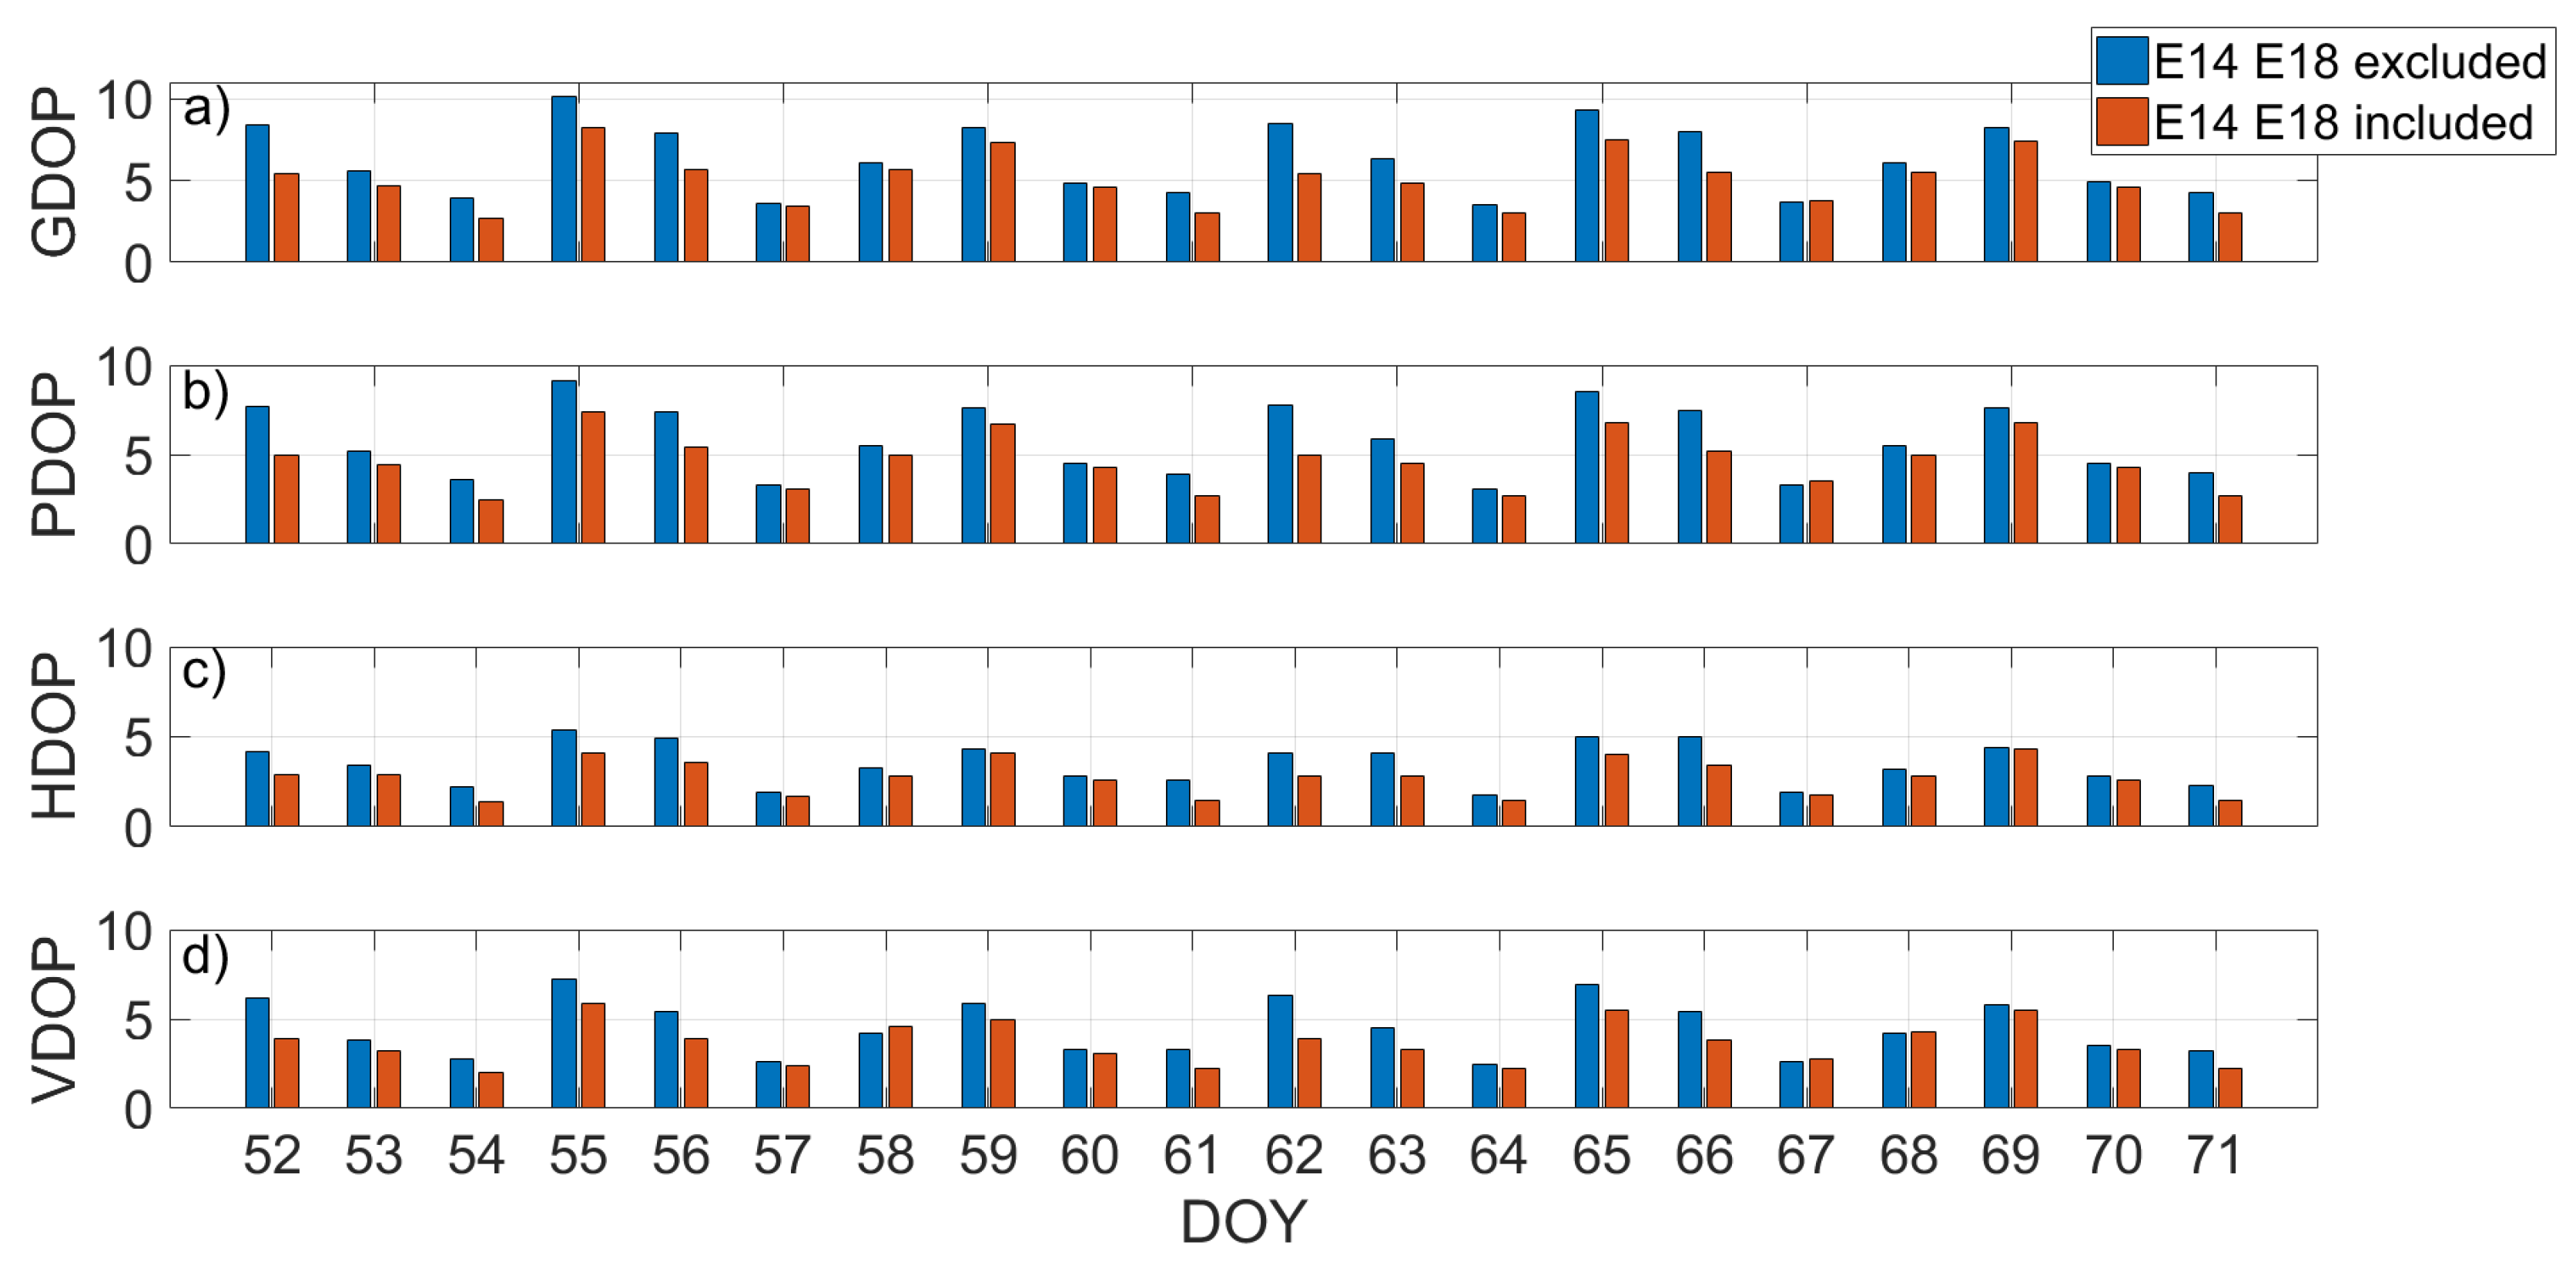
However, in order to make a quick analysis, in Figure 8 is reported a comparison of the daily dilution of precision of the Galileo constellation in the YEL2 location excluding (blue bars) and including (red bars) the Milena (E14) and Doresa (E18) satellites. The comparison was made for GDOP, PDOP, HDOP, and VDOP. Figure 8 clearly shows that the inclusion of the two satellites improved all the DOPs, every day, as the red bars are always lower than the blue ones. This was expected, as the more satellites used in the solution, the smaller the DOP values.
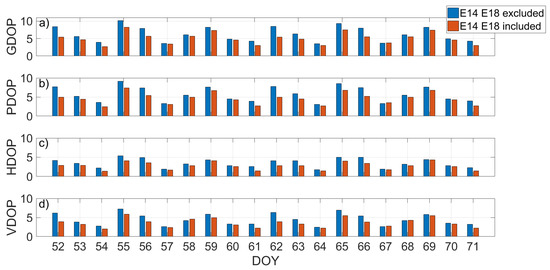
Figure 8.
Daily dilution of precision comparison of the Galileo constellation in the YEL2 location excluding (blue bars) and including (red bars) the Milena (E14) and Doresa (E18) satellites. GDOP (Geometric Dilution Of Precision), PDOP (Position Dilution Of Precision), HDOP (Horizontal Dilution Of Precision), and VDOP (Vertical Dilution Of Precision) are compared in (a–d), respectively.
Regarding the above-mentioned high values of DOP, it can be noted that the the share of DOP values larger than six was 4.92%, and this is the reason why their presence was not evident in the averages values.
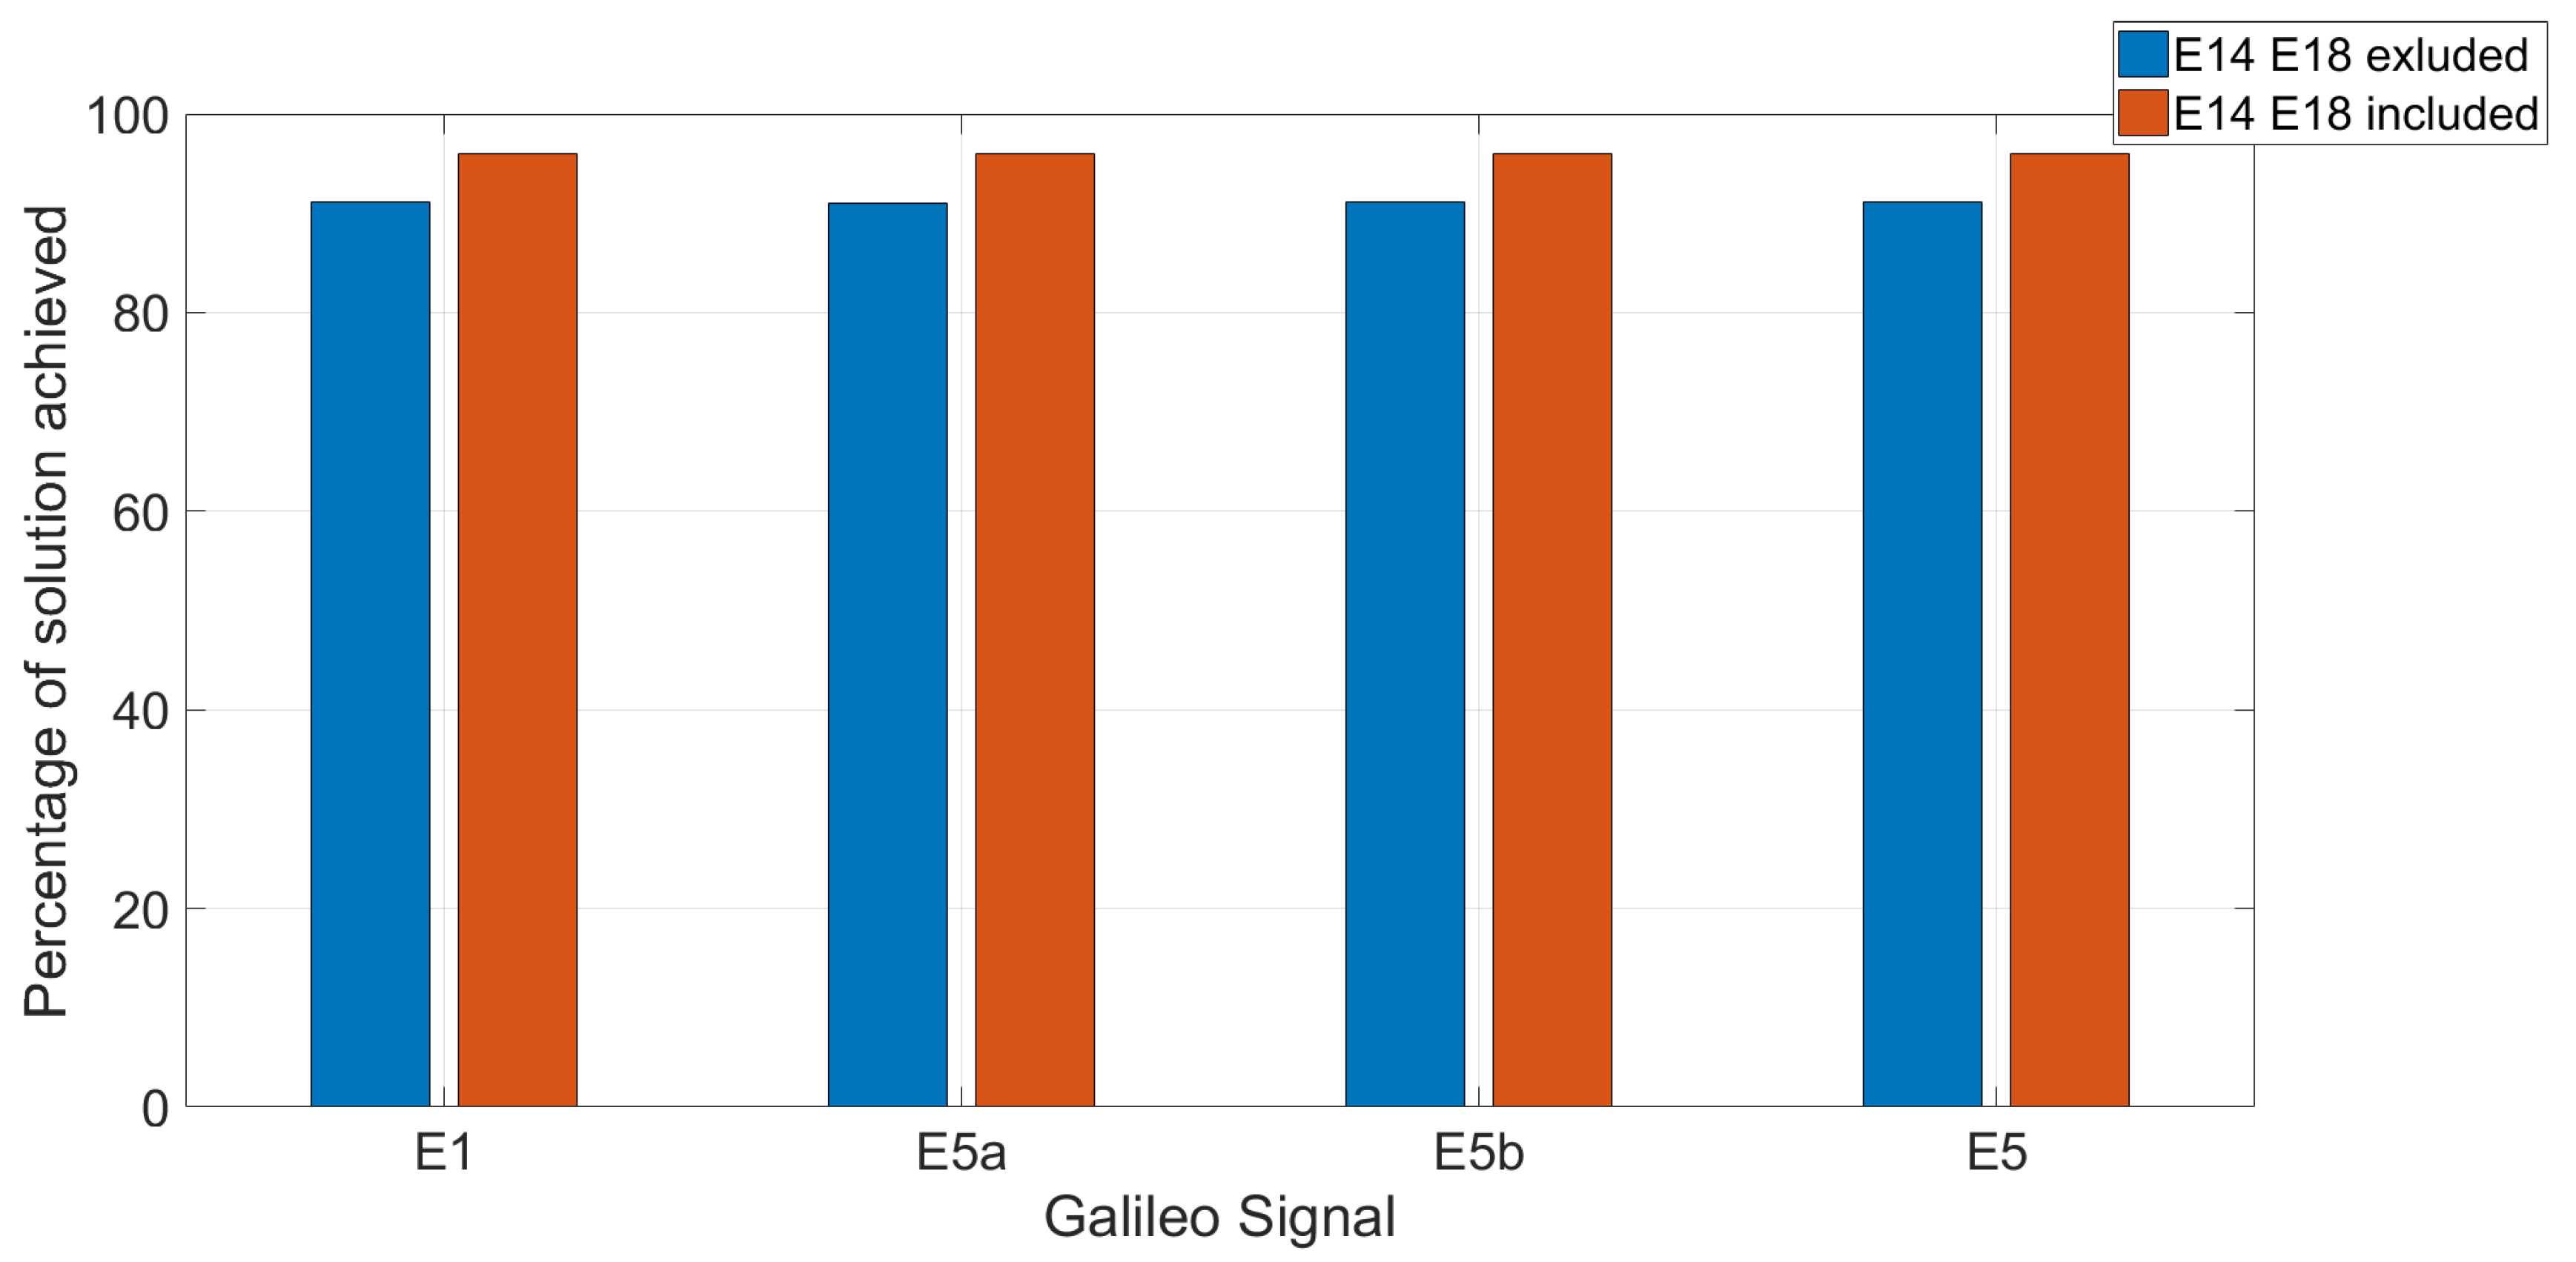
Figure 9 shows the percentages of achieved positioning solutions for the E1, E5a, E5b, and E5 frequencies excluding (blue bars) and including (red bars) the Milena (E14) and Doresa (E18) satellites. It should be emphasized that we did not use any threshold for the DOP in order to obtain the greatest number of solutions. The figure clearly shows that the use of the two satellites increased the percentage of the solution for all the frequencies. In detail, the inclusion of the Milena (E14) and Doresa (E18) satellites increased by about 5% the number of solutions obtained, regardless of the frequency used.
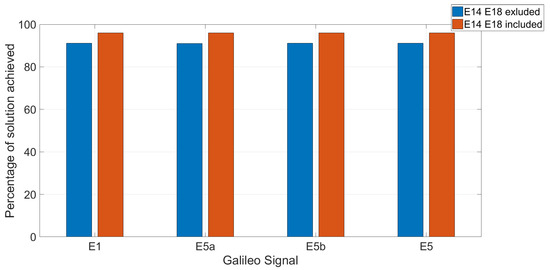
Figure 9.
Percentage of Galileo constellation achieved positioning solutions in the YEL2 location excluding (blue bars) and including (red bars) the Milena (E14) and Doresa (E18) satellites for the E1, E5a, E5b, and E5 Galileo signal. The analysis was carried out on 1,728,000 epochs.
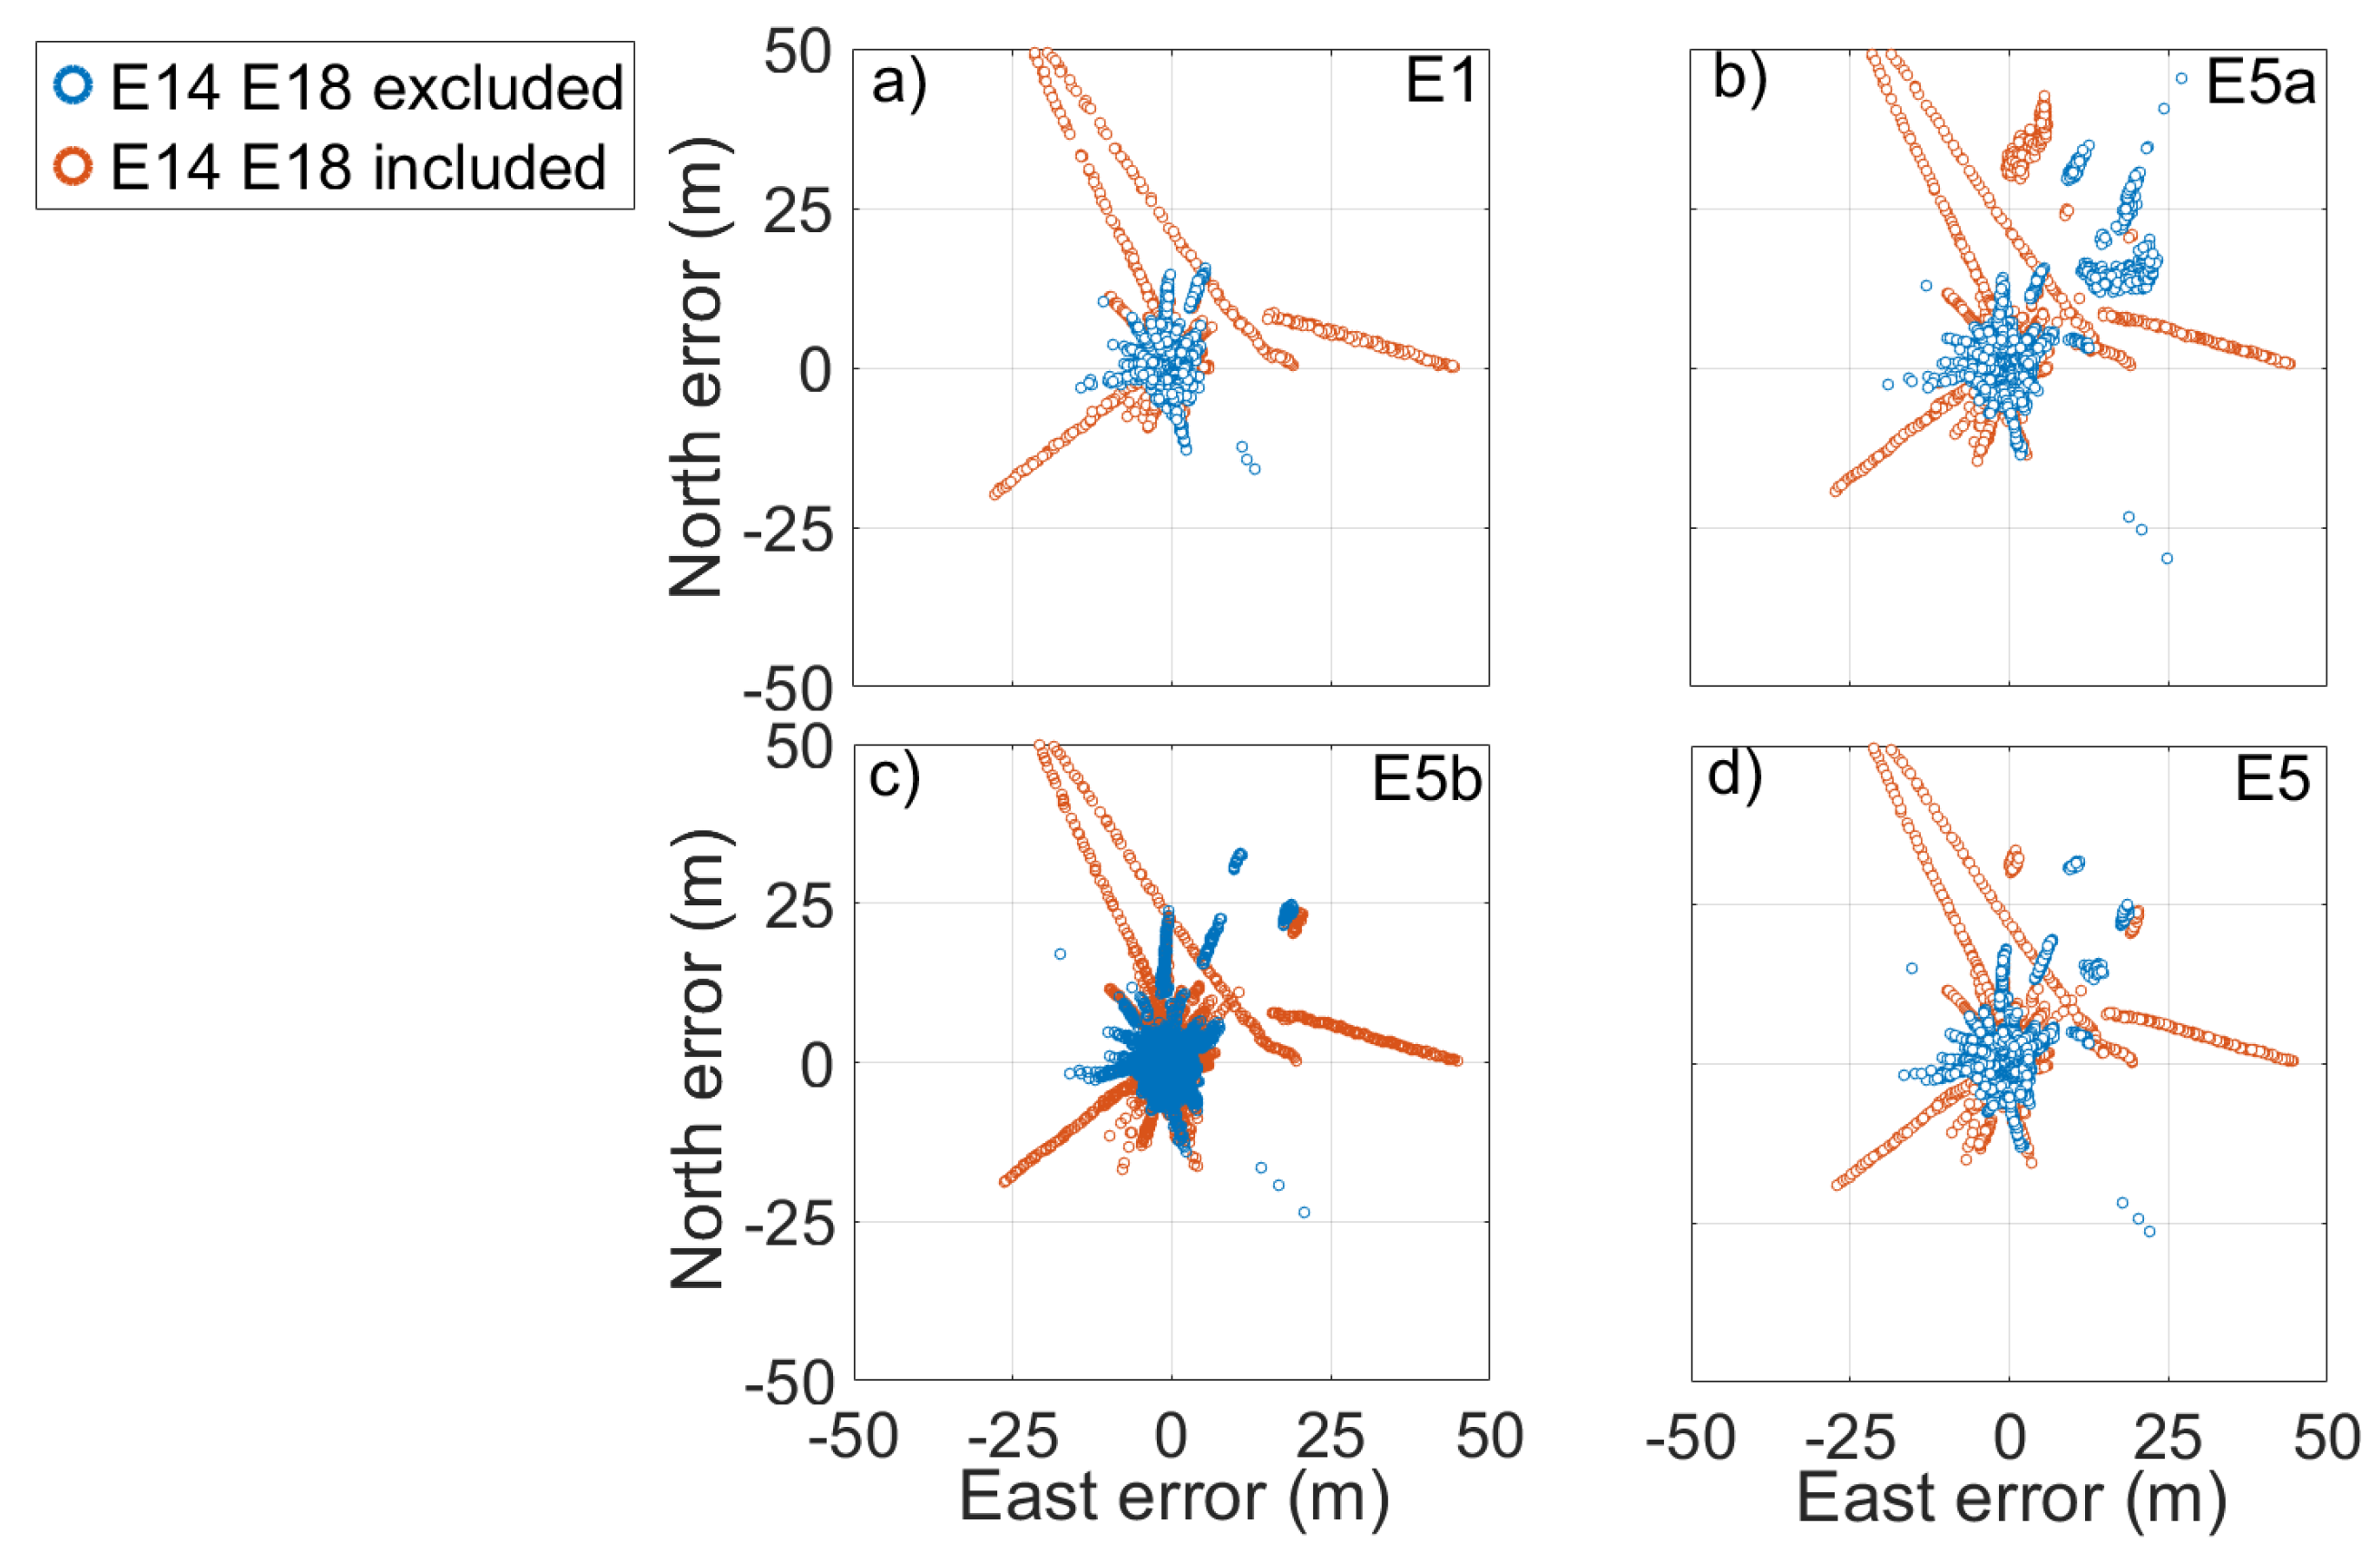
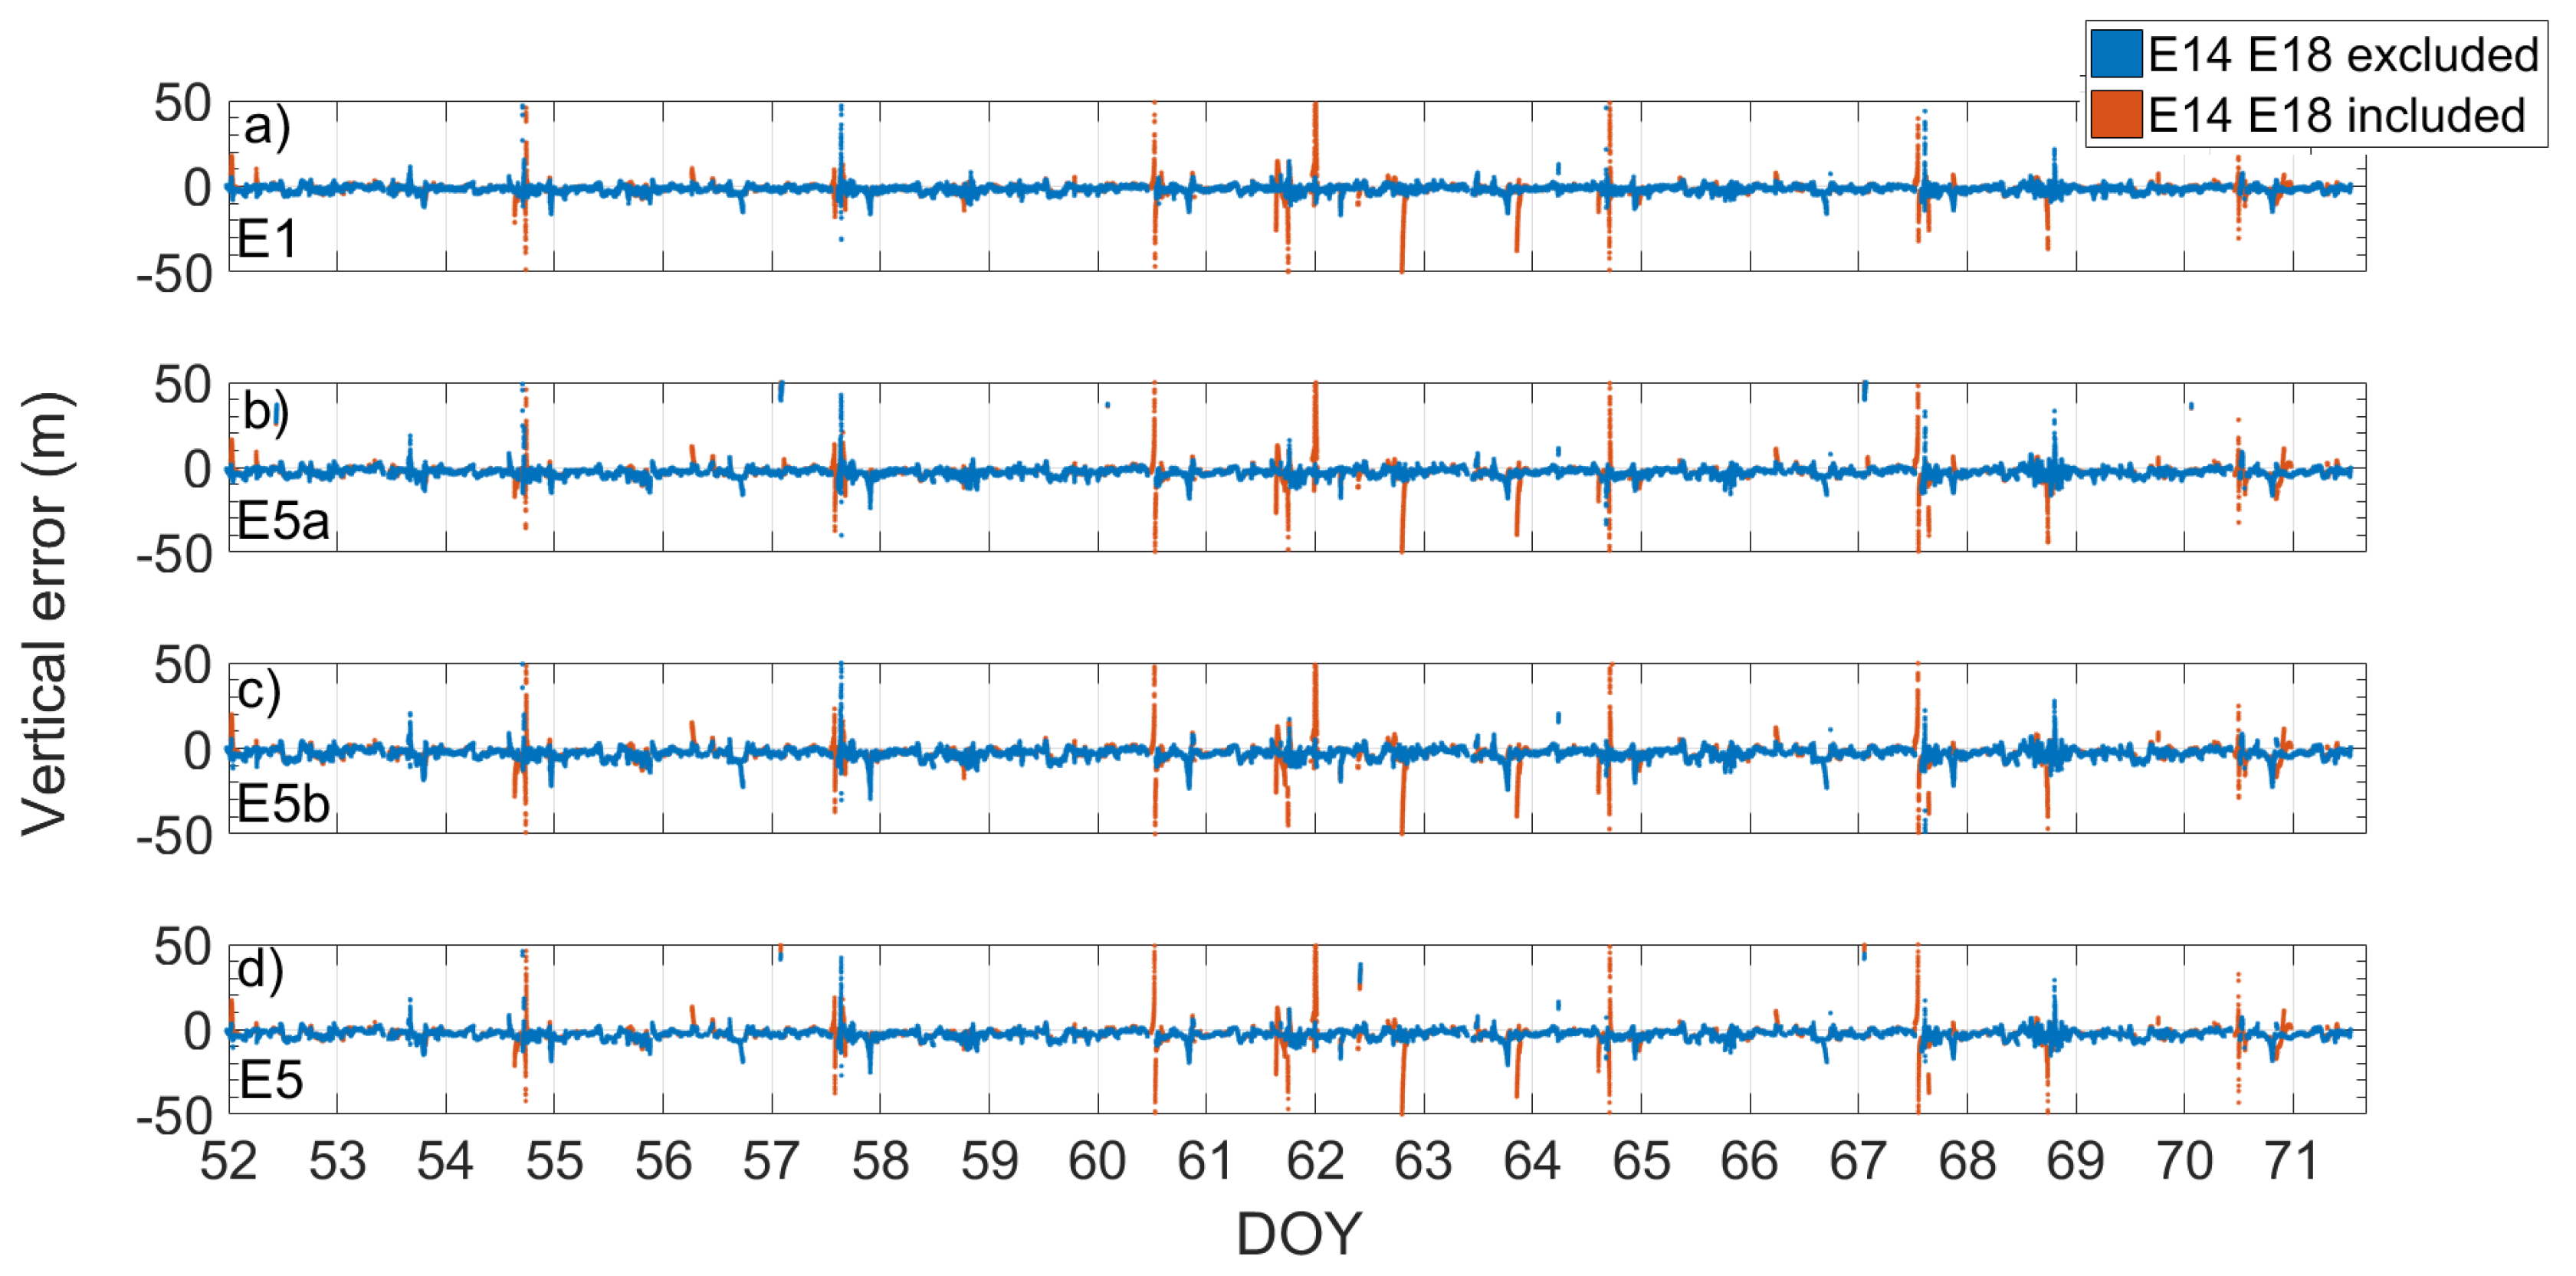
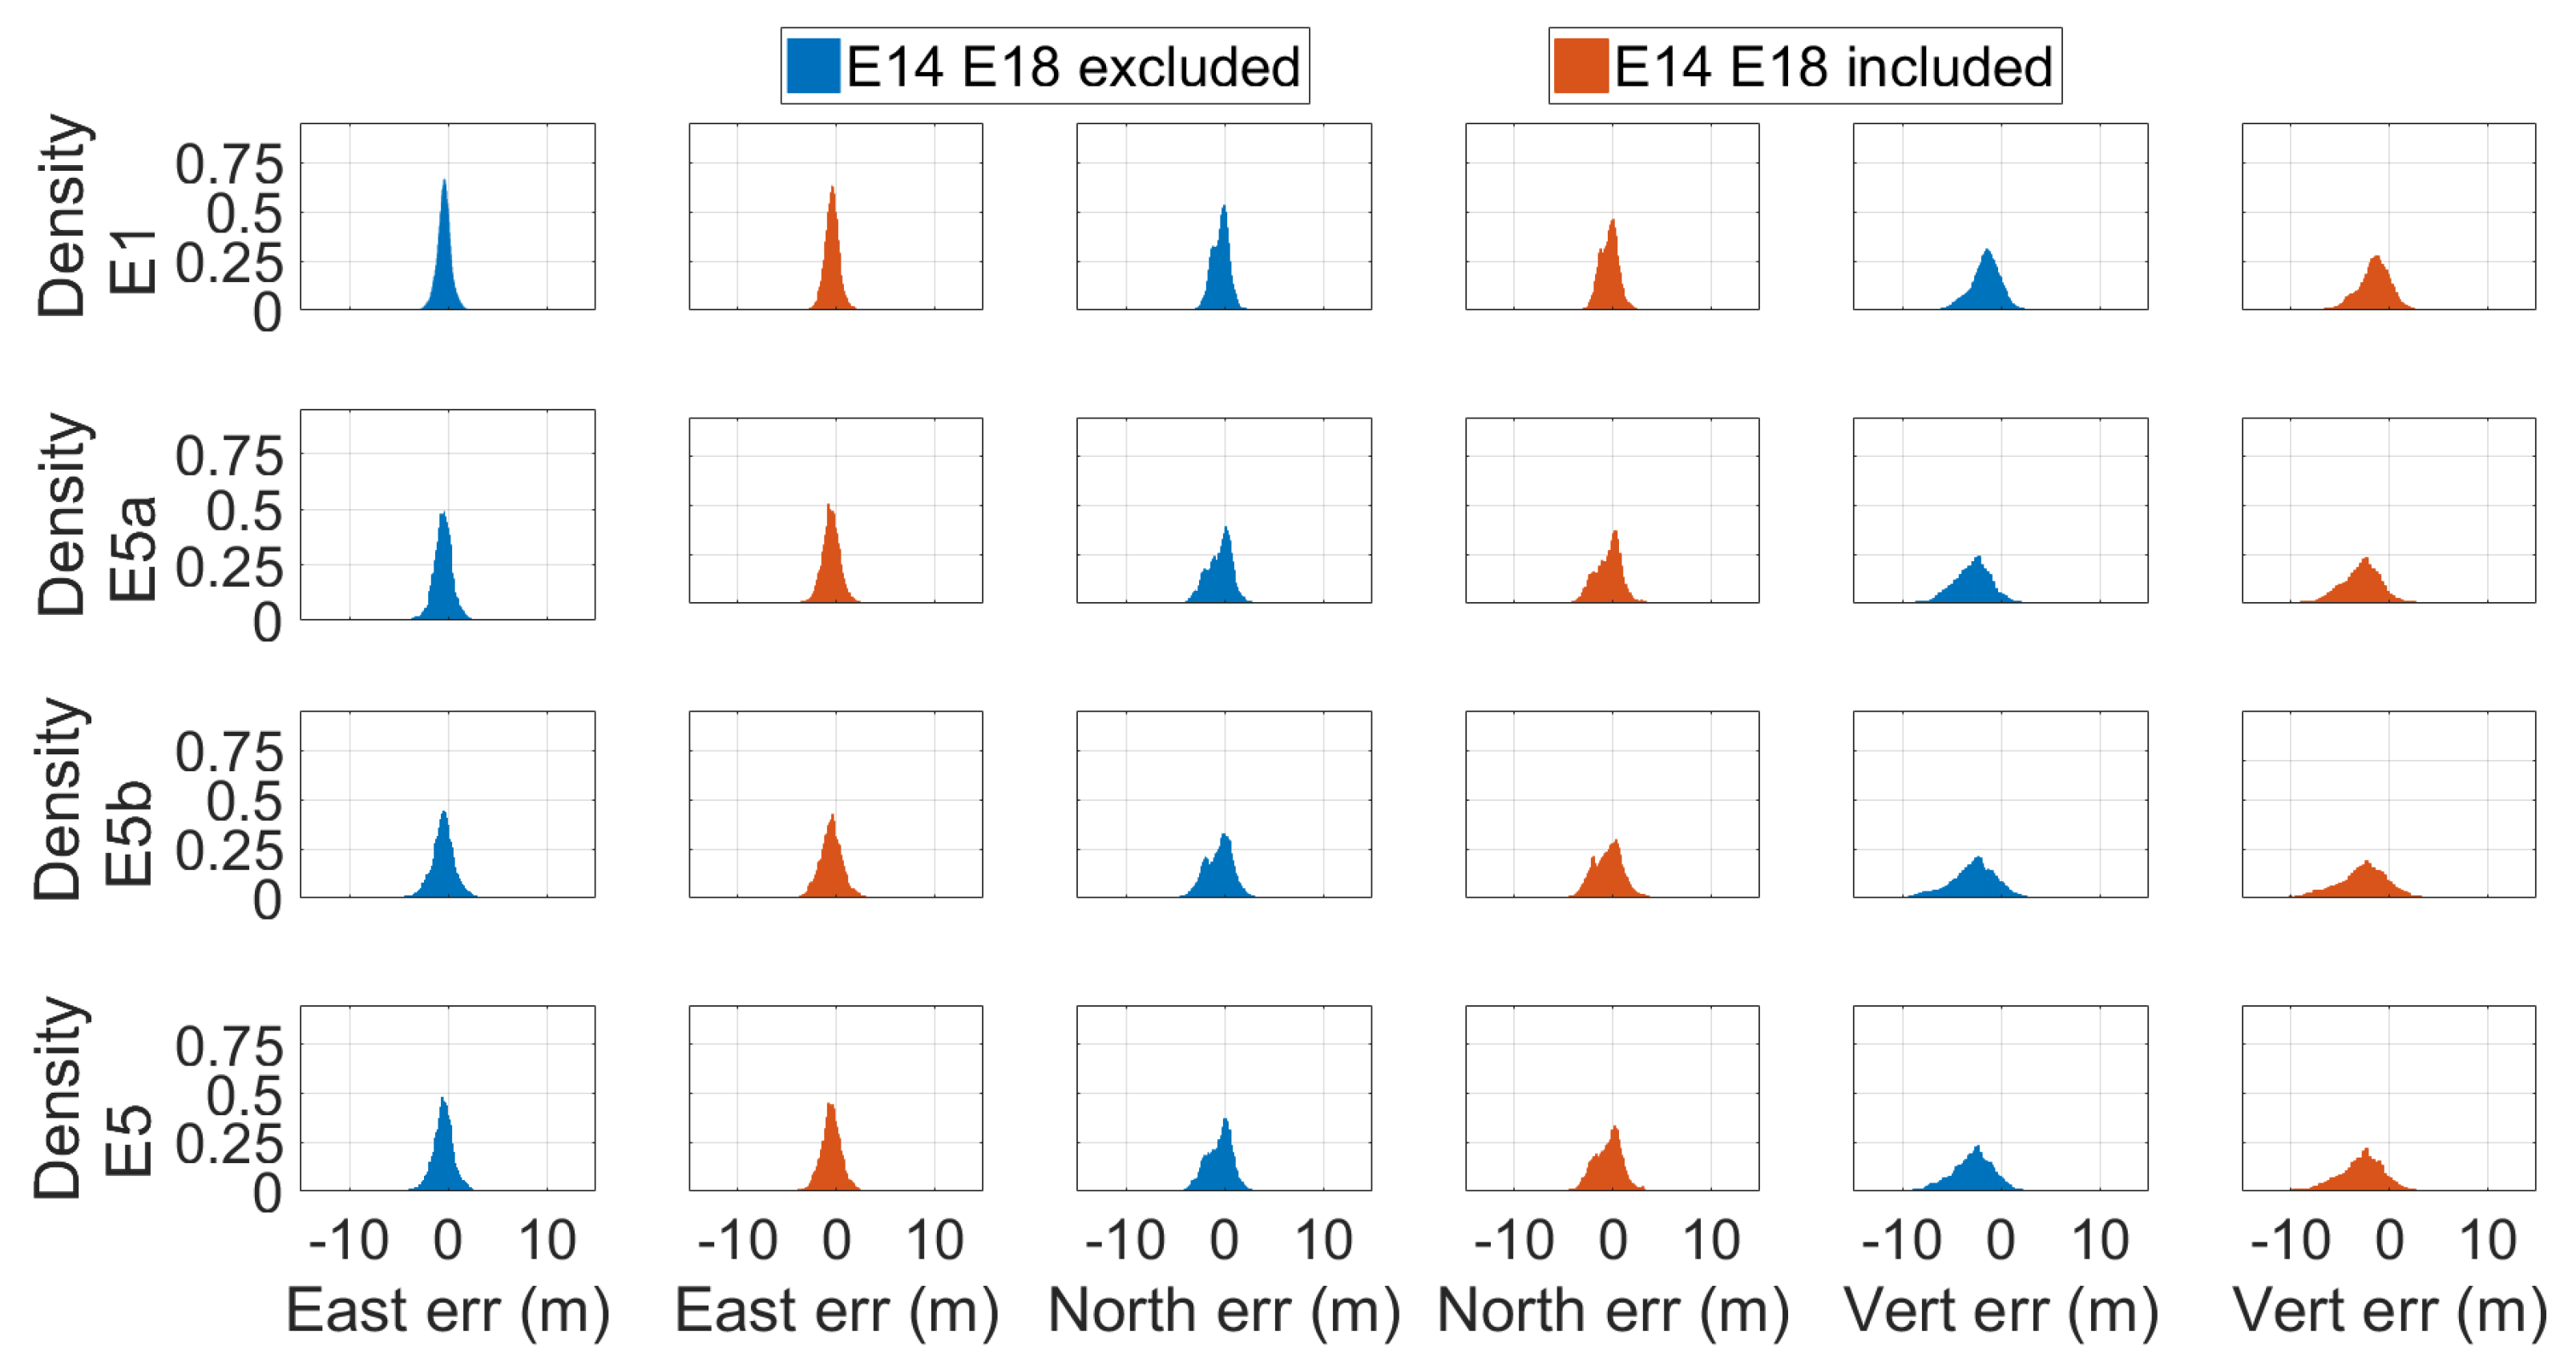
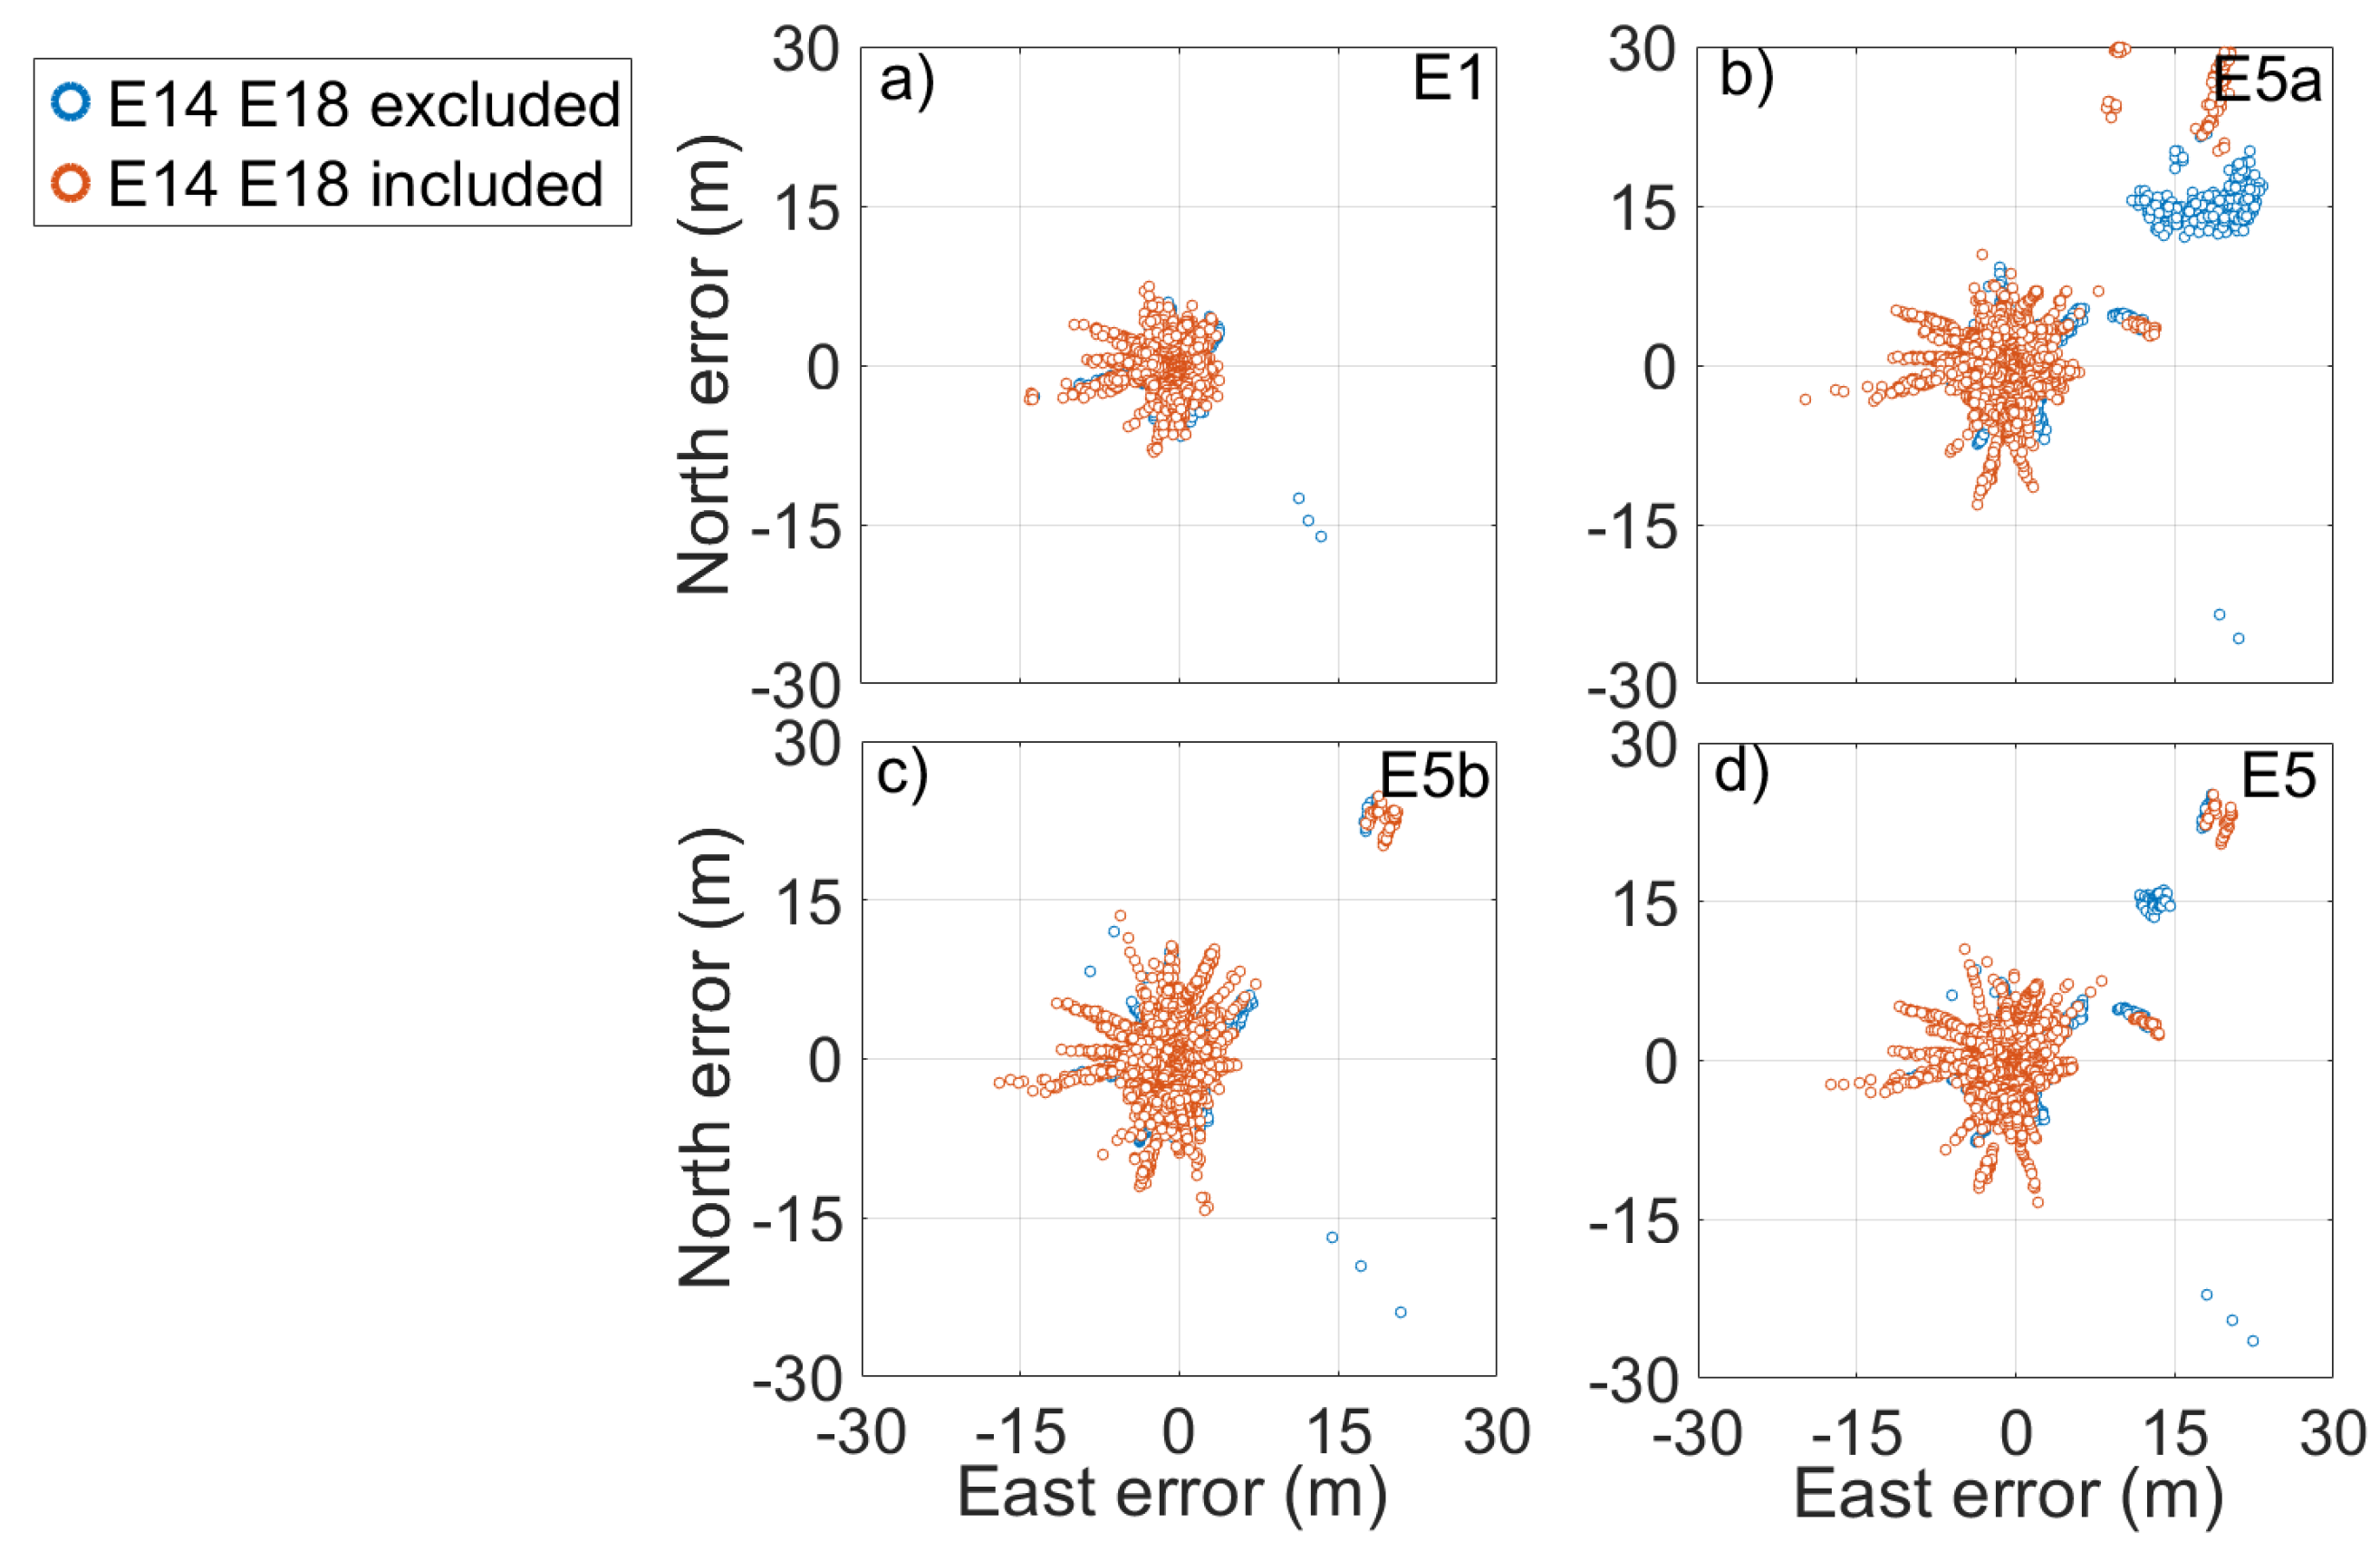
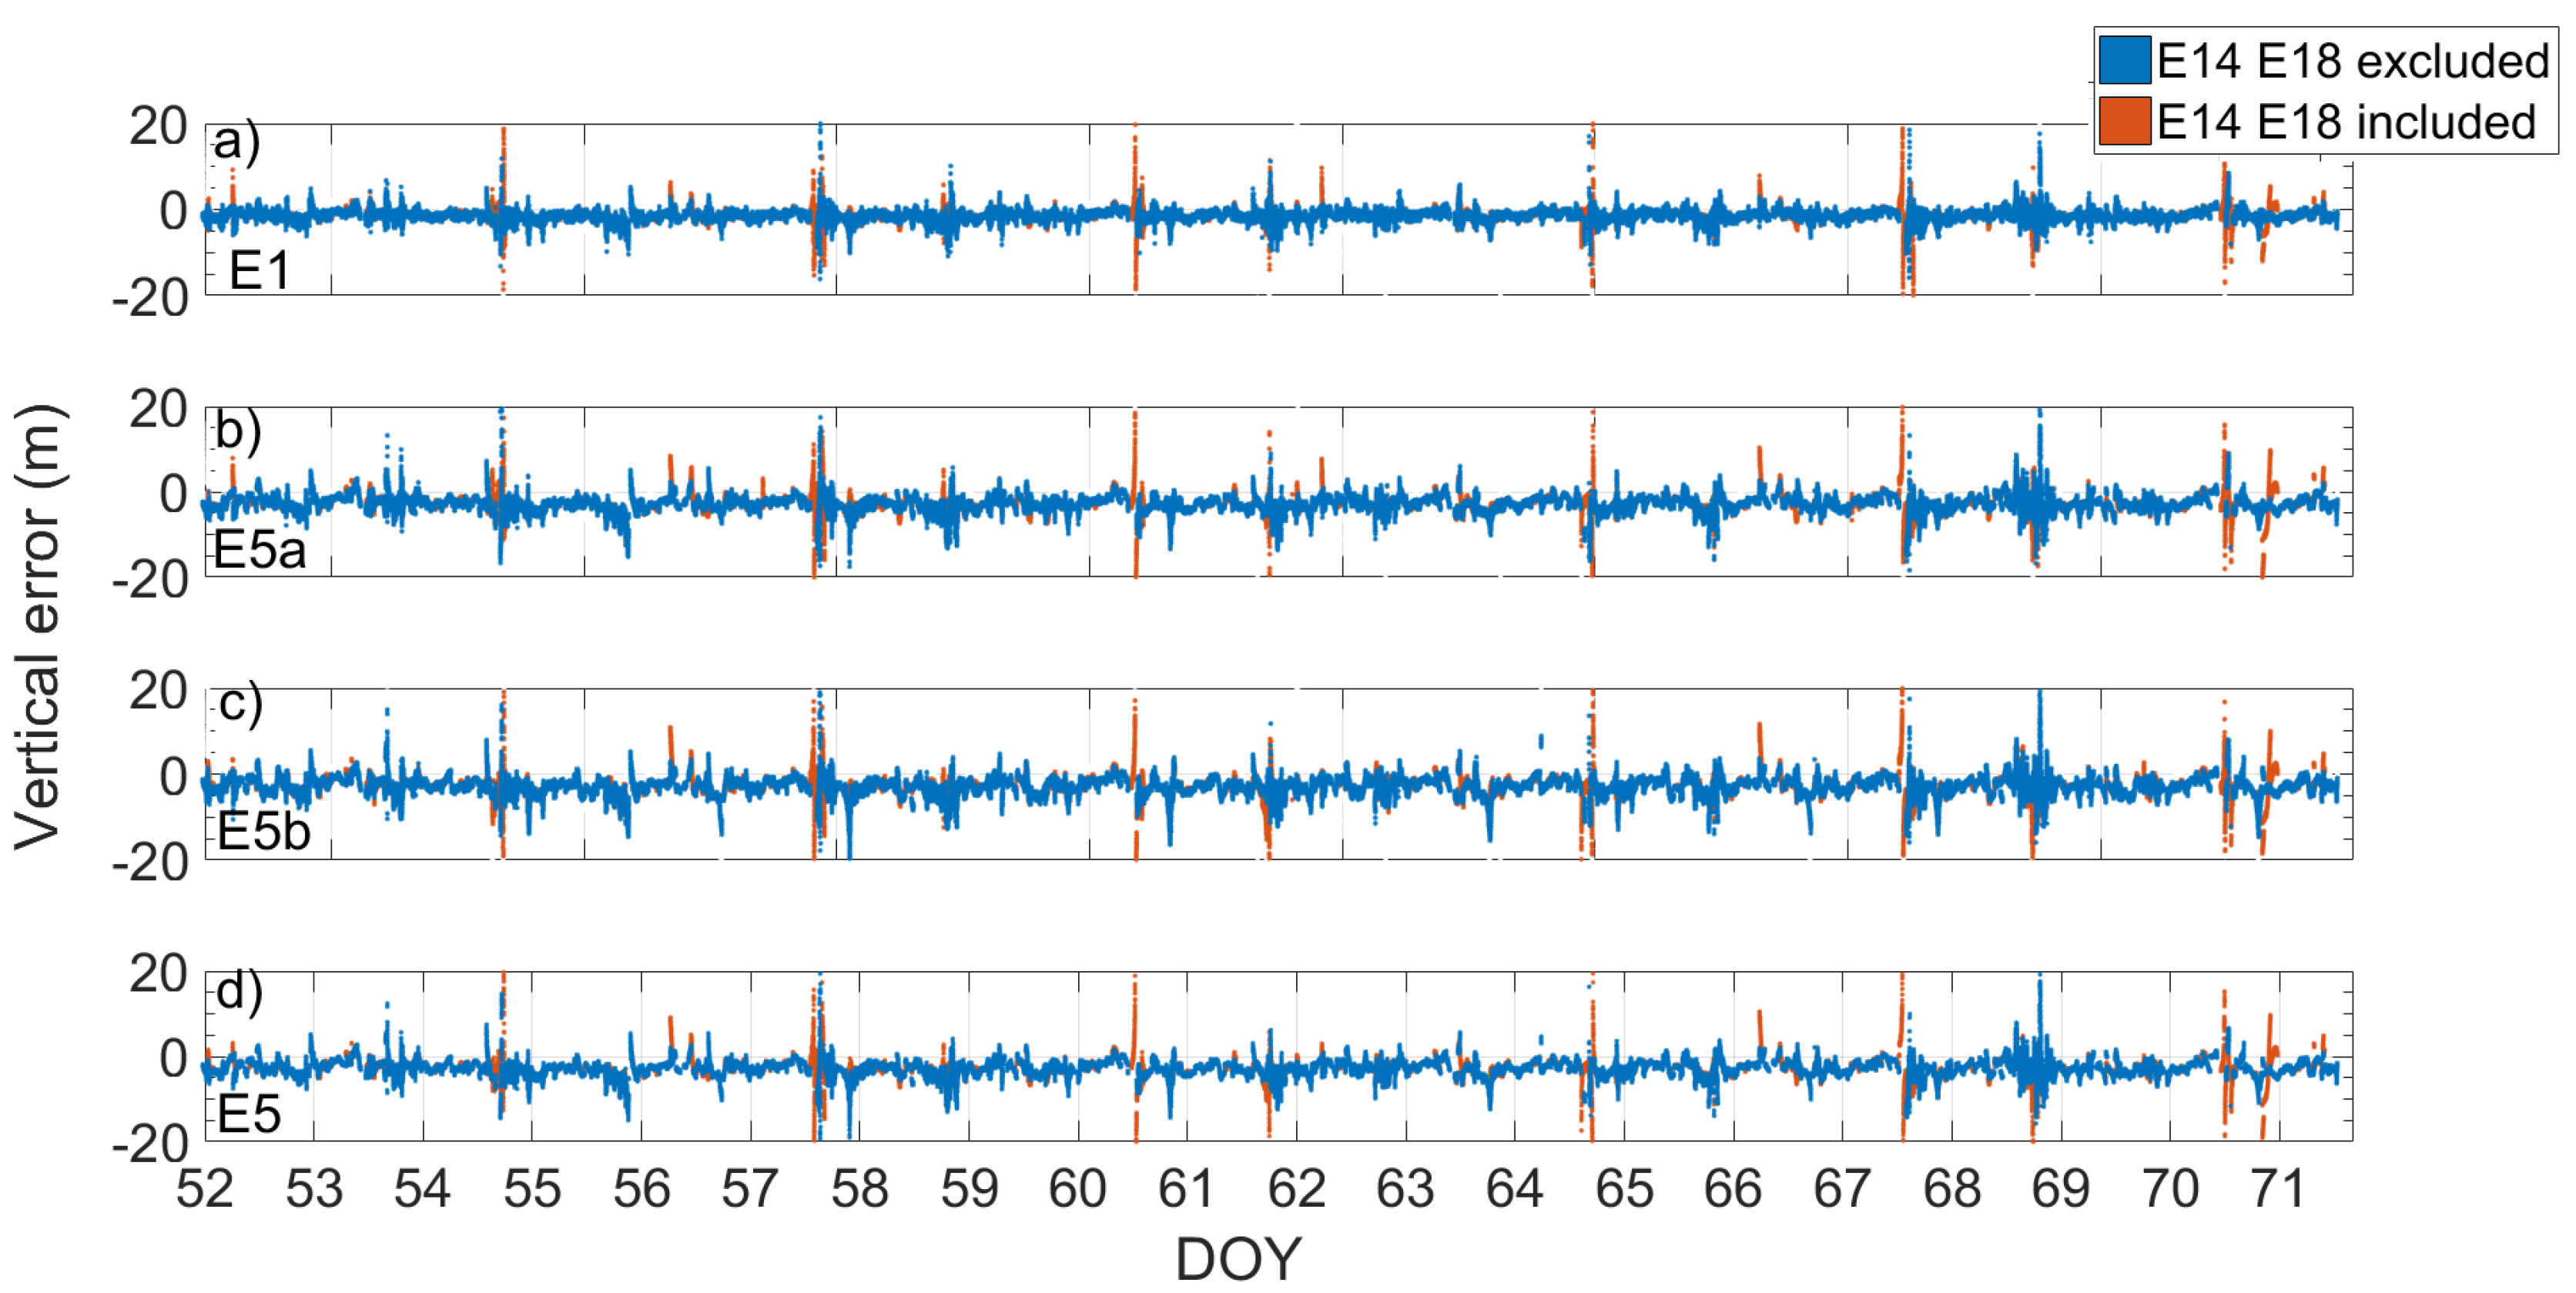
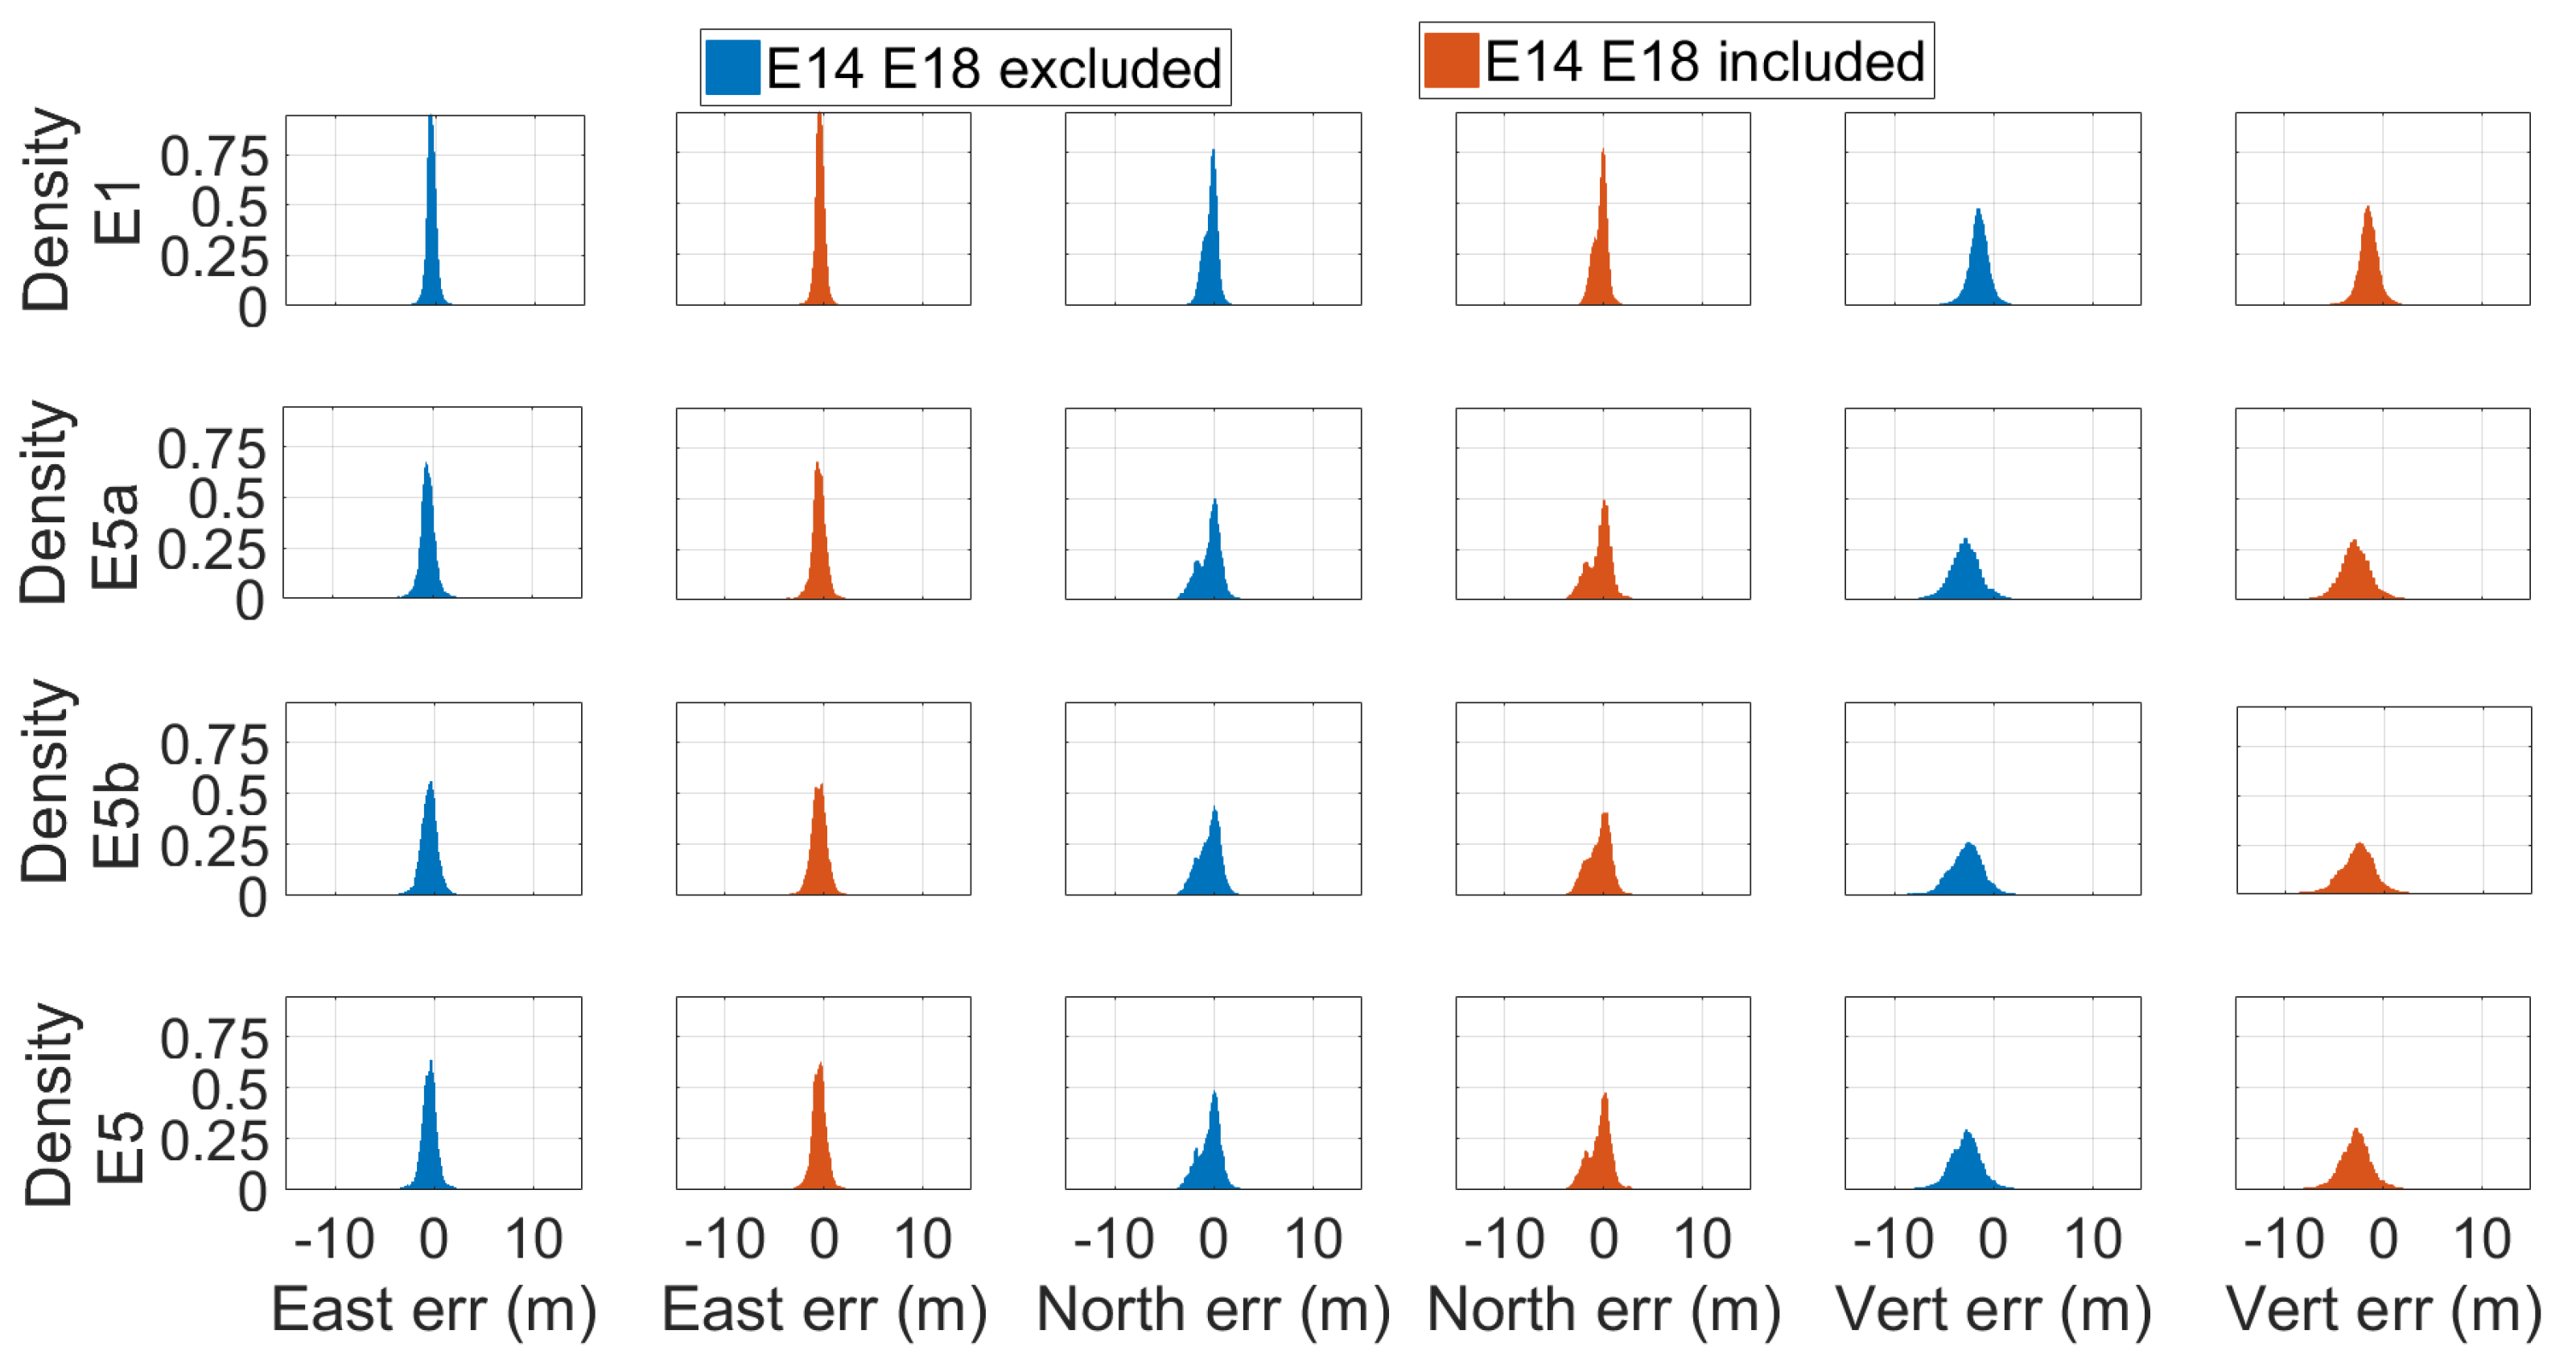
Figure 10 and Figure 11 show respectively the scatter plot of single-point position error and the time series of vertical error, calculated by using broadcast ephemeris, for the E1, E5a, E5b, and E5 frequencies. The error represented in the figures was calculated as the difference between the coordinates obtained from the single-point algorithm and those provided by the station monograph considered as the truth. The figures allow a quick comparison between the accuracy of the solution obtained using (red) or not (blue) the Milena (E14) and Doresa (E18) satellites. It clearly emerges that the use of the two satellites degraded the solution accuracy for all frequencies. Figure 12 shows the density histograms of the E1, E5a, E5b, and E5 single-point position coordinates’ error in the case of exclusion (blue) or inclusion (red) of the satellites with broadcast ephemeris. Looking at the figure, we can see that all the histograms except those relative to the vertical component of the solution assumed the maximum value around zero. The histograms of the vertical component are wider than those relative to the other components. Comparing each blue histogram with the red one immediately to its right, we notice that each red histogram showed a peak always slightly lower than the corresponding reported in blue. This indicates that the inclusion of the Milena (E14) and Doresa (E18) satellites worsened the accuracy of the solution. What appears from the figure is detailed in Table 2, where the DRMS (Distance Root Mean Squared) and vertical RMS are shown for both scenarios and for all frequencies. The inclusion of satellites always worsened both the horizontal and vertical accuracy. The difference of the horizontal accuracy went from 0.17 m with E5a frequency measurements to 0.74 m with E1 measurements. The same fate was for the vertical accuracy with a deterioration going from 0.68 m for E5a to 1.2 m for E1 measurements. This was not completely expected since both the HDOP and VDOP parameters decreased when these satellites were included in the solution calculation, as shown in Figure 8.
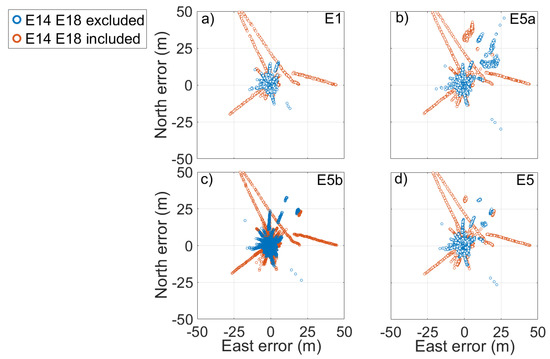
Figure 10.
Scatter plot of the E1, E5a, E5b, and E5 single-point position error reported in (a–d). Blue and red markers represent errors when the solution was obtained by excluding or including the measurements coming from the Milena (E14) and Doresa (E18) satellites, respectively. The solution was achieved by using broadcast ephemeris.
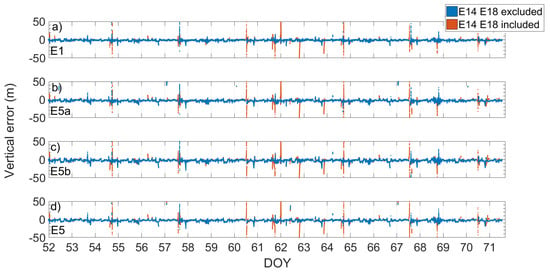
Figure 11.
E1, E5a, E5b, and E5 single-point position vertical error time series reported in (a–d). Blue and red markers represent errors when the solution was obtained by excluding or including the measurements coming from the Milena (E14) and Doresa (E18) satellites, respectively. The solution was achieved by using broadcast ephemeris.
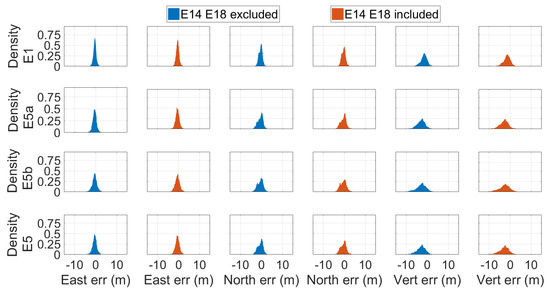
Figure 12.
Density histograms of the E1, E5a, E5b, and E5 single-point position coordinates’ error. Each line refers to a specific frequency: the first from above refers to the frequency E1, the second to E5a, the third to E5b, and the fourth to E5. Blue and red histograms were obtained excluding and including the measurements coming from the Milena (E14) and Doresa (E18) satellites, respectively. Solutions were achieved by using broadcast ephemeris.

Table 2.
RMS comparison between two scenarios (including or excluding the Milena (E14) and Doresa (E18) satellites) analyzed. Broadcast ephemeris was used. DRMS, Distance Root Mean Squared.
Figure 13 and Figure 14 show respectively the scatter plot of single-point position error and the time series of the vertical error, calculated by using precise SP3 ephemeris, for the E1, E5a, E5b, and E5 frequencies. These figures like Figure 10 and Figure 11 allow comparing the the solution accuracy when the Milena (E14) and Doresa (E18) satellites were included (red) or not (blue). Figure 15 shows the density histograms of the E1, E5a, E5b, and E5 single-point position coordinates’ error in the case of exclusion (blue) or inclusion (red) of the satellites with precise ephemeris. Unlike what is shown in Figure 12, when precise ephemerides were used, the inclusion of satellites did not worsen the accuracy. In fact, in the histograms, there was no decrease in the peak. The vertical error showed (as expected due to lower accuracy of vertical component solution) a larger and lower histogram than those of the other coordinates. Detailed results are reported in Table 3. Looking at the data shown in the table, we can say that, substantially, both the horizontal and the vertical accuracies remained stable; indeed, in some situations, they improved, as in the case of the E5b frequency for which the DRMS improved by almost 0.5 m.
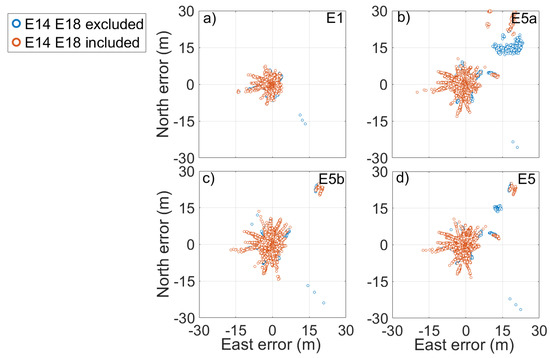
Figure 13.
Scatter plot of the E1, E5a, E5b, and E5 single-point position error reported in (a–d). Blue and red markers represent errors when the solution was obtained by using excluding and including the measurements coming from the Milena (E14) and Doresa (E18) satellites, respectively. Solutions were achieved by using precise SP3 ephemeris.
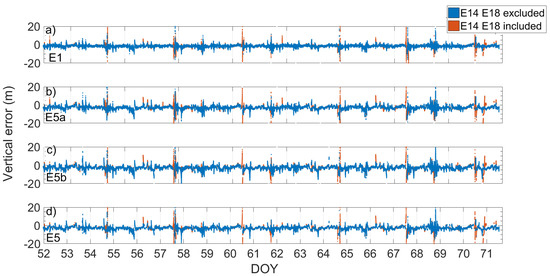
Figure 14.
E1, E5a, E5b, and E5 single-point position time series of the vertical error reported in (a–d). Blue and red markers represent errors when the solution was obtained by excluding or including the measurements coming from the Milena (E14) and Doresa (E18) satellites, respectively. The solution was achieved by using precise ephemeris.
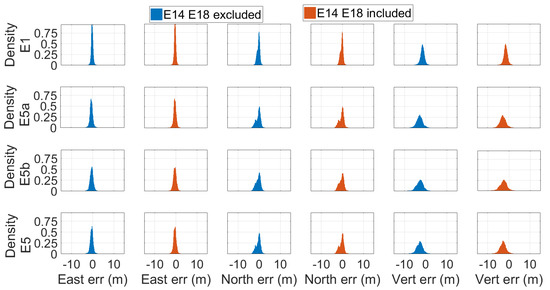
Figure 15.
Density histograms of the E1, E5a, E5b, and E5 single-point position coordinates’ error. Each line refers to a specific frequency: the first from above refers to the frequency E1, the second to E5a, the third to E5b, and the fourth to E5. Blue and red histograms were obtained excluding and including the measurements coming from the Milena (E14) and Doresa (E18) satellites, respectively. The solution was achieved by using precise ephemeris.

Table 3.
RMS comparison between two scenarios (including or excluding the Milena (E14) and Doresa (E18) satellites) analyzed. Precise ephemeris used.
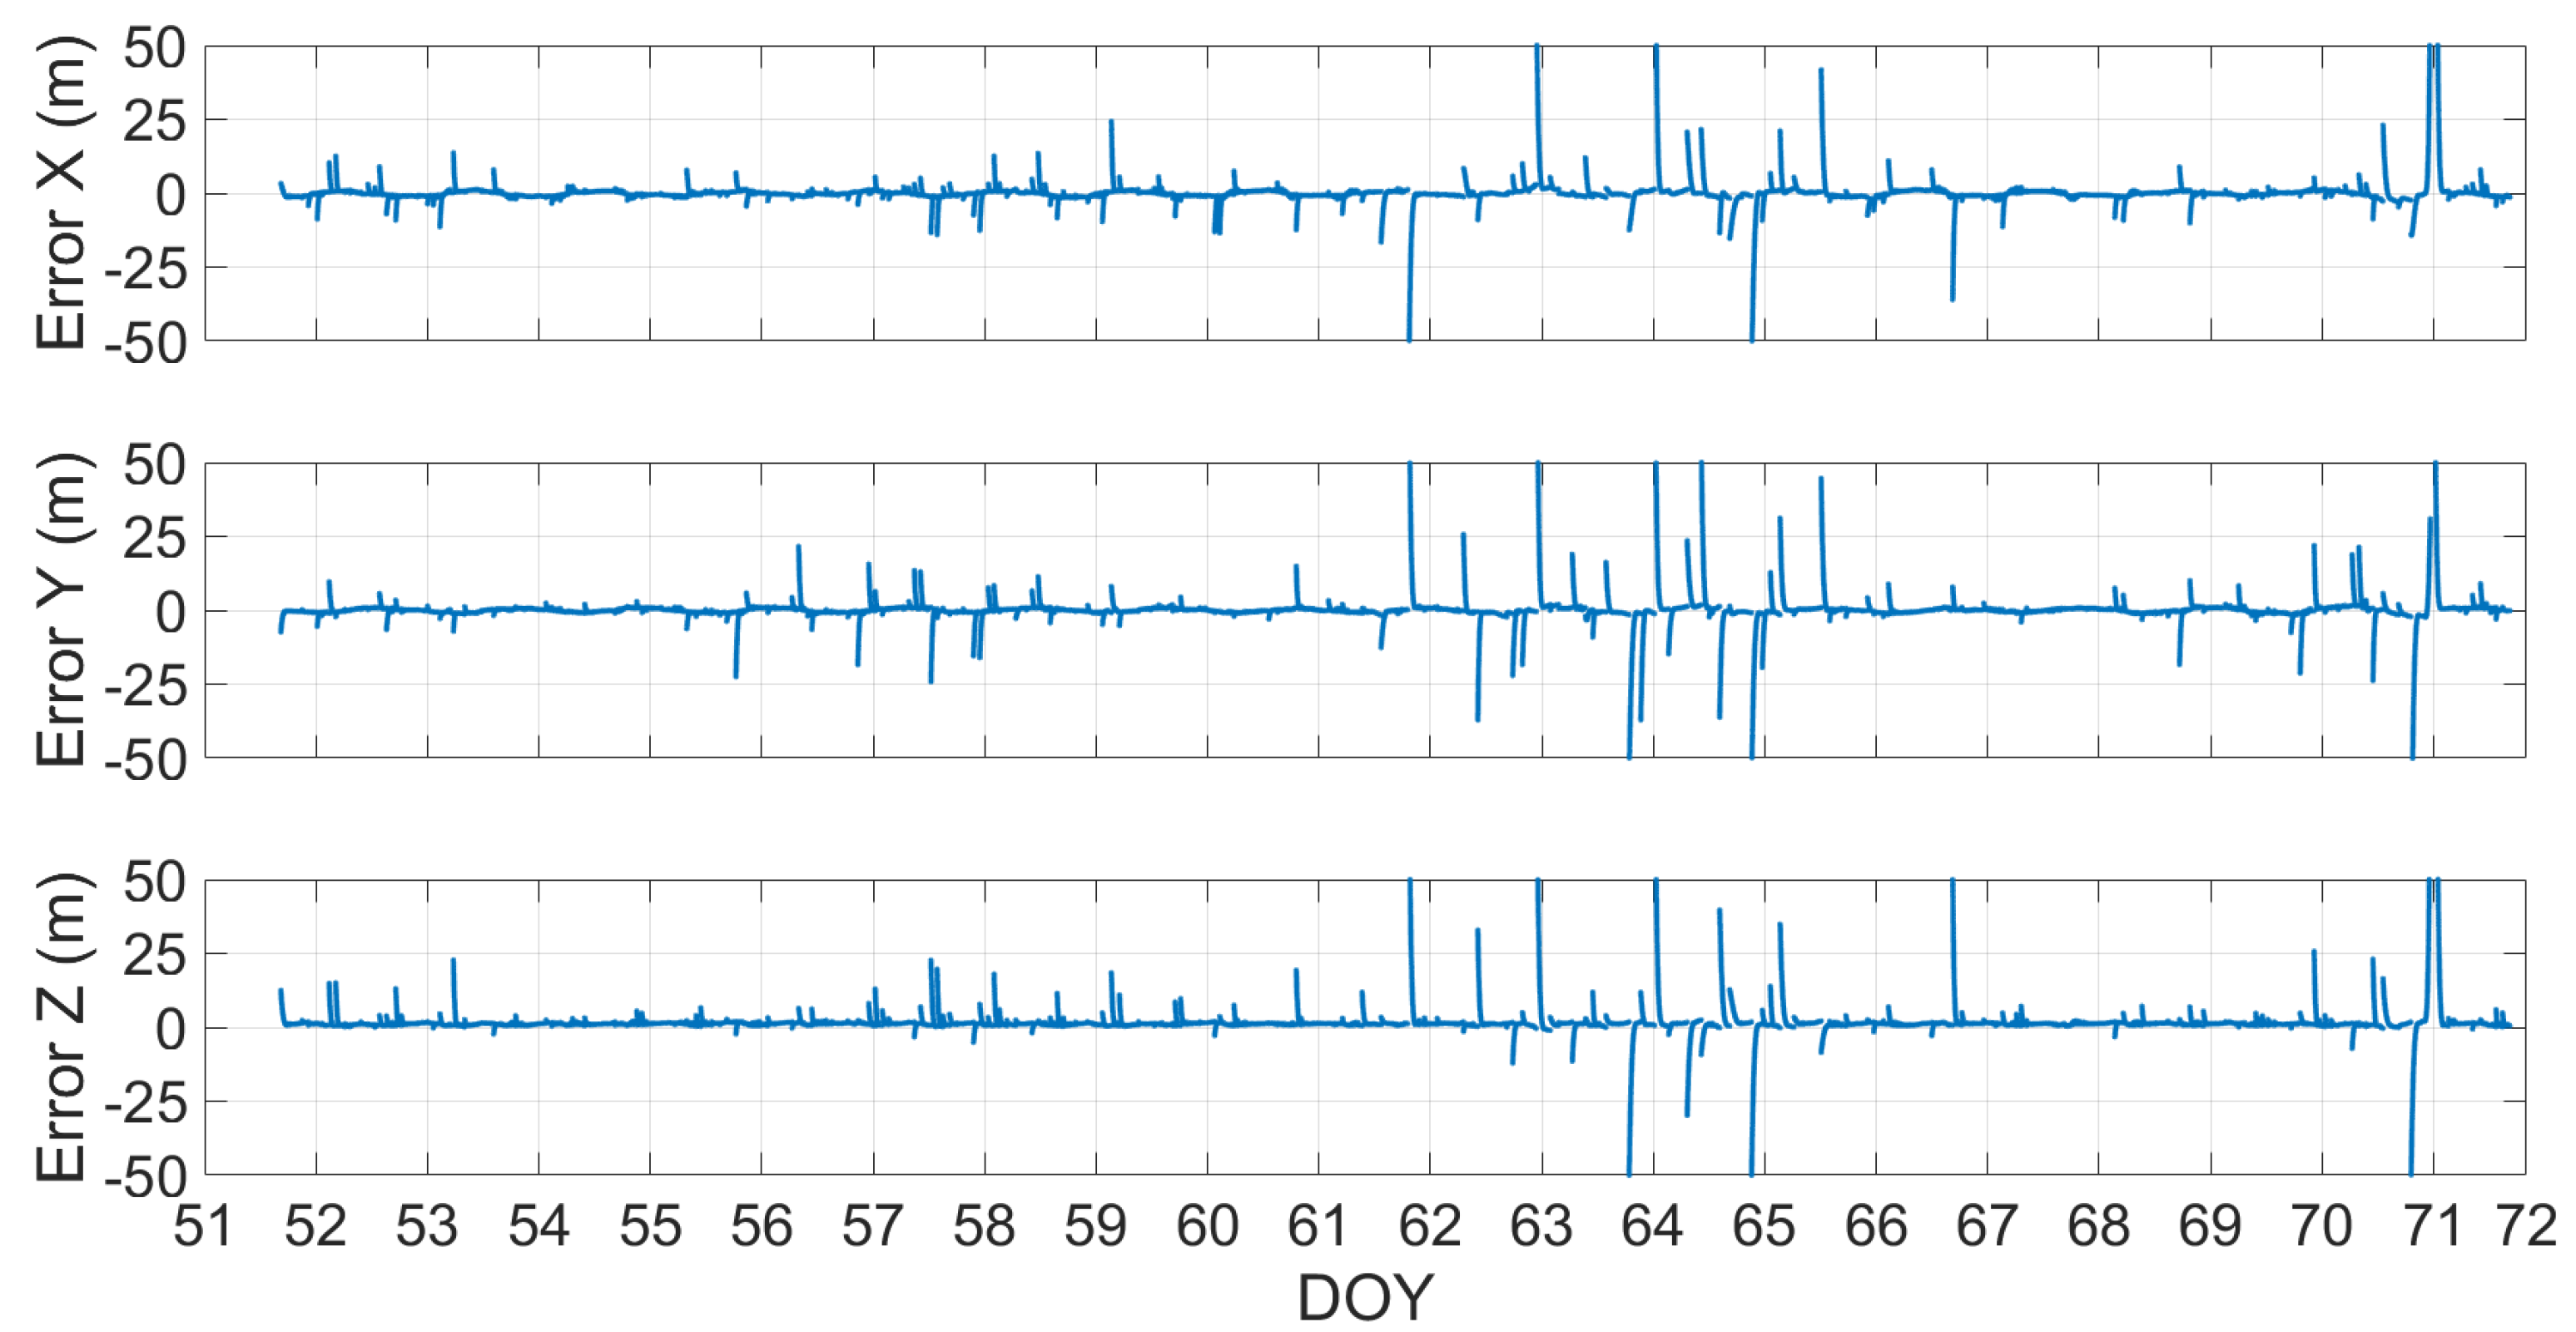
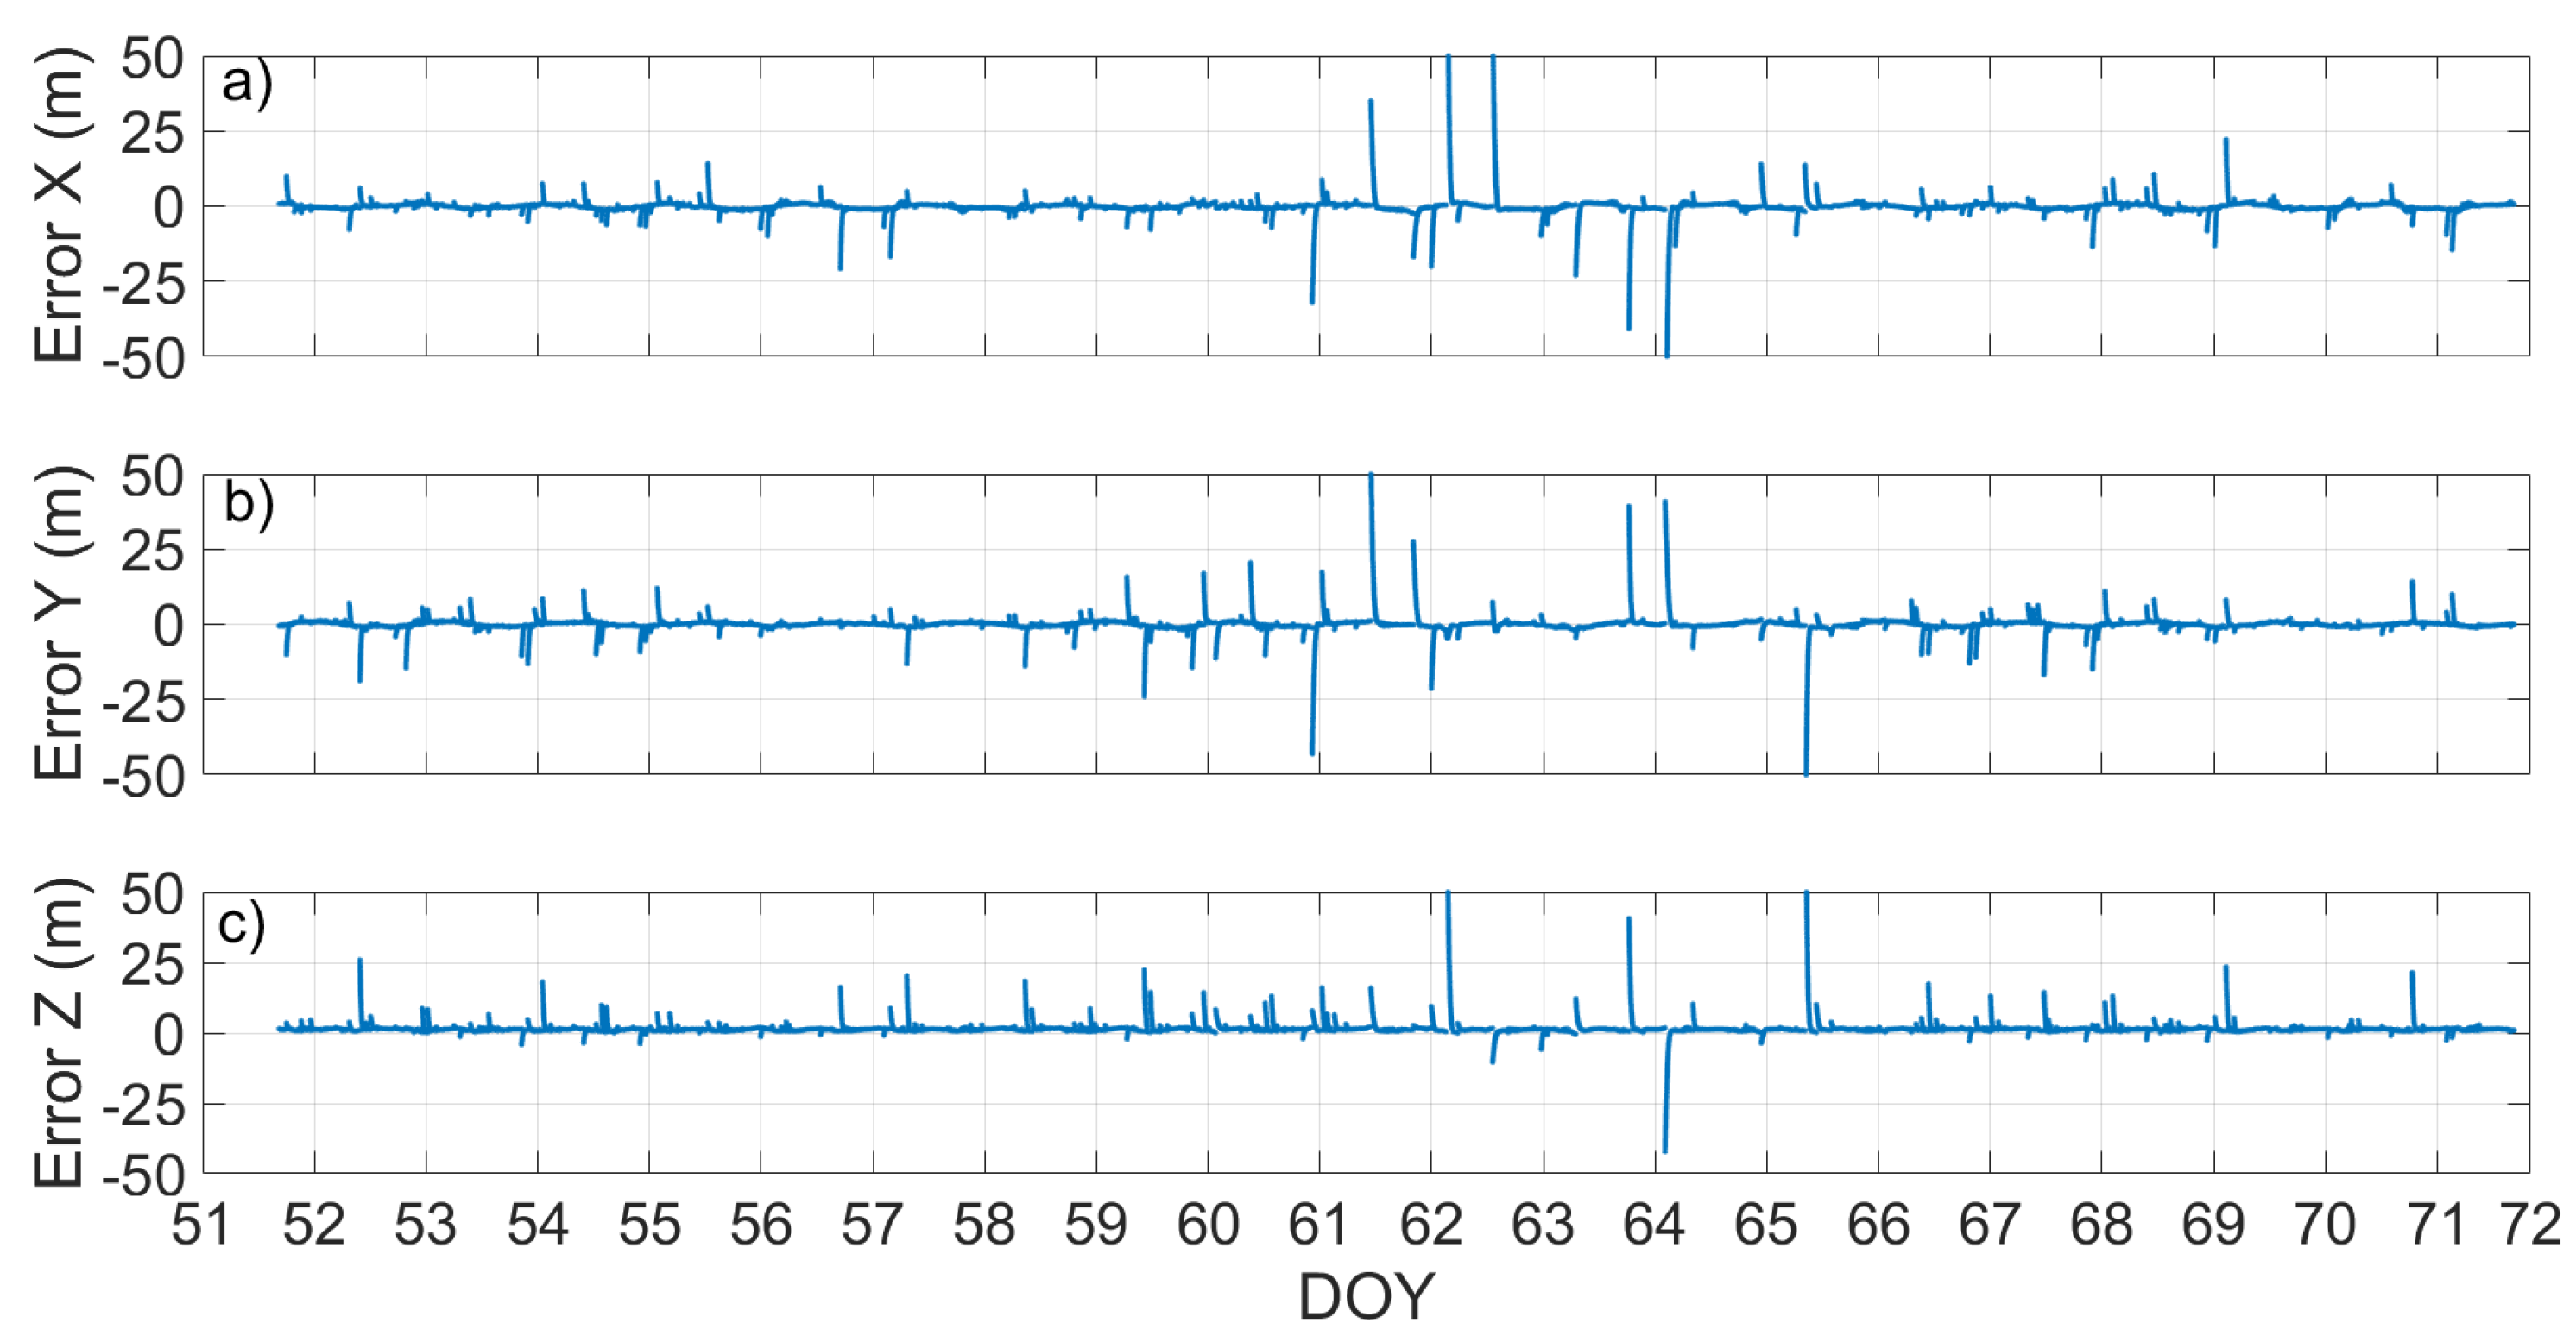
The results obtained indicated that the issue to overcame for the inclusion of the two satellites was related to the quality of their broadcast ephemerides. This drawback did not occur if sp3 precise orbits were used, whose goodness was verified by Sosnica et al. [14] and by Nicolini and Caporali [21]. Figure 16 and Figure 17 show the differences between the satellites’ coordinates calculated by using the precise ephemerides and those calculated by using broadcast ones for the Milena (E14) and Doresa (E18) satellite. As can be seen from the figures, for the three coordinates of both satellites, there were deviations that exceeded 50 m between those obtained using precise orbits and those obtained using the parameters transmitted in broadcast ephemerides.
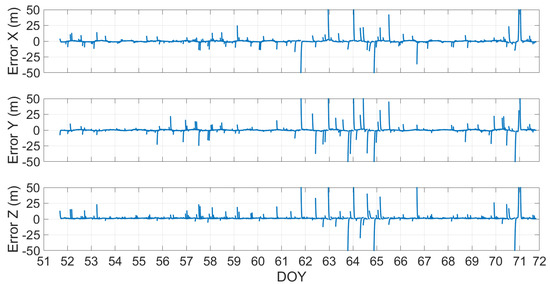
Figure 16.
Orbital error of the Milena (E14) satellite plotted versus time. The ticks on the x-axis are spaced 86,400 s (equal to one day); in this way, each tick corresponds to a day.
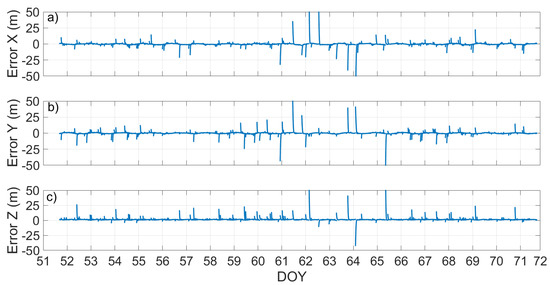
Figure 17.
Orbital error of the Doresa (E18) satellite plotted versus time. The ticks on the x-axis are spaced 86,400 s (equal to one day); in this way, each tick corresponds to a day.
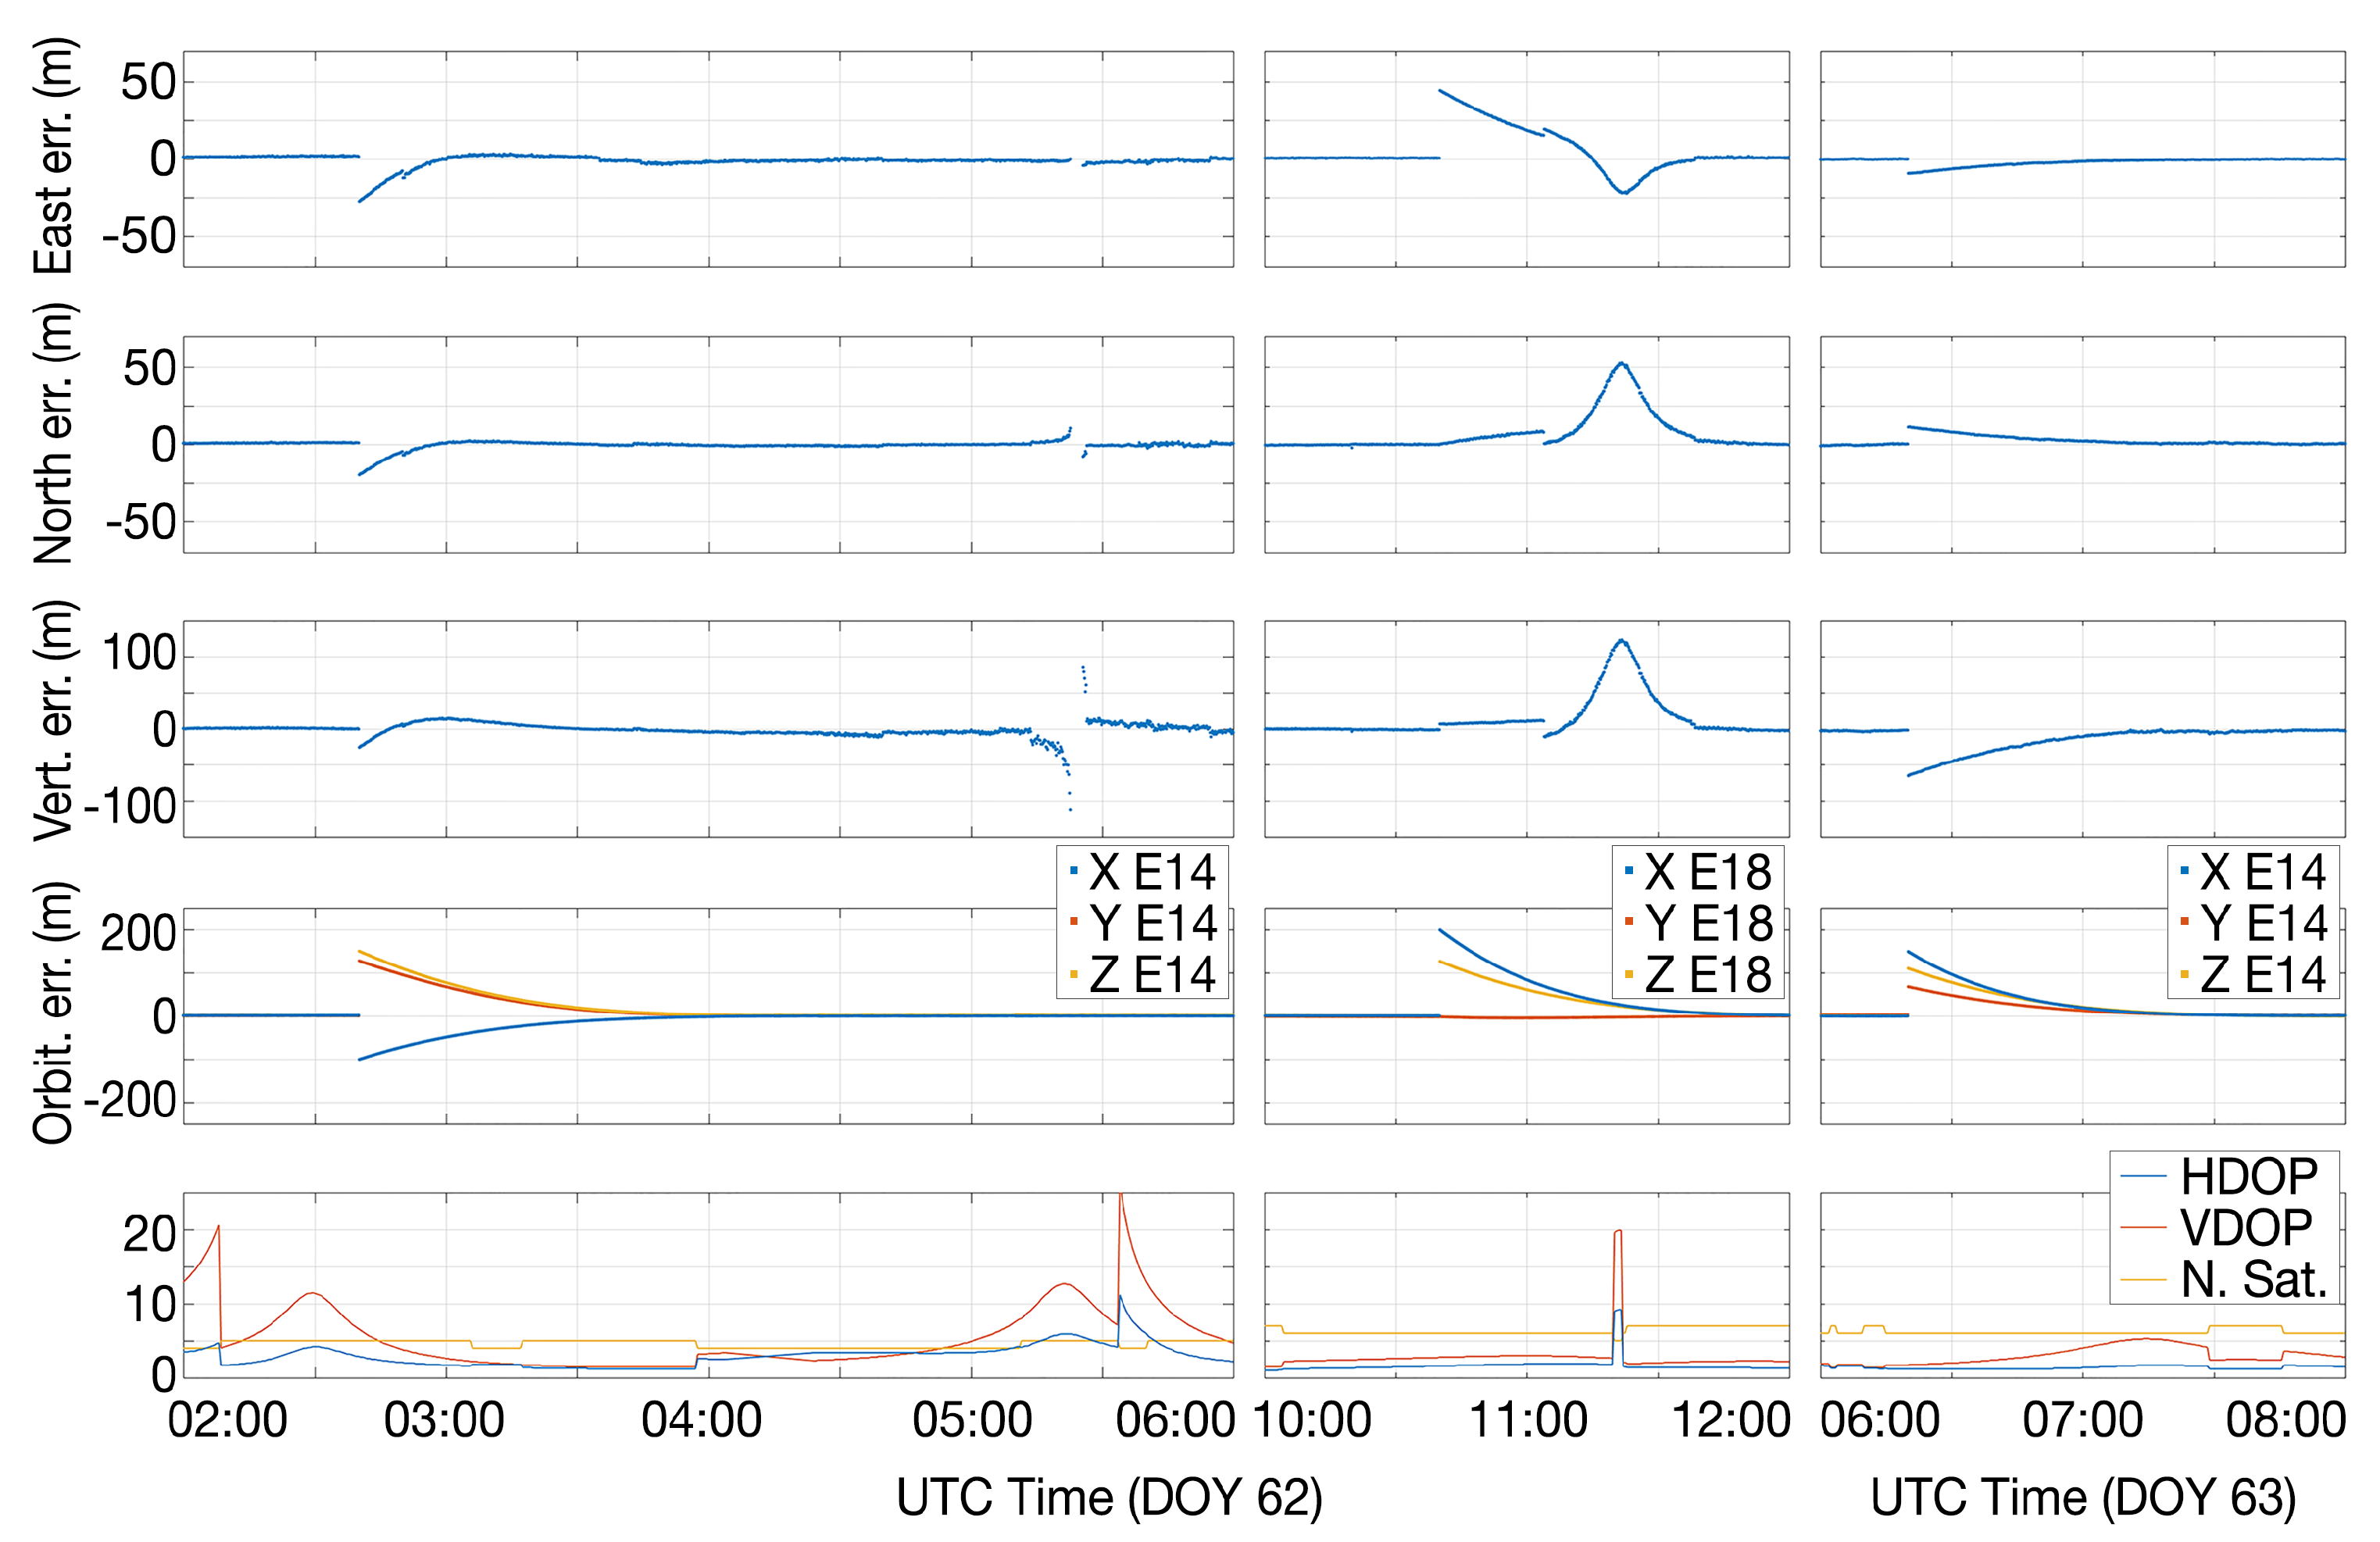
Figure 18 allows one to analyze the causes of the largest position errors by comparing the time series of errors with the HDOP and VDOP parameters, the number of visible satellites, and the orbital errors of the analyzed satellites. The analysis was performed in the three time intervals when the largest errors occurred. The time series of the east, north, and vertical error are reported respectively in the first, second, and third row of the figure. The fourth row shows the orbital errors of the E14 and E18 satellites, while the fifth row shows the time series of HDOP (blue), VDOP (red), and the number of visible satellites (yellow). Each column shows the data related to the same time interval. With regard to the first time interval (first column), the time series of the coordinate errors showed two peaks. The peak on the left was clearly due to the Milena ephemeris error, while the second was due to poor satellite geometry and the low number of visible satellites.
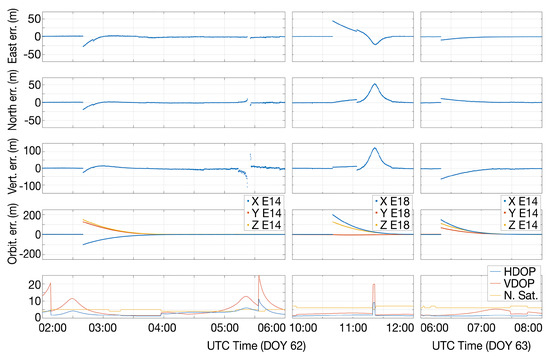
Figure 18.
Analysis of the causes of the largest position errors. The time series of errors on the east, north, and vertical coordinates are represented in the first, second, and third row, respectively. The fourth row shows the orbital errors of the E14 (first and third columns) and E18 (second column) satellites. Finally, the fifth row shows the time series of HDOP (blue), VDOP (red), and the number of visible satellites (yellow). Each column shows the data related to the same time interval.
Furthermore, the coordinate error of the second time series showed two peaks. This time, the first peak was due to the Doresa ephemeris error, while the second to the combination of this effect with the poor geometry.
Finally, the third time interval showed only one peak exclusively due to Milena ephemeris error, the DOP values being very good in those time instants.
4. Discussion
We analyzed and assessed how the inclusion of the Milena (E14) and Doresa (E18) satellites impacts the position domain accuracy. In order to achieve this goal, we used a dataset of 20 days of 1-Hz observations collected by a static receiver placed in the YEL2 IGS station. Two different scenarios were considered: the first excluded the measurements coming from the Milena (E14) and Doresa (E18) satellites, while the second one included these observations. First, the results related to the analysis of the signal-to-noise ratio are discussed, then those relative to system availability and DOP analysis and finally those relative to positioning accuracy achieved by using both broadcast and precise ephemeris. In the following are reported the main conclusion based on the experiments conducted.
- The evolution of the C/N0 of the E14 and E18 satellites was similar to that of the other FOC satellites in the YEL2 site. As expected, the Milena (E14) and Doresa (E18) satellites showed a higher C/N0 with respect to the other FOC satellites, confirming results shown in previous studies. This behavior was due to the lower altitude of Milena (E14) and Doresa (E18) caused by their elliptical orbit. The comparison between the carrier-to-noise density ratio (C/N0) at the different frequencies of the Milena (E14) and Doresa (E18) satellites revealed that for both satellites, the E5 signal had a C/N0 higher than the others. Starting from 40 degrees, it can be seen that the E5b signal had a C/N0 higher than the E5a signal and this higher than E1. For elevation angles lower than 30 degrees, the E1 signal showed a carrier-to-noise density ratio higher than E5b.
- As expected, the inclusion of the two satellites improved:
- -
- the system availability, varying it from 94.1–97.94%.
- -
- the GDOP, PDOP, HDOP, and VDOP parameters in each DOY analyzed;
- -
- the percentages of achieved positioning solutions by about 5% regardless of the frequency used.
- When the broadcast ephemerides were used, nevertheless, the above results of the inclusion of the satellites worsened both the horizontal and vertical accuracy of the solution. The deterioration of the horizontal accuracy went from 0.17 m with the E5a frequency measurements to 0.74 m with the E1 measurements. The reduction of vertical accuracy went from 0.68 m for the E5a to 1.2 m for the E1 measurements. This was not completely expected as both the HDOP and VDOP parameters decreased when these satellites were included in the solution calculation. However, if precise ephemerides are used instead of broadcast ones, both the horizontal and the vertical accuracy remained stable; actually, for the E5b frequency, the DRMS improved by almost 0.5 m.
The results achieved show that the real drawback to overcome in order to include the Milena (E14) and Doresa (E18) pseudorange measurements in the single-point positioning algorithms is related to the quality of the broadcast ephemeris. When precise ephemerides are used, we obtained a 5% increase in the number of solutions with an accuracy similar to that obtained when the satellites were excluded.
Author Contributions
The two authors contributed equally to this work.
Funding
This research received no external funding.
Acknowledgments
The authors gratefully acknowledge the IGS MultiGNSS Experiment (MGEX) for providing GNSS data and products.
Conflicts of Interest
The authors declare no conflict of interest.
References
- Available online: https://www.gsc-europa.eu/sites/default/files/NOTICE_ADVISORY_TO_Galileo_USERS_NAGU_2014014.txt (accessed on 23 November 2018).
- Navarro-Reyes, D.; Castro, R.; Bosch, P.R. Galileo first FOC launch: Recovery mission design. In Proceedings of the 25th International Symposium on Space Flight Dynamics ISSFD, Munich, Germany, 19–23 October 2015. [Google Scholar]
- Carlier, N.; Gülmüs, O. Spacecraft recovery operations conducted to the Galileo FOC-1 L3. In Proceedings of the 25th International Symposium on Space Flight Dynamics ISSFD, Munich, Germany, 19–23 October 2015. [Google Scholar]
- Pugliano, G.; Robustelli, U.; Rossi, F.; Santamaria, R. A new method for specular and diffuse pseudorange multipath error extraction using wavelet analysis. GPS Solut. 2016, 20, 499–508. [Google Scholar] [CrossRef]
- Robustelli, U.; Benassai, G.; Pugliano, G. Accuracy evaluation of Doresa and Milena Galileo satellites broadcast ephemerides. In Proceedings of the 2nd IEEE International Workshop on Metrology for the Sea, Bari, Italy, 8–10 October 2018. [Google Scholar] [CrossRef]
- Robustelli, U.; Benassai, G.; Pugliano, G. Signal in Space Error and Ephemeris Validity Time Evaluation of Milena and Doresa Galileo Satellites. Sensors 2019, 19, 1786. [Google Scholar] [CrossRef] [PubMed]
- Robustelli, U.; Pugliano, G. GNSS code multipath short time fourier transform analysis. Navi 2018, 65, 353–362. [Google Scholar] [CrossRef]
- Robustelli, U.; Pugliano, G. Code multipath analysis of Galileo FOC satellites by time-frequency representation. Appl. Geomat. 2018, 11, 69. [Google Scholar] [CrossRef]
- Robustelli, U.; Baiocchi, V.; Pugliano, G. Assessment of Dual Frequency GNSS Observations from a Xiaomi Mi 8 Android Smartphone and Positioning Performance Analysis. Electronics 2019, 8, 91. [Google Scholar] [CrossRef]
- Zaminpardaz, S.; Teunissen, P.J.G. Analysis of Galileo IOV + FOC signals and E5 RTK performance. GPS Solut. 2017, 21, 1855–1870. [Google Scholar] [CrossRef]
- Li, W.; Nadarajah, N.; Teunissen, P.J.; Khodabandeh, A.; Chai, Y. Array-aided single-frequency state-space RTK with combined GPS, Galileo, IRNSS, and QZSS L5/E5a observations. J. Surv. Eng. 2017, 143, 04017006. [Google Scholar] [CrossRef]
- Paziewski, J.; Sieradzki, R.; Wielgosz, P. On the applicability of Galileo FOC satellites with incorrect highly eccentric orbits: An evaluation of instantaneous medium-range positioning. Remote Sens. 2018, 10, 208. [Google Scholar] [CrossRef]
- Wang, K.; Khodabandeh, A.; Teunissen, P.J.G. Five-frequency Galileo long-baseline ambiguity resolution with multipath mitigation. GPS Solut. 2018, 22, 75. [Google Scholar] [CrossRef]
- Sosnica, K.; Prange, L.; Kazmierski, K.; Bury, G.; Drozdzewski, M.; Zajedel, R.; Hadas, T. Validation of Galileo orbits using SLR with a focus on satellites launched into incorrect orbital planes. J. Geod. 2018, 92, 131–148. [Google Scholar] [CrossRef]
- ESA. European Union. Galileo Open Service. Available online: http://www.esa.int/Our_Activities/Navigation/Galileo/What_is_Galileo (accessed on 23 April 2019).
- Kaplan, E.D.; Hegarty, C. Understanding GPS/GNSS: Principles and Applications, 3rd ed.; Artech House: Norwood, MA, USA, 2017. [Google Scholar]
- Strang, G.; Borre, K. Linear Algebra, Geodesy, and GPS; Wellesley-Cambridge Press: Wellesley, MA, USA, 1997. [Google Scholar]
- Langley, R. Diluition of precision. GPS World 1999, 10, 52–59. [Google Scholar]
- Dow, J.M.; Neilan, R.E.; Rizos, C. The International GNSS Service in a changing landscape of Global Navigation Satellite Systems. J. Geod. 2009, 83, 191–198. [Google Scholar] [CrossRef]
- IGS. Current IGS Definition. Available online: https://kb.igs.org/hc/en-us/articles/202011433-Current-IGS-Site-Guidelines (accessed on 23 April 2019).
- Nicolini, L.; Caporali, A. Investigation on Reference Frames and Time Systems in Multi-GNSS. Remote Sens. 2018, 10, 80. [Google Scholar] [CrossRef]
© 2019 by the authors. Licensee MDPI, Basel, Switzerland. This article is an open access article distributed under the terms and conditions of the Creative Commons Attribution (CC BY) license (http://creativecommons.org/licenses/by/4.0/).

