Monitoring Land Surface Displacement over Xuzhou (China) in 2015–2018 through PCA-Based Correction Applied to SAR Interferometry


 ,
,
Abstract
1. Introduction
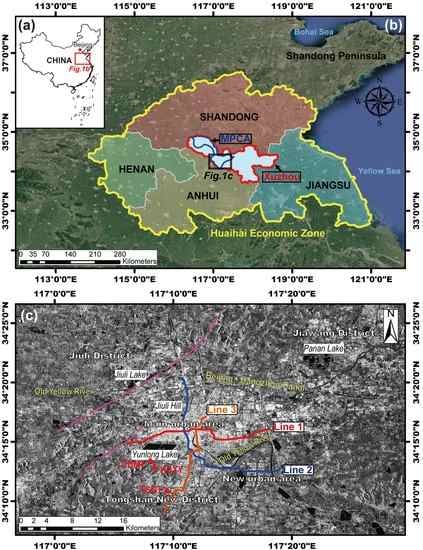
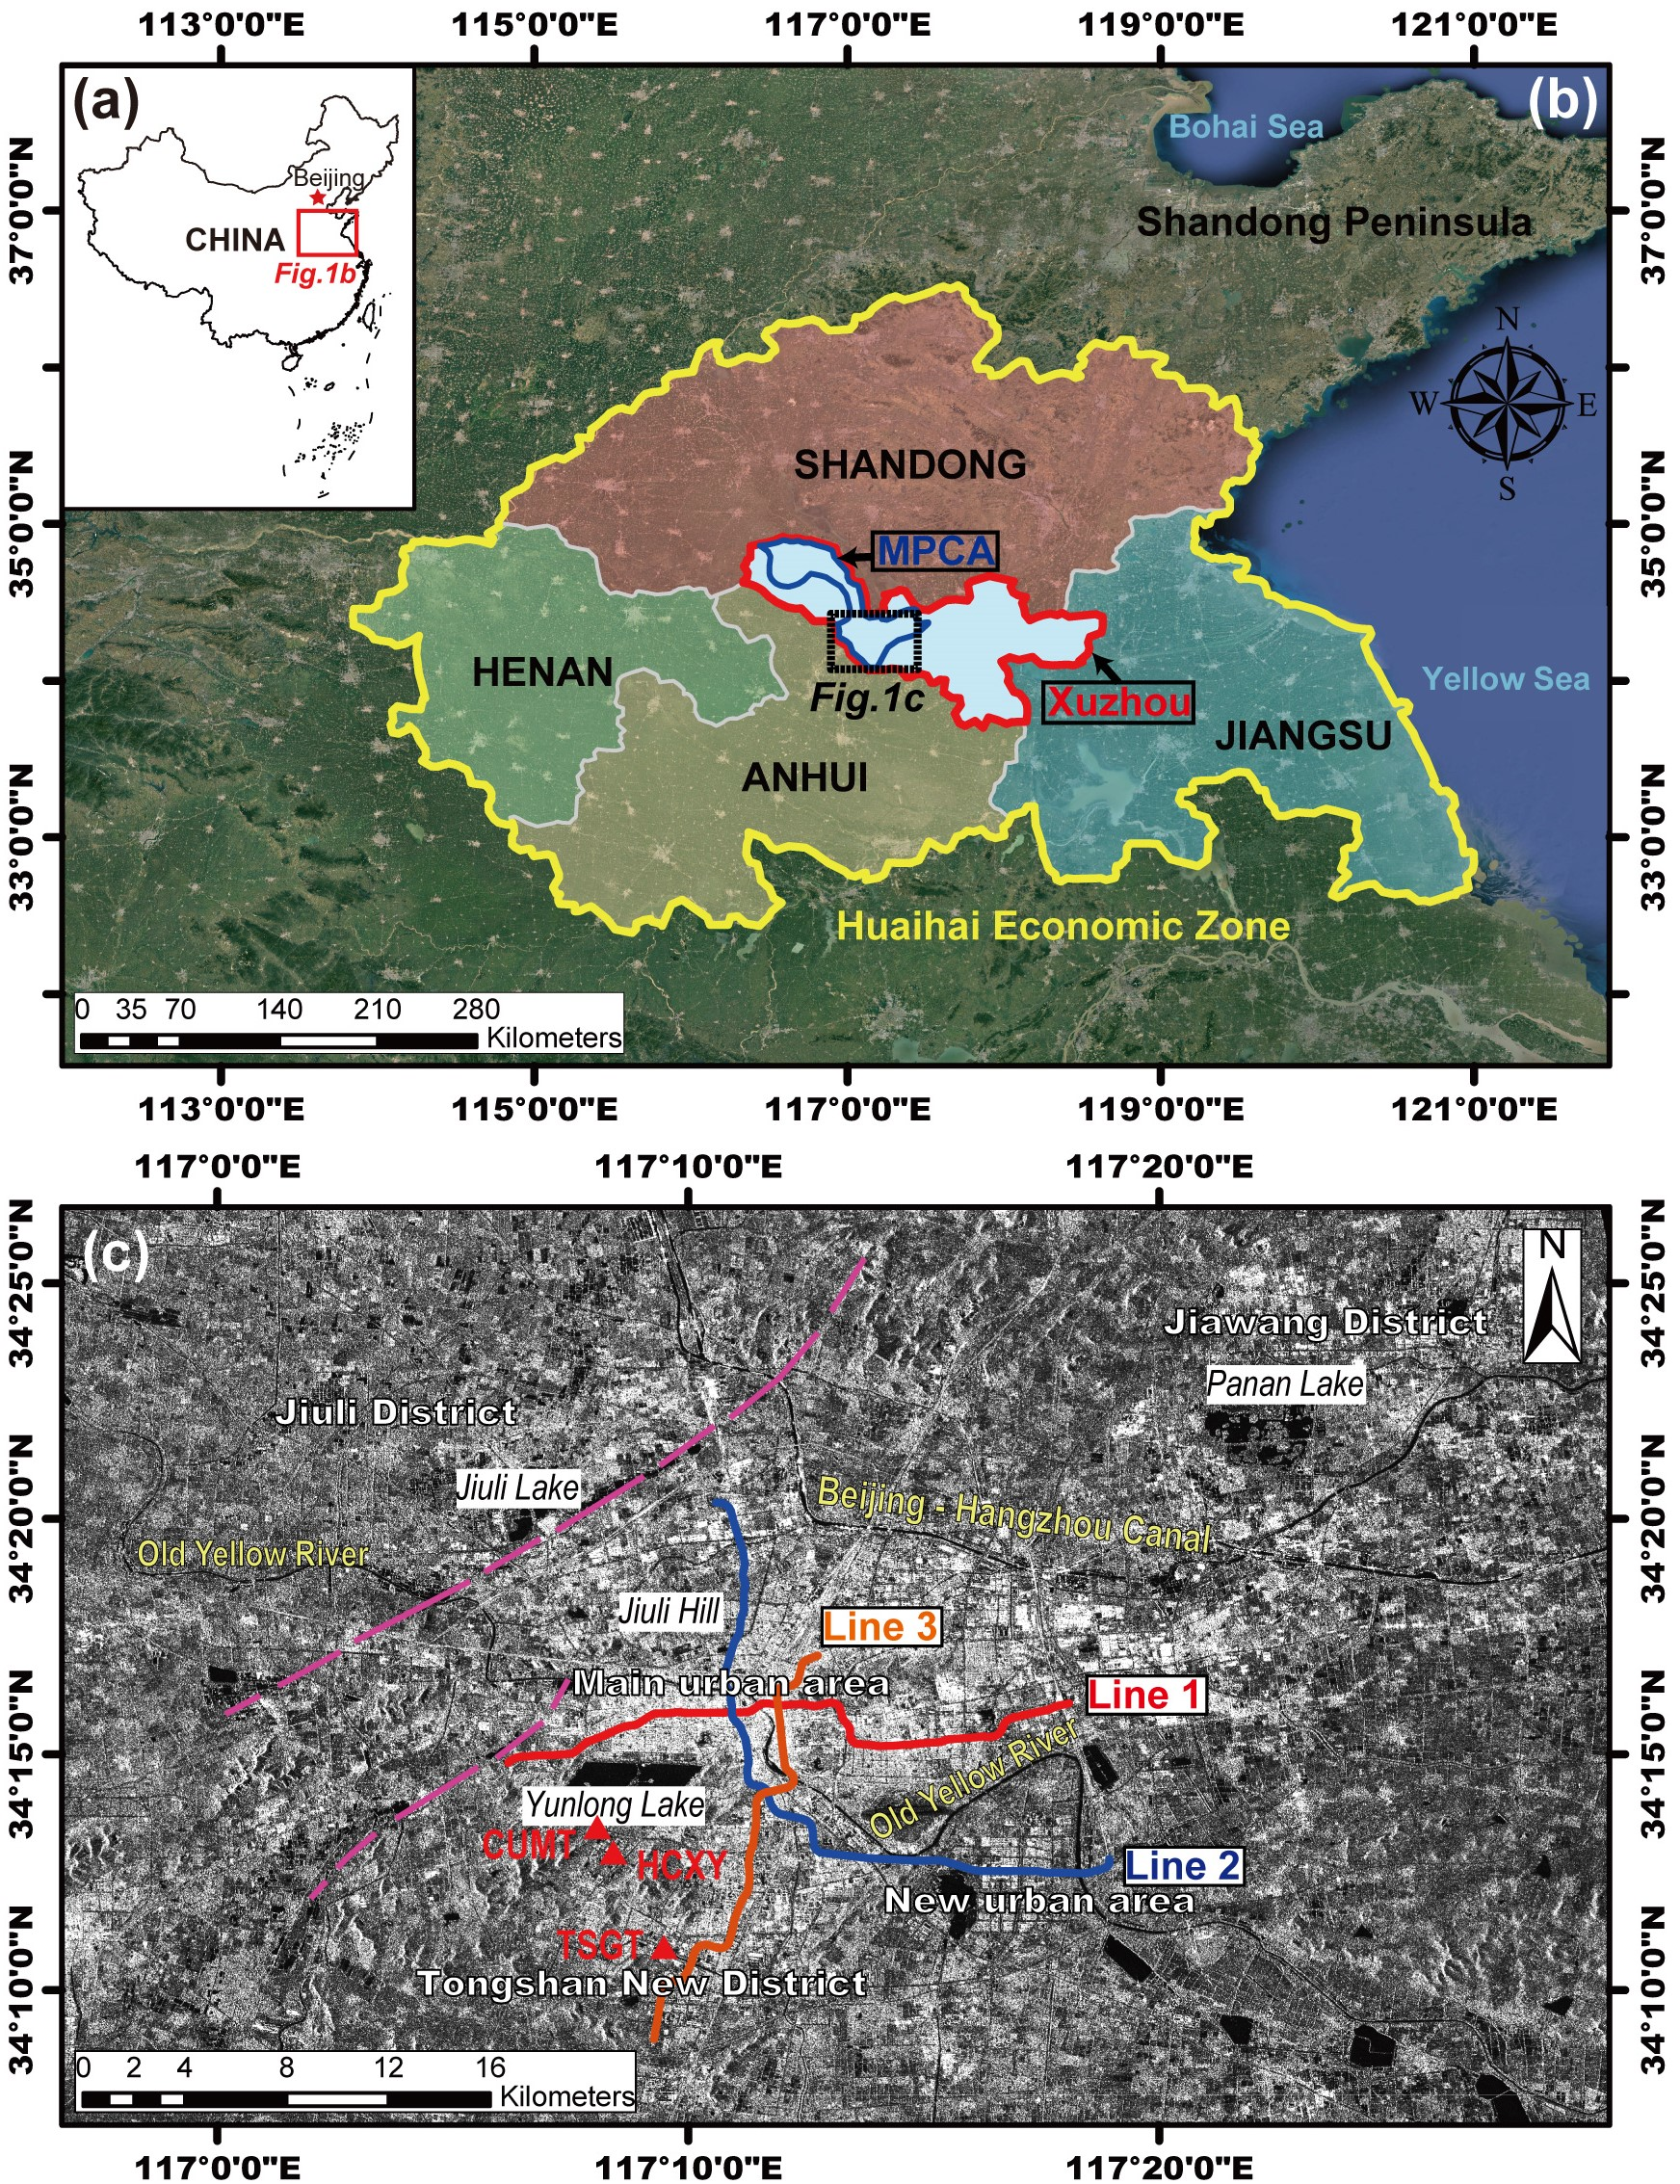
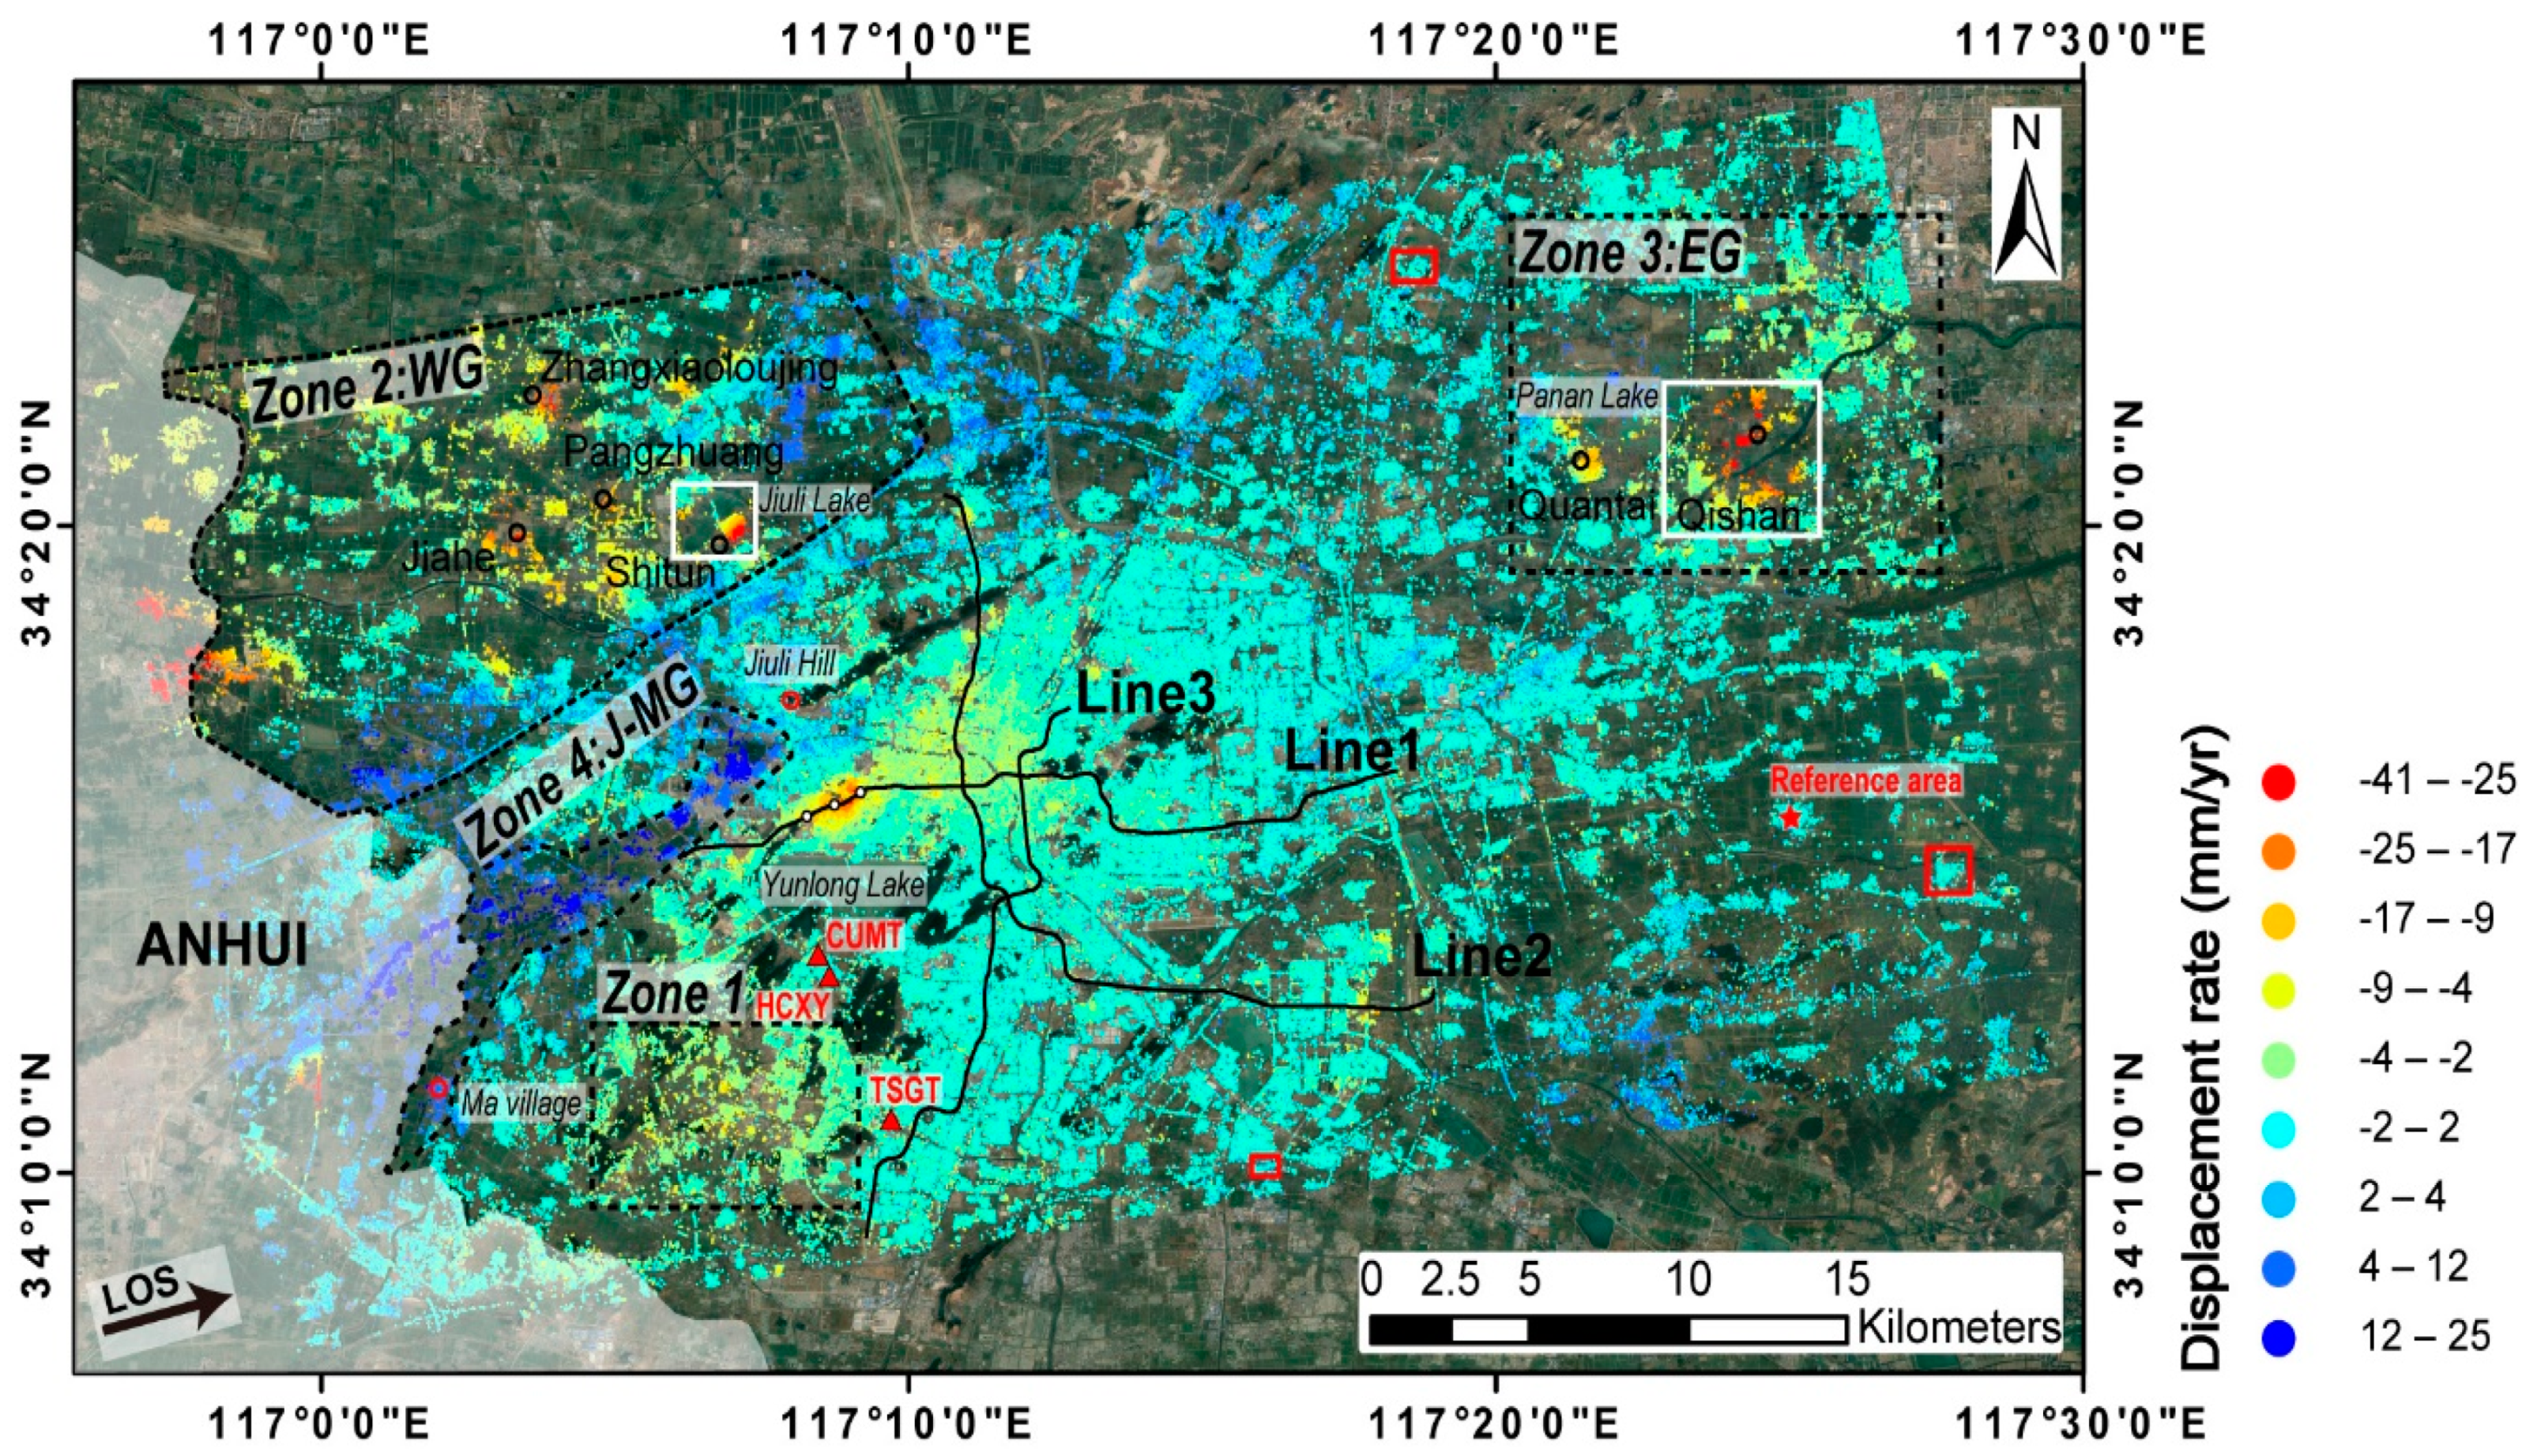
2. Study Area
3. Dataset and Methodology
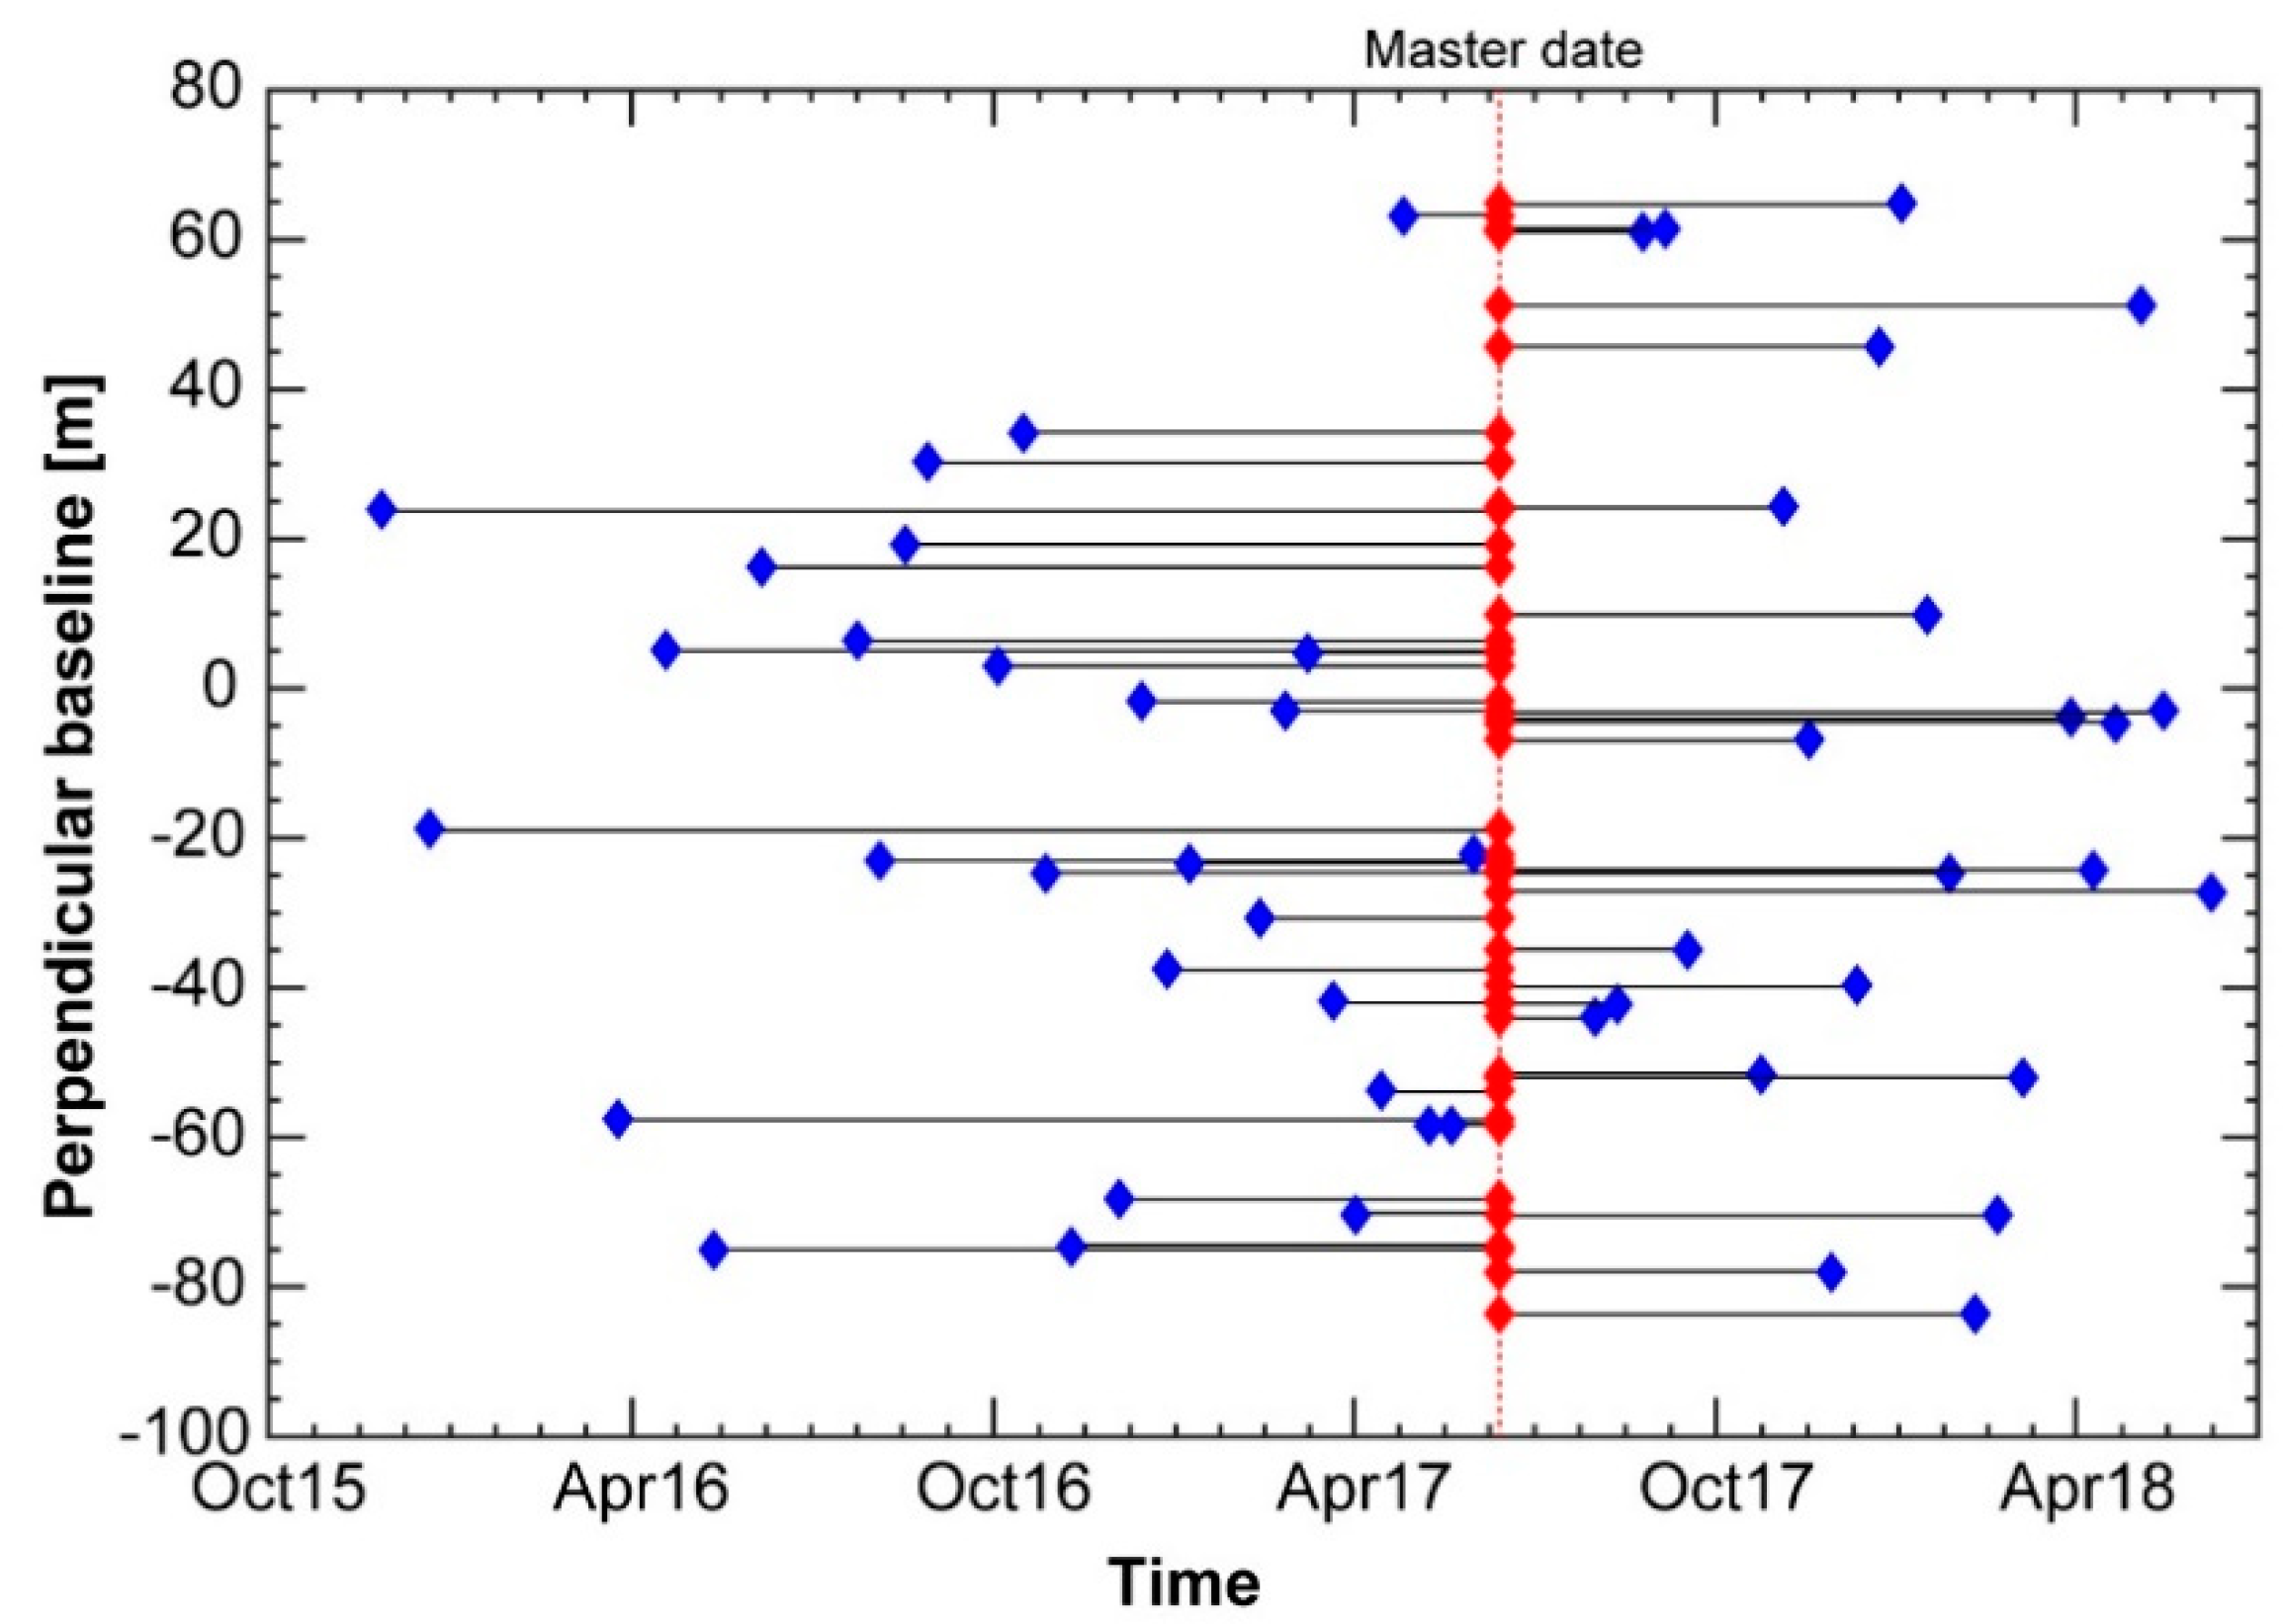
3.1. Dataset
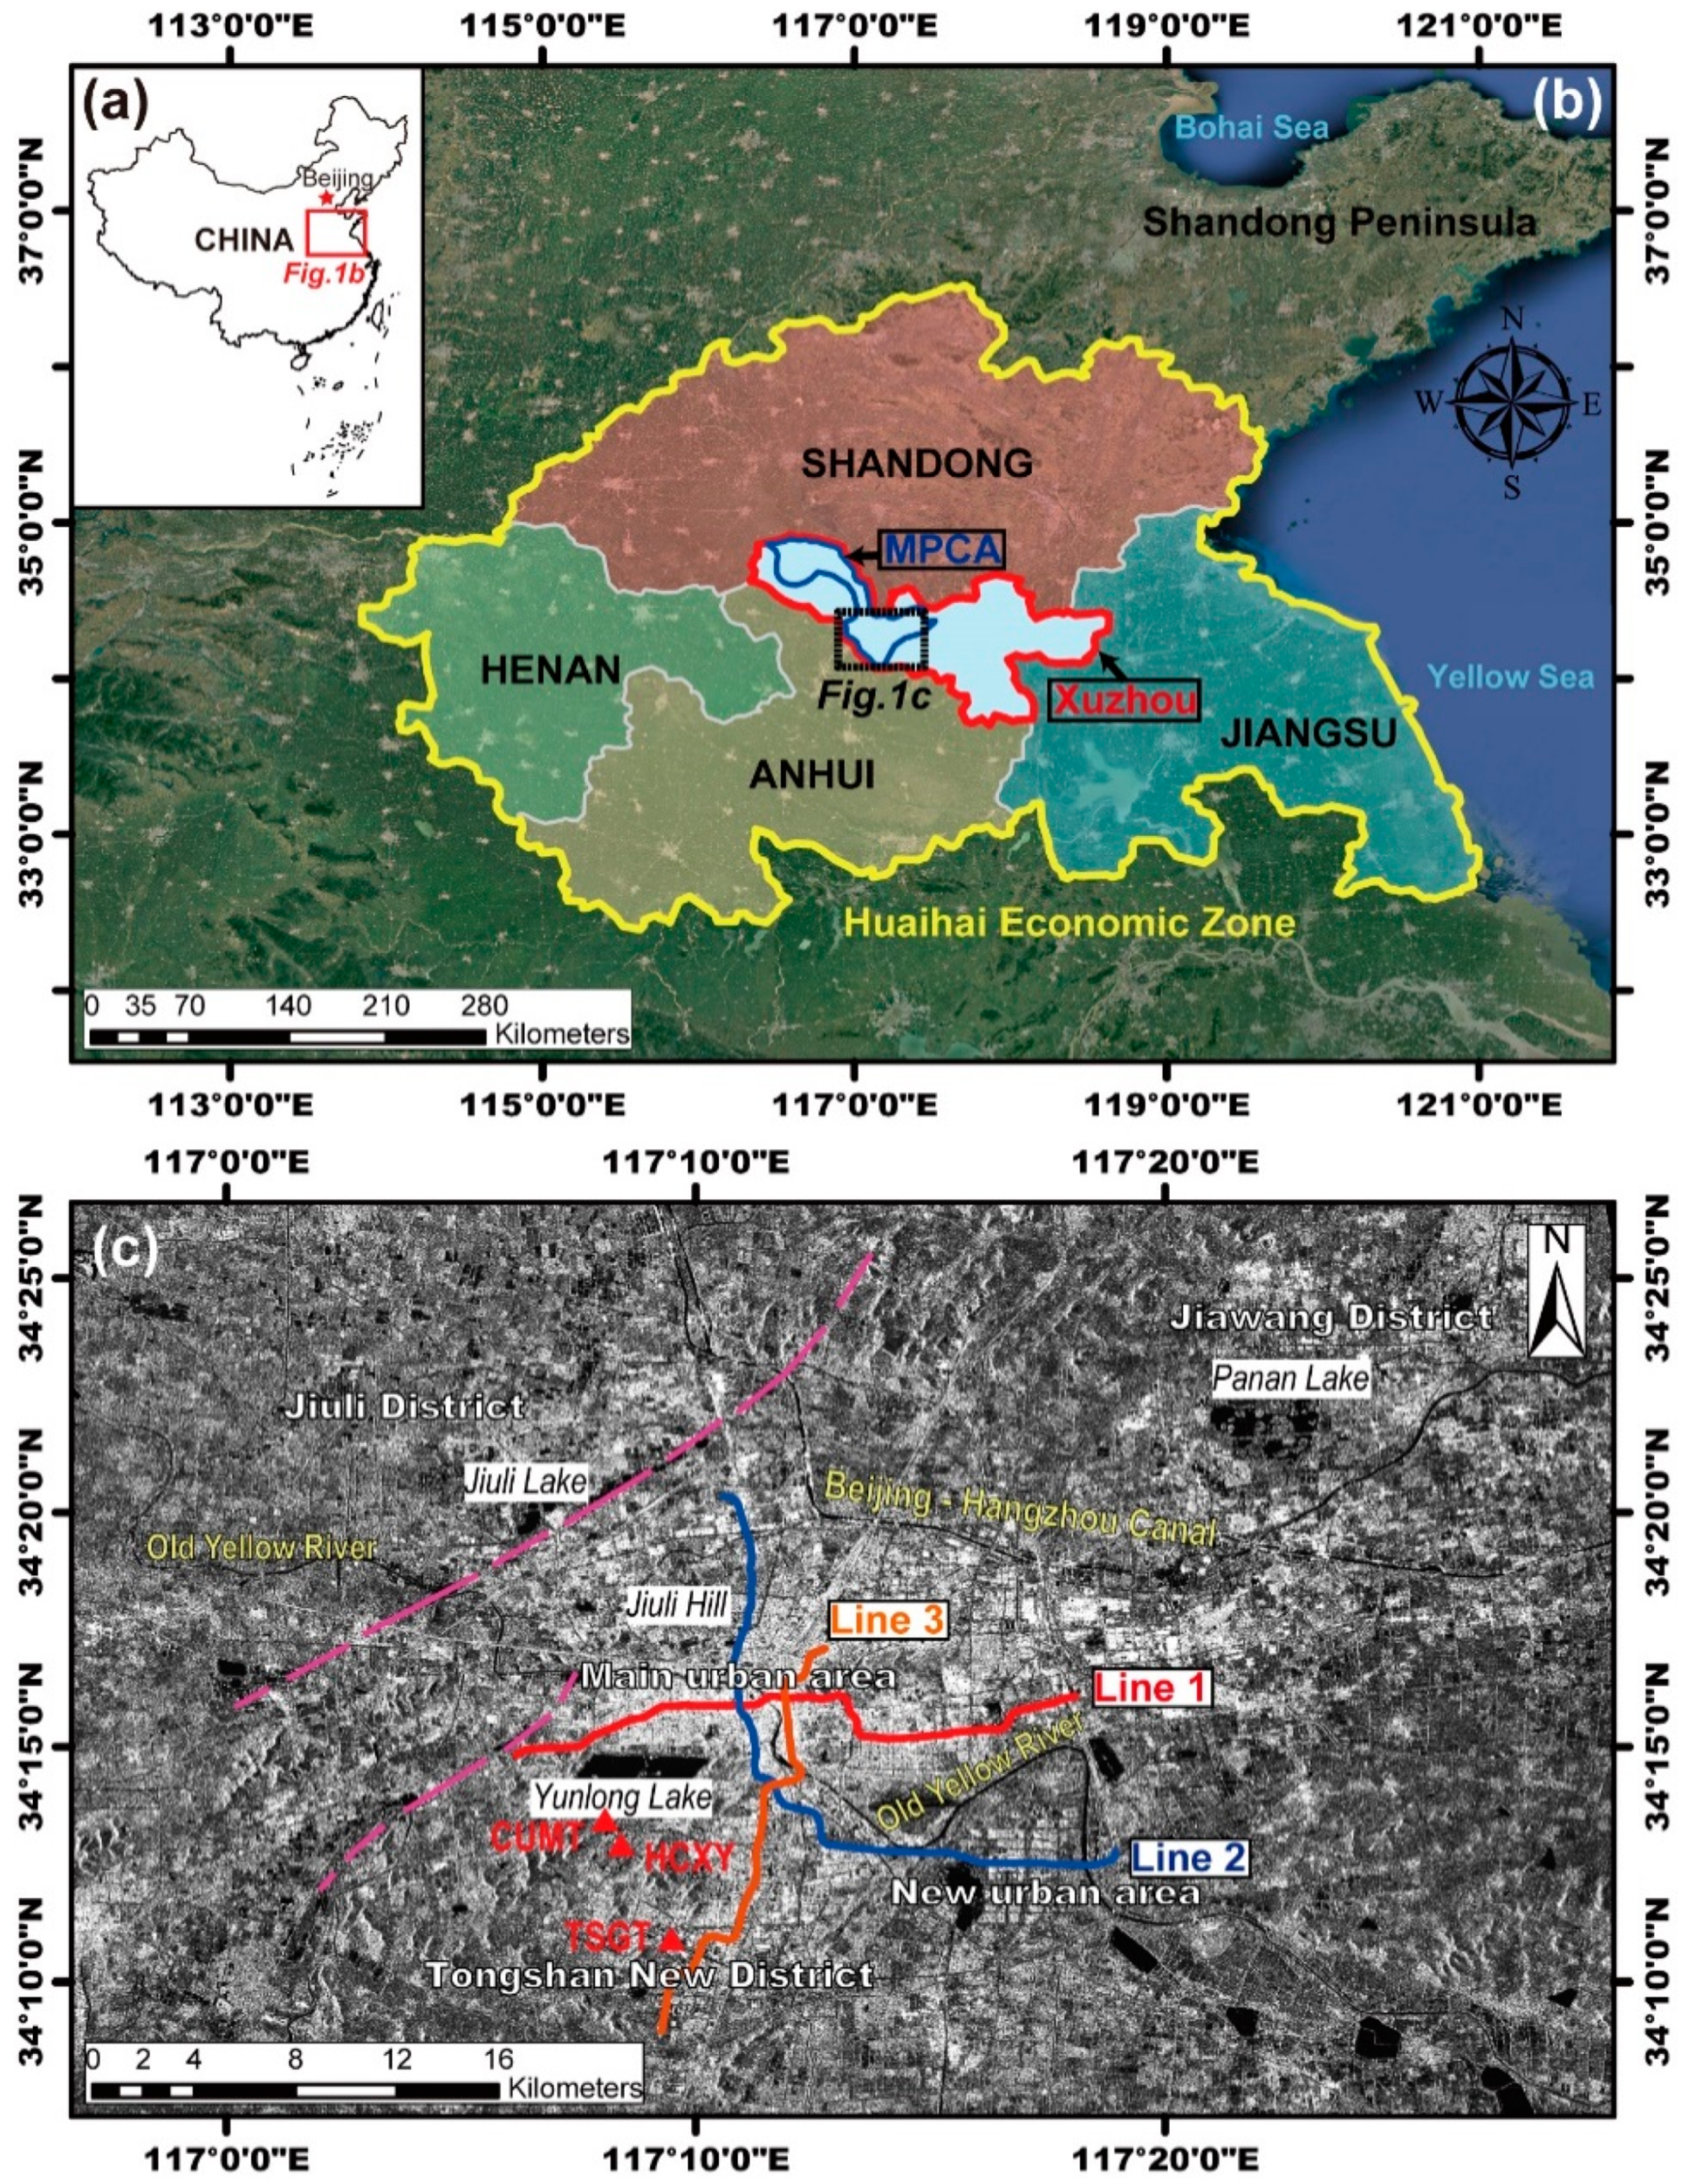
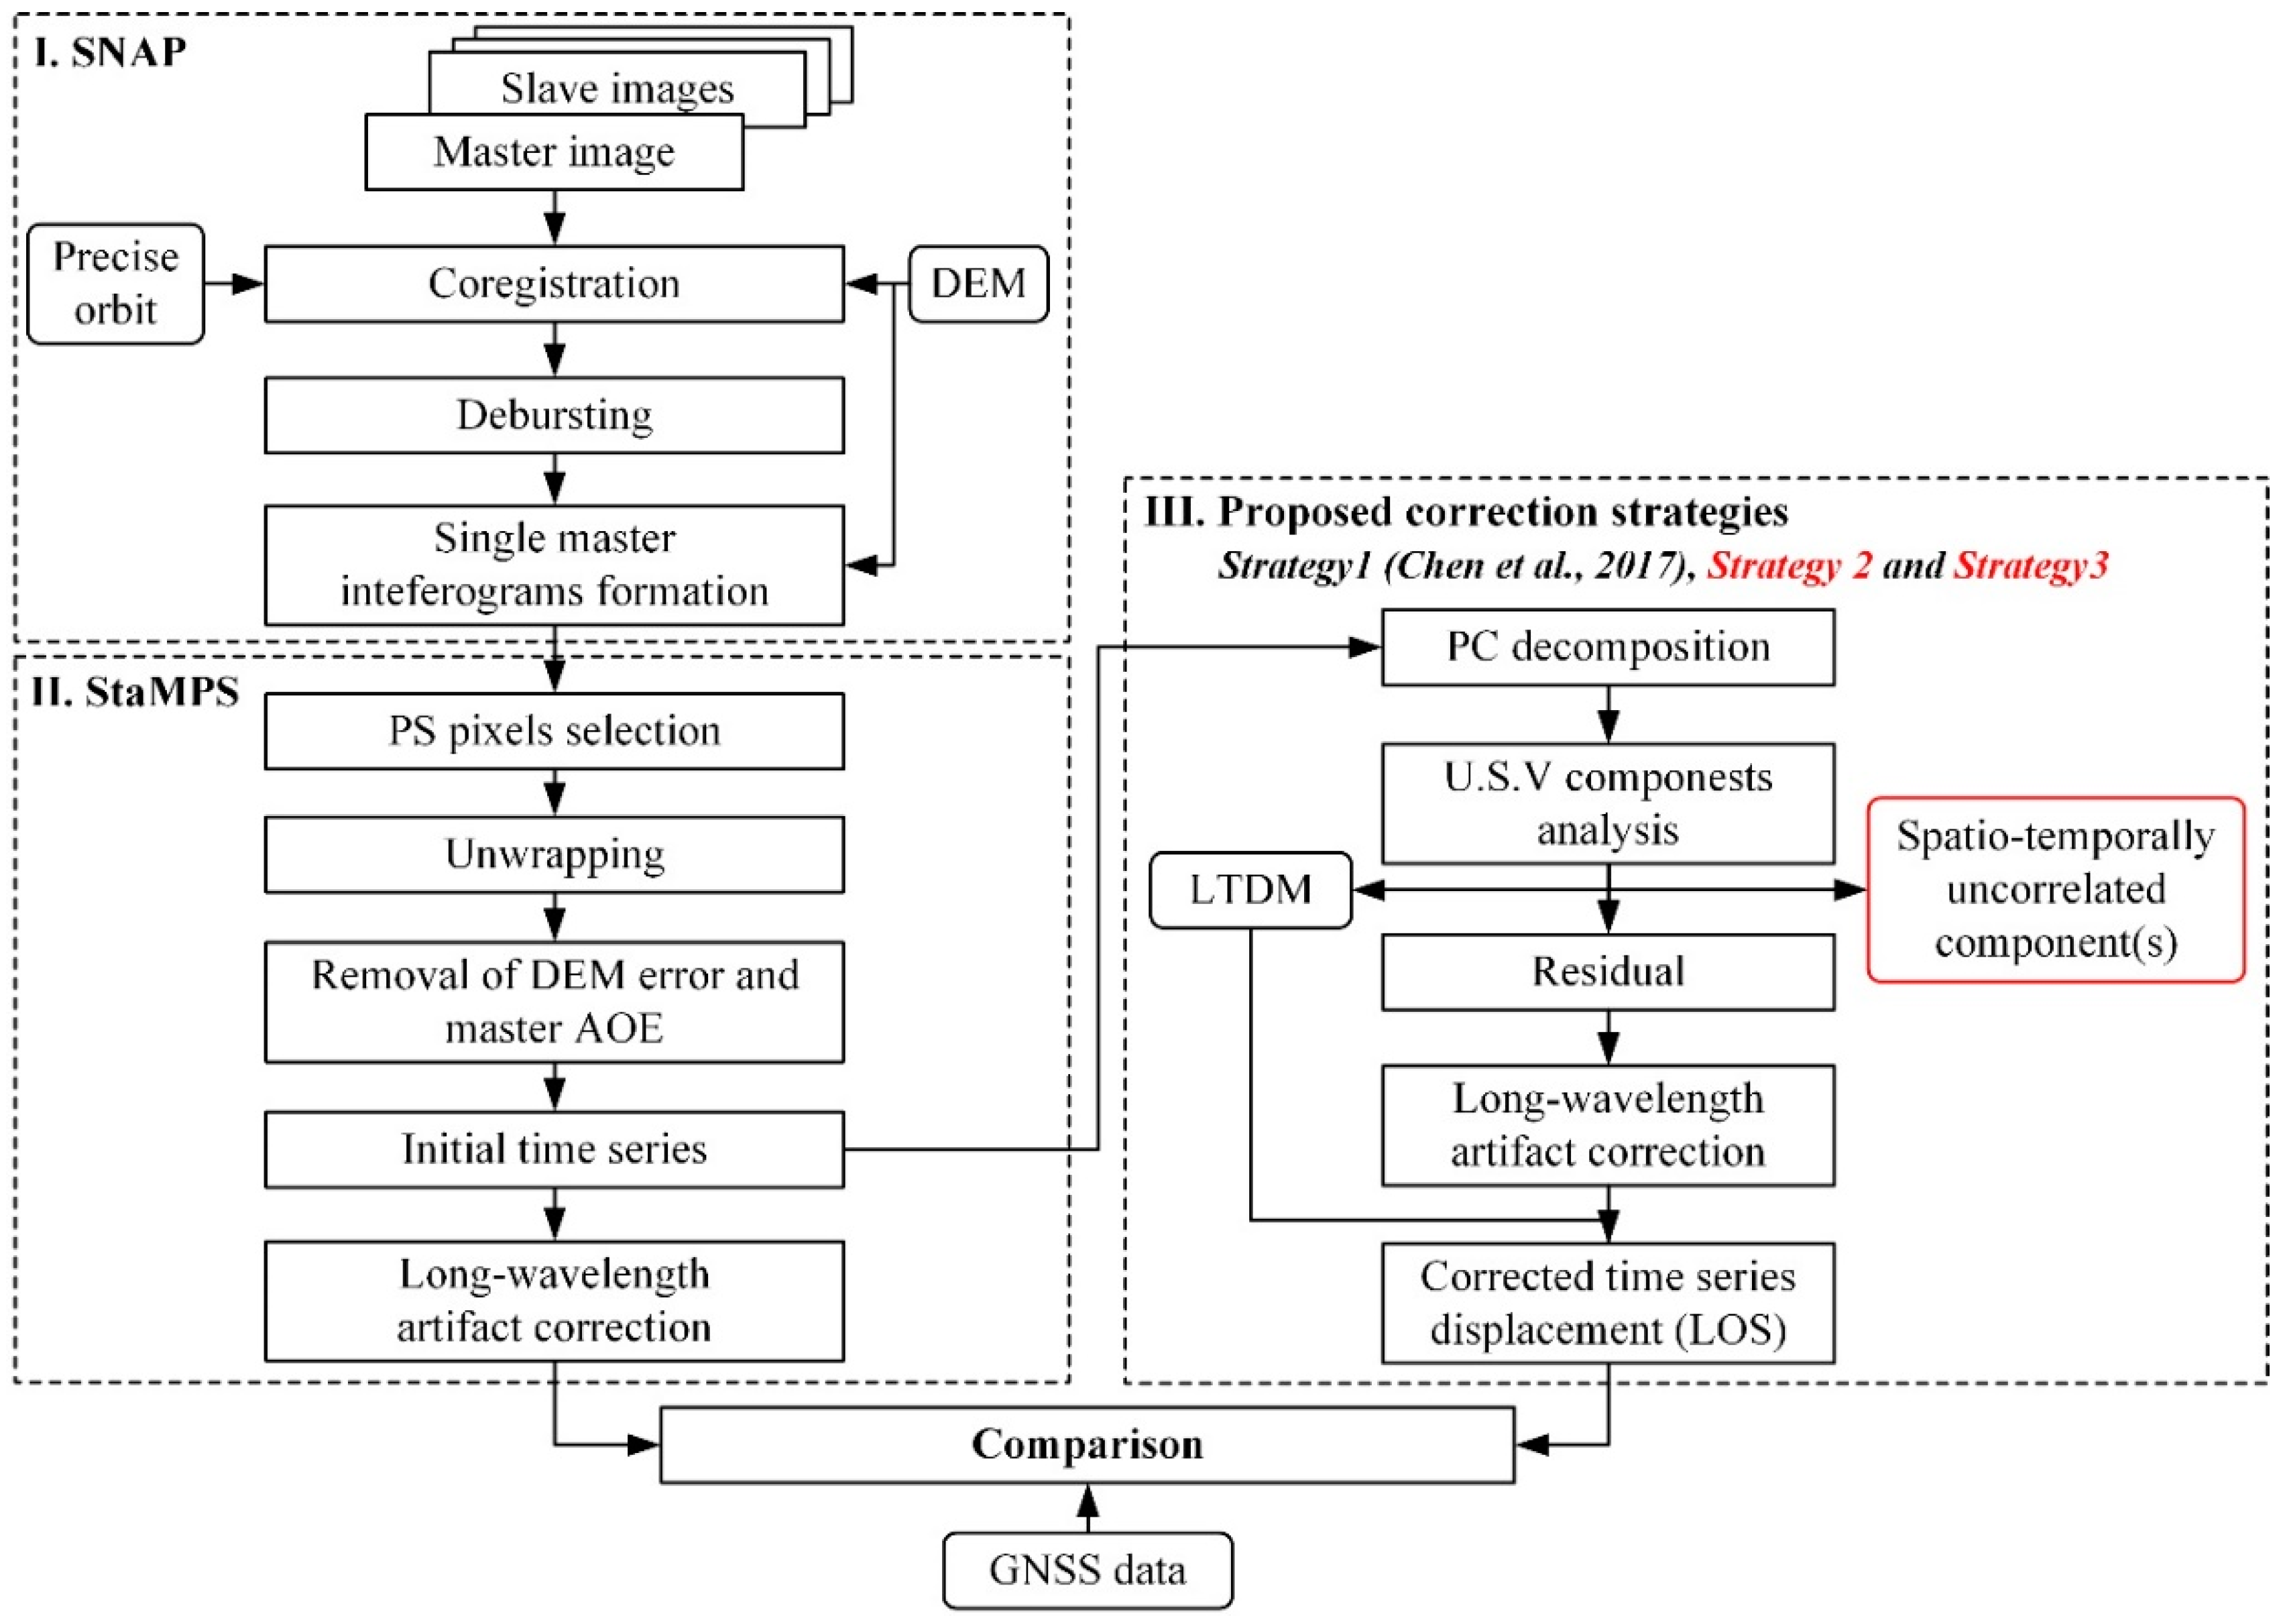
3.2. Methodology
3.2.1. Initial InSAR Time Series Generation
3.2.2. InSAR Signal Analysis Based on PC Decomposition
3.2.3. Purification of Time Series Displacement
4. Results
4.1. Displacement Rate Analysis
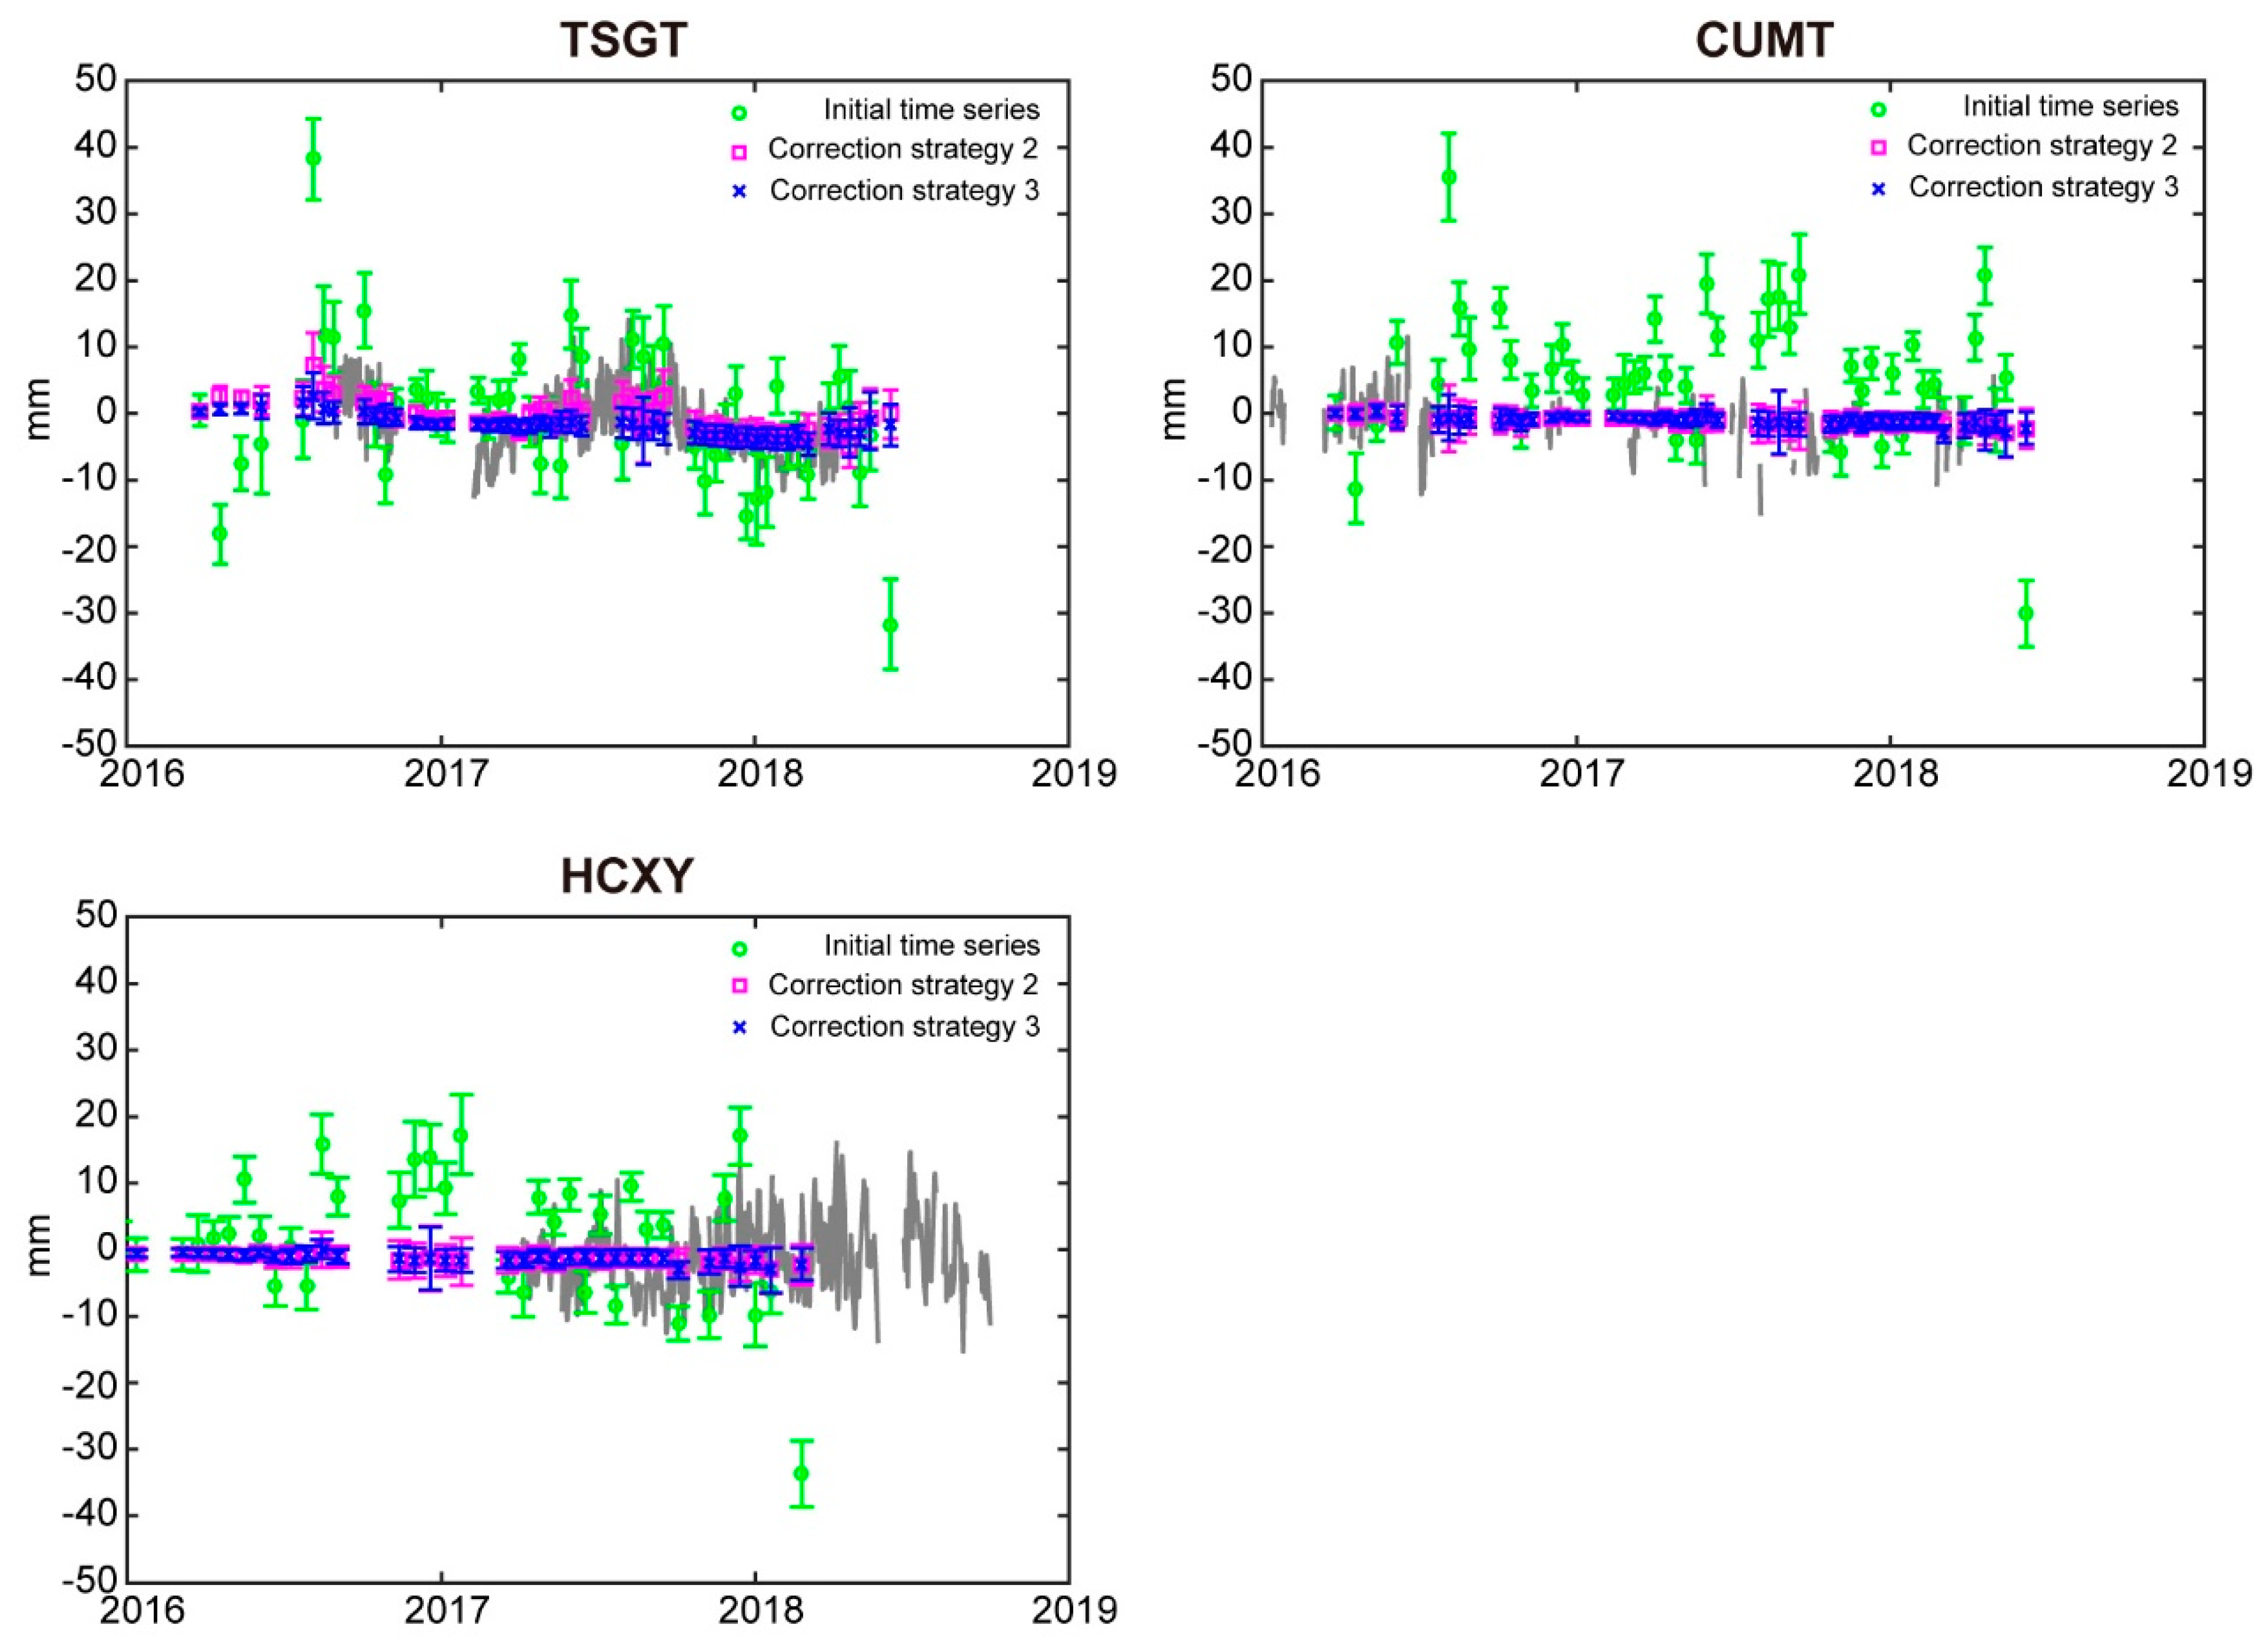
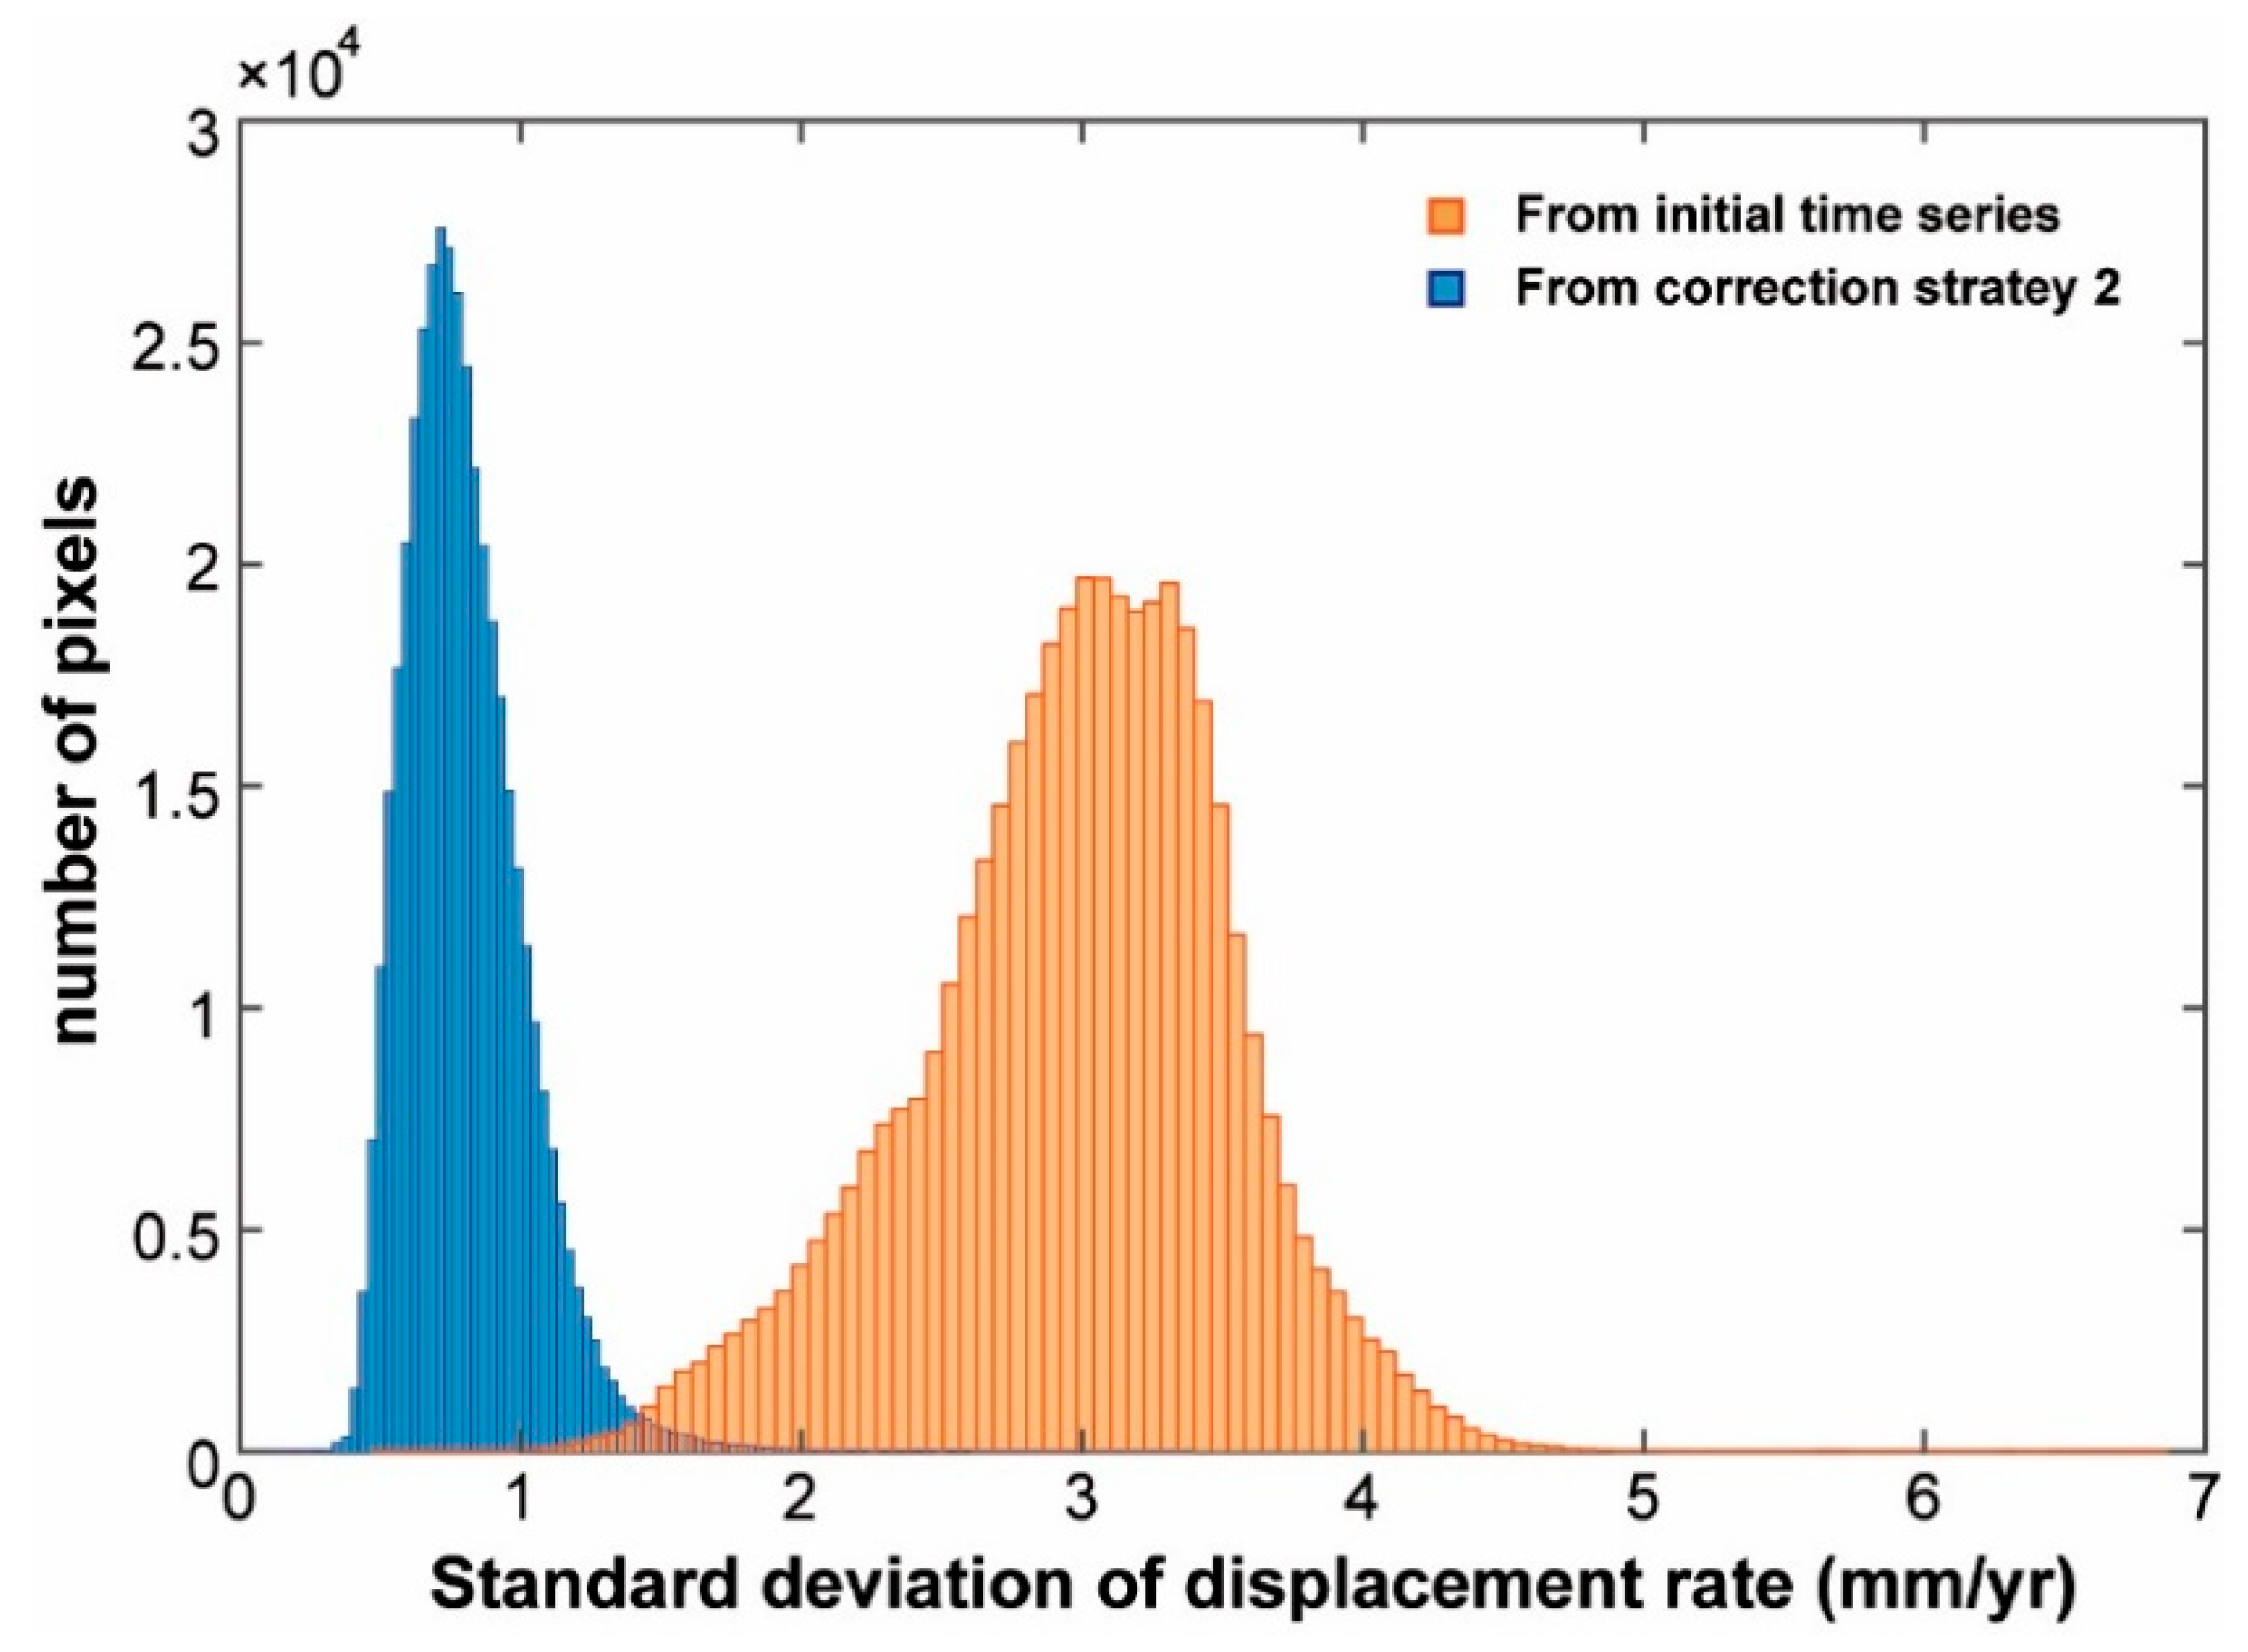
4.2. Reliability Analysis
5. Interpretation and Discussion
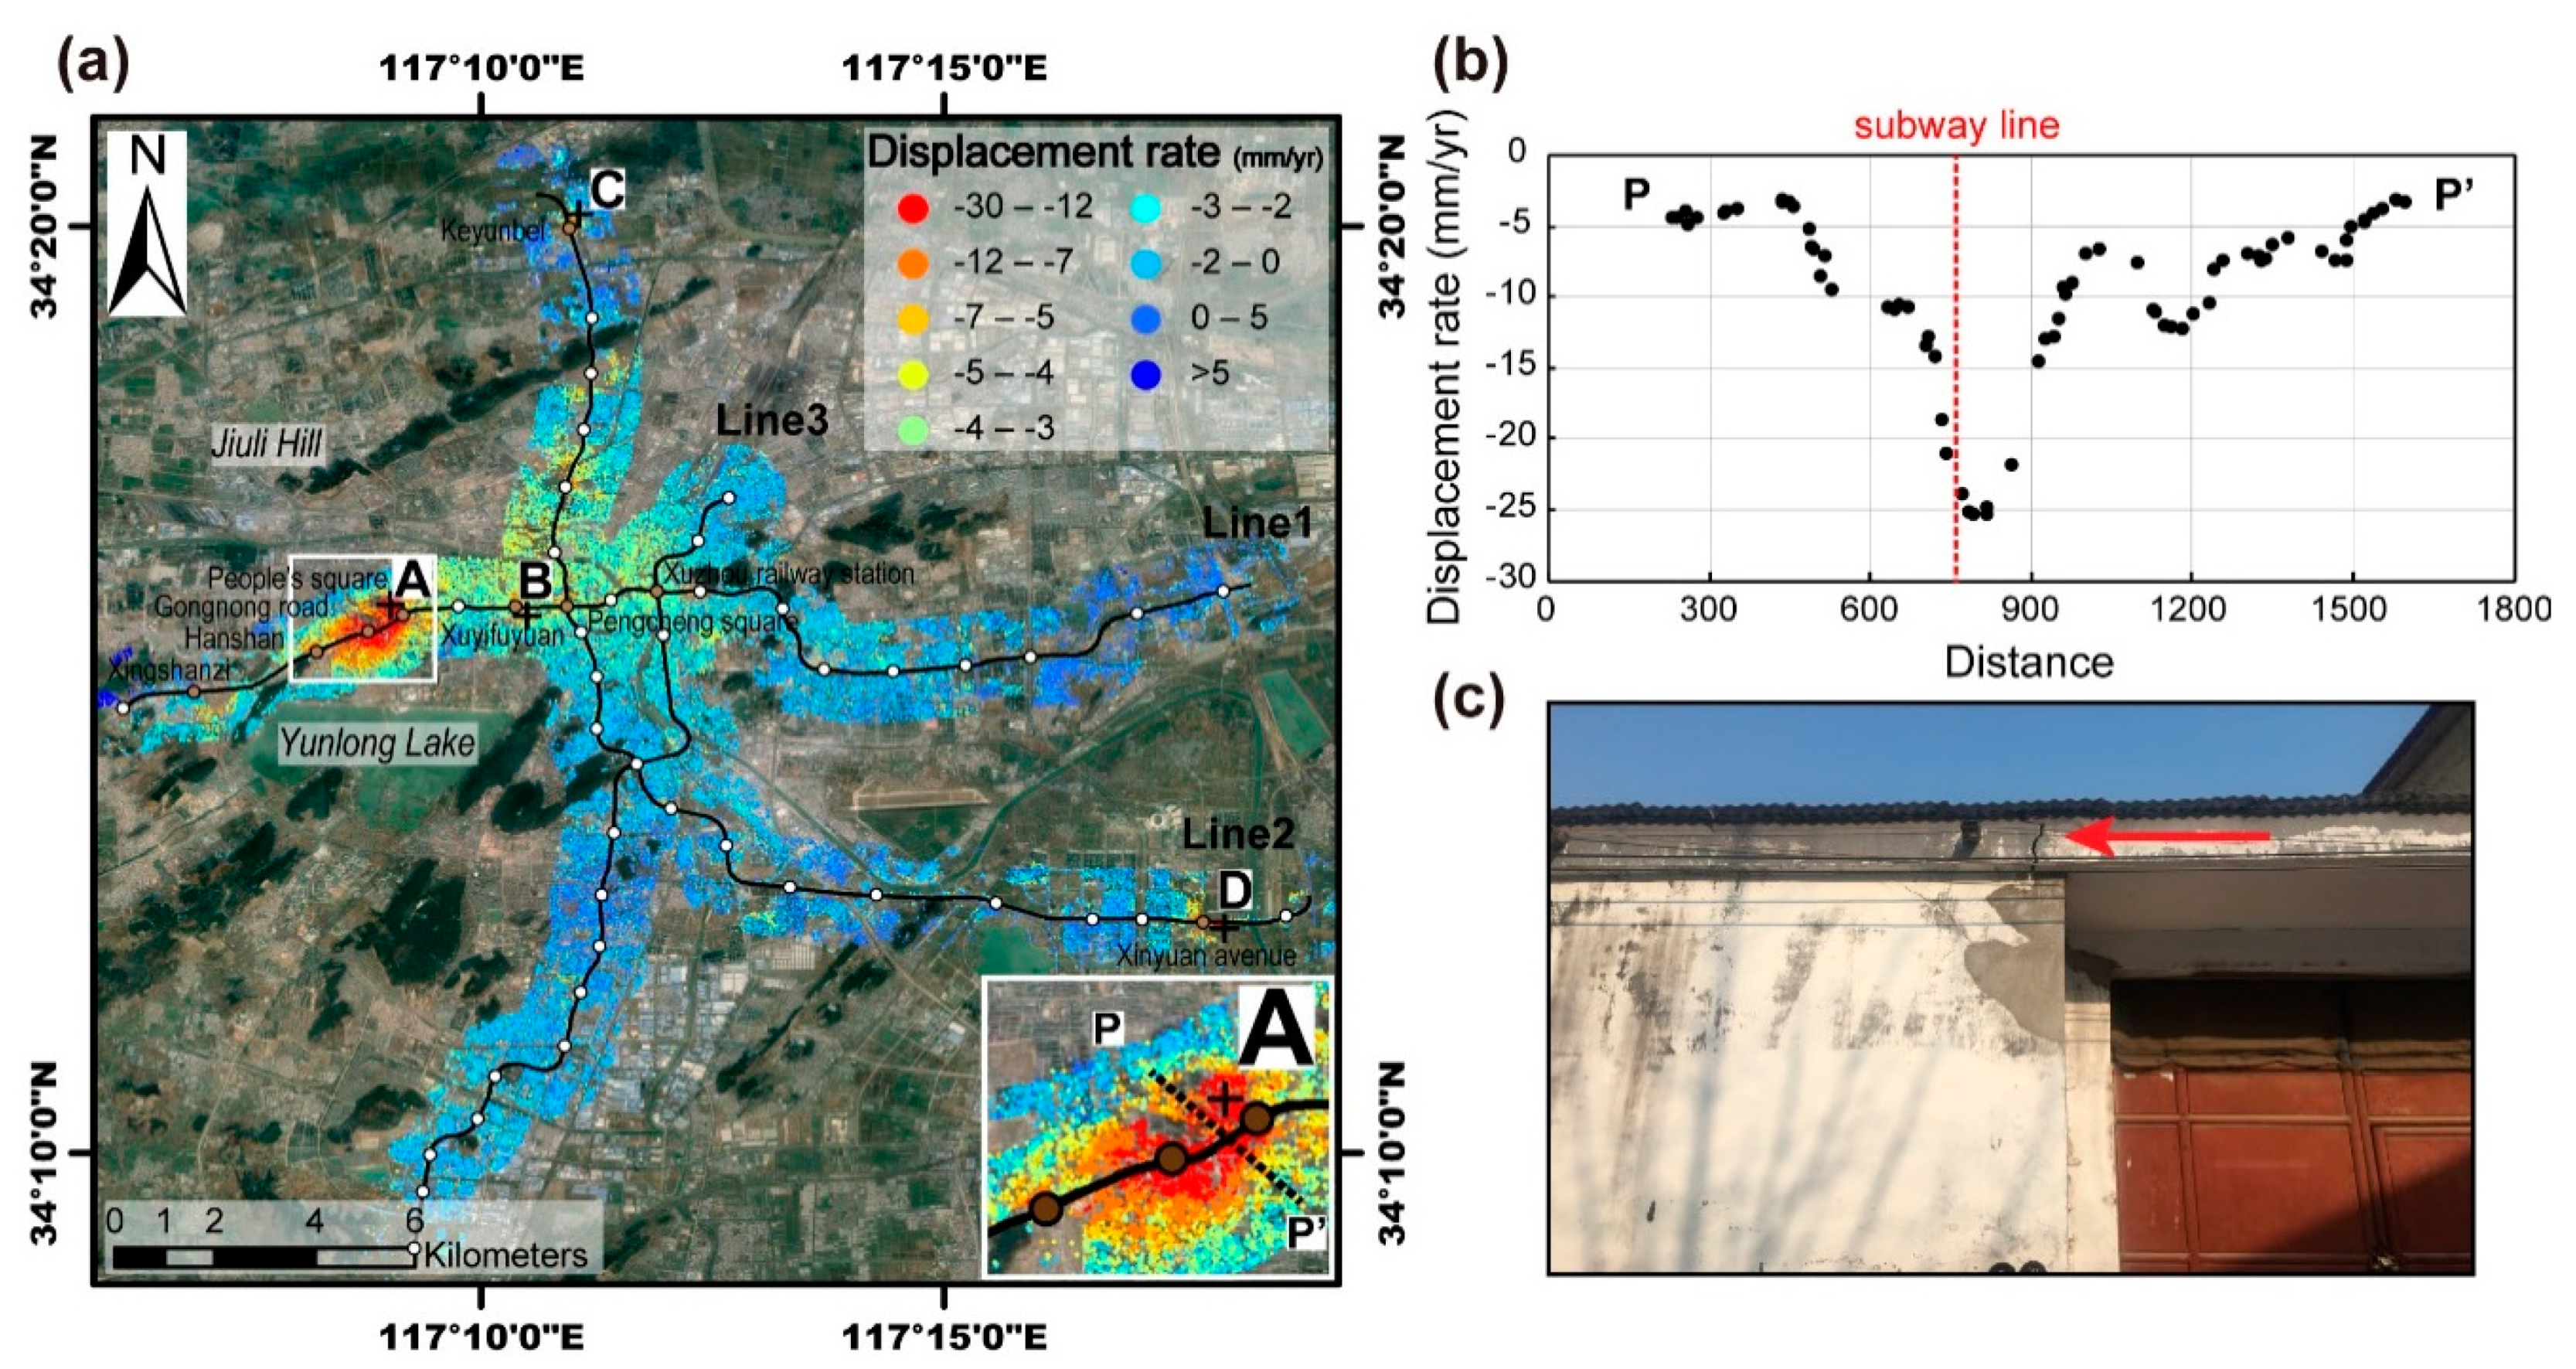
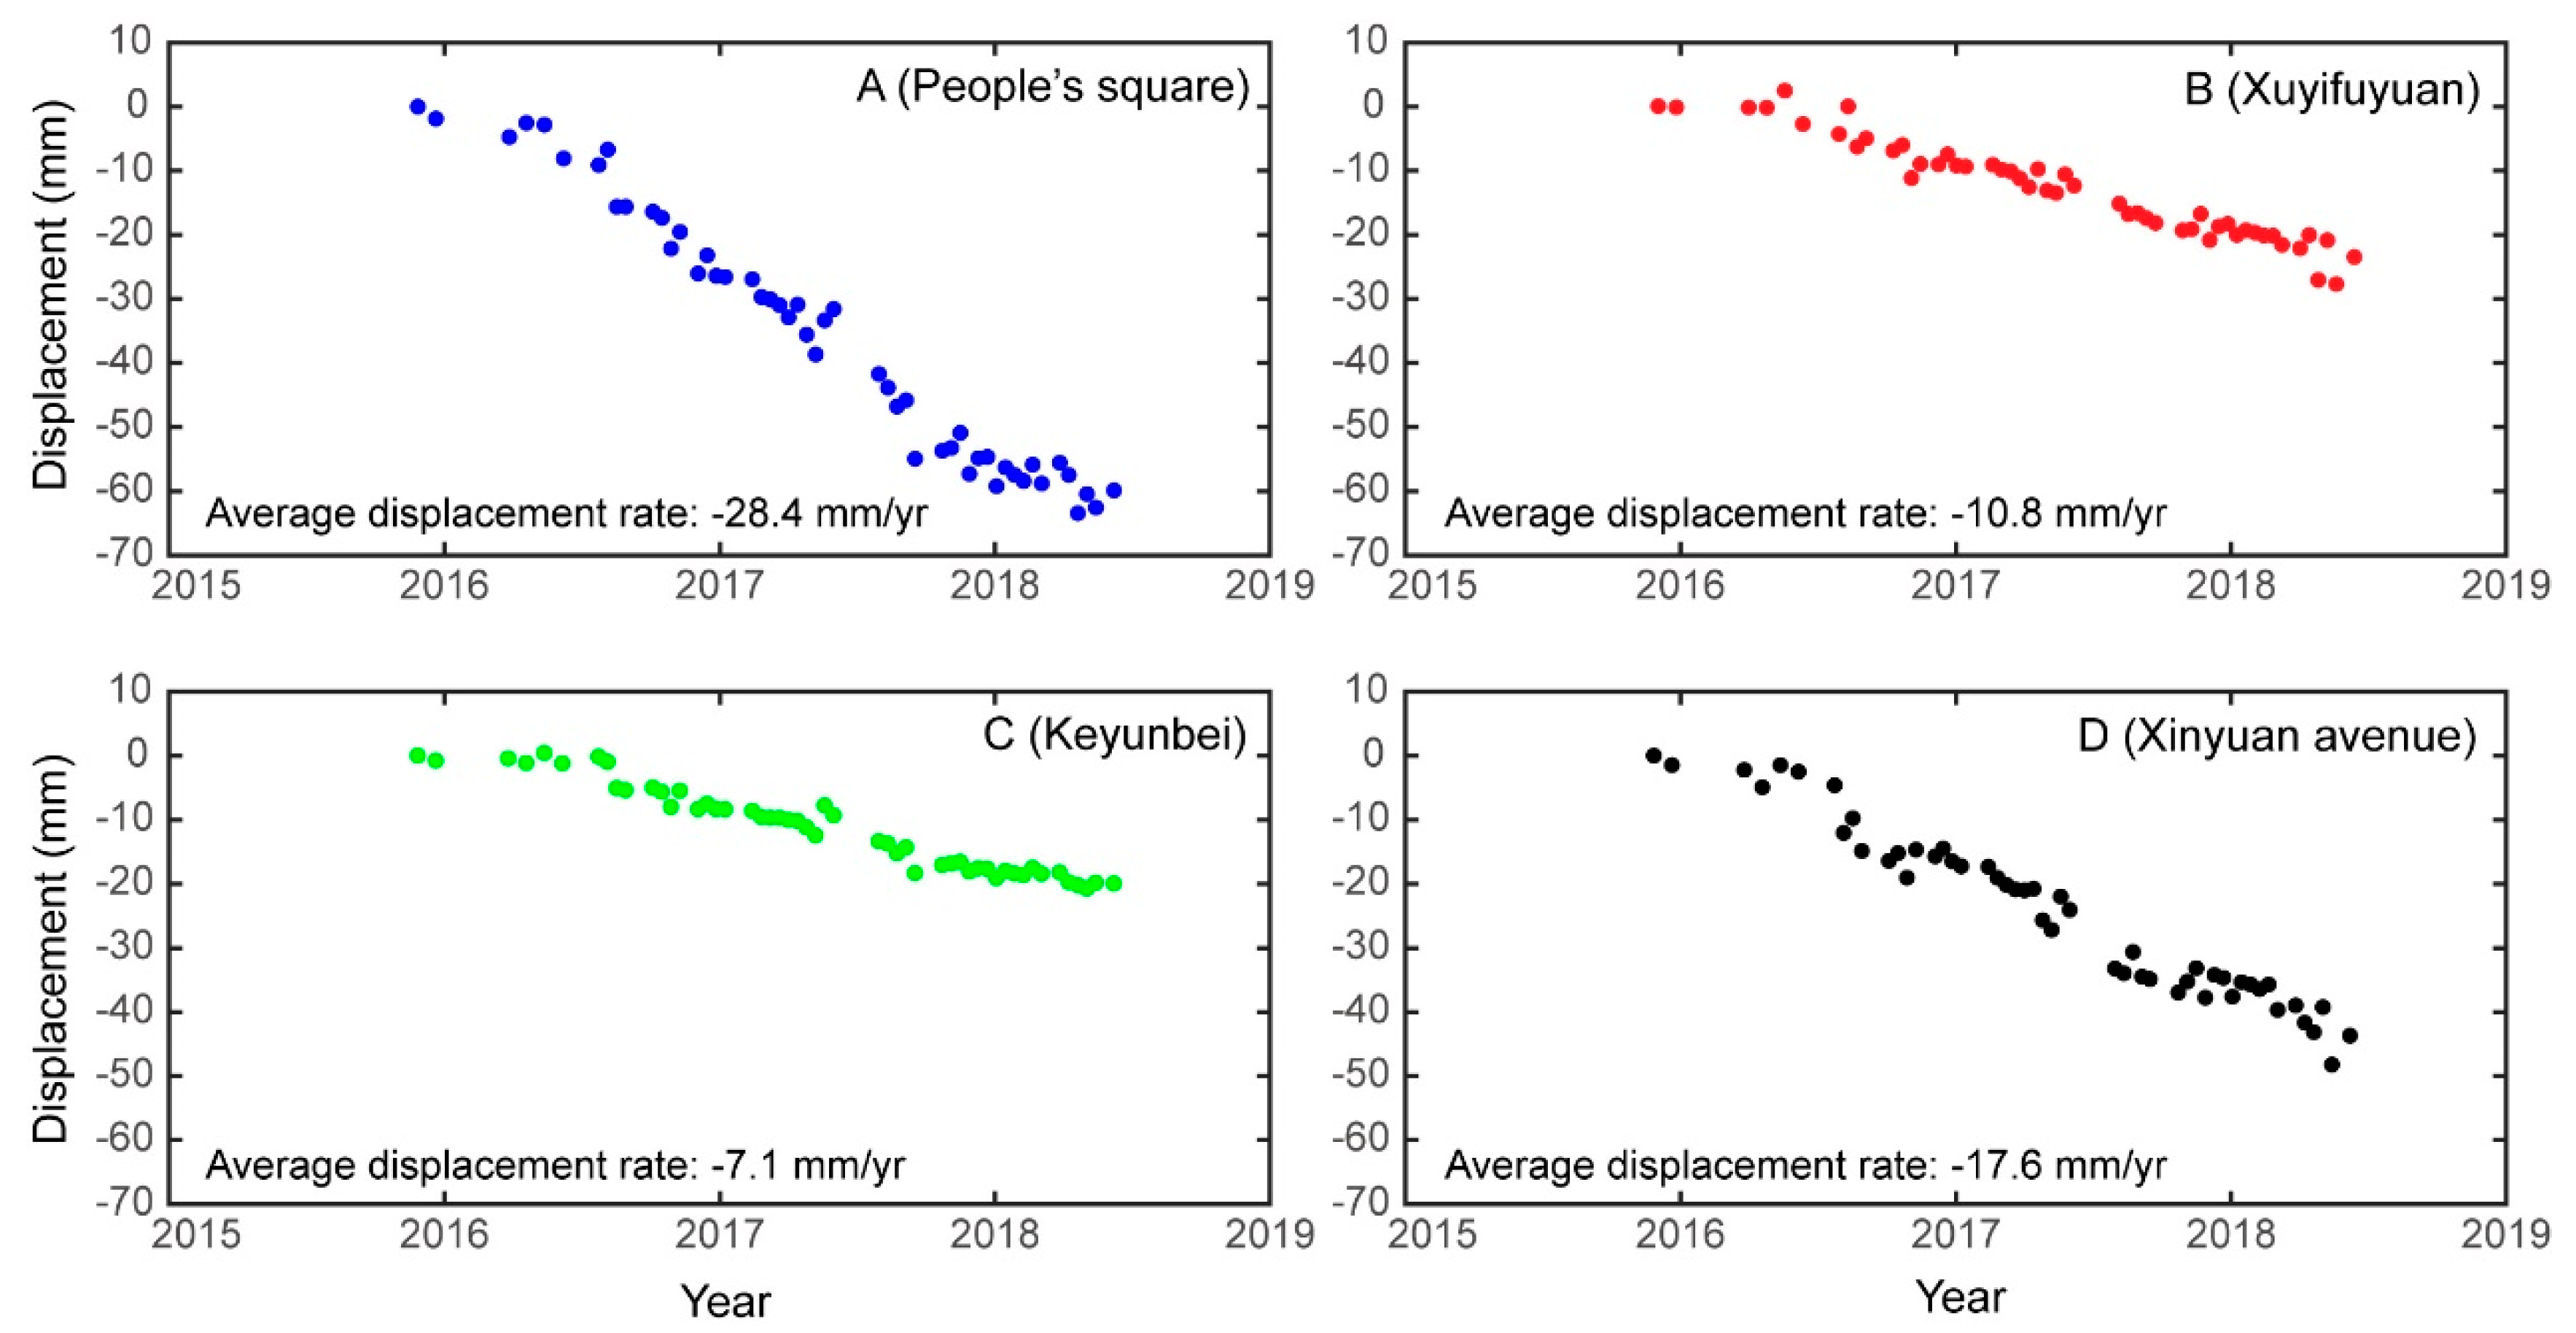
5.1. Surface Subsidence Associated with Urban Construction
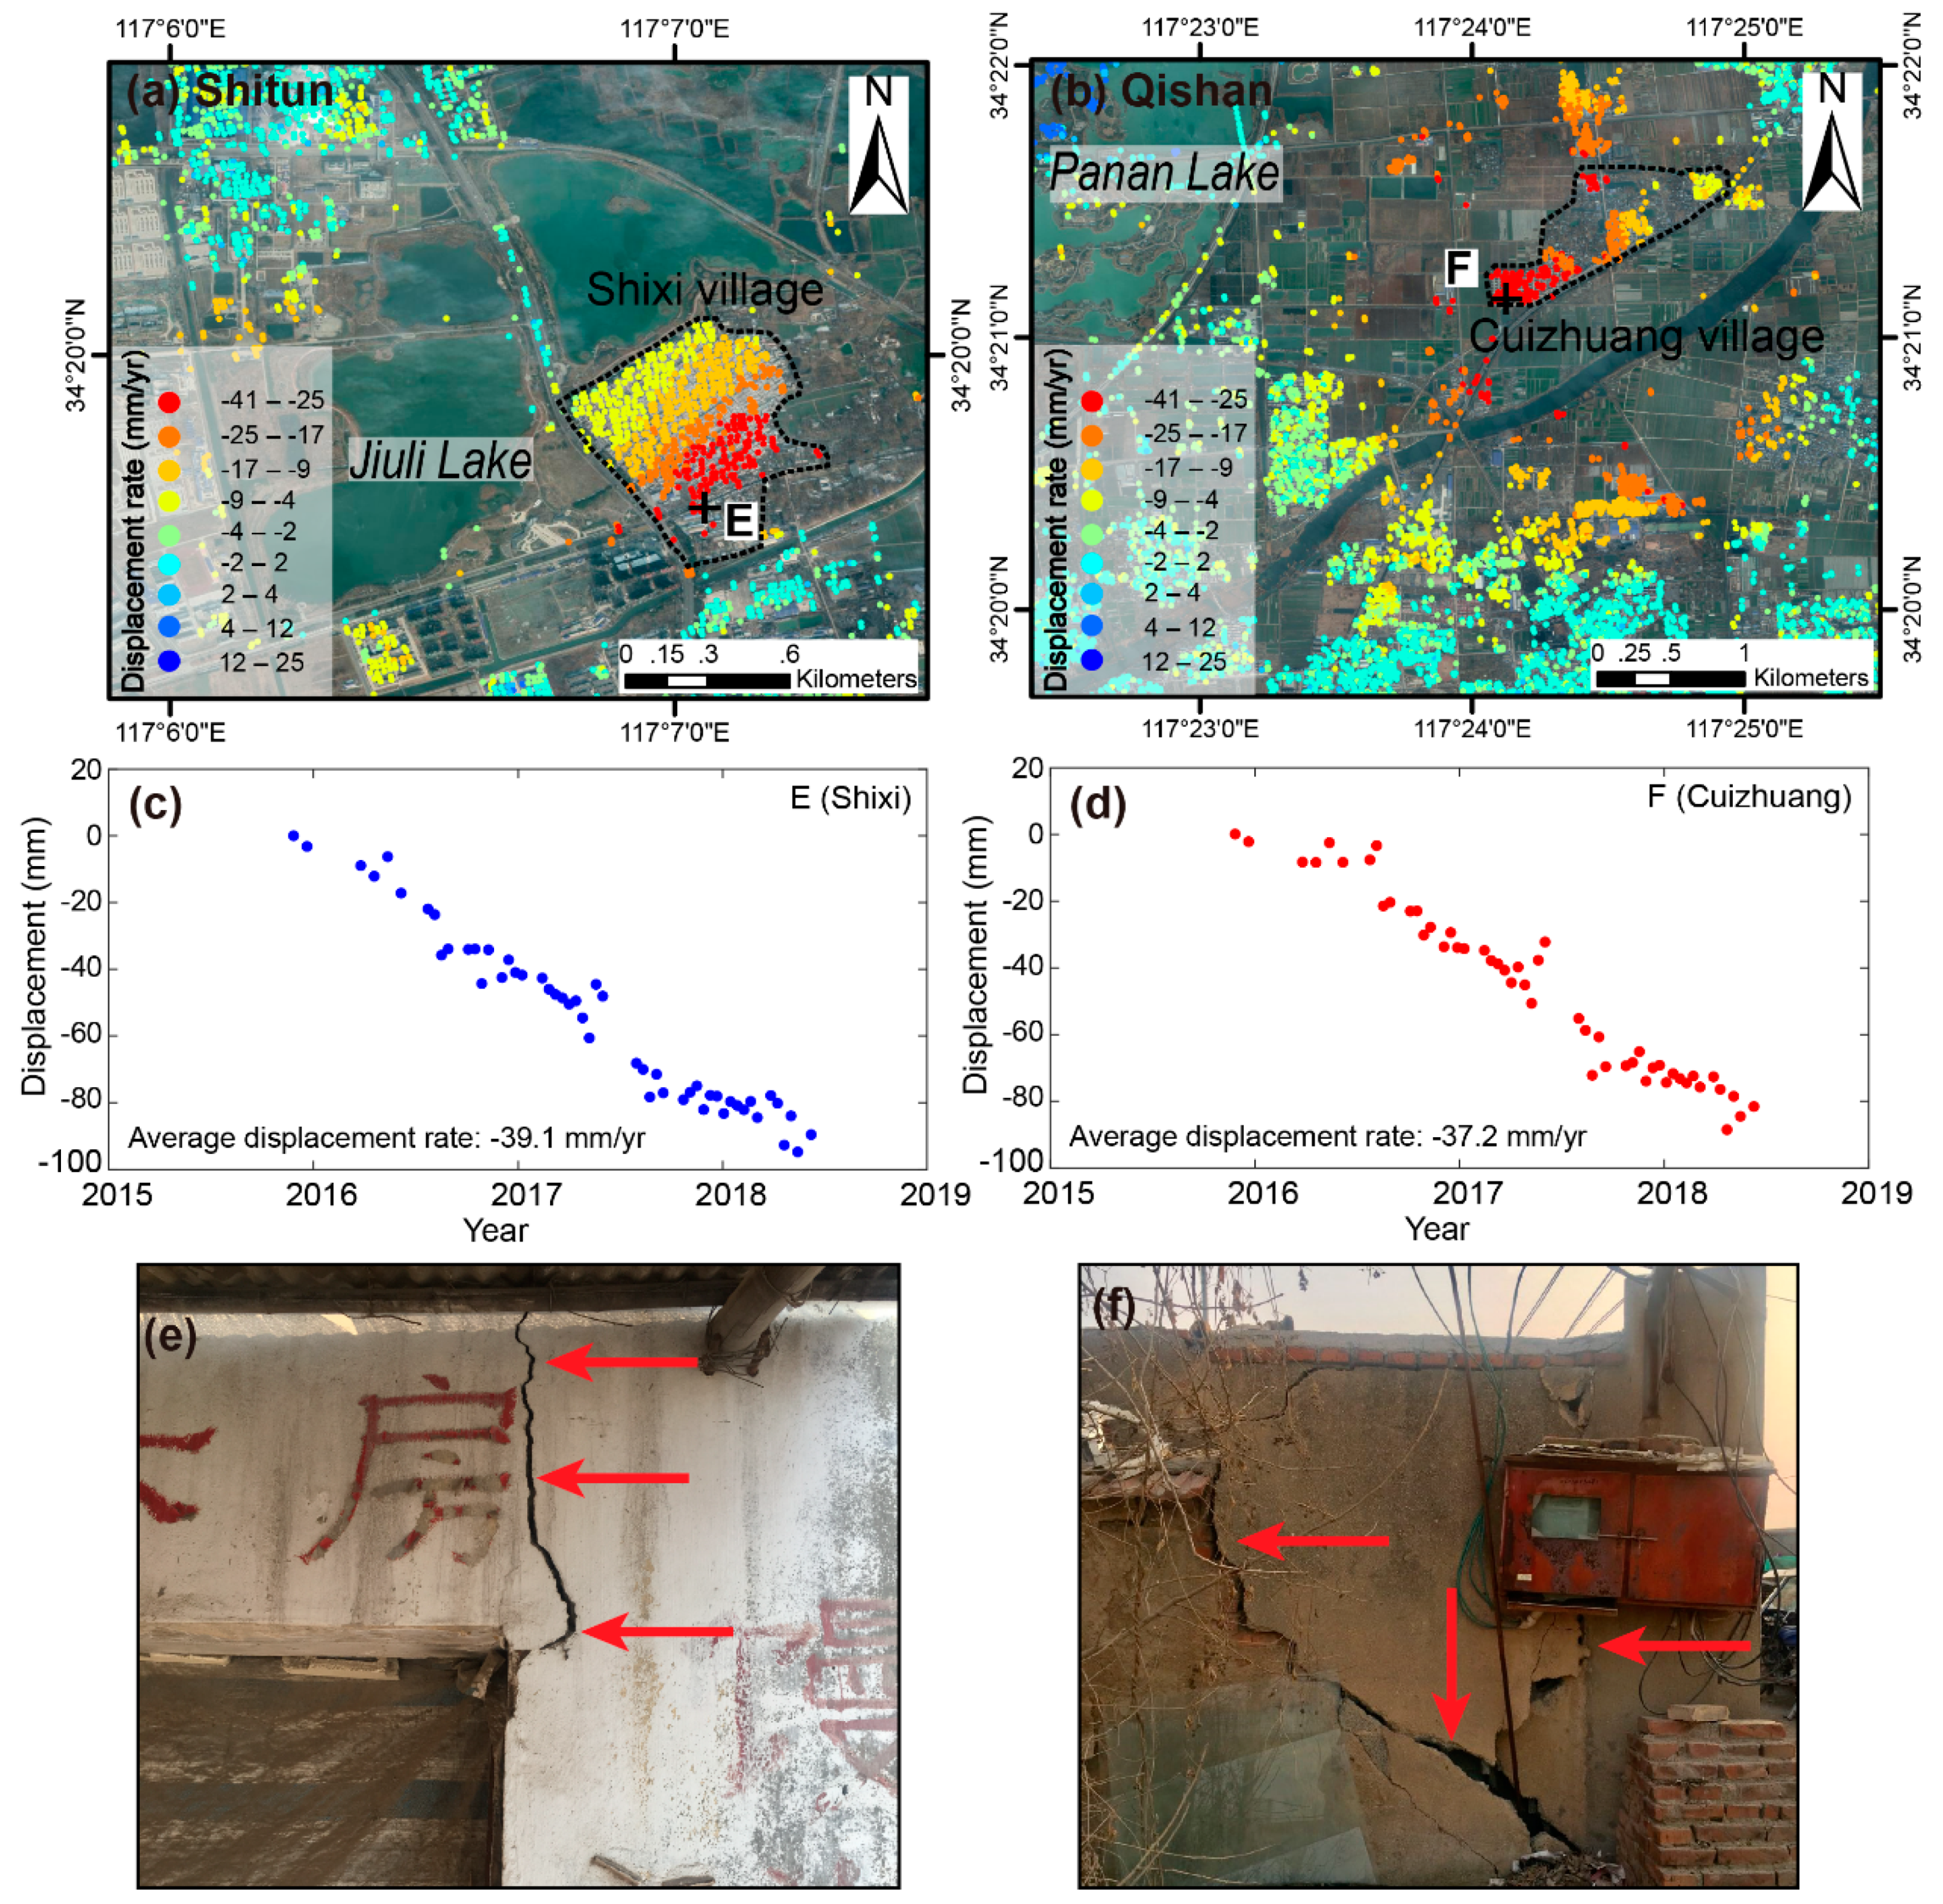
5.2. Surface Subsidence and Uplift in Old Goafs
5.3. Potential of the Proposed Method for High Precision InSAR Observation
6. Conclusions
- The powerful potential of the enhanced PCA-based correction method for purifying InSAR displacement time series was demonstrated. The significant reduction of the variance of the interferograms and the reasonable agreement between results derived from InSAR and GNSS measurements demonstrated the method to be both efficient and effective for monitoring high-precision land surface displacement in the Xuzhou region. The success of this method suggests it might have significant potential for application in other ground displacement investigations.
- Noticeable land subsidence with displacement in the range of –5 to –41 mm/yr were found widely within the urban areas of Xuzhou during the study period, particularly along the subway lines under construction, the newly developed district and in old coal goafs. This indicates that anthropogenic activities such as subway tunneling, building construction and mining could be the main factors contributing to the detected subsidence.
- Remarkable long-term land uplift signals with rates of up to +25 mm/yr have begun to affect two long narrow areas within the old goafs since 2015. It is suggested that the high rate of uplift could be associated both with specific geological conditions and with rising underground water levels that could contribute to the land uplift either directly or indirectly by inflating the compositions of the unconsolidated layer.
- Our results and interpretations could provide important insight into the potential instability of central areas of Xuzhou. Regular monitoring of surface displacement is needed to prevent related geohazards.
Supplementary Materials
Author Contributions
Funding
Acknowledgments
Conflicts of Interest
References
- Stramondo, S.; Bozzano, F.; Marra, F.; Wegmuller, U.; Cinti, F.R.; Moro, M.; Saroli, M. Subsidence induced by urbanisation in the city of Rome detected by advanced InSAR technique and geotechnical investigations. Remote Sens. Environ. 2008, 112, 3160–3172. [Google Scholar] [CrossRef]
- Remy, D.; Falvey, M.; Bonvalot, S.; Chlieh, M.; Gabalda, G.; Froger, J.L.; Legrand, D. Variability of atmospheric precipitable water in northern Chile: Impacts on interpretation of InSAR data for earthquake modeling. J. S. Am. Earth Sci. 2011, 31, 214–226. [Google Scholar] [CrossRef]
- Fan, H.; Gao, X.; Yang, J.; Deng, K.; Yu, Y. Monitoring mining subsidence using a combination of phase-stacking and offset-tracking methods. Remote Sens. 2015, 7, 9166–9183. [Google Scholar] [CrossRef]
- Dai, K.; Li, Z.; Tomas, R.; Liu, G.; Yu, B.; Wang, X.; Cheng, H.; Chen, J.; Stockamp, J. Monitoring activity at the Daguangbao mega-landslide (China) using Sentinel-1 TOPS time series interferometry. Remote Sens. Environ. 2016, 186, 501–513. [Google Scholar] [CrossRef]
- Chaussard, E.; Wdowinski, S.; Cabral-Cano, E.; Amelung, F. Land subsidence in central Mexico detected by ALOS InSAR time-series. Remote Sens. Environ. 2014, 140, 94–106. [Google Scholar] [CrossRef]
- Chen, Y.; Remy, D.; Froger, J.-L.; Peltier, A.; Villeneuve, N.; Darrozes, J.; Perfettini, H.; Bonvalot, S. Long-term ground displacement observations using InSAR and GNSS at Piton de la Fournaise volcano between 2009 and 2014. Remote Sens. Environ. 2017, 194, 230–247. [Google Scholar] [CrossRef]
- Yin, Y.P.; Zhang, Z.C.; Zhang, K.J. Land subsidence and countermeasures for its prevention in China. Chin. J. Geol. Hazard Control 2005, 16, 1–8. [Google Scholar] [CrossRef]
- He, Q.C.; Ye, X.B.; Li, Z.M.; Liu, W.B. The status and prevention strategy of land subsidence in China. Geol. J. China Univ. 2006, 12, 161–168. [Google Scholar] [CrossRef]
- Hua, X.Q.; Huang, J.J.; Miao, S.X.; Zhang, L.; Wu, X. Distribution and causes of geo-hazards in Xuzhou. J. Geol. Hazards Environ. Preserv. 2015, 26, 74–80. [Google Scholar]
- Hua, X.Q.; Huang, J.J.; Wei, Y.Y.; Miao, S.X.; Xu, S.Y.; Jiang, S.; Zhang, L. Demand analysis and key problems of the urban geological survey in Xuzhou. J. Geol. 2015, 39, 322–328. [Google Scholar]
- Gao, M.; Gong, H.; Chen, B.; Zhou, C.; Chen, W.; Liang, Y.; Shi, M.; Si, Y. InSAR time-series investigation of long-term ground displacement at Beijing Capital International Airport, China. Tectonophysics 2016, 691, 271–281. [Google Scholar] [CrossRef]
- Perissin, D.; Wang, Z.; Lin, H. Shanghai subway tunnels and highways monitoring through Cosmo-SkyMed Persistent Scatterers. ISPRS J. Photogramm. Remote Sens. 2012, 73, 58–67. [Google Scholar] [CrossRef]
- Qin, X.; Yang, T.; Yang, M.; Zhang, L.; Liao, M. Health diagnosis of major transportation infrastructures in Shanghai metropolis using high-resolution Persistent Scatterer Interferometry. Sensors 2017, 17, 2770. [Google Scholar] [CrossRef] [PubMed]
- Wang, H.; Feng, G.; Xu, B.; Yu, Y.; Li, Z.; Du, Y.; Zhu, J. Deriving spatio-temporal development of ground subsidence due to subway construction and operation in delta regions with PS-InSAR data: A case study in Guangzhou, China. Remote Sens. 2017, 9, 1004. [Google Scholar] [CrossRef]
- Ng, A.H.-M.; Wang, H.; Dai, Y.; Pagli, C.; Chen, W.; Ge, L.; Du, Z.; Zhang, K. InSAR reveals land deformation at Guangzhou and Foshan, China between 2011 and 2017 with COSMO-SkyMed data. Remote Sens. 2018, 10, 813. [Google Scholar] [CrossRef]
- Meng, L.; Feng, Q.Y.; Zhang, H.R.; Wu, Q.Q.; Lu, Y. Mechanism analysis and hazard assessment on land subsidence in Datun central district of Xuzhou city. Chin. J. Geol. Harzard Control 2008, 19, 60–63. [Google Scholar] [CrossRef]
- Gao, J.X.; Hu, H. Advanced GNSS technology of mining deformation monitoring. Prodedia Earth Planet. Sci. 2009, 1, 1081–1088. [Google Scholar]
- Bamler, R.; Hartl, P. Synthetic aperture radar interferometry. Inverse Probl. 1999, 14, 12–13. [Google Scholar] [CrossRef]
- Rosen, P.A.; Hensley, S.; Joughin, I.R.; Li, F.K.; Madsen, S.N.; Rodriguez, E.; Goldstein, R.M. Synthetic aperture radar interferometry. Proc. IEEE 2002, 88, 333–382. [Google Scholar] [CrossRef]
- Remy, D.; Chen, Y.; Froger, J.L.; Bonvalot, S.; Cordoba, L.; Fustos, J. Revised interpretation of recent InSAR signals observed at Llaima volcano (Chile). Geophys. Res. Lett. 2015, 42, 3870–3879. [Google Scholar] [CrossRef]
- Massonnet, D.; Rossi, M.; Carmona, C.; Adragna, F.; Peltzer, G.; Feigl, K.; Rabaute, T. The displacement field of the Landers earthquake mapped by radar interferometry. Nature 1993, 364, 138–142. [Google Scholar] [CrossRef]
- Cascini, L.; Fornaro, G.; Peduto, D. Advanced low- and full-resolution DInSAR map generation for slow-moving landslide analysis at different scales. Eng. Geol. 2010, 112, 29–42. [Google Scholar] [CrossRef]
- Tessitore, S.; Fernandez-Merodo, J.A.; Herrera, G.; Tomas, R.; Ramondini, M.; Sanabria, M.; Duro, J.; Mulas, J.; Calcaterra, D. Comparison of water-level, extensometric, DInSAR and simulation data for quantification of subsidence in Murcia City (SE Spain). Hydrogeol. J. 2016, 24, 727–747. [Google Scholar] [CrossRef]
- Hooper, A.; Segall, P.; Zebker, H. Persistent scatterer interferometric synthetic aperture radar for crustal deformation analysis, with application to Volcan Alcedo, Galapagos. J. Geophys. Res. Solid Earth 2007, 112. [Google Scholar] [CrossRef]
- Kampes, B. Displacement Parameter Estimation Using Permanent Scatterer Interferometry. Ph.D. Thesis, Technische Universiteit Delft, Delft, The Netherlands, 2005. [Google Scholar]
- Ferretti, A.; Prati, C.; Rocca, F. Permanent scatterers in SAR interferometry. IEEE Trans. Geosci. Remote Sens. 2001, 39, 8–20. [Google Scholar] [CrossRef]
- Berardino, P.; Fornaro, G.; Lanari, R.; Sansosti, E. A new algorithm for surface deformation monitoring based on small baseline differential SAR interferograms. IEEE Trans. Geosci. Remote Sens. 2002, 40, 2375–2383. [Google Scholar] [CrossRef]
- Hooper, A. A multi-temporal InSAR method incorporating both persistent scatterer and small baseline approaches. Geophys. Res. Lett. 2008, 35. [Google Scholar] [CrossRef]
- Zeni, G.; Bonano, M.; Casu, F.; Manunta, M.; Manzo, M.; Marsella, M.; Pepe, A.; Lanari, R. Long-term deformation analysis of historical buildings through the advanced SBAS-DInSAR technique: The case study of the city of Rome, Italy. J. Geophys. Eng. 2011, 8, S1–S12. [Google Scholar] [CrossRef]
- Aslan, G.; Cakir, Z.; Ergintav, S.; Lasserre, C.; Renard, F. Analysis of secular ground motions in Istanbul from a long-term InSAR time-series (1992–2017). Remote Sens. 2018, 10, 408. [Google Scholar] [CrossRef]
- Zhou, C.; Gong, H.; Chen, B.; Li, J.; Gao, M.; Zhu, F.; Chen, W.; Liang, Y. InSAR time-series analysis of land subsidence under different land use types in the eastern Beijing Plain, China. Remote Sens. 2017, 9, 380. [Google Scholar] [CrossRef]
- Zhou, L.; Guo, J.; Hu, J.; Li, J.; Xu, Y.; Pan, Y.; Shi, M. Wuhan surface subsidence analysis in 2015–2016 based on Sentinel-1A data by SBAS-InSAR. Remote Sens. 2017, 9, 982. [Google Scholar] [CrossRef]
- Bai, L.; Jiang, L.; Wang, H.; Sun, Q. Spatiotemporal characterization of land subsidence and uplift (2009–2010) over Wuhan in central China revealed by TerraSAR-X InSAR analysis. Remote Sens. 2016, 8, 350. [Google Scholar] [CrossRef]
- Fan, H.; Deng, K.; Ju, C.; Zhu, C.; Xue, J.Q. Land subsidence monitoring by D-InSAR technique. Min. Sci. Technol. 2011, 21, 869–872. [Google Scholar] [CrossRef]
- Liu, X.; Wang, Y.; Yan, S. Interferometric SAR time series analysis for ground subsidence of the abandoned mining area in north Peixian using Sentinel-1A TOPS data. J. Indian Soc. Remote Sens. 2018, 46, 451–461. [Google Scholar] [CrossRef]
- Hooper, A.; Bekaert, D.; Spaans, K.; Arikan, M. Recent advances in SAR interferometry time series analysis for measuring crustal deformation. Tectonophysics 2012, 514, 1–13. [Google Scholar] [CrossRef]
- Kositsky, A.P.; Avouac, J.P. Inverting geodetic time series with a principal component analysis-based inversion method. J. Geophys. Res. Solid Earth 2010, 115. [Google Scholar] [CrossRef]
- Geological Disaster Prevention and Control Planning of Jiangsu Province; Department of Land and Resources of Jiangsu Province: Nanjing, China, 2017.
- Farr, T.G.; Rosen, P.A.; Caro, E.; Crippen, R.; Duren, R.; Hensley, S.; Kobrick, M.; Paller, M.; Rodriguez, E.; Roth, L.; et al. The shuttle radar topography mission. Rev. Geophys. 2001, 45, RG2004. [Google Scholar] [CrossRef]
- Hooper, A.; Zebker, H.A. Phase unwrapping in three dimensions with application to InSAR time series. J. Opt. Soc. Am. A Opt. Image Sci. Vis. 2007, 24, 2737–2747. [Google Scholar] [CrossRef]
- Lyons, S.; Sandwell, D. Fault creep along the southern San Andreas from interferometric synthetic aperture radar, permanent scatterers, and stacking. J. Geophys. Res. Solid Earth 2003, 108. [Google Scholar] [CrossRef]
- Science Toolbox Exploitation Platform (STEP) SNAP Download Page. Available online: http://step.esa.int/main/download/snap-download (accessed on 15 January 2018).
- Sentinel-1 POD Precise Orbit Ephemerides Products Download Page. Available online: https://qc.sentinel1.eo.esa.int/aux_poeorb (accessed on 11 February 2018).
- Pepe, A.; Lanari, R. On the extension of the minimum cost flow algorithm for phase unwrapping of multitemporal differential SAR interferograms. IEEE Trans. Geosci. Remote Sens. 2006, 44, 2374–2383. [Google Scholar] [CrossRef]
- Ferretti, A.; Prati, C.; Rocca, F. Nonlinear subsidence rate estimation using permanent scatterers in differential SAR interferometry. IEEE Trans. Geosci. Remote Sens. 2000, 38, 2202–2212. [Google Scholar] [CrossRef]
- Lin, Y.-N.N.; Kositsky, A.P.; Avouac, J.-P. PCAIM joint inversion of InSAR and ground-based geodetic time series:application to monitoring magmatic inflation beneath the Long Valley Caldera. Geophys. Res. Lett. 2010, 37. [Google Scholar] [CrossRef]
- Remy, D.; Froger, J.L.; Perfettini, H.; Bonvalot, S.; Gabalda, G.; Albino, F.; Cayol, V.; Legrand, D.; De Saint Blanquat, M. Persistent uplift of the Lazufre volcanic complex (Central Andes): New insights from PCAIM inversion of InSAR time series and GPS data. Geochem. Geophys. Geosyst. 2014, 15, 3591–3611. [Google Scholar] [CrossRef]
- Yang, Y.; Zeng, A.; Wu, F. Horizontal crustal movement in China fitted by adaptive collocation with embedded Euler vector. Sci. China Earth Sci. 2011, 54, 1822–1829. [Google Scholar] [CrossRef]
- Huang, J.J.; He, H.Z.; Lu, H.; Xu, S.Y.; Cui, L.Y.; Zhang, L.; Jiang, S.; Hua, M.; Wu, X.; Wei, Y.Y.; et al. Xuzhou Urban Planning Area Resources and Environment Carrying Capacity Evaluation Report; Xuzhou Land and Resources Bureau: Xuzhou, China, 2017. [Google Scholar]
- Zhao, Q.; Lin, H.; Jiang, L.; Chen, F.; Cheng, S. A study of ground deformation in the Guangzhou urban area with Persistent Scatterer Interferometry. Sensors 2009, 9, 503–518. [Google Scholar] [CrossRef]
- Strozzi, T.; Delaloye, R.; Poffet, D.; Hansmann, J.; Loew, S. Surface subsidence and uplift above a headrace tunnel in metamorphic basement rocks of the Swiss Alps as detected by satellite SAR interferometry. Remote Sens. Environ. 2011, 115, 1353–1360. [Google Scholar] [CrossRef]
- Roccheggiani, M.; Piacentini, D.; Tirincanti, E.; Perissin, D.; Menichetti, M. Detection and monitoring of tunneling induced ground movements using Sentinel-1 SAR Interferometry. Remote Sens. 2019, 11, 639. [Google Scholar] [CrossRef]
- Policy Archive Page of Government of Jiangsu Province. Available online: http://www.jiangsu.gov.cn/art/2015/3/16/art_65017_348358.html (accessed on 15 June 2018).
- Feng, X.; Zhang, Q. The effect of backfilling materials on the deformation of coal and rock strata containing multiple goaf: A Numerical Study. Minerals 2018, 8, 224. [Google Scholar] [CrossRef]
- Feng, X.; Wang, E.; Ganne, J.; Martin, R.; Jessell, M. The exhumation along the Kenyase and Ketesso shear zones in the Sefwi terrane, West African Craton: A numerical study. Geosci. J. 2018, 1–18. [Google Scholar] [CrossRef]
- Feng, X.; Amponsah, P.O.; Martin, R.; Ganne, J.; Jessell, M.W. 3-D numerical modelling of the influence of pre-existing faults and boundary conditions on the distribution of deformation: Example of North-Western Ghana. Precambrian Res. 2016, 274, 161–179. [Google Scholar] [CrossRef]


| Items | Description |
|---|---|
| Satellite | Sentinel-1A |
| Acquisition mode | TOPS |
| Track number | 142 |
| Orbit direction | Ascending |
| Polarization | VV |
| Wavelength (m) | 0.0555 |
| Range resolution (m) | 2.33 |
| Azimuth resolution (m) | 13.94 |
| Incidence angle (deg) | 40.12 |
| Number of images | 52 |
| Time spans | 27 November 2015–8 June 2018 |
| Initial Time Series | Long-Wavelength Artifact Correction | PC Decomposition-Based Artifact Correction | |||
|---|---|---|---|---|---|
| Correction Strategy 1 a (Chen et al. [6]) | Correction Strategy 2 b | Correction Strategy 3 c | |||
| Non-displacement zones | 15.17 | 11.02 | 9.89 | 4.75 | 4.67 |
| TSGT | 13.87 | 9.28 | 7.51 | 3.34 | 3.47 |
| CUMT | 15.97 | 12.75 | 9.45 | 3.28 | 3.33 |
| HCXY | 12.36 | 9.06 | 8.80 | 5.82 | 5.81 |
© 2019 by the authors. Licensee MDPI, Basel, Switzerland. This article is an open access article distributed under the terms and conditions of the Creative Commons Attribution (CC BY) license (http://creativecommons.org/licenses/by/4.0/).
Share and Cite
Chen, Y.; Tan, K.; Yan, S.; Zhang, K.; Zhang, H.; Liu, X.; Li, H.; Sun, Y. Monitoring Land Surface Displacement over Xuzhou (China) in 2015–2018 through PCA-Based Correction Applied to SAR Interferometry. Remote Sens. 2019, 11, 1494. https://doi.org/10.3390/rs11121494
Chen Y, Tan K, Yan S, Zhang K, Zhang H, Liu X, Li H, Sun Y. Monitoring Land Surface Displacement over Xuzhou (China) in 2015–2018 through PCA-Based Correction Applied to SAR Interferometry. Remote Sensing. 2019; 11(12):1494. https://doi.org/10.3390/rs11121494
Chicago/Turabian StyleChen, Yu, Kun Tan, Shiyong Yan, Kefei Zhang, Hairong Zhang, Xiaoyang Liu, Huaizhan Li, and Yaqin Sun. 2019. "Monitoring Land Surface Displacement over Xuzhou (China) in 2015–2018 through PCA-Based Correction Applied to SAR Interferometry" Remote Sensing 11, no. 12: 1494. https://doi.org/10.3390/rs11121494
APA StyleChen, Y., Tan, K., Yan, S., Zhang, K., Zhang, H., Liu, X., Li, H., & Sun, Y. (2019). Monitoring Land Surface Displacement over Xuzhou (China) in 2015–2018 through PCA-Based Correction Applied to SAR Interferometry. Remote Sensing, 11(12), 1494. https://doi.org/10.3390/rs11121494