Article

Assessing Water Availability in Mediterranean Regions Affected by Water Conflicts through MODIS Data Time Series Analysis

by
Gema Marco-Dos Santos
1,
Ignacio Melendez-Pastor
1,*,
Jose Navarro-Pedreño
1 and
Magaly Koch
2
1
Department of Agrochemistry and Environment, University Miguel Hernández of Elche, Avenida de la Universidad de Elche, Edificio Alcudia, 03202 Elche, Spain
2
Center for Remote Sensing, Boston University, 725 Commonwealth Avenue, Boston, MA 02215-1401, USA
*
Author to whom correspondence should be addressed.
Remote Sens. 2019, 11(11), 1355; https://doi.org/10.3390/rs11111355
Submission received: 10 April 2019 / Revised: 26 May 2019 / Accepted: 1 June 2019 / Published: 5 June 2019
(This article belongs to the Special Issue Remote Sensing of Arid/Semiarid Lands)

Abstract

:
Water scarcity is a widespread problem in arid and semi-arid regions such as the western Mediterranean coastal areas. The irregularity of the precipitation generates frequent droughts that exacerbate the conflicts among agriculture, water supply and water demands for ecosystems maintenance. Besides, global climate models predict that climate change will cause Mediterranean arid and semi-arid regions to shift towards lower rainfall scenarios that may exacerbate water conflicts. The purpose of this study is to find a feasible methodology to assess current and monitor future water demands in order to better allocate limited water resources. The interdependency between a vegetation index (NDVI), land surface temperature (LST), precipitation (current and future), and surface water resources availability in two watersheds in southeastern Spain with serious difficulties in meeting water demands was investigated. MODIS (Moderate Resolution Imaging Spectroradiometer) NDVI and LST products (as proxy of drought), precipitation maps (generated from climate station records) and reservoir storage gauging information were used to compute times series anomalies from 2001 to 2014 and generate regression images and spatial regression models. The temporal relationship between reservoir storage and time series of satellite images allowed the detection of different and contrasting water management practices in the two watersheds. In addition, a comparison of current precipitation rates and future precipitation conditions obtained from global climate models suggests high precipitation reductions, especially in areas that have the potential to contribute significantly to groundwater storage and surface runoff, and are thus critical to reservoir storage. Finally, spatial regression models minimized spatial autocorrelation effects, and their results suggested the great potential of our methodology combining NDVI and LST time series to predict future scenarios of water scarcity.

Graphical Abstract

1. Introduction

Spain is among the countries at higher risk of climate change [1,2] due to its geographical location, the complex topography and the high population density, especially in coastal regions [3]. The risk of water resources overexploitation is evident and requires the development of integrated and sustainable strategies in order to maintain socioeconomic activities [4] and preserve natural resources and ecosystems [5].
In this sense, remote sensing has demonstrated its enormous capabilities to retrieve information and to assess, monitor and predict environmental processes and functions [6,7]. Geospatial research programs that combine multiple platforms and sensors have allowed for the collection of an exceptional body of knowledge of the evolution of the Earth in recent decades. Projects such as the Earth Observing System (EOS) from the United States National Aeronautics and Space Administration (NASA) or the Copernicus Earth Observation Program from the European Space Agency (ESA) are outstanding platforms of knowledge generation for sustainable natural resources planning and control.
The semiarid Mediterranean climate greatly influences seasonal water availability for human use. The growing demand for food due to the increase in the world’s population has meant a great change in the agricultural sector with an increasing demand for water resources [8] to enable the intensification of agricultural activities to meet those needs. Irrigation systems promote the development of crops and thus increase water demands in areas where water is scarce by default [9] at the expense of losing natural ecosystems.
In addition, tourism contributes to the increase in water demands, which has a great impact on the Mediterranean coast of SE Spain. For example, in the present study area, during the summer (and water shortage period), a city like Benidorm can double or more the number of inhabitants [10]. In this sense, dams and reservoirs have an important role in securing water for domestic use and irrigation in periods of scarcity and high demand [3,11].
General Circulation Models (GCMs) are used to make future climate projections and simulate the response of the global system to different scenarios of increasing greenhouse gases concentrations. There are many GCMs that offer different results depending on the model used and the chosen emission scenario [12]. In southern Europe, the Intergovernmental Panel for Climate Change (IPCC) models for the end of the 21st century [8] predicts a temperature increase and an even more intense decrease in precipitation rates. These scenarios of higher water scarcity will mean more intense summer droughts and longer periods of inter-annual droughts. They will promote a decrease of soil water content, as well as aquifers recharge. Future lower precipitations would result in increased pressure on water resources by different sectors, which would worsen the problem of water demands in areas already dealing with this issue [9]. Under these conditions of demographic changes and uncertain global climate change scenarios, in which the availability of water is threatened, the efficient management of water resources in semi-arid zones should focus on a sustainable economic, social and environmental use that guarantees the supply for all uses in an equitable manner [13,14].
The effect of climate change on Mediterranean arid and semi-arid regions will most likely be a shift towards lower rainfall scenarios that accelerate the desertification process [15]. Under these conditions in which precipitation decreases and the temperature increases, semi-arid zones can face large water losses due to high evapotranspiration and aggravate scarcity [16]. Remote-sensing products such as NDVI and LST have proven to be valuable proxies for monitoring vegetation dynamics [17], land surface moisture conditions [18], yield estimates [19], soil evaporation rates [20], and drought vulnerability [21]. In the context of generating early alert systems, various spectral indexes have been developed for monitoring droughts, such as the Vegetation Temperature Condition Index-VTCI [22,23], the Vegetation Supply Water Index-VSWI [24] or the Soil Moisture Agricultural Drought Index-SMADI [25] among others.
The relationship between LST and NDVI has been generally described as having a negative correlation (e.g., Refs. [21,26]) with steeper slopes for dryer conditions [25]. However, the relationship between LST and NDVI may exhibit notable spatial [27] and temporal [26] alterations, and new research is needed in order to assess the sensitivity and resilience of ecosystems to climate variability [28]. In order to examine and understand the response patterns of vegetation indices to current climate variability (from 2001 to 2014) and water demands in the study area, the following questions are explored in this work: (1) Does a significant correlation exist between NDVI, LST and precipitation time series anomalies? (2) Similarly, does a significant correlation exist between NDVI, LST and water reservoir storage anomalies? (3) Can remotely sensed time series data (NDVI, LST) be used together with water reservoir storage changes to spatially and temporally assess current water demands and predict future water needs?
The objective of our research is the development of a feasible methodology to assess current and monitor future water demands with remote sensing in order to better allocate limited water resources and alleviate water conflicts. In this sense, this work presents an approach to evaluate the spatial-temporal relationships among remotely-sensed vegetation spectral indices (specifically NDVI) and land surface temperature (LST) time series, in relation to precipitation (current rates and future predictions) and available water resources (i.e., volume of water stored in reservoirs) over two medium-small-sized western Mediterranean watersheds. Both Mediterranean watersheds were selected because they constitute a conjunctive water resources management system and their climatic variability, limited availability of water resources, and vast demands for anthropic activities during dry periods generate socio-economic and environmental water use conflicts. The paper is organized in the following manner:
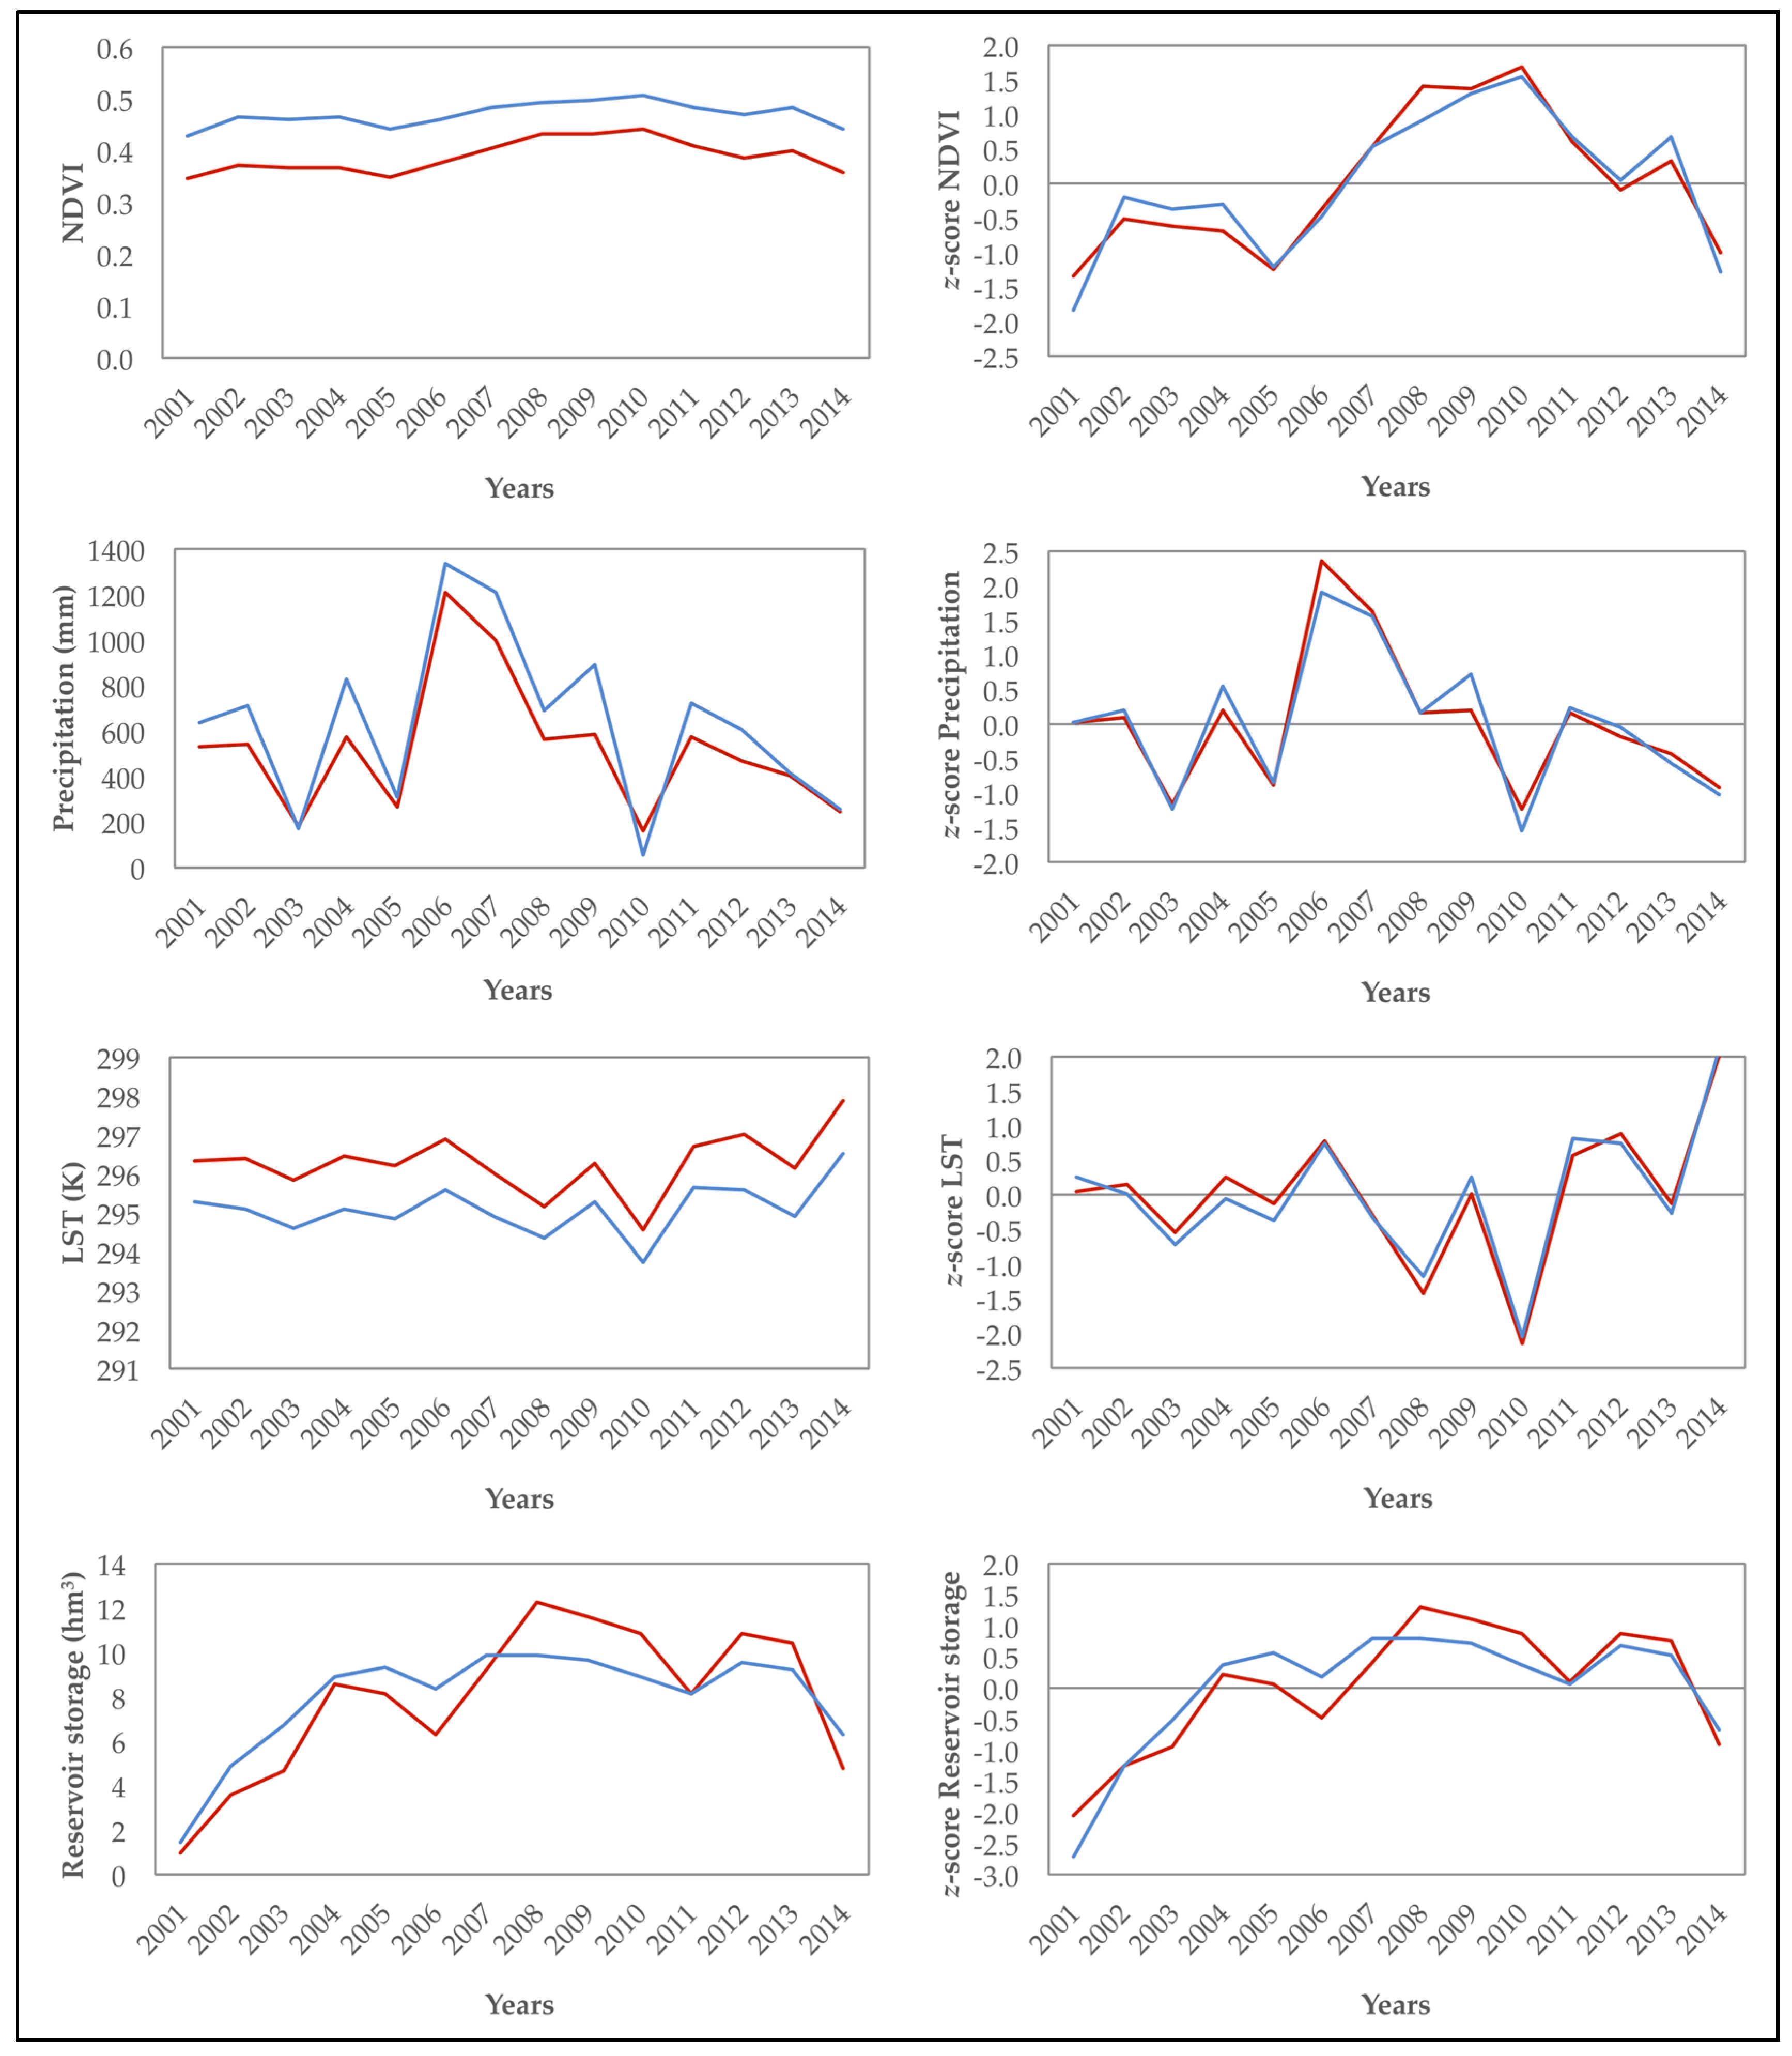
  • Time series of MODIS data (i.e., NDVI and LST) were compiled and used to compute their time series anomalies for temporal change detection. Current precipitation and reservoir storage time series anomalies were also computed.
  • The correlation among time series anomalies was statistically assessed. Additionally, correlation images between reservoir storage and the spatial variables (NDVI, LST and current precipitation) were computed. The use of a land cover map, along with bibliographic references and the knowledge of the study area allowed the identification of areas and land uses that may influence the availability of water resources.
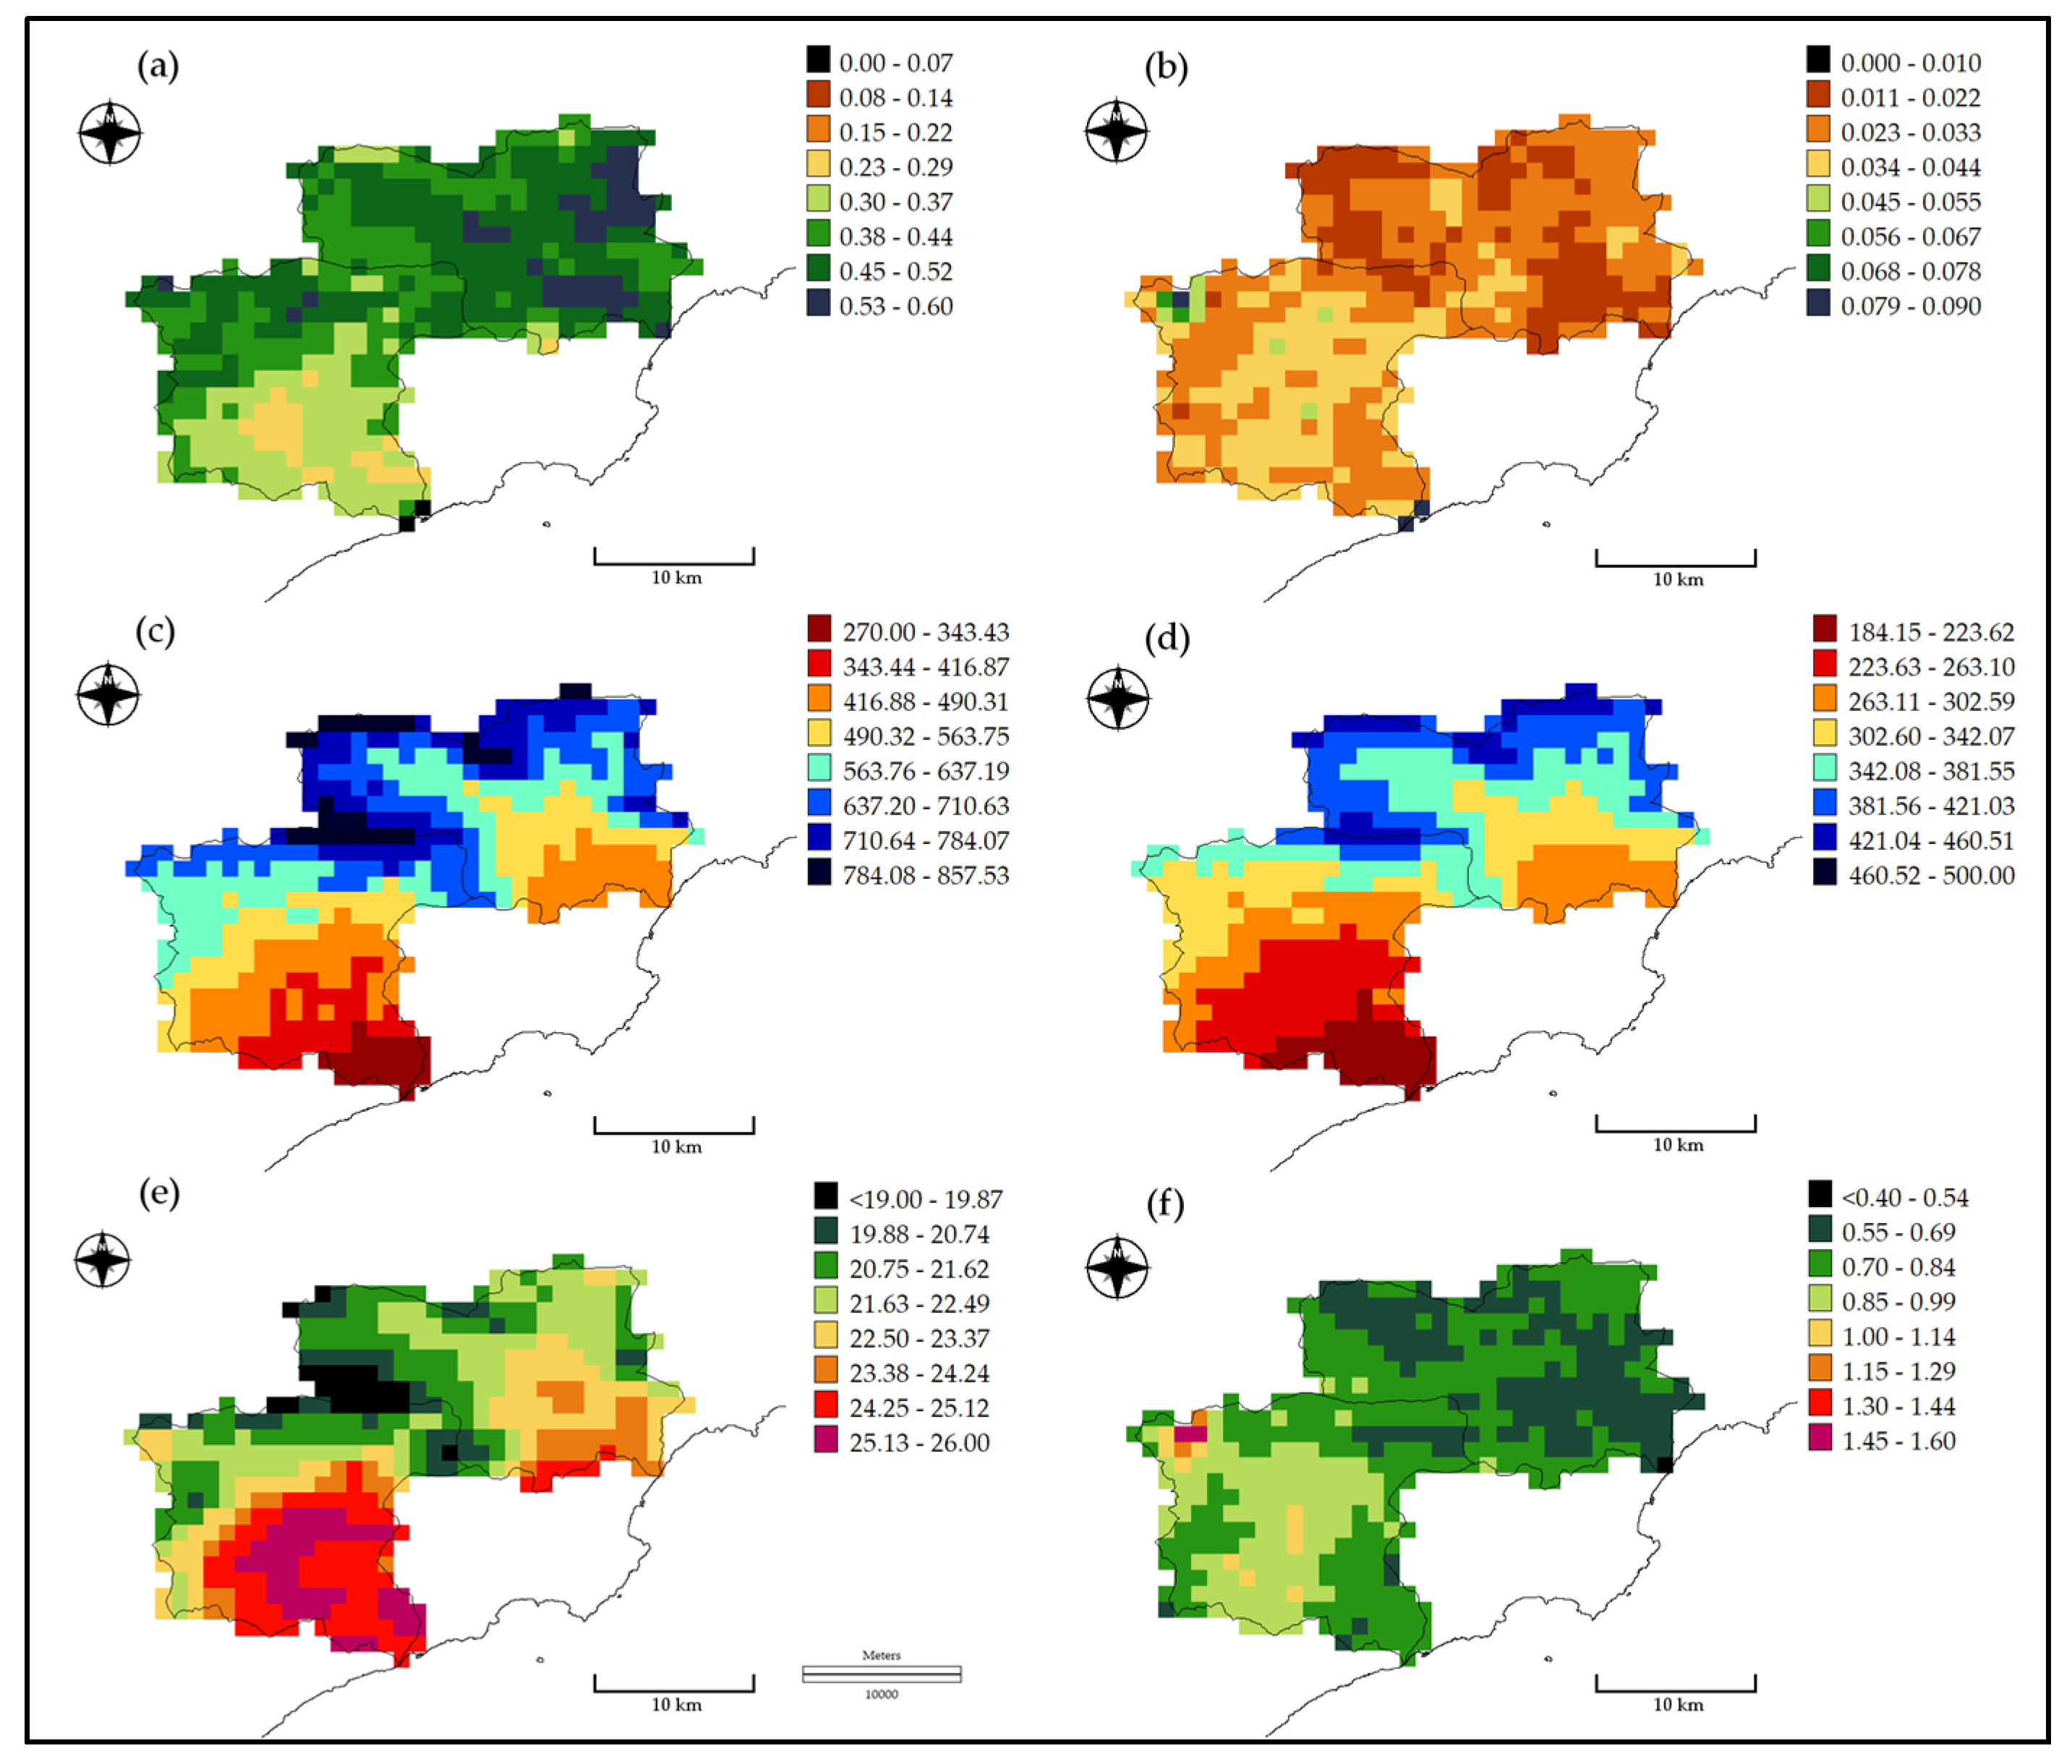
  • Finally, spatial regression analysis was used to evaluate the potential of NDVI and LST time series as predictors of future precipitation changes by taking into account the spatial autocorrelation of the variables.

2. Materials and Methods

The study area lies in the Comarca of Marina Baja in northern Alicante Province (SE Spain). It is located around 38°36′ N and 0°10′ W. This region is part of the Subbaetic Range [29]. It is characterized by its very steep orography, including beaches and coves surrounded by large cliffs and rugged mountains (Figure 1).
The Marina Baja encloses densely populated coastal urban areas and tourist resorts (e.g., Benidorm). The main agricultural activities comprise irrigated fruit trees (loquat and citrus) in areas of low to moderate elevation and slope, and rainfed crops such as olive and almond trees [30]. Antique cultivation terraces are still being used. Natural Mediterranean vegetation includes pine forests (Pinus sp.) and xerophytic shrubs (e.g., Rosmarinum officinalis, Thymus sp., etc.). The area is prone to natural or man-induced summer wildfires, which greatly impact the natural vegetation landscape, wildlife and human activities. Based on the World Reference Base for Soil Resources [31], the dominant soil types are Calcisols in the lowlands and Leptosols at the mountain slopes [32].
This study focuses on two main watersheds of the Comarca of Marina Baja, namely Algar-Guadalest and Amadorio (Figure 1). Both basins are similar in size and orography, each one contains a reservoir, and their slightly different topographic orientation induces climatic variations. They are separated by a line of summits of more than 1400 m of elevation (Aitana is the highest peak with 1557 m a.s.l.) that are at a distance of less than 10 km from the coastline. The Algar-Guadalest watershed covers an area of 215 km2 and its dominant orientation is NW-SE. The mean elevation is 555 m a.s.l. (meters above sea level), and the average slope is 19.6°. Two main rivers (Algar and Guadalest) drain the basin. The Guadalest river sub-basin includes a reservoir with a total volume of 0.013 km3. The Amadorio watershed covers an area of 225 km2, and the dominant orientation is N-S. The mean elevation is 610 m a.s.l. and the average slope is 18.3°. The Amadorio river includes a reservoir with a total volume of 0.016 km3. The climate is typically Mediterranean with annual average values of mean air temperature higher than 17 °C along the coastline. The orographic characteristics greatly influence spatio-temporal precipitation patterns. Dominant Köppen-Geiger climate classes are Bsk (cold steppe) in the lowlands and Csb (temperate with dry or temperate summer) in the mountains [33].
The Marina Baja is an interesting case of water resources management in semi-arid areas. It is a region with a high competition for land occupation, evidenced by the abandonment of traditional agricultural practices in favor of intensive irrigated agriculture and a massive urban development [34]. This process leads to a progressive increase in water demands, in a region where the availability of water resources is really scarce. It is evident that there is a conflict between the uses of water and the need for integrated water management in the area [35]. The great problem of water management in the Marina Baja has motivated the development of multidisciplinary studies to optimize the use of water resources, such as procedures for water exchange contracts instead of emerging water markets [35] among others.
The Comarca of Marina Baja has a complex system of conjunctive use of diverse water resources. The Consorcio de Aguas de la Marina Baja is the organism devoted to manage those water resources (http://www.consorciomarinabaja.org/). The main components of the system are Guadalest and Amadorio reservoirs that are mainly used for urban supply. Both reservoirs were originally built for irrigation purposes, but the Consorcio de Aguas de la Marina Baja has promoted agreements with farmers by which these trade their water with Benidorm and other towns’ treated wastewater of enough quality to be used for irrigation, and obtain several compensations in return [36]. The availability of natural water resources (i.e., precipitation, river flow and groundwater) in the watersheds has been highly irregular over time and still is. However, the system has been able to serve urban water demands since the 1970s. The continued use of groundwater as input to the Guadalest reservoir permits a higher regularity in water releases [37].

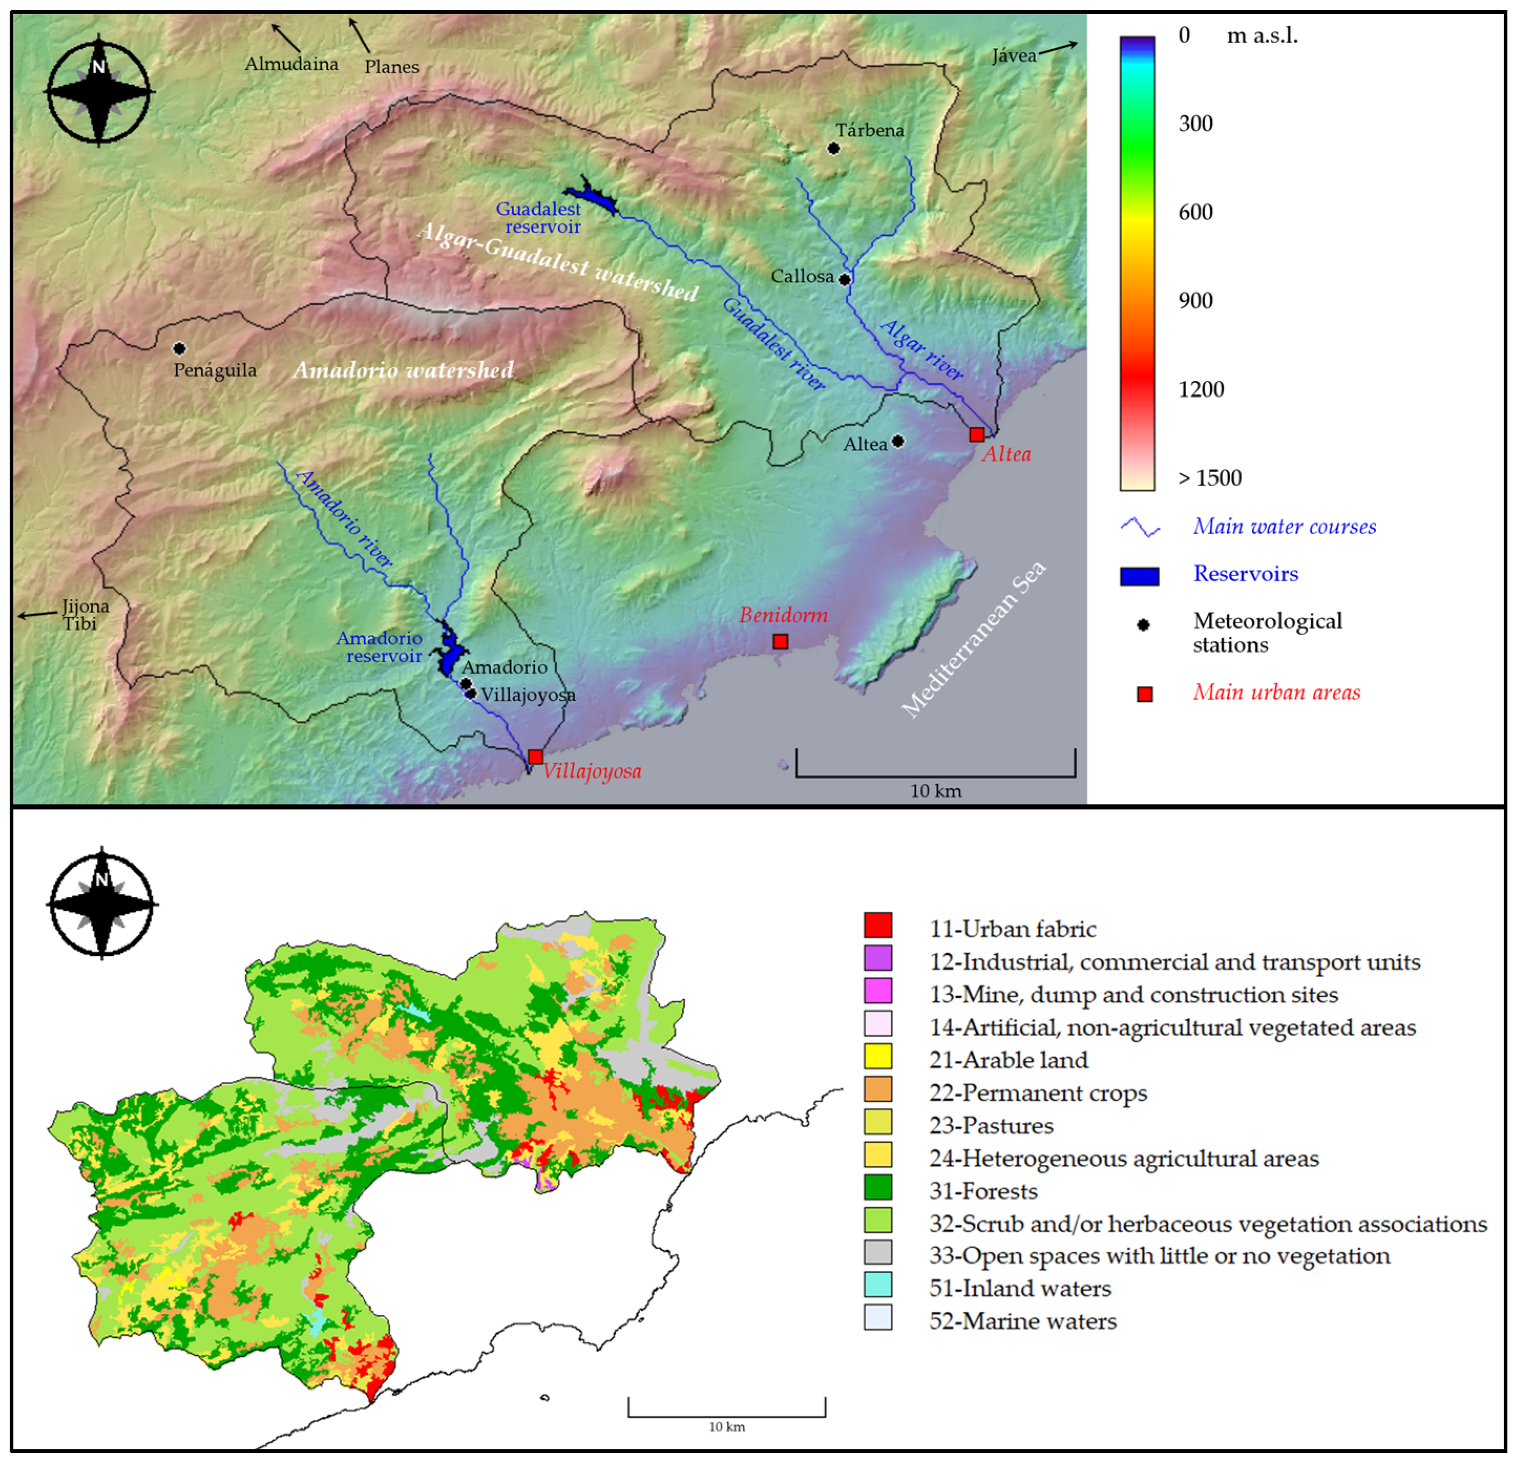
2.1. Remote-Sensing Images and Ancillary Geospatial Information

Vegetation and LST dynamics were observed with a time series of TERRA-MODIS images (Moderate Resolution Imaging Spectroradiometer) from 2001 to 2014. Vegetation status was assessed with a spectral vegetation index, namely the Normalized Differences Vegetation Index (NDVI). The NDVI [38] has been extensively employed as a way to monitor vegetation status by computing seasonal and temporal profiles of vegetation activity (e.g., seasonal and phenologic activity, length of the growing season, peak greenness, onset of greenness, and leaf turnover or ‘dry-down’ period), which enable inter-annual comparisons of vegetation status [39]. Furthermore, LST was retrieved from the thermal bands of the MODIS sensor. LST is an indicator for evapotranspiration, soil moisture and vegetation water stress [27].
Two types of high processing level MODIS products (Level 3-Land products) were employed for our analyses: (1) NDVI composite images acquired at 16-day time interval and 500 m spatial resolution (MOD13A1); and (2) LST composite images acquired at 8-day time interval with a spatial resolution of 1 km (MOD11A2). All the images were obtained from the U.S. Geological Survey-Earth Explorer geodatabase (URL: https://earthexplorer.usgs.gov/). The study area expands across two MODIS tiles. Therefore, the original images had to be mosaicked pairwise for each date. Subsequently, MODIS data were transformed from Sinusoidal projection to UTM-European Terrestrial Reference System 1989 (ETRS89) projection for extracting a subset of 38 × 28 km over the study area. The nominal spatial resolution selected for all the analyses was 1 km. Annual average and standard deviation images were computed. The number of spurious pixels was very low due to the sunny and clear sky condition of the study area throughout the year. However, spurious pixel values were replaced with the average value from the surrounding pixels (3 × 3 filter).
For the geospatial analyses, several cartographic data sources were employed. A digital elevation model (DEM) from the National Institute of Geography of Spain (IGN) was used for watershed analysis. Topographic characteristics of the watershed were computed utilizing the original resolution of the DEM (25 m). Land cover information was obtained from the European Union CORINE Land Cover project (URL: https://land.copernicus.eu). A land cover map from 2012 (Figure 2b) was used to assist in the interpretation of remote-sensing data results. Furthermore, official watershed boundaries and main river courses were obtained from the Hydrographic Confederation of the Júcar River, a national public organism in charge of the planning and control of the watersheds nearby the Júcar River basin (situated in East Spain). A mask of the watersheds was developed and employed to extract individual pixel values for further analyses. ENVI 5 (Harris Geospatial Solutions, Broomfield, CO, USA) and TerrSet (Clark Labs, Worcester, MA, USA) software were used for digital image processing and GIS (Geographical Information System) analyses.

2.2. Climate and Reservoirs Storage Data

Climatic variables were obtained from the 11 meteorological stations from the Ministry of Agriculture and Fisheries, Food and Environment of Spain (MAPAMA), that area located within the study area and surroundings (Figure 1). Eight of them are maintained by the Spanish Meteorological Agency (AEMET) and the others by the Agroclimatic Information System for Irrigation (SIAR). The meteorological stations are located at different elevations, orientations and distances from the coast, in order to obtain information about the variability of climatic conditions in the area. Therefore, they can be assumed to be representative of the present climatic conditions of the study area. For each meteorological station, daily values of precipitation were compiled and used to develop annual time series of total precipitation. Precipitation maps were needed to develop spatial analyses along with the remote-sensing variables. For this reason, we computed annual precipitation maps for each year from 2001 to 2014. Multiple regression models were developed for each year in order to predict annual precipitation (dependent variable) based on geographical variables (elevation and spatial location of the meteorological stations). Previous studies have revealed the importance of distance to the coastline and local orography as a trigger mechanism of rain events [40]. Stepwise method for variable entry and removal was the selected statistical technique. Model performance was based on higher adjusted R2, lower Akaike Information Criterion (AIC) [41], and minimum collinearity measured with the variance inflation factor (VIF) [42]. Regression models were built with the R statistical programming language [43]. Model parameters fitting was used to compute annual precipitation estimation maps based on geographical position and elevation from a DEM.
Future climate conditions were obtained from the WorldClim repository (URL: http://www.worldclim.org) [44]. Precipitation projections for 2050 were obtained from the global climate model developed by Schmidt et al. [45]. We used their climate projections for four representative concentration pathways (RCPs), namely: RCP2.6, RCP4.5, RCP6, and RCP8.5 (+2.6, +4.5, +6.0, and +8.5 W/m2, respectively) [46]. Original geographic coordinates data (0.5 degrees of spatial resolution) were reprojected in order to match MODIS spatial resolution characteristics.
Water volume of the Amadorio and Guadalest reservoirs are continuously monitored by Spanish authorities. These data are publicly available through the Yearbook of the Water Gauging Information System. This is a web tool (http://sig.mapama.es/redes-seguimiento/) owned by the Ministry of Agriculture and Fisheries, Food and Environment (MAPAMA) with information about river gauges and reservoirs water volume. Average monthly water volume records of Guadalest and Amadorio reservoirs were used to compute time series of annual reservoir storage for the period of 2001–2014. Current and future precipitation, along with the reservoir storage volume date, were employed to investigate the occurrence and magnitude of drought/wet periods that may hamper the availability of water resources for natural processes and human activities.

2.3. Statistical Methods

Annual time series of selected variables (i.e., average NDVI and LST, mean reservoir storage and total precipitation) were statistically analyzed in order to better understand temporal change patterns and their inter-relationships. Understanding the past evolution of studied variables and their possible cause–effect relationships is essential to model their future spatial-temporal patterns and determine the usefulness of our remote-sensing time series for the improvement of water management. In this sense, time series anomalies (2001–2014) were computed on an annual basis. The time series anomaly (z-score) was computed according to the following expression [47,48]:
Z = x i μ σ
where xi is the time series value for a given moment i, and µ and σ are respectively the mean value and the standard deviation value of the time series. When the z-score is negative, it indicates below- normal conditions of the selected variable, and when it is positive, it indicates above normal conditions. Vegetation index time series anomalies are a useful method for assessing the degree of wetness or dryness for each time unit in relation to the average value of the time series [49]. A negative z-score value indicates below-average vegetation conditions, thereby pointing to prevailing drought; and when it is positive, it indicates above-average vegetation conditions [49]. The interpretation of positive and negative z-score values for LST, precipitation and reservoir storage time series anomalies follows the same guidelines. Its physical interpretation depends on the variable. When the z-score is negative, it indicates below-normal temperature, precipitation or reservoir storage values, and when it is positive, it indicates above-normal values, thereby pointing to warm/wet seasons or periods [48].
The spatial-temporal relationships among NDVI, LST, precipitation (current or future), and reservoir storage volume time series are the core of our investigation (with the aim of developing fast early detection systems of water supply limitations through remote-sensing images) and were evaluated with three different statistical methods. Firstly, the Spearman rank-order correlation test was used to compute the correlation among z-score time series of average NDVI, LST, current precipitation, and total reservoir storage for both watersheds from 2001 to 2014. Correlation coefficients and significance levels were computed. This test allowed the identification of similar temporal patterns of selected variables. Secondly, correlation images were obtained by computing the correlograms of the annual z-score reservoir storage time series for each reservoir, with respect to the computed annual z-score of NDVI, LST and current precipitation time series of the pixels located within the same watershed. Correlogram results were employed to build correlogram images that express the spatial relationship among reservoir storage anomalies (point data) with respect to the spatial variables. Finally, spatial regression models were used to assess the relationship between precipitation and remote-sensing variables, taking into account the autocorrelation effects. OpenGeoDa software [50] was used for this analysis. This software is part of a suite of GeoDa software tools designed for spatial analysis of geographical information, including spatial autocorrelation and spatial regression algorithms [51]. Ordinary Least Squares spatial regression models were computed, employing future precipitation data as the dependent variable and remotely-sensed variables and topographic parameters as explanatory variables.

3. Results

3.1. Correlation between NDVI, LST and Precipitation

Our first research question was related to the possible existence of significant correlations between NDVI, LST and precipitation time series anomalies. Before addressing that question, we explored the temporal-spatial patterns of remote-sensing variables (i.e., NDVI and LST) and current precipitation maps. The time series of NDVI images exhibits great spatial and temporal variability. Figure 2a,b shows the average and standard deviation values of the NDVI between the years 2001 and 2014. Large areas of the Algar-Guadalest basin report average NDVI values higher than 0.37 and low standard deviations. In fact, the average NDVI value from 2001 to 2014 for this watershed was 0.47 with a coefficient of variation lower than 5%. NDVI values higher than 0.53 are associated with irrigation crops (fruit trees) in mid and low elevations, and dense forest patches in the most remote areas. Conversely, the average NDVI value from 2001 to 2014 for Amadorio watershed was 0.38 with a coefficient of variation higher than 8%. A cluster of high NDVI standard deviation pixels in the NW of the Amadorio basin was observed. A visual inspection of recent aerial orthophotos revealed that it is associated with a forest fire.
Precipitation of the study area is largely affected by the elevation and position with respect to the coastline [40]. For this reason, multiple regression models combining precipitation data, elevation and spatial location of the meteorological stations were applied. All statistical models reported adjusted R2 values higher than 0.7, and their parameters were employed to predict precipitation at unknown locations. Precipitation maps were produced for each year of the study period. Figure 2c,d shows the average and standard deviation values of estimated precipitation between the years 2001 and 2014. The most remarkable observation of the maps is the high spatial variability over a relatively small area. Average precipitation of the Algar-Guadalest basin was 632 mm while average precipitation for the Amadorio basin was 523 mm. Low precipitation areas were found at low elevations near the coastline and southern half of the Amadorio river basin. Larger average precipitation and standard deviation values were found at the highest points of the drainage divide. These areas are very steep and often show bare rock outcrops (this explains their low NDVI values in Figure 2a).
Figure 2e,f shows the average and standard deviation values of the LST between the years 2001 and 2014. LST images revealed relevant altitudinal variations of the temperature. The highest average LST was 25.7 °C and was obtained in the lower sector for the Amadorio watershed, just a few kilometers from the coastline. The lowest average temperature was 18.9 °C and is associated with the location of the highest mountain found in the study area, namely the Aitana peak. LST spatial patterns are clearly affected by the altitudinal gradient (i.e., lower temperatures at higher elevations) and the influence of the sea (coastline temperatures were slightly lower than temperatures in some inland areas). Standard deviation was higher at the lower sector of the more continental Amadorio watershed with respect to the higher areas or the wettest Algar-Guadalest basin. A cluster of high standard deviation LST values spatially correlates with the previously mentioned forest fire area. The removal of the vegetation cover (as detected by the NDVI time series) greatly influenced LST variability.

3.2. Time Series Anomalies Patterns

Time series of selected variables (i.e., average NDVI and LST, and total precipitation) were used to compute annual time series anomalies for each pixel in each of the two watersheds. In addition, reservoir storage time series anomalies were computed too. Figure 3 shows the original time series of the three selected variables for Algar-Guadalest and Amadorio basins as well as their corresponding time-series anomalies (z-score values).
The general pattern of NDVI time series was the same for both watersheds. NDVI values of the Algar-Guadalest basin ranged between 0.6 and 1.0 and were higher than those of the Amadorio basin. The general pattern of both time series was very similar, with subtle but very informative temporal variations. The time series of NDVI anomalies reveals positive values between 2007 and 2011, in addition to the year 2013. Beyond these values, the local maximums of the years 2002 and 2004, which correspond to slightly humid years, are very revealing.
In this sense, the time series of precipitation is very irregular, with abnormally wet years closely followed by years of severe droughts (e.g., 2005). As a result of this great irregularity, the time series of precipitation anomalies exhibits great variations, reflecting instances of drought and wet years very well. The most distinctive feature is the concatenation of a period of above-average precipitation (2006 to 2009) followed by a very severe drought in 2010.
Average LST values were always higher for the southern Amadorio basin but the temporal temperature pattern was very similar for both watersheds. A more detailed analysis revealed two different periods. The first one ranged from 2001 to 2007 and is characterized by a great homogeneity and subtle z-score changes. The second period (2008 to 2014) is dominated by much more extreme LST variations, with two very acute negative z-score values (for 2008 and 2010) followed by rising temperatures, reaching a maximum absolute temperature and z-score value in 2014.
After exploring the relationships between remote-sensing variables and current precipitation time series anomalies (research question #1), we dealt with the second research question: a possible significant correlation between NDVI, LST and water reservoir storage anomalies. The general pattern of the reservoir storage time series shows a gradual increase between 2001 and 2005. From that year on, the time series of anomalies reveals moderate interannual oscillations, with alternating maximum storage volumes between the two reservoirs. The final decline of the reservoir storage coincided with low NDVI and precipitation values, and the highest LST records. All these complex temporal patterns suggested the necessity for employing some statistical methods to shed some light and better understand the relationships among them.

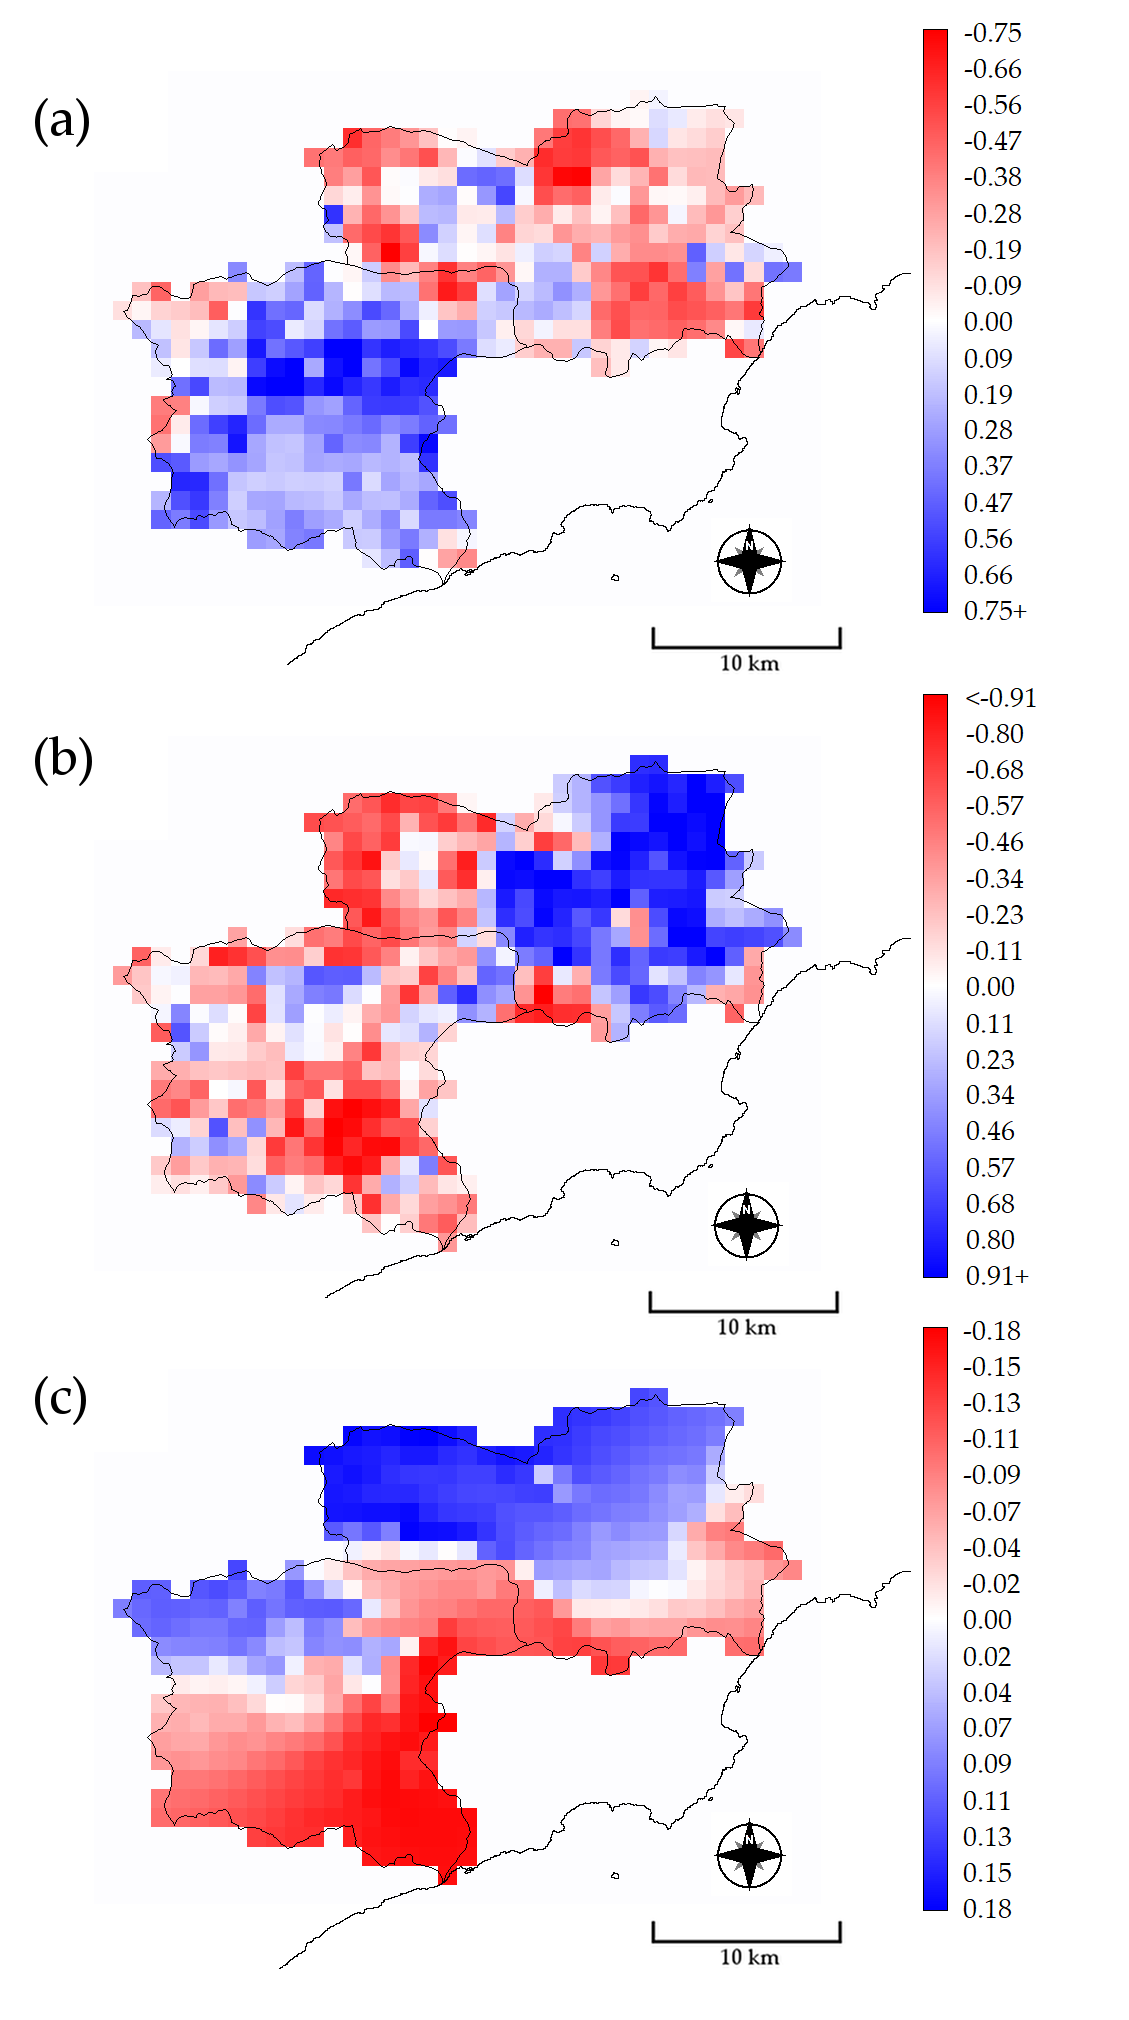
3.3. Spatial-Temporal Relationships between Reservoir Storage, Vegetation Greenness, LST and Precipitation

Once the general patterns of the time series of anomalies were known, the next step was to analyze the relationships between the different variables. Our last research question was related to the possibility of employing remotely sensed time series data (NDVI, LST) together with water reservoir storage changes to spatially and temporally assess current water demands and predict future water needs. With this objective in mind, three different types of analyses were performed: (1) Spearman rank correlation test of z-score time series; (2) correlation images of spatial variables vs. reservoir storage volume; and (3) spatial regression of future precipitation with respect to remote-sensing variables.
Firstly, the correlations between z-score time series for both watersheds were calculated (Table 1). The results obtained for each watershed were quite similar. Highly significant correlations (p-value ≤ 0.01) among the same variables were obtained. It suggests a similar behavior of both basins for the studied variables. We also found significant correlations between different variables. Significant (p-value ≤ 0.05) and highly significant (p-value ≤ 0.01) correlations between NDVI and reservoir storage time series anomalies were found. No significant correlations were reported for other variable combinations. We can observe negative correlation values between LST with respect to NDVI and reservoir storage. Correlation analysis results reinforced our previous observation of similar temporal patterns of the time series anomalies for both watersheds but with some subtle differences (e.g., a magnitude offset between the time series).
Secondly, we developed an image product, called correlation images (Figure 4), that expresses the spatial relationship among reservoir storage anomalies and the explanatory spatial variables. They were obtained by computing the pixel-by-pixel correlation between the z-score values of the NDVI, LST and current precipitation time series with respect to the z-score values of reservoir storage time series. The z-score values (for NDVI, LST or current precipitation) of the pixels located within the Algar-Guadalest watershed were correlated with the Guadalest reservoir time series, and the pixels located within the Amadorio basin were correlated with the homonymous reservoir time series. High positive correlation values reflected some kind of synchronization among the time series, while high negative correlation values suggested a differential behavior among the reservoir storage and explanatory variables. The NDVI correlation image was quite complex with high correlation values for a large portion of the Amadorio watershed, and some clusters of low correlation values at the lower portion of the Algar-Guadalest watershed and the highest elevations. The LST correlation image showed a large cluster of pixels with high correlation values in the middle and lower part of the Algar-Guadalest watershed. On the contrary, a cluster of pixels with negative correlation values was observed in the warmest sector of the Amadorio river basin. The correlation image for the current precipitation adopts a clear trend of negative correlations in the sectors with less precipitation (see Figure 2c), moving to positive correlation values as the precipitation increases.
Finally, we used spatial regression methods to evaluate the predictive capability of our remote-sensing time series (NDVI and LST) with respect to future precipitation scenarios (Table 2). Two types of dependent variables were used: (a) original data from Schmidt et al. [45] for four representative concentration pathways that allow for the prediction of precipitations in 2050; and (b) the difference between our current precipitation maps (2001–2014) with respect to the Schmidt et al. [45] dataset. This second type of data allows for the identification of areas with expected lower/higher precipitation in the future. Predictive variables were the average values of NDVI and LST (see Figure 2) for each pixel of the study area and also their corresponding correlation images (see Figure 4). We also included topographic parameters obtained from the DEM (see Figure 1). Spatial correlograms of predictive variables were used to identify a suitable threshold distance of 4 km for the weights of the regression. Regression models were interactively pruned in order to exclude non-significant predictive variables.
We obtained adjusted R2 values higher than 0.8 for the models predicting future precipitation scenarios. Predictive significant variables were elevation and LST, with an inverse relationship between future prediction and LST. With respect to the expected precipitation change dataset, we also obtained high adjusted R2 values (>0.7) for all the spatial regression models. Predictive significant variables were elevation, LST correlation image and also NDVI correlation image. The relationship between future precipitation changes is positive for the NDVI and negative for LST.

4. Discussion

4.1. Impacts of Predicted Precipitation Scenarios

The precipitation regime of the study area is highly variable both spatially and temporally. Orography greatly influences precipitation patterns [40] and the presence of dry areas, such that the conditions may vary within a short distance [15]. Precipitation also changes from year to year and interannually. Higher precipitation volumes are usually obtained in autumn in the form of torrential rains. In this sense, high-intensity precipitation events (>400 mm in 24 h) are feasible in this area, due to the advection of maritime winds across the Western Mediterranean, driving moist air towards the Alicante Province coast, and the presence of an upper level isolated low pressure system over Eastern Iberian Peninsula [40]. This phenomenon is characteristic of the study area and greatly impacts socio-economic activities and environmental processes. For example, severe flash foods are recurrent each autumn and could promote dramatic consequences like the destruction of infrastructures and even human lives. The high rainfall erosivity induces land degradation process (i.e., soil erosion) by extreme runoff. It greatly endangers soil resources due to the vulnerability of dominant soil types (especially Leptosols). Besides, the occurrence of extreme autumn precipitation events just after the devastation of summer wildfires may increase the risk of soil degradation. Water resources are quantitatively and qualitatively affected by these kinds of land degradation processes [52,53]. This is particularly concerning for an area facing severe problems of managing highly fluctuating seasonal water demands.
Precipitation estimations by global climate prediction models (such as Schmidt et al. [46], and used in this work) are revealing future scenarios of even worse water scarcity for many arid and semiarid regions (Figure 5). This is an alarming situation because many of those areas are densely populated and potentially face a future with less water resources (intensification of drought periods) and higher water demands (e.g., urban water supply, agriculture irrigation). Fortunately, drought assessment through remote sensing—although a complex research topic—has been achieving highly successful results obtained by combining the time series of NDVI and LST [54]. Both remote-sensing variables may be synergistically combined to develop easy-to-implement empirical indices based on the assumption of a negative correlation between both variables [55]. However, their correlation may be much more complex than previously thought and may change from negative to positive as the climatic conditions change [27]. Further, spatial autocorrelation may alter the conclusion of statistical analyses performed without the allowance for it [56,57]. This type of correlation has been investigated in the past but this work differs from previous work by showing/investigating the complexity of this relationship with respect to changing climatic conditions. For these reasons, this work is a multistage approach to evaluate the spatial-temporal relationships of NDVI and LST time series, with respect to precipitation (current and future predictions) and available water resources (i.e., volume of water stored in reservoirs) time series. We combined three different data analysis procedures: (1) time series anomalies analysis to detect general temporal patterns of the variables; (2) image correlation to detect through remote-sensing areas whose environmental characteristics and land management could greatly affect available water resources; and (3) spatial regression analysis to assess the predictive capabilities of NDVI and LST time series to quantify current and future precipitation.

4.2. Correlation between Time Series Anomalies of NDVI, LST, Precipitation and Water Reservoir Changes

Time series anomalies have been previously employed for vegetation index time series analysis in relation to climatic variables [58,59] and hydrological parameters [48]. They provide an intuitive way to identify the intensity and duration of phenological and vegetation degradation processes, along with extreme climate variations. Correlations between NDVI and precipitation in the study area were found to be low, especially for the wetter Algar-Guadalest basin. It seems that vegetation phenology is not coupled with inter- and intra-annual precipitation patterns. We also reported this weak relationship between both time series for another study area in the province of Alicante [47]. Our previous research applied Fourier transform analysis to MODIS vegetation index and climate variables time series, and the results evidenced that vegetation phenology was not correlated with climatic variables for the harmonic analysis phase term, suggesting a delay between climatic variations and vegetation greenness [47]. It may be due to the semiarid and subhumid biomes’ response to drought at long time scales caused by the physiological adaptions of Mediterranean vegetation to water stress periods [60]. Other authors also evidenced this low correlation between NDVI and rainfall, showing worse correlations in the wetter areas of the province of Alicante mountains (i.e., NDVI and precipitation correlations are not sufficient to assess and predict droughts) [61]. With respect to the LST, the correlation between NDVI and LST always produced negative values, thus indicating a reduction of vegetation greenness when LST rises. This kind of relation is characteristic of areas prone to droughts where water is ultimately the limiting factor for vegetation growth [27]. On the other hand, significant positive correlations among NDVI and surface water resources time series anomalies were obtained. These correlations suggest that an interannual relationship between NDVI and reservoir storage variability can be established. The importance of this observation lies in the fact that multi-temporal remote-sensing observations of certain environmental parameters could be used to monitor and predict the quantity of available water resources. The development of the vegetation causing an increase of NDVI, which showed an apparent contradiction between precipitations versus water storage, may be closely related to the soil moisture and a delayed response of plants after a rainfall event. Therefore, the response of vegetation after precipitation is closer to the process of storing water in reservoirs than the precipitation itself.
The z-score correlation images (Figure 4) were suitable to relate the variability of a point data time series (i.e., reservoir storage measured in a dam) with remotely-sensed spatial-temporal time series (like NDVI, LST, evaporation, etc.). The high positive values of the NDVI correlation image at the lower parts of Amadorio watershed evidence synchronization between vegetation (forest and seminatural vegetation and rainfed agriculture) and reservoir storage dynamics. This is reinforced by the results of the LST correlation image that highlighted a cluster of pixels with negative correlation values in the warmest sector of the Amadorio river basin. Its natural vegetation phenology and reservoir storage volume are controlled by LST temporal changes, because when LST rises (from spring to summer), vegetation greenness and surface water resources decline. This watershed is less suitable for cropping and water supply [37]. On the contrary, water resources (surface and groundwater) in the Algar-Guadalest basin are more intensively controlled by water management. A complex system of water transfer from the aquifers to the reservoir has been established to maintain steady water supply [37]. This water management system manages water demands from agriculture and tourism economic sectors, along with governmental (urban water supply) and environmental requirements. This situation greatly influences the magnitude of the correlation between Guadalest reservoir storage and climatic variables. Thus, remote sensing can play a critical role in the assessment of water demands. Another study in the province of Alicante confirmed the great utility of remote-sensing images to detect different water management practices in irrigated agricultural areas and nearby natural areas [62]. The information portrait in the land cover map (Figure 1) was compared with the NDVI correlation image (Figure 4). It reveals that permanent crops (i.e., fruit trees) are located where a large cluster of pixels with negative correlation is shown. Crops’ productivity maintenance requires an adequate water supply even in drought years/seasons, thus explaining the negative correlation. In addition, negative correlations were observed in two sectors of the Guadalest basin. These areas are quite elevated, with predominantly very steep and rocky slopes, and with little or no vegetation (CORINE Land Cover classes 32 and 33). Leptosols over highly permeable calcites are found here. Mean NDVI values of those pixels were relatively low with respect to surrounding areas (Figure 2) due to the characteristics of these mountainous ecosystems. Both clusters of pixels are approximately located over the two most important aquifers (i.e., Beniardá and Algar) of the Marina Baja water supply system whose waters are employed for irrigation (through springs and irrigation channels), diverted for water supply to other areas or stored in the Guadalest reservoir. This may explain the weak relationship found between NDVI and reservoir storage in those aquifer recharge zones.

4.3. Assessing Water Demands and Usage with MODIS Derived Products

Our final analysis was focused on the exploration of possible future scenarios of water scarcity that may hamper human activities and environmental processes. This particularly concerns arid/semiarid areas that are the most sensitive ecosystems to climate impact [63]. Because correlation results between remote-sensing variables and precipitation time series were weak and inconclusive, we decided to explore the effects of spatial autocorrelation through spatial analysis techniques. Spatial autocorrelation is a property of random variables, taking values in pairs of locations at a certain distance apart that are more similar (positive autocorrelation) or less similar (negative autocorrelation) than expected for randomly associated pairs of observations [56]. We used spatial regression models because they are developed to deal with the fact that observations over geographical space are likely to be correlated with one another [64], and spatial regression models can effectively resolve problems with correlated geographic data [65,66]. Our previous research in a nearby study area evidenced the importance of considering spatial autocorrelation effects by combining remote sensing and ancillary information [67]. In this sense, our spatial regression results (Table 2) suggest that LST and NDVI time series can be utilized as proxies to predict future scenarios of precipitation in an effort to improve land management practices. Positive trends of NDVI time series in semiarid regions could be associated with less dramatic precipitation changes, whereas an increase of LST values may negatively impact the water cycle in this kind of Mediterranean watershed.
Future carbon sequestration will also be at risk predominantly in southern Europe [68]. Especially lower precipitation is expected in the more elevated areas of the watersheds that are extremely important for groundwater recharge and the efficient functioning of the entire water supply system. Therefore, it is recommended that the knowledge gained through remote sensing in this work (the spatial-temporal influence of NDVI and LST time series on available water resources) be used to promote an alert system that allows integrating water and land management. Future scenarios of climate change will pose a challenge for the maintenance of our socio-economic activities and the conservation of ecosystems. In this sense, the best source of information available is most likely remote sensing, given that it is capable of providing information about land, atmosphere and water, in their spatial and temporal dimensions. Additionally, in the context of the study area, spatial autocorrelation effects seem to be highly relevant and have to be considered to properly extract information from the remote-sensing data sources.

5. Conclusions

This study assessed the interdependency between vegetation spectral indices (NDVI), LST, precipitation (current and future), and surface water resources in a semiarid area (two watersheds in southeastern Spain with serious difficulties in meeting water demands). NDVI and LST images were obtained from MODIS and allowed for the identification of relevant responses to current climate variability (from 2001 to 2014). Correlations between NDVI and precipitation time series were not very strong, probably because vegetation phenology is not perfectly coupled with inter- and intra-annual precipitation patterns (semiarid and subhumid biomes may respond to droughts of long time scales due to the ability of vegetation to withstand periodic droughts). Additionally, correlations between NDVI and LST always produced negative values, thus indicating a reduction of vegetation greenness when LST rises. The relationships among NDVI and climate variables evidenced the importance of water as a relevant limiting factor for vegetation growth.
The temporal correspondence between reservoir storage and remote-sensing time series was very remarkable, thus suggesting a great potential of NDVI and LST to improve the monitoring and management of water resources in the study area. In this sense, correlation maps allowed for the identification of areas where natural vegetation phenology and reservoir storage volume is controlled by LST temporal changes (Amadorio basin). Additionally, negative NDVI correlations were found at different sectors of the Algar-Guadalest basin. They are associated with areas of irrigated crops with high water demands and forest and seminatural areas located over aquifers intensely exploited for agriculture and water supply. Of great concern should be the fact that the best correlation with reservoir storage coincides with areas where significant decreases in precipitation are expected, which correspond with the two most important aquifers of the study area. These results evidence the capability of optical remote-sensing data (MODIS, Landsat, Sentinel-2) to detect different water management practices related to the transfer of water from the main aquifers to the Guadalest reservoir. Spatial regression models evidence the importance of taking into account spatial autocorrelation effects in the statistical analyses along with the potential use of NDVI and LST time series to predict future scenarios of precipitation under climate change constrains.
The enormous competition for available water in the study area (i.e., urban water supply, agriculture and maintenance of ecosystems) may be exacerbated in the future. Climate change will most likely trigger a change in Mediterranean arid and semi-arid regions to lower rainfall scenarios. A comparison of current precipitation and future precipitation conditions obtained from global climate models reinforces this statement and evidences that the most dramatic precipitation reductions will be associated with the higher elevation areas in both basins. This observation concerns areas that are very important for groundwater storage and surface runoff that critically contribute to reservoir storage variations. The future impact of climate change on water resources needs adaptive strategies based on accurate and updated spatial-temporal information. For this reason, the use of Earth Observation technologies to monitor and predict land cover changes, soil-vegetation degradation processes, and available water resources is a scientific and social priority.

Author Contributions

G.M.-D.S. and I.M.-P. have a major contribution in the experimental development and the other authors in the experimental design. All of the authors contributed equally for the rest of the work.

Funding

This research received no external funding.

Acknowledgments

We express our gratitude to the NASA’s MODIS project for providing NDVI satellite imagery free of charge. We acknowledge the Spanish Meteorological Agency (AEMET) and the Agroclimatic Information System for Irrigation (SIAR) for providing meteorological information. We are also grateful to the European Environmental Agency for the public access of the CORINE land cover cartography.

Conflicts of Interest

The authors declare no conflict of interest.

References

  1. Vicente-Serrano, S.M. Evaluating the Impact of Drought Using Remote Sensing in a Mediterranean, Semi-arid Region. Nat. Hazards 2007, 40, 173–208. [Google Scholar] [CrossRef]
  2. Giorgi, F.; Lionello, P. Climate change projections for the Mediterranean region. Glob. Planet. Chang. 2008, 63, 90–104. [Google Scholar] [CrossRef]
  3. Vera-Rebollo, J.F. Cambio climático y política turística en España: Diagnóstico del litoral mediterráneo español. Cuadernos de Turismo 2016, 38, 323–359. [Google Scholar] [CrossRef]
  4. Verheye, W.H. Dry Lands and Desertification. In Encyclopedia of Land Use, Land Cover Soil Sciences; Verheye, W.H., Ed.; United Nations Educational, Scientific and Cultural Organization (UNESCO) and Encyclopedia of Life Support Systems (EOLSS): Paris, France, 2009; pp. 1–40. [Google Scholar]
  5. Olcina Cantos, J. Cambio climático y riesgos climáticos en España. Investigaciones Geográficas 2009, 197–220. [Google Scholar] [CrossRef]
  6. Ostendorf, B. Overview: Spatial information and indicators for sustainable management of natural resources. Ecol. Indic. 2011, 11, 97–102. [Google Scholar] [CrossRef]
  7. De Araujo Barbosa, C.C.; Atkinson, P.M.; Dearing, J.A. Remote sensing of ecosystem services: A systematic review. Ecol. Indic. 2015, 52, 430–443. [Google Scholar] [CrossRef]
  8. IPCC. Part A: Global and Sectoral Aspects. Contribution of Working Group II to the Fifth Assessment Report of the Intergovernmental Panel on Climate Change. In Climate Change 2014: Impacts, Adaptation, Vulnerability; Field, C.B., Barros, V.R., Dokken, D.J., Mach, K.J., Mastrandrea, M.D., Bilir, T.E., Chatterjee, M., Ebi, K.L., Estrada, Y.O., Genova, R.C., et al., Eds.; Cambridge University Press: Cambridge, UK; New York, NY, USA, 2014; ISBN 978-1-107-64165-5. [Google Scholar]
  9. World Water Assessment Programme. The United Nations World Water Development. Report 3: Water in a Changing World; United Nations Educational, Scientific and Cultural Organization (UNESCO)/Earthscan: Paris, France; London, UK, 2009; p. 429. ISBN 978-9-23104-095-5. [Google Scholar]
  10. Consorcio de Aguas de la Marina Baja. Available online: https://www.diarioinformacion.com/especiales/dia-mundial-agua/2018/03/consorcio-aguas-marina-baja-mejor-gestion-integral-recursos-n1433_1_42849.html (accessed on 4 June 2019).
  11. Lehner, B.; Liermann, C.R.; Revenga, C.; Vörömsmarty, C.; Fekete, B.; Crouzet, P.; Döll, P.; Endejan, M.; Frenken, K.; Magome, J.; et al. High-resolution mapping of the world’s reservoirs and dams for sustainable river-flow management. Front. Ecol. Environ. 2011, 9, 494–502. [Google Scholar] [CrossRef]
  12. IPCC-TGICA. General Guidelines on the Use of Scenario Data for Climate Impact Adaptation Assessment, 2nd ed.; Intergovernmental Panel on Climate Change (IPCC)-Task Group on Data and Scenario Support for Impact and Climate Assessment (TGICA): Geneva, Switzerland, 2007; p. 66. [Google Scholar]
  13. García-Ruiz, J.M.; López-Moreno, J.I.; Vicente-Serrano, S.M.; Lasanta, T.; Beguería, S. Mediterranean water resources in a global change scenario. Earth-Sci. Rev. 2011, 105, 121–139. [Google Scholar] [CrossRef] [Green Version]
  14. Mereu, S.; Sušnik, J.; Trabucco, A.; Daccache, A.; Vamvakeridou-Lyroudia, L.; Renoldi, S.; Virdis, A.; Savić, D.; Assimacopoulos, D. Operational resilience of reservoirs to climate change, agricultural demand, and tourism: A case study from Sardinia. Sci. Total Environ. 2016, 543, 1028–1038. [Google Scholar] [CrossRef] [PubMed] [Green Version]
  15. Mühlbauer, S.; Costa, A.C.; Caetano, M. A spatiotemporal analysis of droughts and the influence of North Atlantic Oscillation in the Iberian Peninsula based on MODIS imagery. Theor. Appl. Climatol. 2016, 124, 703–721. [Google Scholar] [CrossRef]
  16. Nilsson, C. Reservoirs. Encycl. Inland Waters 2009, 625–633. [Google Scholar] [CrossRef]
  17. Nemani, R.; Running, S. Land Cover characterization using multitemporal RED, NEAR-IR, and THERMAL-IR data from NOAA/AVHRR. Ecol. Appl. 1997, 7, 79–90. [Google Scholar] [CrossRef]
  18. Zhan, Z.; Qin, Q.; Wang, X. The application of LST/NDVI index for monitoring land surface moisture in semiarid area. In Proceedings of the International Geoscience Remote Sensing Symposium (IGARSS), Anchorage, AK, USA, 27 December 2004; Volume 3, pp. 1551–1554. [Google Scholar]
  19. Leroux, L.; Baron, C.; Zoungrana, B.; Traore, S.B.; Lo Seen, D.; Begue, A. Crop Monitoring Using Vegetation and Thermal Indices for Yield Estimates: Case Study of a Rainfed Cereal in Semi-Arid West Africa. IEEE J. Sel. Top. Appl. Earth Obs. Remote Sens. 2016, 9, 347–362. [Google Scholar] [CrossRef]
  20. Colliander, A.; Fisher, J.B.; Halverson, G.; Merlin, O.; Misra, S.; Bindlish, R.; Jackson, T.J.; Yueh, S. Spatial Downscaling of SMAP Soil Moisture Using MODIS Land Surface Temperature and NDVI during SMAPVEX15. IEEE Geosci. Remote Sens. Lett. 2017, 14, 2107–2111. [Google Scholar] [CrossRef]
  21. Tran, H.T.; Campbell, J.B.; Tran, T.D.; Tran, H.T. Monitoring drought vulnerability using multispectral indices observed from sequential remote sensing (Case Study: Tuy Phong, Binh Thuan, Vietnam). GIScience Remote Sens. 2017, 54, 167–184. [Google Scholar] [CrossRef] [Green Version]
  22. Wang, P.; Li, X.; Gong, J.; Song, C. Vegetation temperature condition index and its application for drought monitoring. In Proceedings of the International Geoscience Remote Sensing Symposium (IGARSS), Sydney, Australia, 9–13 July 2001; Volume 1, pp. 141–143. [Google Scholar]
  23. Wan, Z.; Wang, P.; Li, X. Using MODIS Land Surface Temperature and Normalized Difference Vegetation Index products for monitoring drought in the southern Great Plains, USA. Int. J. Remote Sens. 2004, 25, 61–72. [Google Scholar] [CrossRef]
  24. Cunha, A.P.M.; Alvalá, R.C.; Nobre, C.A.; Carvalho, M.A. Monitoring vegetative drought dynamics in the Brazilian semiarid region. Agric. For. Meteorol. 2015, 214, 494–505. [Google Scholar] [CrossRef]
  25. Sánchez, N.; González-Zamora, A.; Piles, M.; Martínez-Fernández, J. A new Soil Moisture Agricultural Drought Index (SMADI) integrating MODIS and SMOS products: A case of study over the Iberian Peninsula. Remote Sens. 2016, 8, 287. [Google Scholar] [CrossRef]
  26. Patel, N.R. Investigating relations between satellite derived land surface parameters and meteorological variables. Geocarto Int. 2006, 21, 47–53. [Google Scholar] [CrossRef]
  27. Karnieli, A.; Agam, N.; Pinker, R.T.; Anderson, M.; Imhoff, M.L.; Gutman, G.G.; Panov, N.; Goldberg, A. Use of NDVI and land surface temperature for drought assessment: Merits and limitations. J. Clim. 2010, 23, 618–633. [Google Scholar] [CrossRef]
  28. You, N.; Meng, J.; Zhu, L. Sensitivity and resilience of ecosystems to climate variability in the semi-arid to hyper-arid areas of Northern China: A case study in the Heihe River Basin. Ecol. Res. 2018, 33, 161–174. [Google Scholar] [CrossRef]
  29. IGME-SGE. Geología de España; Vera, J.A., Ed.; Geological Survey of Spain (IGME) and Spanish Geological Society (SGE): Madrid, Spain, 2004; p. 884. ISBN 84-7840-546-1.
  30. Generalitat Valenciana. Informe del Sector Agrario Valenciano 2016. Available online: http://www.agroambient.gva.es/es/informes-del-sector-agrario-valenciano (accessed on 12 June 2018).
  31. IUSS Working Group WRB. World Reference Base for Soil Resources 2014. Update 2015. World Soil Resources Report No. 106; Food and Agriculture Organization of the United Nations (FAO): Rome, Italy, 2015; p. 203. ISBN 978-92-5-108369-7. [Google Scholar]
  32. European Commission. Soil Atlas of Europe. European Soil Bureau Network European Commission; Office for Official Publications of the European Communities: Luxembourg, 2005; p. 128. ISBN 92-894-8120-X. [Google Scholar]
  33. AEMET-IMP. Iberian Climate Atlas. Air Temperature Precipitation (1971–2000); Spanish Meteorological Agency (AEMET) and Portuguese Institute of Meteorology (IMP): Madrid, Spain; Lisbon, Portugal, 2011; p. 80. ISBN 978-84-7837-079-5.
  34. Zaragozí, B.; Navarro, J.T.; Ramón, A.; Rodríguez-Sala, J.J. A Study of Drivers for Agricultural Land Abandonment Using GIS and Data Mining Techniques. In Proceedings of the Eighth International Conference on Ecosystems and Sustainable Development, Alicant, Spain, 13–15 April 2011; Volume 144, pp. 363–374. [Google Scholar]
  35. Martí, T.T. Use competition and water exchange in Marina Baja district, Alicante, Spain. Water Sci. Technol. Water Supply 2005, 5, 265–272. [Google Scholar] [CrossRef]
  36. Rico-Amoros, A.M.; Sauri, D.; Olcina-Cantos, J.; Vera-Rebollo, J.F. Beyond Megaprojects? Water Alternatives for Mass Tourism in Coastal Mediterranean Spain. Water Resour. Manag. 2013, 27, 553–565. [Google Scholar] [CrossRef]
  37. Castaño, S.; Murillo, J.M.; Hernández, L.R. Alternatives in water resources management in Marina Baja district (Alicante province, Spain). In Proceedings of the 3rd International Conference on Future Groundwater Resources at Risk-FGR’01; Ribeiro, L., Ed.; CVRM-Instituto Superior Técnico: Lisbon, Portugal, 2001; pp. 479–486. [Google Scholar]
  38. Rouse, J.W.; Hass, R.H.; Schell, J.A.; Deering, D.W. Monitoring Vegetation Systems in the Great Plains with ERTS. In Proceedings of the Third Earth Resources Technology Satellite-1 Symposium, Washington, DC, USA, 1 January 1974; pp. 3010–3017. [Google Scholar]
  39. Huete, A.; Justice, C.; Van Leeuwen, W. MODIS Vegetation Index (MOD 13). Algorithm Theoretical Basis Document. Version 3; NASA Goddard Space Flight Center: Greenbelt, MD, USA, 1999; p. 129.
  40. Pastor, F.; Gómez, I.; Estrela, M.J. Numerical study of the October 2007 flash flood in the Valencia region (Eastern Spain): The role of orography. Nat. Hazards Earth Syst. Sci. 2010, 10, 1331–1345. [Google Scholar] [CrossRef]
  41. Akaike, H. A New Look at the Statistical Model Identification. IEEE Trans. Automat. Contr. 1974, 19, 716–723. [Google Scholar] [CrossRef]
  42. O’brien, R.M. A Caution Regarding Rules of Thumb for Variance Inflation Factors. Qual. Quant. 2007, 41, 673–690. [Google Scholar] [CrossRef]
  43. R Core Team. R: A Language and Environment for Statistical Computing; R Foundation for Statistical Computing: Vienna, Austria, 2018. [Google Scholar]
  44. Hijmans, R.J.; Cameron, S.E.; Parra, J.L.; Jones, P.G.; Jarvis, A. Very high resolution interpolated climate surfaces for global land areas. Int. J. Climatol. 2005, 25, 1965–1978. [Google Scholar] [CrossRef]
  45. Schmidt, G.A.; Ruedy, R.; Hansen, J.E.; Aleinov, I.; Bell, N.; Bauer, M.; Bauer, S.; Cairns, B.; Canuto, V.; Cheng, Y.; et al. Present-Day Atmospheric Simulations Using GISS ModelE: Comparison to In Situ, Satellite, and Reanalysis Data. J. Clim. 2006, 19, 153–192. [Google Scholar] [CrossRef]
  46. Schmidt, G.A.; Kelley, M.; Nazarenko, L.; Ruedy, R.; Russell, G.L.; Aleinov, I.; Bauer, M.; Bauer, S.E.; Bhat, M.K.; Bleck, R.; et al. Configuration and assessment of the GISS ModelE2 contributions to the CMIP5 archive. J. Adv. Model. Earth Syst. 2014, 6, 141–184. [Google Scholar] [CrossRef]
  47. Melendez-Pastor, I.; Navarro-Pedreño, J.; Koch, M.; Gómez, I.; Hernández, E.I. Land-Cover Phenologies and Their Relation to Climatic Variables in an Anthropogenically Impacted Mediterranean Coastal Area. Remote Sens. 2010, 2, 697–716. [Google Scholar] [CrossRef]
  48. Melendez-Pastor, I.; Hernández, E.I.; Navarro-Pedreño, J.; Gómez, I.; Almendro-Candel, M.B. Influence of precipitation and land cover changes in a Mediterranean mountain watershed (Guadalaviar River, Spain). Eur. Water 2017, 57, 141–146. [Google Scholar]
  49. Barbosa, H.A.; Huete, A.R.; Baethgen, W.E. A 20-year study of NDVI variability over the Northeast Region of Brazil. J. Arid Environ. 2006, 67, 288–307. [Google Scholar] [CrossRef]
  50. Anselin, L.; McCann, M. OpenGeoDa, open source software for the exploration and visualization of geospatial data. In Proceedings of the ACM International Symposium on Advances in Geographic Information Systems, Tempe, AZ, USA, 4–9 November 2009; pp. 550–551. [Google Scholar]
  51. Anselin, L.; Syabri, I.; Kho, Y. GeoDa: An Introduction to Spatial Data Analysis. Geogr. Anal. 2006, 38, 5–22. [Google Scholar] [CrossRef]
  52. Erol, A.; Randhir, T.O. Watershed ecosystem modeling of land-use impacts on water quality. Ecol. Modell. 2013, 270, 54–63. [Google Scholar] [CrossRef]
  53. Palazón, L.; Navas, A. Modeling sediment sources and yields in a Pyrenean catchment draining to a large reservoir (Ésera River, Ebro Basin). J. Soils Sediments 2014, 14, 1612–1625. [Google Scholar] [CrossRef]
  54. Julien, Y.; Sobrino, J.A. The Yearly Land Cover Dynamics (YLCD) method: An analysis of global vegetation from NDVI and LST parameters. Remote Sens. Environ. 2009, 113, 329–334. [Google Scholar] [CrossRef]
  55. Khan, J.; Wang, P.; Xie, Y.; Wang, L.; Li, L. Mapping MODIS LST NDVI Imagery for Drought Monitoring in Punjab Pakistan. IEEE Access 2018, 6, 19898–19911. [Google Scholar] [CrossRef]
  56. Legendre, P. Spatial Autocorrelation: Trouble or New Paradigm? Ecology 1993, 74, 1659–1673. [Google Scholar] [CrossRef]
  57. Dutilleul, P. Spatial Heterogeneity and the Design of Ecological Field Experiments. Ecology 1993, 74, 1646–1658. [Google Scholar] [CrossRef]
  58. Anderson, L.O.; Malhi, Y.; Aragão, L.E.O.C.; Saatchi, S. Spatial patterns of the canopy stress during 2005 drought in Amazonia. In Proceedings of the 2007 IEEE International Geoscience and Remote Sensing Symposium, Barcelona, Spain, 23–28 July 2007; pp. 2294–2297. [Google Scholar]
  59. González-Loyarte, M.M.; Menenti, M. Impact of rainfall anomalies on Fourier parameters of NDVI time series of northwestern Argentina. Int. J. Remote Sens. 2008, 29, 1125–1152. [Google Scholar] [CrossRef]
  60. Vicente-serrano, S.M.; Gouveia, C.; Julio, J.; Beguería, S.; Trigo, R. Response of vegetation to drought time-scales across global land biomes. Proc. Natl. Acad. Sci. USA 2012, 110, 52–57. [Google Scholar] [CrossRef] [PubMed] [Green Version]
  61. Belda, F. Relationships between climatic parameters and forest vegetation: Application to burned area in Alicante (Spain). For. Ecol. Manag. 2000, 135, 195–204. [Google Scholar] [CrossRef]
  62. Melendez-Pastor, I.; Navarro-Pedreño, J.; Gómez, I.; Koch, M. Detecting drought induced environmental changes in a Mediterranean wetland by remote sensing. Appl. Geogr. 2010, 30, 254–262. [Google Scholar] [CrossRef]
  63. Roerink, G.J.; Menenti, M.; Soepboer, W.; Su, Z. Assessment of climate impact on vegetation dynamics by using remote sensing. Phys. Chem. Earth 2003, 28, 103–109. [Google Scholar] [CrossRef]
  64. Baltagi, B.H.; Heun Song, S.; Cheol Jung, B.; Koh, W. Testing for serial correlation, spatial autocorrelation and random effects using panel data. J. Econom. 2007, 140, 5–51. [Google Scholar] [CrossRef]
  65. Yang, X.; Jin, W. GIS-based spatial regression and prediction of water quality in river networks: A case study in Iowa. J. Environ. Manag. 2010, 91, 1943–1951. [Google Scholar] [CrossRef] [PubMed]
  66. Yin, C.; Yuan, M.; Lu, Y.; Huang, Y.; Liu, Y. Effects of urban form on the urban heat island effect based on spatial regression model. Sci. Total Environ. 2018, 634, 696–704. [Google Scholar] [CrossRef] [PubMed]
  67. Melendez-Pastor, I.; Navarro-Pedreño, J.; Koch, M.; Gómez, I. Multi-resolution and temporal characterization of land use classes in a Mediterranean wetland with land cover fractions. Int. J. Remote Sens. 2010, 31, 5365–5389. [Google Scholar] [CrossRef]
  68. Van Oijen, M.; Balkovi, J.; Beer, C.; Cameron, D.R.; Ciais, P.; Cramer, W.; Kato, T.; Kuhnert, M.; Martin, R.; Myneni, R.; et al. Impact of droughts on the carbon cycle in European vegetation: A probabilistic risk analysis using six vegetation models. Biogeosciences 2014, 11, 6357–6375. [Google Scholar] [CrossRef]
Figure 1. Maps describing the study area. (Top) Delineation of the Amadorio and Algar-Guadalest watersheds. Main rivers and reservoirs are shown. Meteorological stations are indicated by black dots and stations outside the map boundary by arrows. The background image is the digital elevation model employed in the analyses. (Bottom) CORINE 2012 land cover map. Level 2 of the legend schematization is shown.
Remotesensing 11 01355 g001
Figure 2. Average (a) and standard deviation (b) NDVI images of the study area for the period 2001 to 2014. Average (c) and standard deviation (d) estimated precipitation images (in mm) of the study area for the period 2001 to 2014. Average (e) and standard deviation (f) LST images (in Celsius degrees) of the study area for the period 2001 to 2014. The delineation of the watersheds and the coastline are shown (black lines).
Remotesensing 11 01355 g002
Figure 3. Raw data and z-score time series of average NDVI, average precipitation, LST, and total reservoir storage for Algar-Guadalest (blue lines) and Amadorio (red lines) watersheds from 2001 to 2014.
Remotesensing 11 01355 g003
Figure 4. z-score correlation image among reservoir storage vs. (a) NDVI, (b) LST, and (c) current precipitation time-series anomalies.
Remotesensing 11 01355 g004
Figure 5. Differences between current precipitation and 2050 predicted precipitation under RCP2.6, RCP4.5, RCP6, and RCP8.5 (maps (ad) respectively) climate scenarios. Negative values indicate a decrease in precipitation whereas positive values reflect an increase.
Remotesensing 11 01355 g005
Table 1. Spearman rank correlation test results for z-score time series of NDVI, precipitation, LST, and reservoir storage for Algar-Guadalest (A-G) and Amadorio (Am.) watersheds.
VariablesNDVIPrecipitationLSTReservoir Storage
A-GAm.A-GAm.A-GAm.A-GAm.
NDVIA-G10.956 **0.1030.125−0.376−0.4730.565 *0.824 **
Am.0.956 **10.1650.196−0.305−0.4330.565 *0.802 **
PrecipitationA-G0.1030.16510.996 **0.3490.2880.2620.090
Am.0.1250.1960.996 **10.3230.2570.3100.143
LSTA-G−0.376−0.3050.3490.32310.930 **−0.403−0.363
Am.−0.473−0.4330.2880.2570.930 **1−0.370−0.367
Reservoir storageA-G0.565 *0.565 *0.2620.310−0.403−0.37010.843 **
Am.0.824 **0.802 **0.0900.143−0.363−0.3670.843 **1
Significance levels: [*] = p ≤ 0.05; [**] = p ≤ 0.01.
Table 2. Spatial regression model results. Model adjustment statistics and the explanatory variables information are shown.
Precipitation PredictionsAdj. R2p-ValueVariablesCoefficientStd. Errorp-Value
Future precipitation predictionsRCP260.819<0.001Constant1006.88525.508<0.001
Elevation0.0430.005<0.001
LST (mean 2001–2014)−22.4781.016<0.001
RCP450.829<0.001Constant927.37023.672<0.001
Elevation0.0490.005<0.001
LST (mean 2001–2014)−20.2060.942<0.001
RCP600.835<0.001Constant898.84422.895<0.001
Elevation0.0510.005<0.001
LST (mean 2001–2014)−19.6070.911<0.001
RCP850.828<0.001Constant937.13823.380<0.001
Elevation0.0450.005<0.001
LST (mean 2001–2014)−20.5570.931<0.001
Precipitation change (future prediction-present)RCP260.722<0.001Constant70.0064.533<0.001
Elevation−0.2140.007<0.001
LST correlogram image−42.7734.093<0.001
NDVI correlogram image57.9105.863<0.001
RCP450.725<0.001Constant47.2974.610<0.001
Elevation−0.2170.007<0.001
LST correlogram image−44.8784.162<0.001
NDVI correlogram image62.6575.961<0.001
RCP600.727<0.001Constant33.7174.637<0.001
Elevation−0.2190.007<0.001
LST correlogram image−45.5954.187<0.001
NDVI correlogram image64.4555.997<0.001
RCP850.731<0.001Constant48.2344.587<0.001
Elevation−0.2200.007<0.001
LST correlogram image−44.4714.142<0.001
NDVI correlogram image62.2435.932<0.001

