Oceanic Eddy Identification Using an AI Scheme
Abstract
1. Introduction
2. Methods
2.1. AI Technique
2.1.1. Deep Residual Net
2.1.2. Pyramid Scene Parsing Network
2.2. Vector Geometry-Based Eddy Detection Algorithm (VG Algorithm)
3. Data
4. Results
5. Discussion
5.1. Missed Eddy
5.2. Overestimated Eddy
5.3. Boundary Eddy
6. Conclusions
Author Contributions
Funding
Acknowledgments
Conflicts of Interest
References
- McGillicuddy, D.J. Mechanisms of physical-biological-biogeochemical interaction at the oceanic mesoscale. Annu. Rev. Mar. Sci. 2016, 8, 125–159. [Google Scholar] [CrossRef] [PubMed]
- Dong, C.; Mcwilliams, J.C.; Liu, Y.; Chen, D. Global heat and salt transports by eddy movement. Nat. Commun. 2014, 5, 3294. [Google Scholar] [CrossRef] [PubMed]
- Chelton, D.B.; Schlax, M.G.; Samelson, R.M.; De Szoeke, R.A. Global observations of large oceanic eddies. Geophys. Res. Lett. 2007, 34, 87–101. [Google Scholar] [CrossRef]
- Chen, G.; Gan, J.; Xie, Q.; Chu, X.; Wang, D.; Hou, Y. Eddy heat and salt transports in the South China Sea and their seasonal modulations. J. Geophys. Res. 2012, 117, C05021. [Google Scholar] [CrossRef]
- Gaube, P.; McGillicuddy, D.J.; Chelton, D.B.; Behrenfeld, M.J.; Strutton, P.G. Regional variations in the influence of mesoscale eddies on near-surface chlorophyll. J. Geophys. Res. 2014, 119, 8195–8220. [Google Scholar] [CrossRef]
- Cotroneo, Y.; Aulicino, G.; Ruiz, S.; Pascual, A.; Budillon, G.; Fusco, G.; Tintore, J. Glider and satellite high resolution monitoring of a mesoscale eddy in the Algerian basin: Effects on the mixed layer depth and biochemistry. J. Mar. Syst. 2015, 162, 73–88. [Google Scholar] [CrossRef]
- Brannigan, L. Intense submesoscale upwelling in anticyclonic eddies. Geophys. Res. Lett. 2016, 43, 3360–3369. [Google Scholar] [CrossRef]
- Cotroneo, Y.; Budillon, G.; Fusco, G.; Spezie, G. Cold core eddies and fronts of the Antarctic Circumpolar Current south of New Zealand from in situ and satellite data. J. Geophys. Res. 2013, 118, 2653–2666. [Google Scholar] [CrossRef]
- Ansorge, I.J.; Jackson, J.M.; Reid, K.; Durgadoo, J.V.; Swart, S.; Eberenz, S. Evidence of a southward eddy corridor in the south-west Indian ocean. Deep-Sea Res. Part II 2015, 119, 69–76. [Google Scholar] [CrossRef]
- Hsu, A.C.; Boustany, A.M.; Roberts, J.J.; Chang, J.H.; Halpin, P.N. Tuna and swordfish catch in the U.S. northwest Atlantic longline fishery in relation to mesoscale eddies. Fish. Oceanogr. 2015, 24, 508–520. [Google Scholar] [CrossRef]
- Arur, A.; Krishnan, P.; George, G.; Bharathi, M.P.G.; Kaliyamoorthy, M.; Shaeb, K.H.B.; Suryavanshi, A.S.; Kumar, T.S.; Joshi, A.K. The influence of mesoscale eddies on a commercial fishery in the coastal waters of the Andaman and Nicobar Islands, India. Int. J. Remote Sens. 2014, 35, 6418–6443. [Google Scholar] [CrossRef][Green Version]
- Xu, G.; Dong, C.; Liu, Y.; Gaube, P.; Yang, J. Chlorophyll rings around ocean eddies in the North Pacific. Sci. Rep. 2019, 9, 2056. [Google Scholar] [CrossRef] [PubMed]
- Chaigneau, A.; Gizolme, A.; Grados, C. Mesoscale eddies off Peru in altimeter records: Identification algorithms and eddy spatio-temporal patterns. Prog. Oceanogr. 2008, 79, 106–119. [Google Scholar] [CrossRef]
- Nencioli, F.; Dong, C.; Dickey, T.; Washburn, L.; Mcwilliams, J.C. A vector geometry-based eddy detection algorithm and its application to a high-resolution numerical model product and high-frequency radar surface velocities in the Southern California Bight. J. Atmos. Ocean. Technol. 2010, 27, 564–579. [Google Scholar] [CrossRef]
- Dong, C.; Nencioli, F.; Liu, Y.; Mcwilliams, J.C. An automated approach to detect oceanic eddies from satellite remotely sensed sea surface temperature data. IEEE Geosci. Remote Sens. Lett. 2011, 8, 1055–1059. [Google Scholar] [CrossRef]
- Zhang, C.H.; Li, H.L.; Liu, S.T.; Shao, L.J.; Zhao, Z.; Liu, H.W. Automatic detection of oceanic eddies in reanalyzed SST images and its application in the East China Sea. Sci. China Earth Sci. 2015, 58, 2249–2259. [Google Scholar] [CrossRef]
- Dong, C.; Liu, Y.; Lumpkin, R.; Lankhorst, M.; Chen, D.; Mcwilliams, J.C.; Guan, Y. A scheme to identify loops from trajectories of oceanic surface drifters: An application in the Kuroshio Extension Region. J. Atmos. Ocean. Technol. 2011, 28, 1167–1176. [Google Scholar] [CrossRef]
- Pessini, F.; Olita, A.; Cotroneo, Y.; Perilli, A. Mesoscale eddies in the Algerian Basin: Do they differ as a function of their formation site? Ocean Sci. 2018, 14, 669–688. [Google Scholar] [CrossRef]
- Halo, I.; Backeberg, B.; Penven, P.; Ansorge, I.; Reason, C.; Ullgren, J.E. Eddy properties in the Mozambique Channel: A comparison between observations and two numerical ocean circulation models. Deep Sea Res. Pt. II 2014, 100, 38–53. [Google Scholar] [CrossRef]
- Lecun, Y.; Bengio, Y.; Hinton, G. Deep learning. Nature 2015, 521, 436–444. [Google Scholar] [CrossRef]
- Zhang, L.; Zhang, L.; Bo, D. Deep learning for remote sensing data: A technical tutorial on the state of the art. IEEE Geosci. Remote Sens. Mag. 2016, 4, 22–40. [Google Scholar] [CrossRef]
- Lguensat, R.; Sun, M.; Fablet, R.; Mason, E.; Tandeo, P.; Chen, G. EddyNet: A deep neural network for pixel-wise classification of oceanic eddies. arXiv 2017, arXiv:1711.03954v1. [Google Scholar]
- Franz, K.; Roscher, R.; Milioto, A.; Wenzel, S.; Kusche, J. Ocean eddy identification and tracking using neural networks. In Proceedings of the IGARSS 2018—2018 IEEE International Geoscience and Remote Sensing Symposium, Valencia, Spain, 22–27 July 2018. [Google Scholar]
- Du, Y.; Song, W.; He, Q.; Huang, D.; Liotta, A.; Su, C. Deep learning with multi-scale feature fusion in remote sensing for automatic oceanic eddy detection. Inform. Fusion 2019, 49, 89–99. [Google Scholar] [CrossRef]
- He, K.; Zhang, X.; Ren, S.; Sun, J. Deep residual learning for image recognition. In Proceedings of the 2016 IEEE Conference on Computer Vision and Pattern Recognition (CVPR), Las Vegas, NV, USA, 27–30 June 2016; pp. 1026–1034. [Google Scholar] [CrossRef]
- Zhao, H.; Shi, J.; Qi, X.; Wang, X.; Jia, J. Pyramid scene parsing network. In Proceedings of the 2017 IEEE Conference on Computer Vision and Pattern Recognition (CVPR), Honolulu, HI, USA, 21–26 July 2017. [Google Scholar]
- He, K.; Zhang, X.; Ren, S.; Sun, J. Spatial pyramid pooling in deep convolutional networks for visual recognition. IEEE Trans. Pattern Anal. Mach. Intell. 2015, 37, 1904–1916. [Google Scholar] [CrossRef] [PubMed]
- Liu, W.; Rabinovich, A.; Berg, A.C. ParseNet: Looking wider to see better. arXiv 2015, arXiv:1506.04579v2. [Google Scholar]
- Yu, F.; Koltun, V. Multi-scale context aggregation by dilated convolutions. arXiv 2016, arXiv:1612.01105v3. [Google Scholar]
- Chen, L.C.; Papandreou, G.; Kokkinos, I.; Murphy, K.; Yuille, A.L. Deeplab: Semantic image segmentation with deep convolutional nets, atrous convolution, and fully connected CRFs. IEEE Trans. Pattern Anal. Mach. Intell. 2018, 40, 834–848. [Google Scholar] [CrossRef]
- Dong, C.; Mavor, T.; Nencioli, F.; Jiang, S.; Uchiyama, Y.; Mcwilliams, J.C.; Dickey, T.; Ondrusek, M.; Zhang, H.; Clark, D.K. An oceanic cyclonic eddy on the lee side of Lanai Island, Hawai'i. J. Geophys. Res. 2009, 114, C10008. [Google Scholar] [CrossRef]
- Liu, Y.; Dong, C.; Guan, Y.; Chen, D.; Mcwilliams, J.; Nencioli, F. Eddy analysis in the subtropical zonal band of the North Pacific Ocean. Deep-Sea Res. Part I 2012, 68, 54–67. [Google Scholar] [CrossRef]


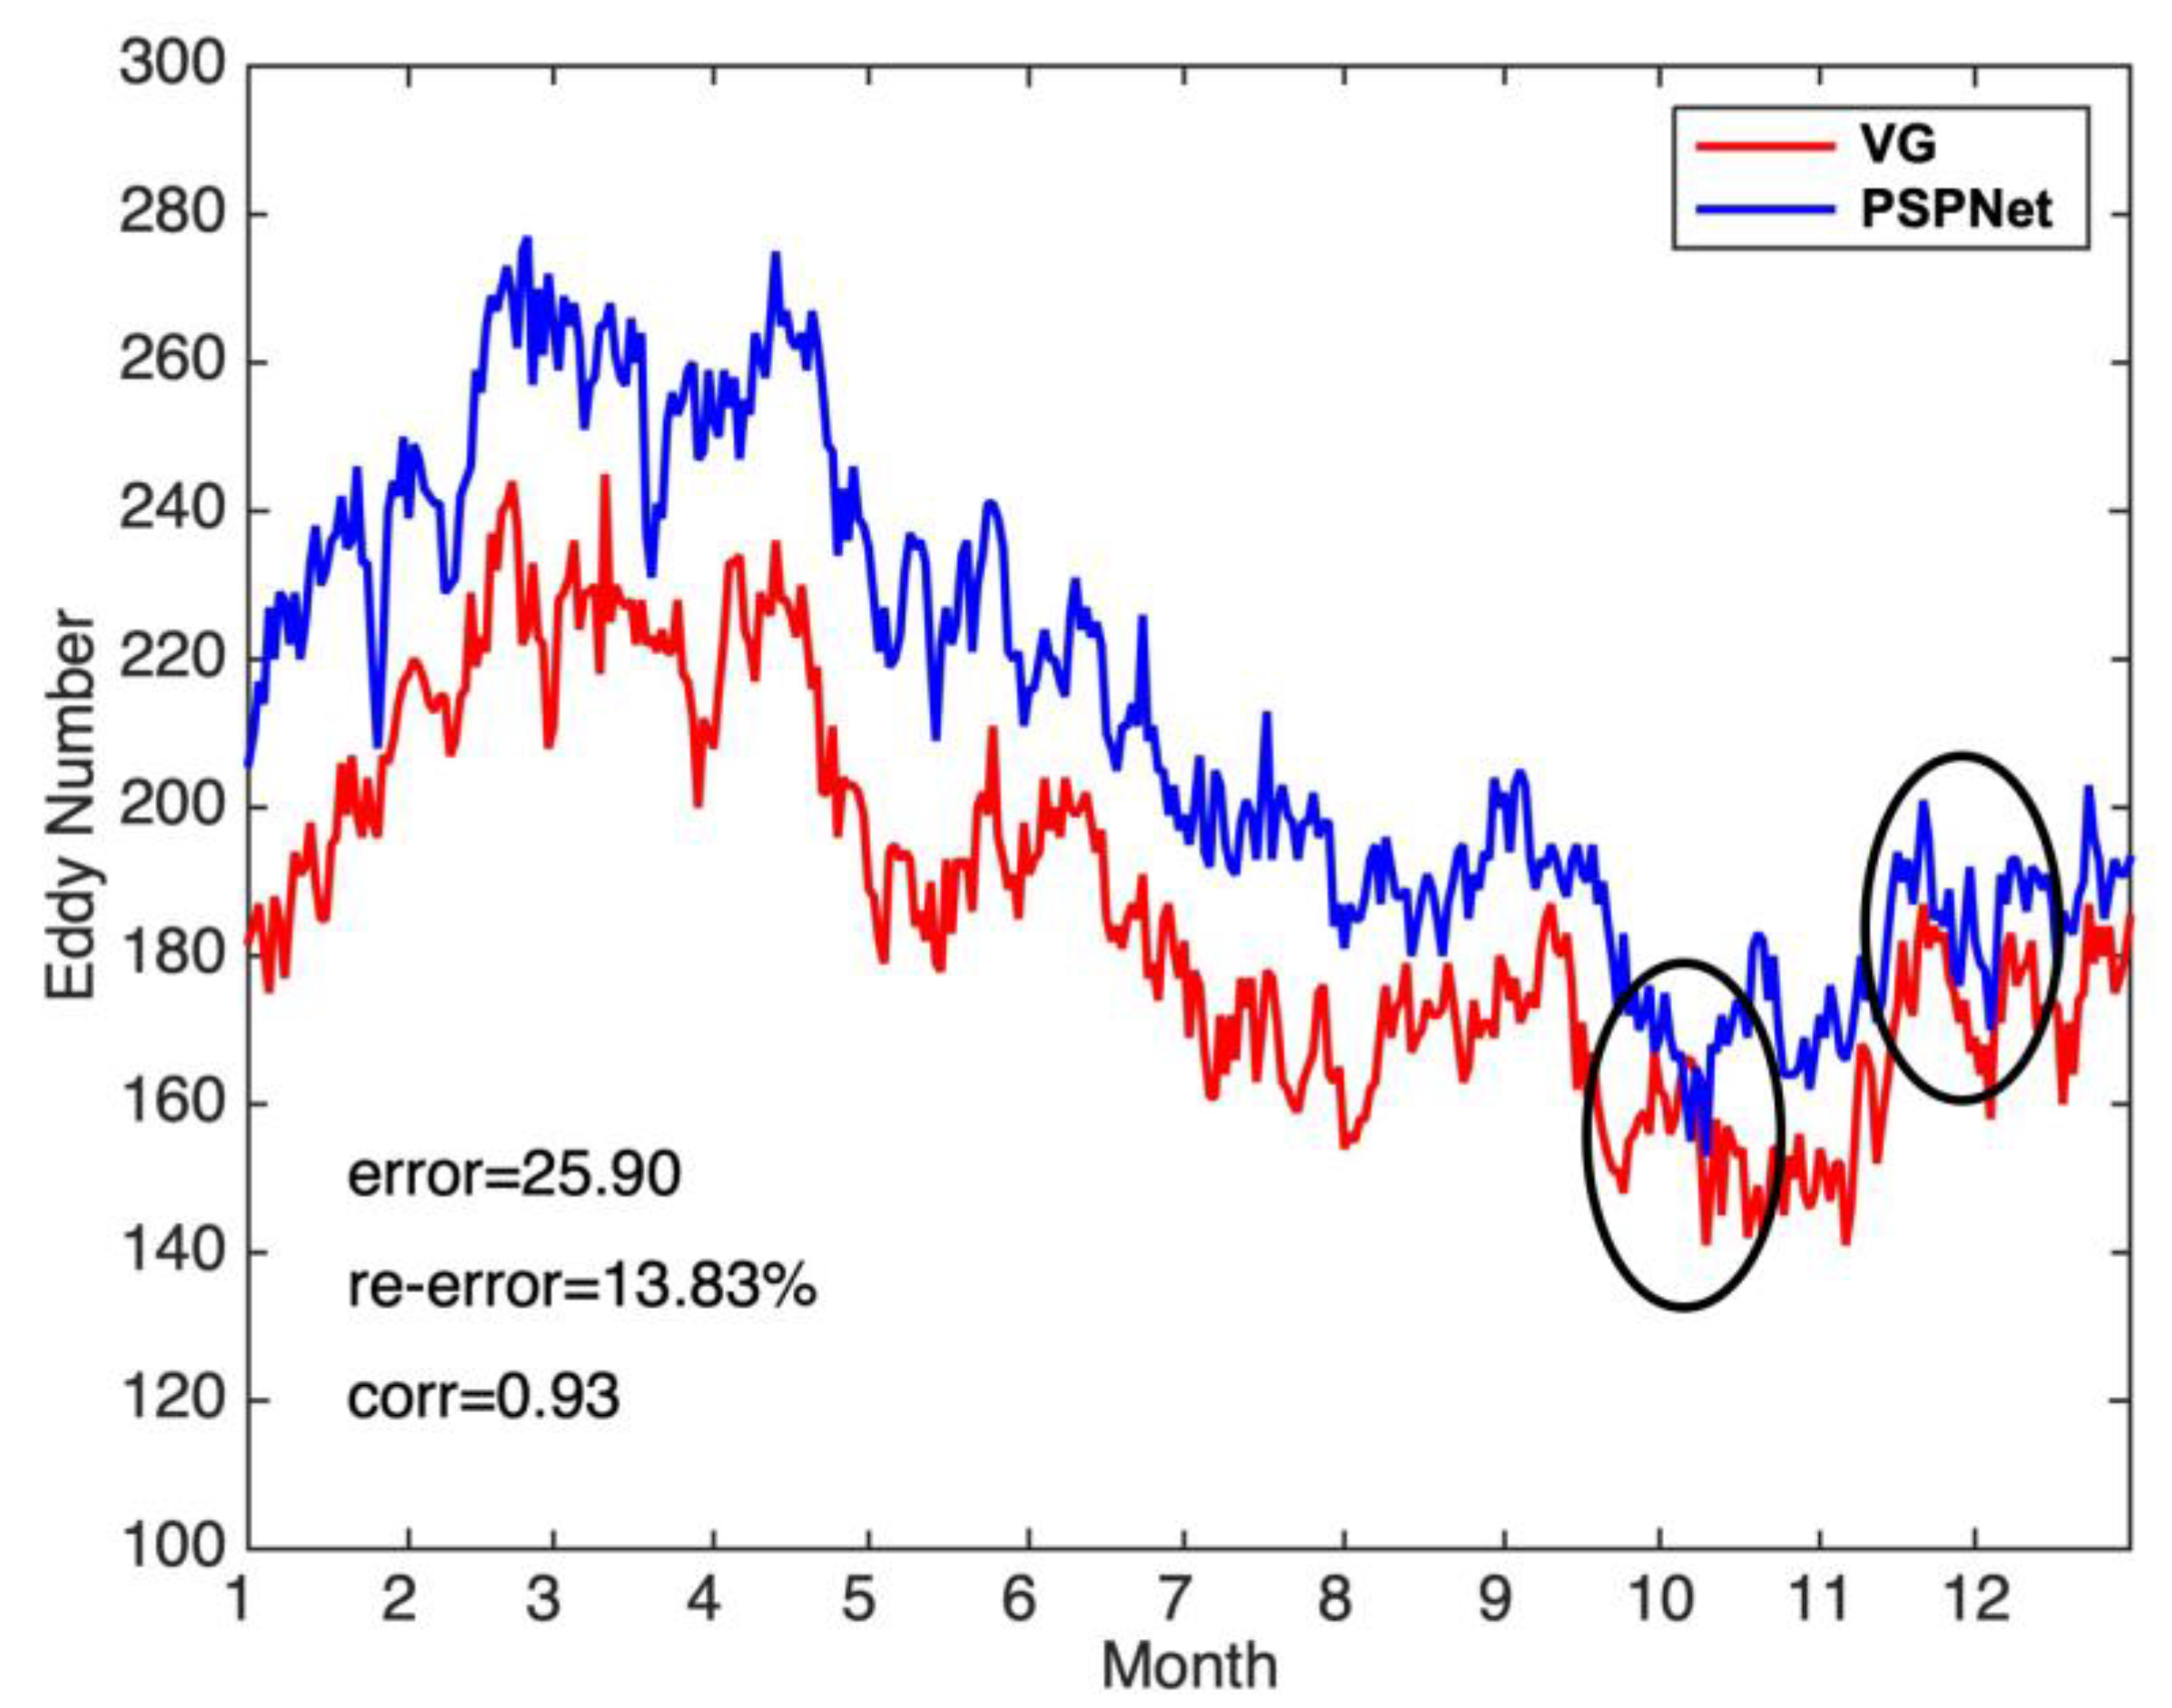

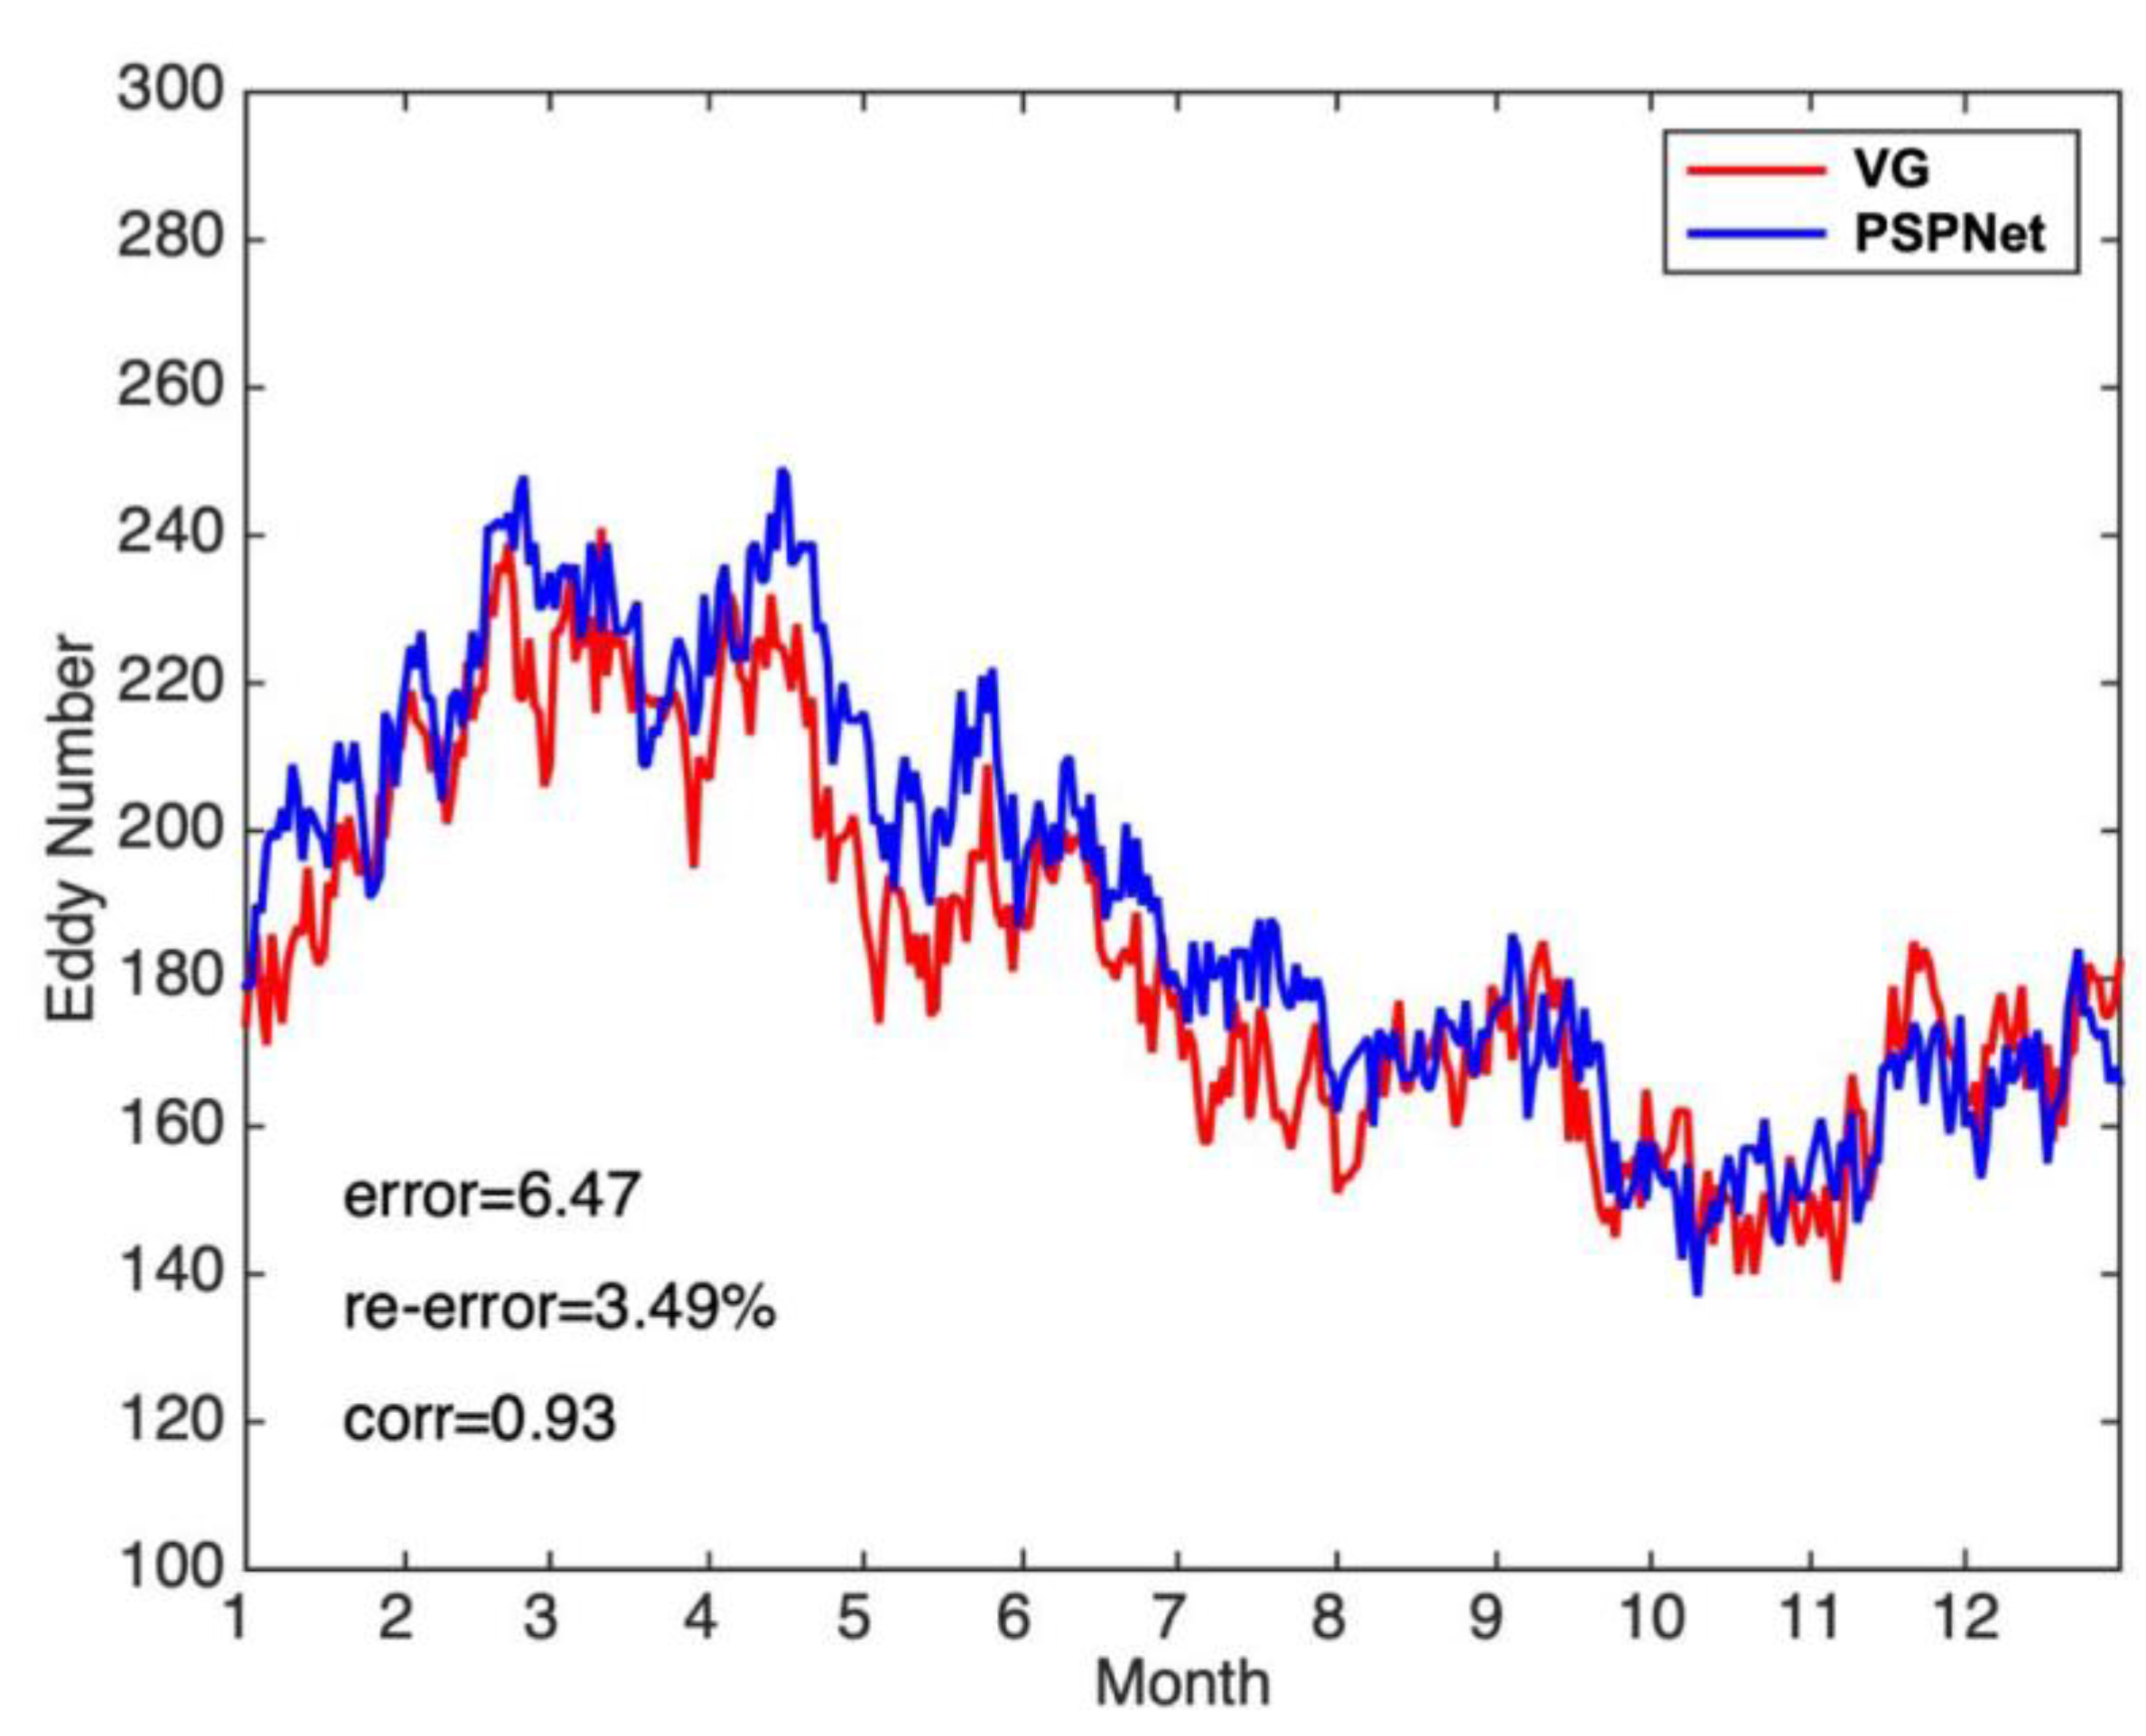
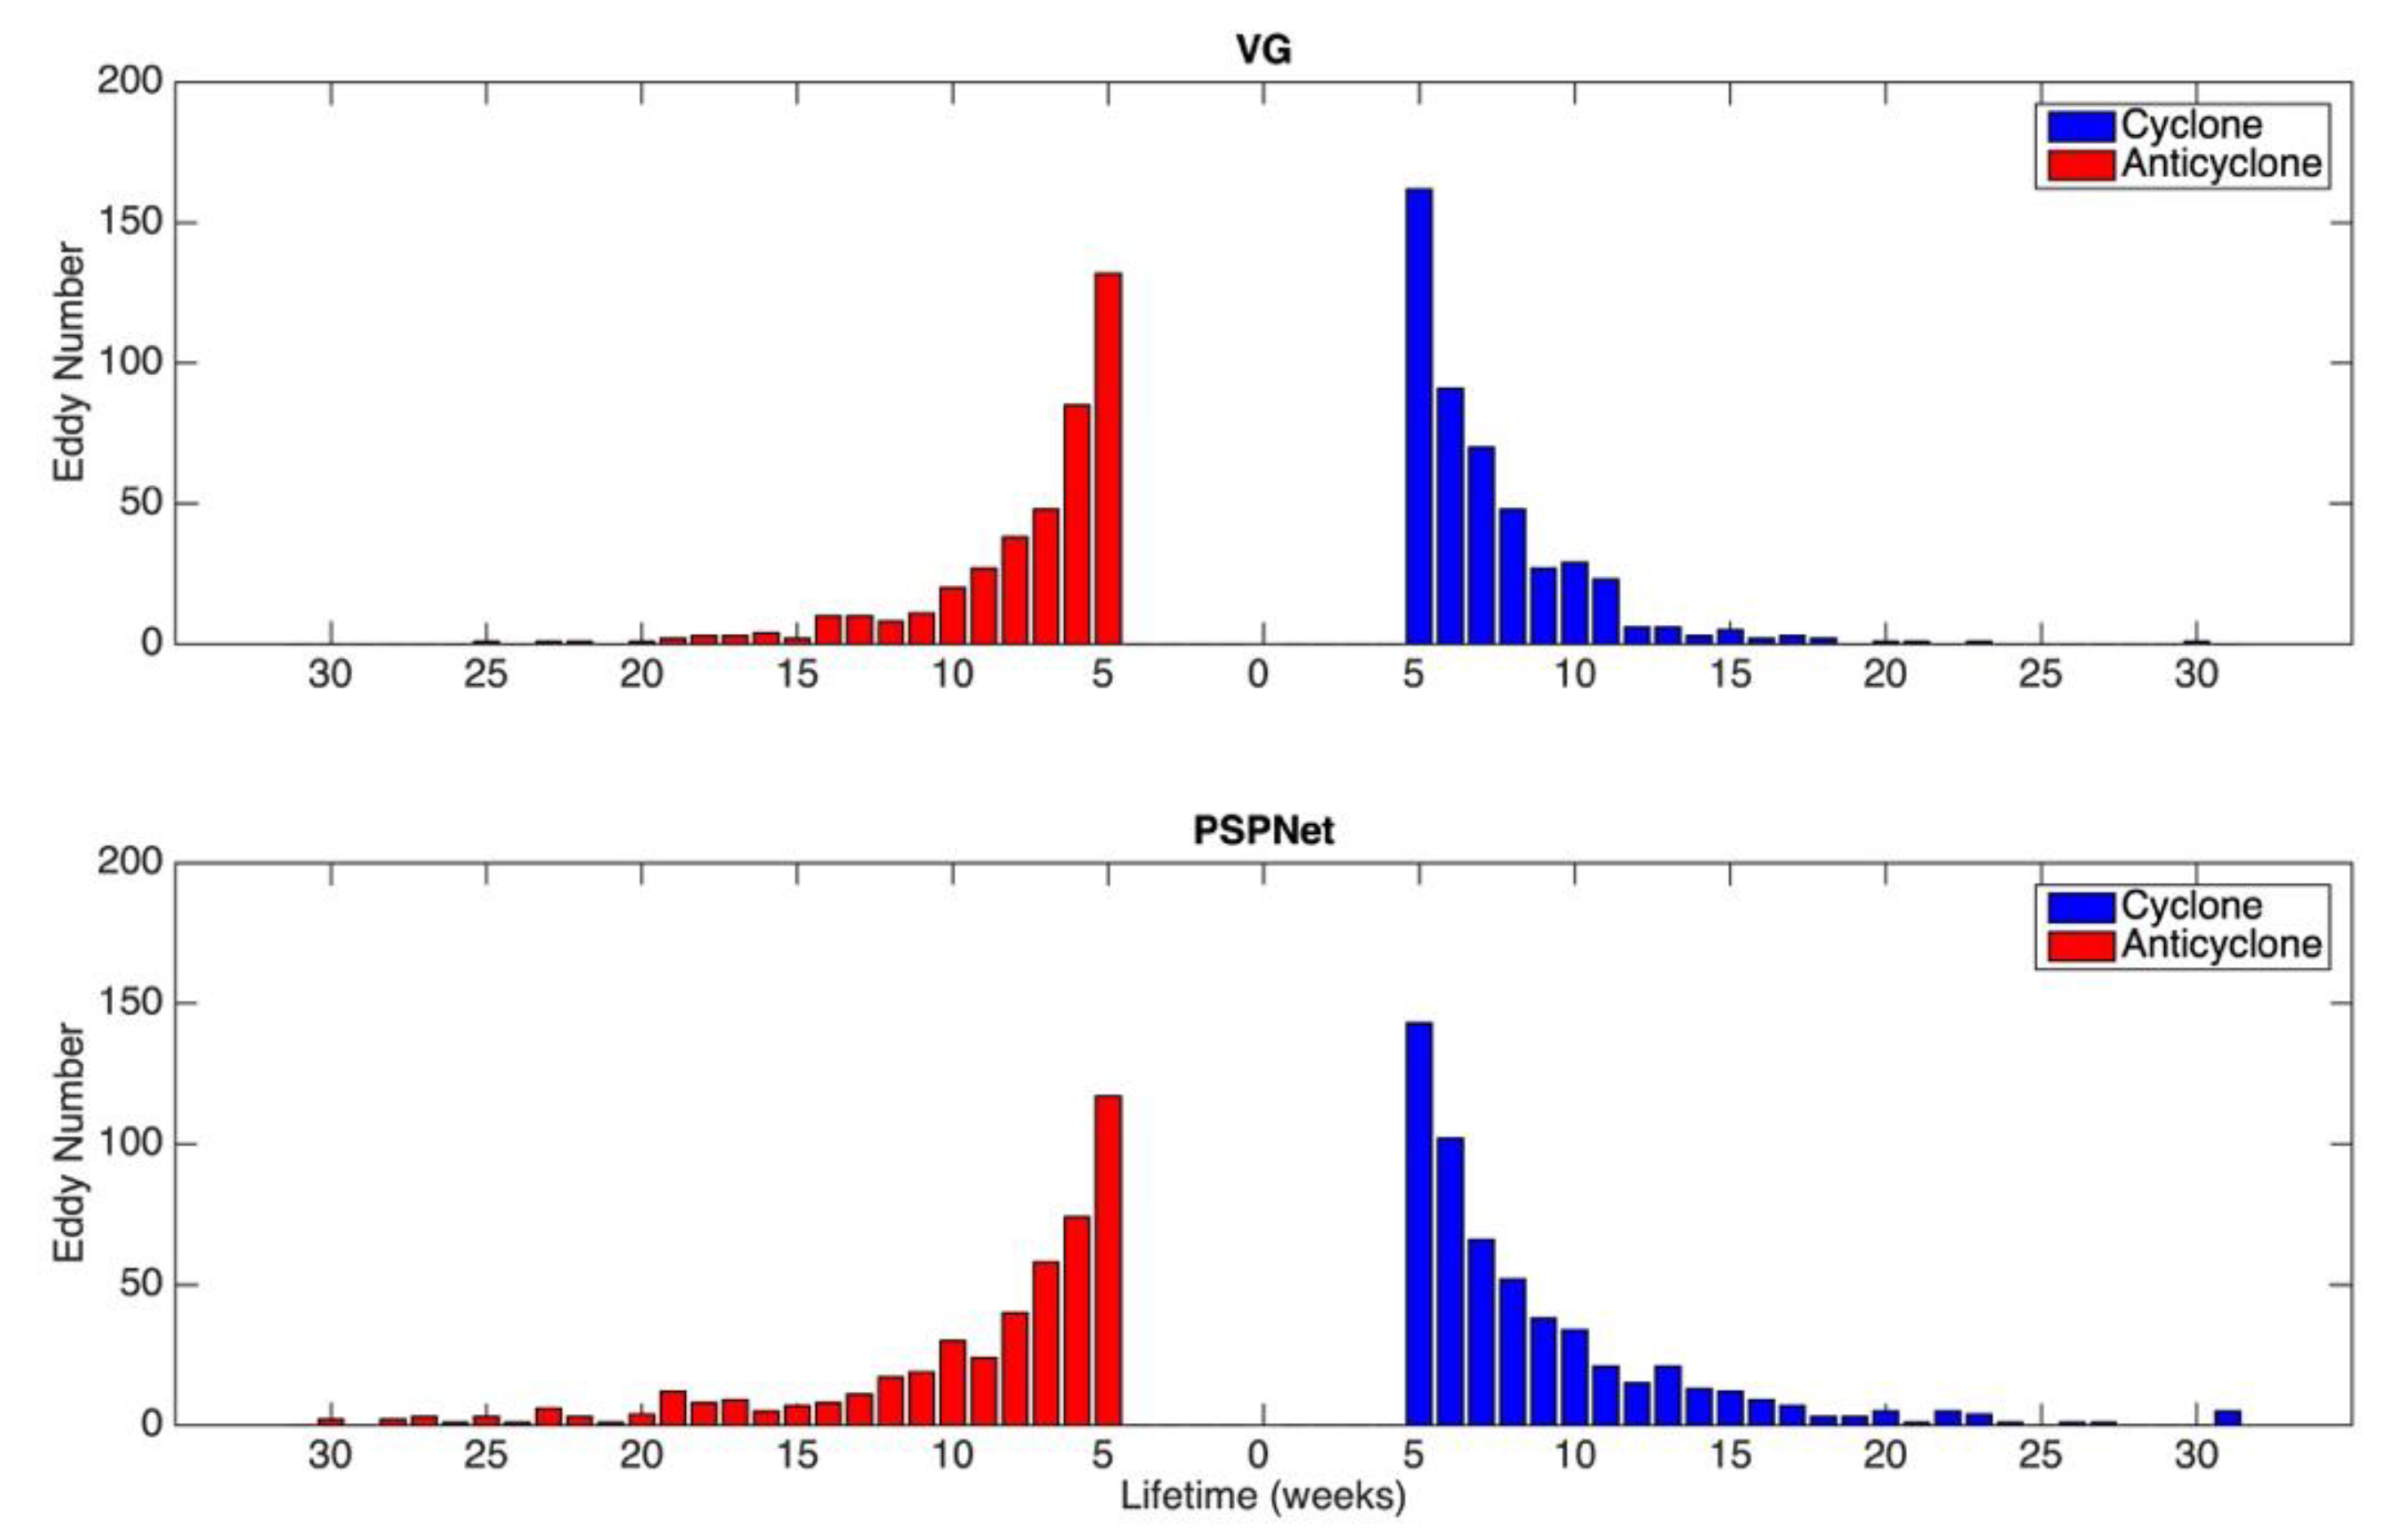
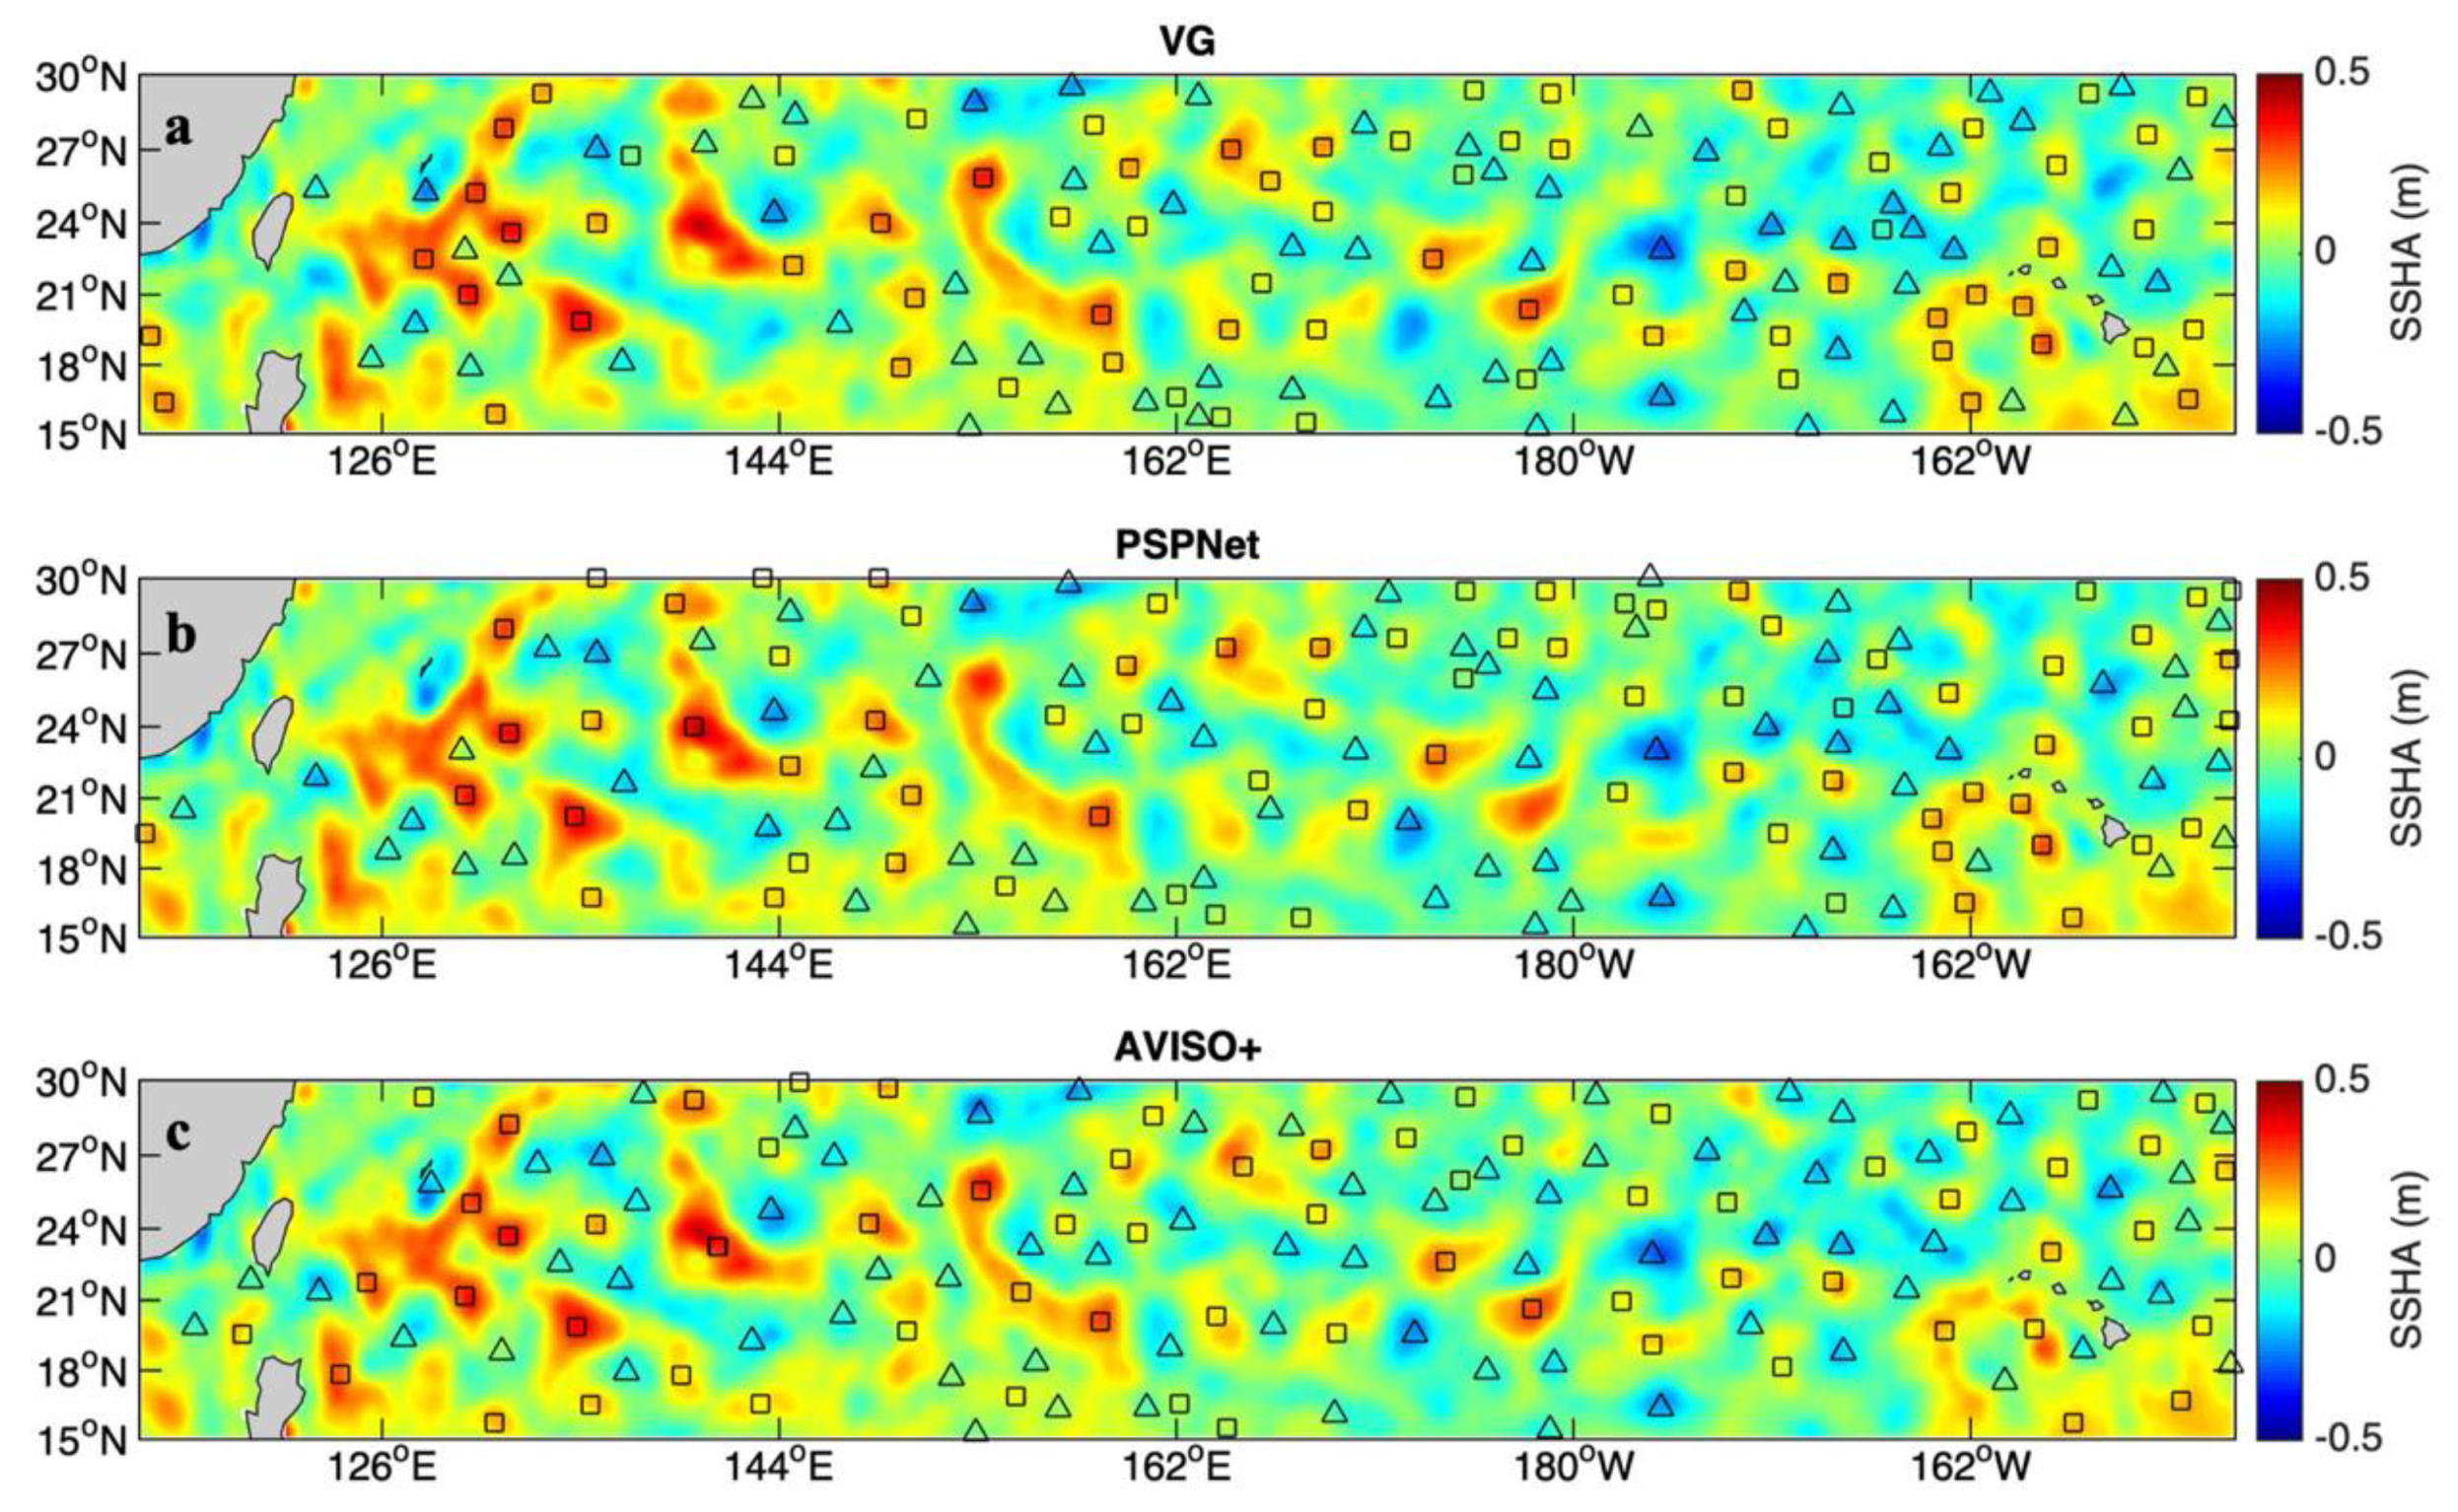

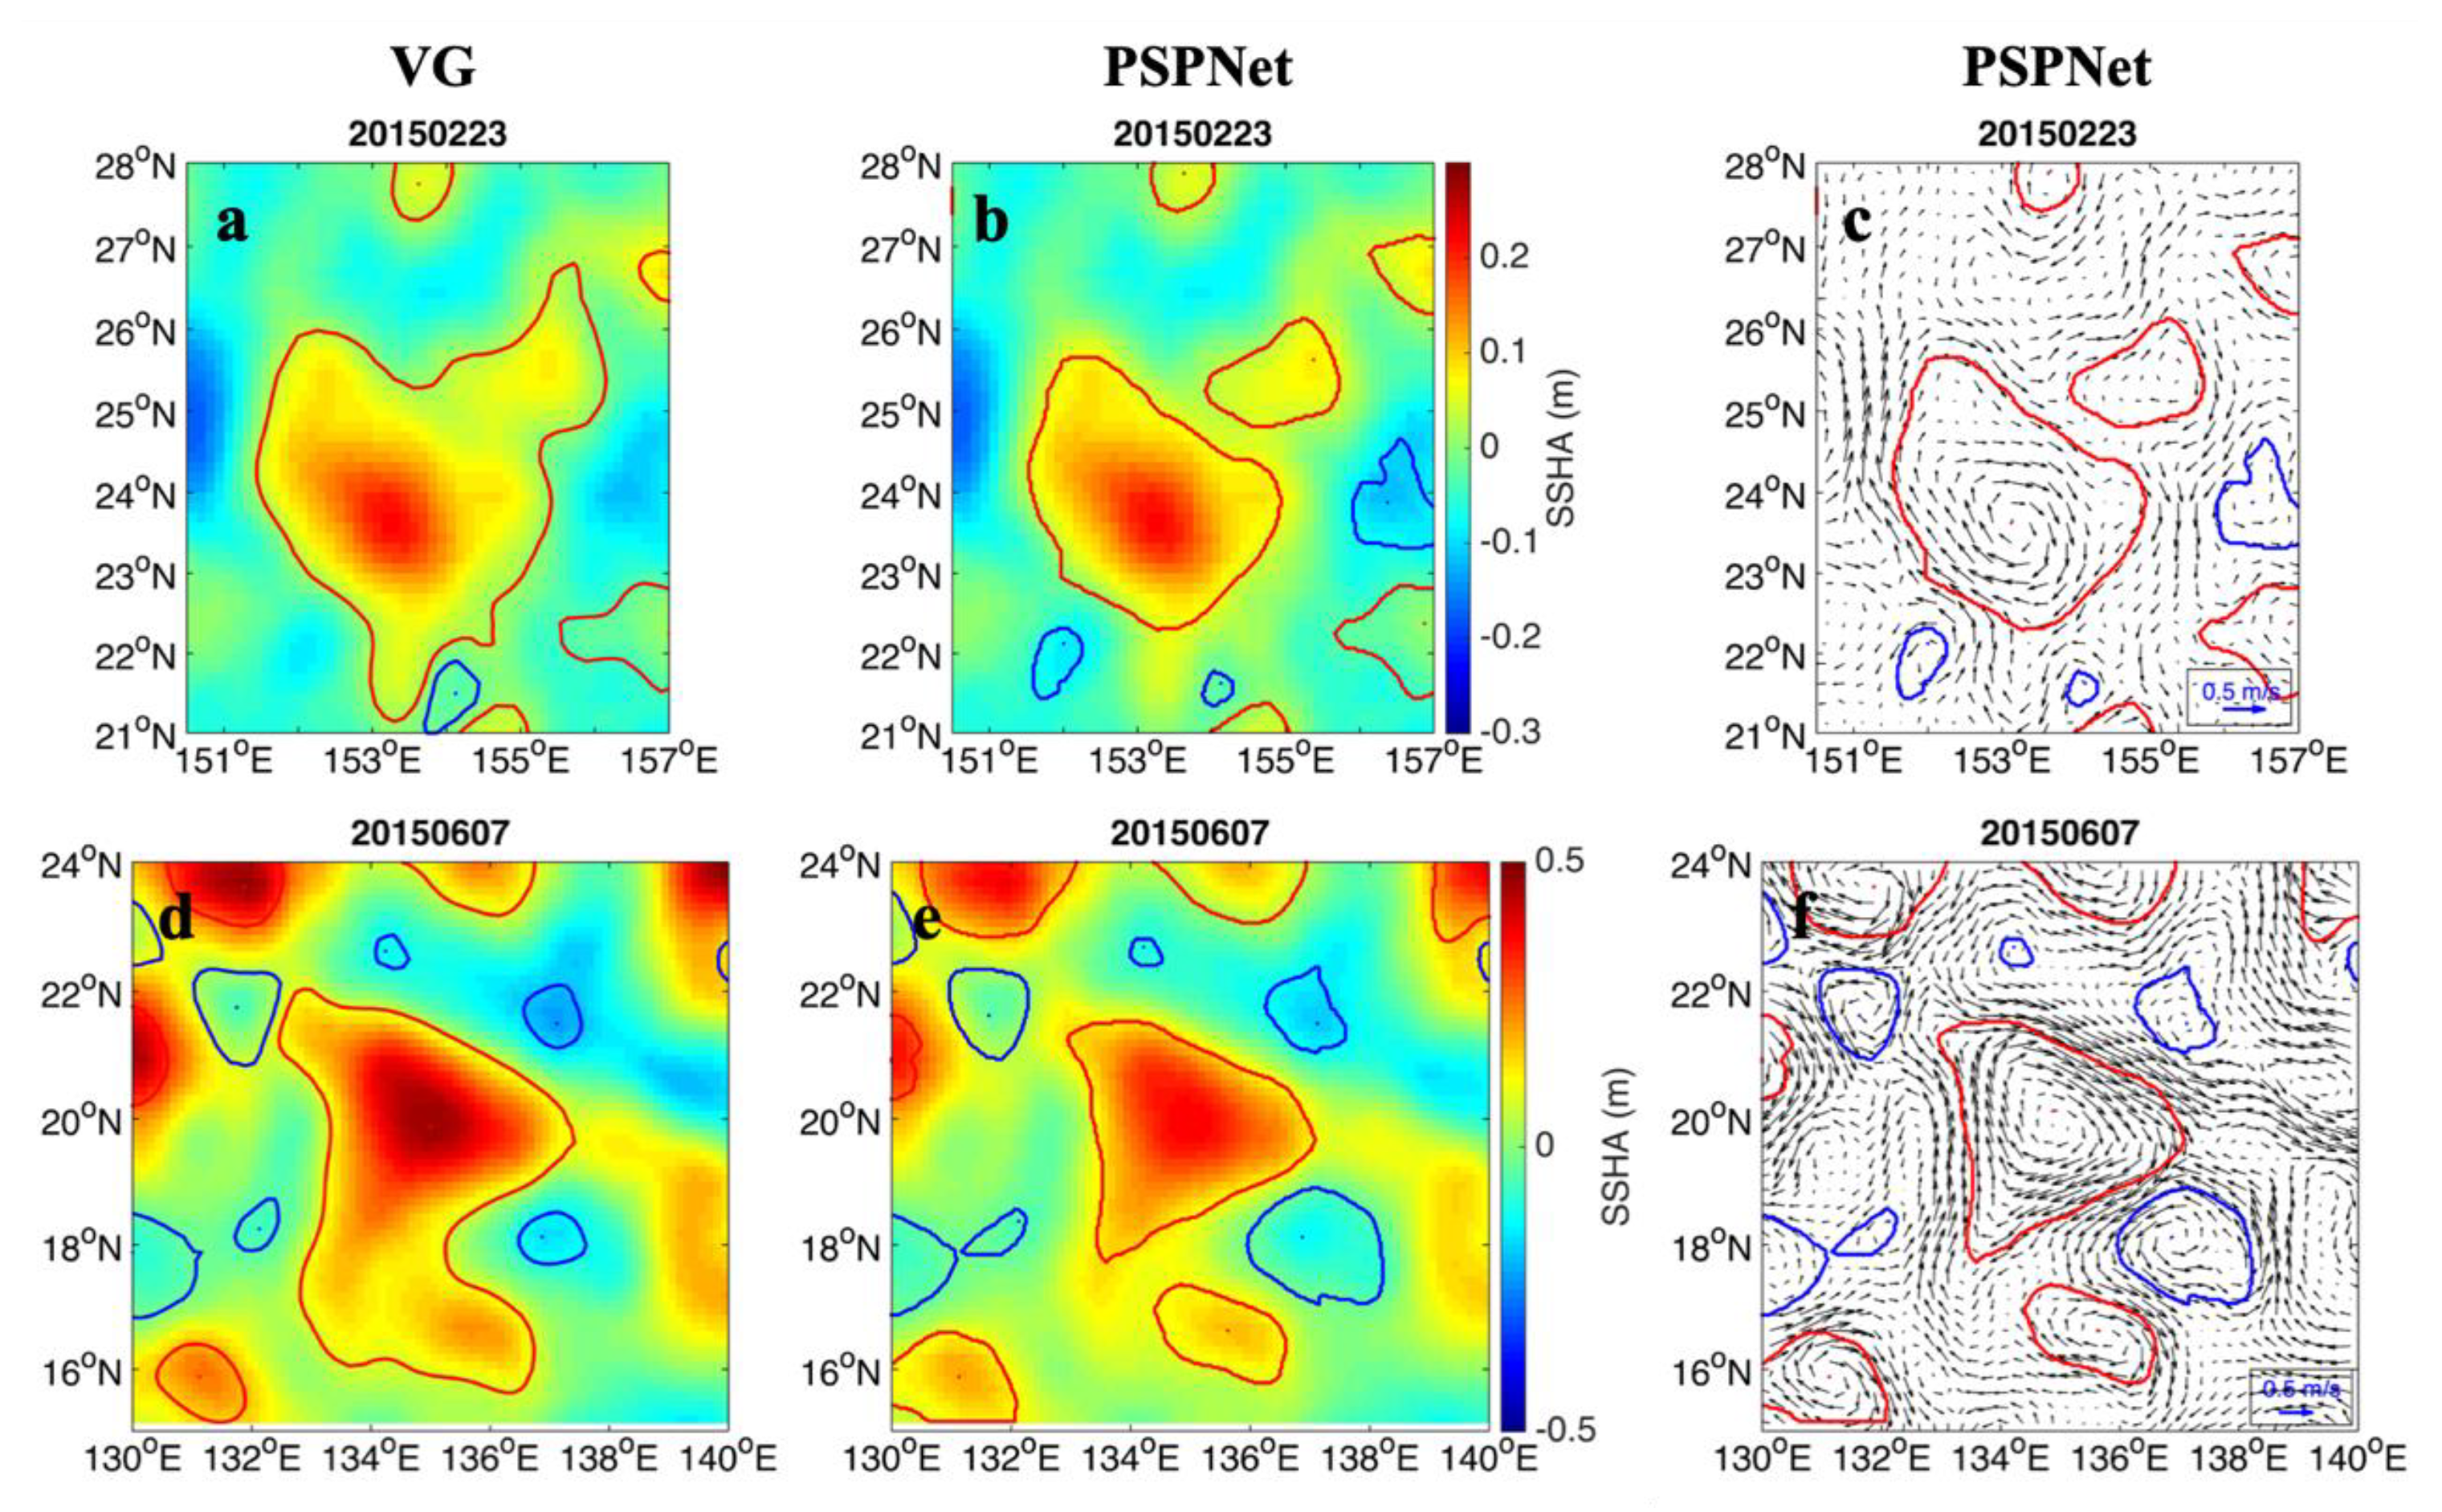
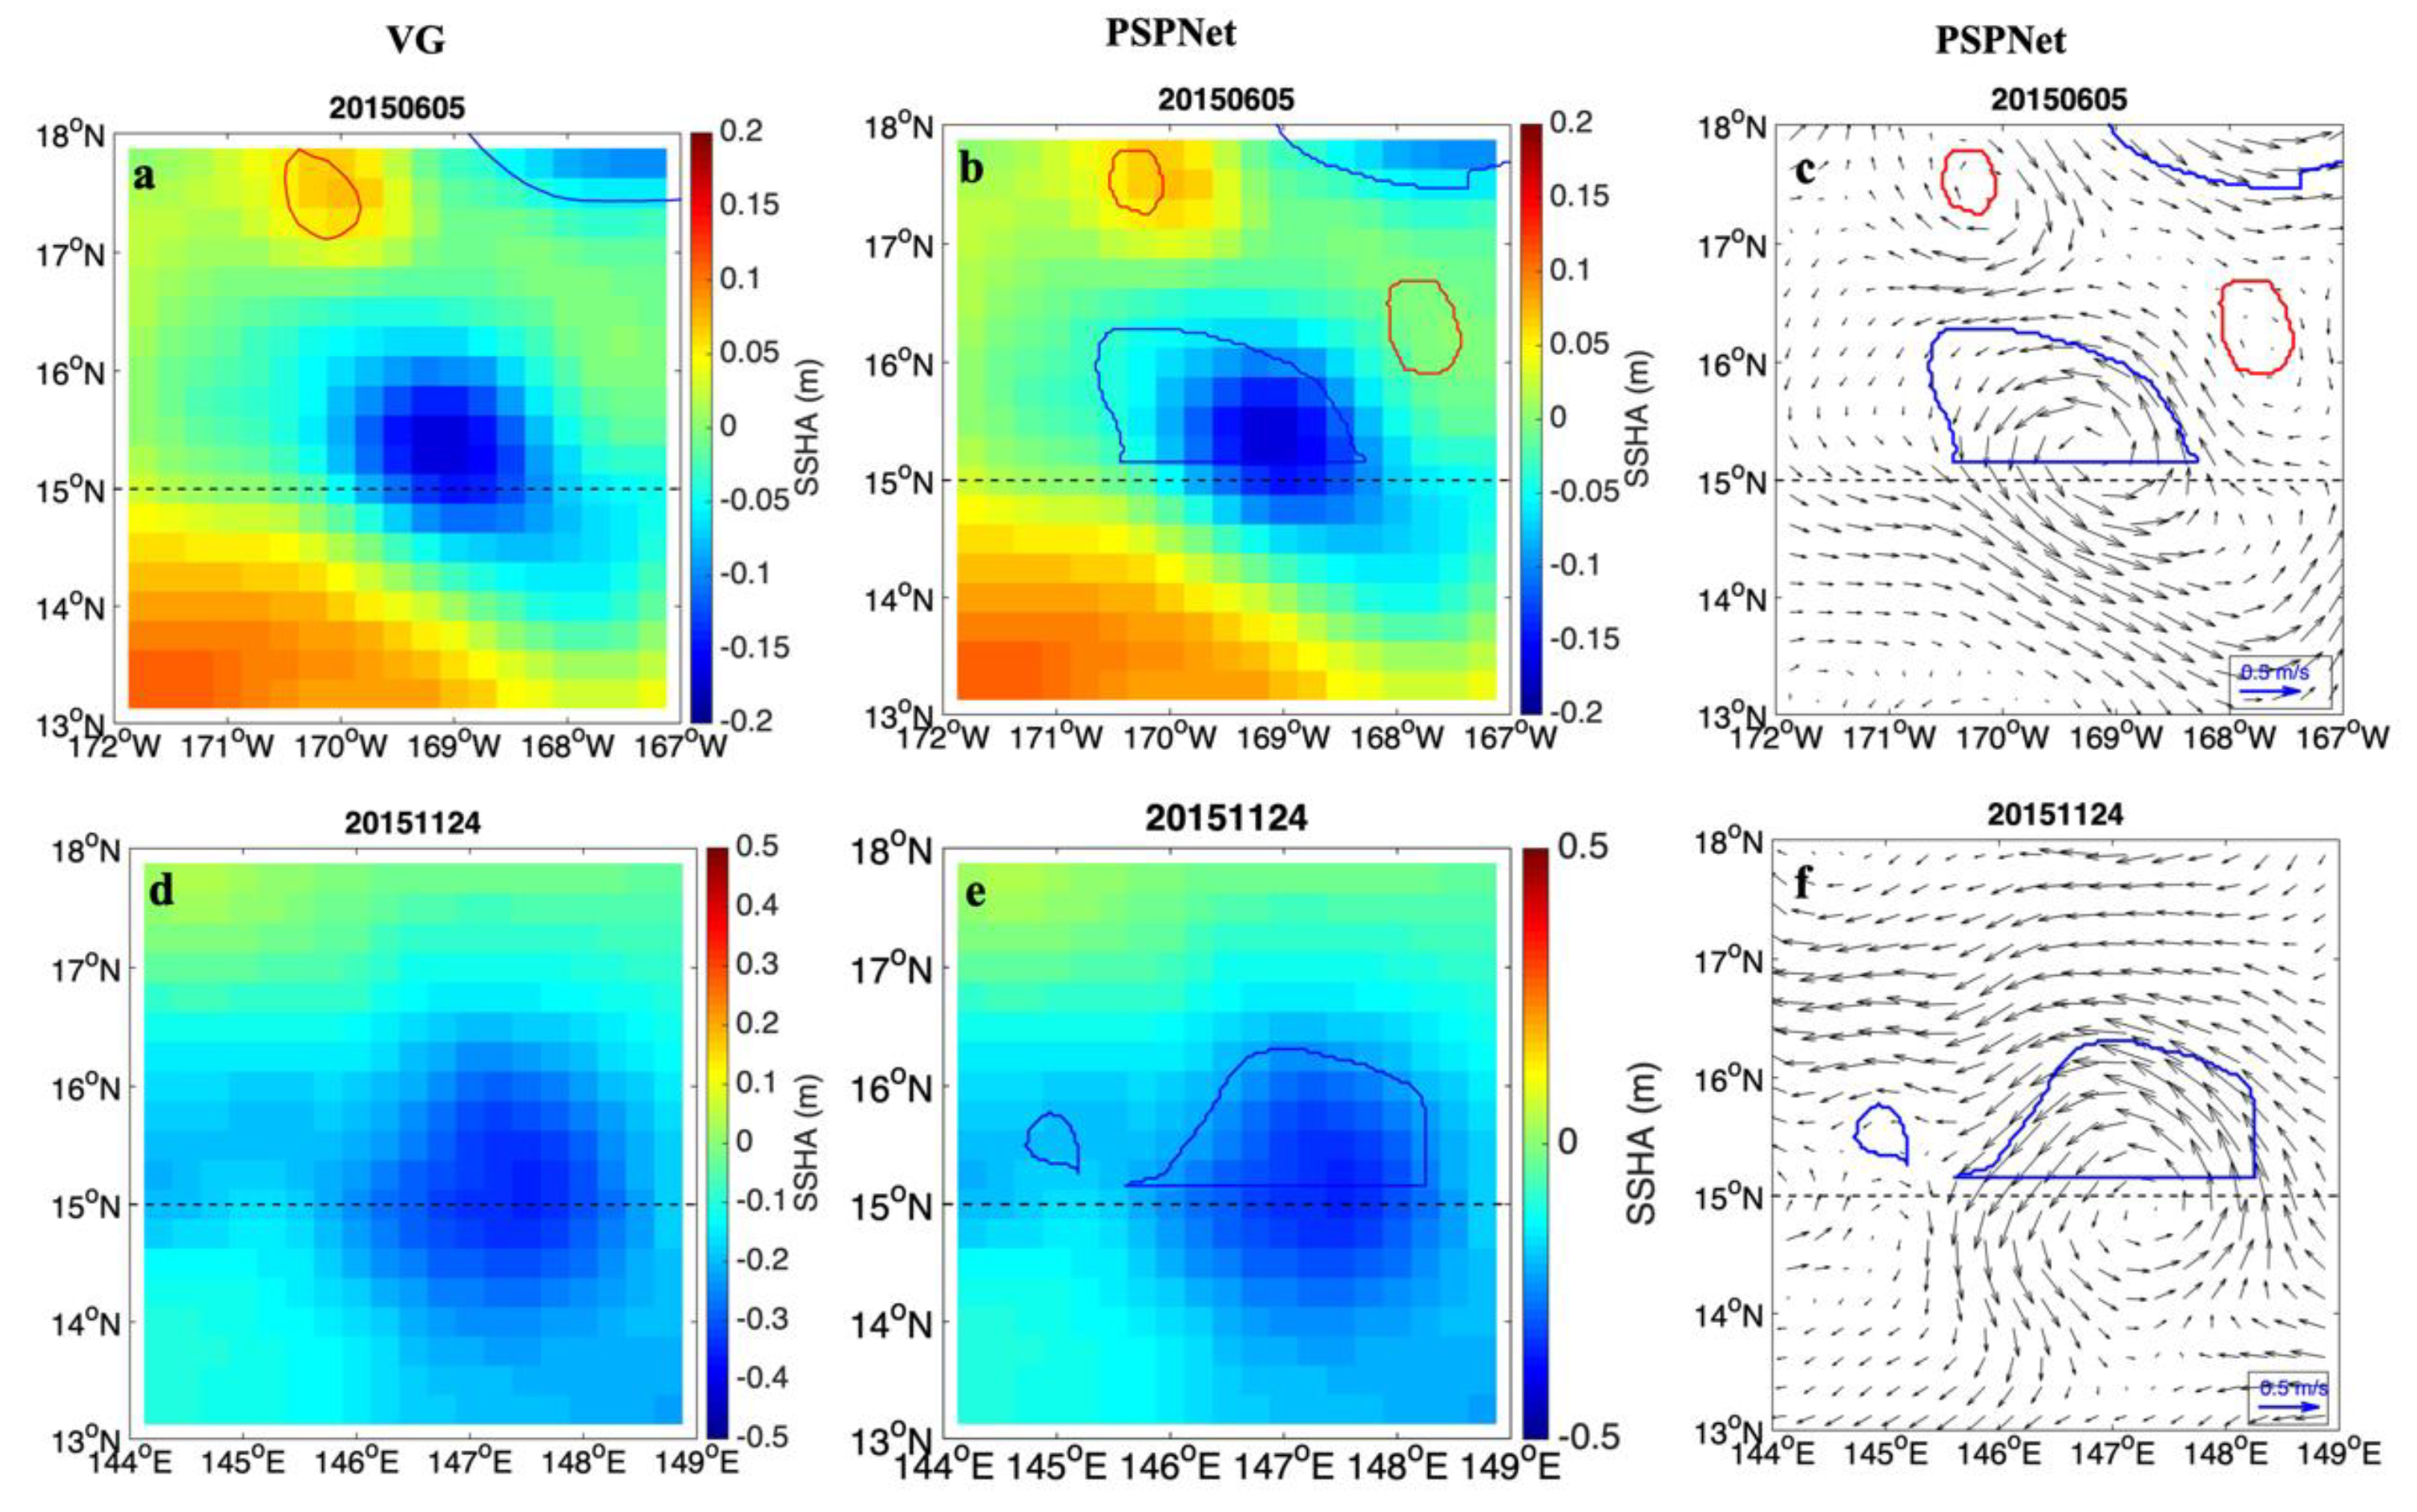
| PSPNet | VG | AVISO+ | ||||
|---|---|---|---|---|---|---|
| Mean | Maximum | Mean | Maximum | Mean | Maximum | |
| Lifetime (days) | 62.36 | 346 | 49.15 | 222 | 71.23 | 364 |
| Amplitude (cm) | 8.30 | 45.40 | 7.15 | 40.17 | 8.00 | 34.25 |
| Radius (km) | 90.63 | 297.57 | 80.91 | 298.65 | 99.58 | 267 |
| Displacement (km) | 343.74 | 3174.0 | 332.22 | 1453.7 | 544.52 | 3355.3 |
| Translational Speed (km/day) | 6.78 | 34.91 | 6.74 | 24.99 | 6.94 | 34.98 |
© 2019 by the authors. Licensee MDPI, Basel, Switzerland. This article is an open access article distributed under the terms and conditions of the Creative Commons Attribution (CC BY) license (http://creativecommons.org/licenses/by/4.0/).
Share and Cite
Xu, G.; Cheng, C.; Yang, W.; Xie, W.; Kong, L.; Hang, R.; Ma, F.; Dong, C.; Yang, J. Oceanic Eddy Identification Using an AI Scheme. Remote Sens. 2019, 11, 1349. https://doi.org/10.3390/rs11111349
Xu G, Cheng C, Yang W, Xie W, Kong L, Hang R, Ma F, Dong C, Yang J. Oceanic Eddy Identification Using an AI Scheme. Remote Sensing. 2019; 11(11):1349. https://doi.org/10.3390/rs11111349
Chicago/Turabian StyleXu, Guangjun, Cheng Cheng, Wenxian Yang, Wenhong Xie, Lingmei Kong, Renlong Hang, Furong Ma, Changming Dong, and Jingsong Yang. 2019. "Oceanic Eddy Identification Using an AI Scheme" Remote Sensing 11, no. 11: 1349. https://doi.org/10.3390/rs11111349
APA StyleXu, G., Cheng, C., Yang, W., Xie, W., Kong, L., Hang, R., Ma, F., Dong, C., & Yang, J. (2019). Oceanic Eddy Identification Using an AI Scheme. Remote Sensing, 11(11), 1349. https://doi.org/10.3390/rs11111349


