Article

Variation of Net Primary Production and Its Correlation with Climate Change and Anthropogenic Activities over the Tibetan Plateau

1
South China Institute of Environmental Sciences, Ministry of Environmental Protection, Guangzhou 510655, China
2
State Environmental Protection Key Laboratory of Urban Ecological Simulation and Protection, Guangzhou 510655, China
*
Author to whom correspondence should be addressed.
Remote Sens. 2018, 10(9), 1352; https://doi.org/10.3390/rs10091352
Submission received: 15 July 2018 / Revised: 21 August 2018 / Accepted: 22 August 2018 / Published: 25 August 2018
(This article belongs to the Special Issue Remote Sensing of Primary Productivity)

Abstract

:
Grasslands in the Tibetan Plateau are claimed to be sensitive and vulnerable to climate change and anthropogenic activities. Quantifying the impacts of climate change and anthropogenic activities on grassland growth is an essential step for developing sustainable grassland ecosystem management strategies under the background of climate change and increasing anthropogenic activities occurring in the plateau. Net primary productivity (NPP) is one of the key components in the carbon cycle of terrestrial ecosystems, and can serve an important role in the assessment of vegetation growth. In this study, a modified Carnegie–Ames–Stanford Approach (CASA) model, which considers remote sensing information for the estimation of the water stress coefficient and time-lag effects of climatic factors on NPP simulation, was applied to simulate NPP in the Tibetan Plateau from 2001 to 2015. Then, the spatiotemporal variations of NPP and its correlation with climatic factors and anthropogenic activities were analyzed. The results showed that the mean values of NPP were 0.18 kg∙C∙m−2∙a−1 and 0.16 kg∙C∙m−2∙a−1 for the original CASA model and modified CASA model, respectively. The modified CASA model performed well in estimating NPP compared with field-observed data, with root mean square error (RMSE) and mean absolute error (MAE) of 0.13 kg∙C∙m−2∙a−1 and 0.10 kg∙C∙m−2∙a−1, respectively. Relative RMSE and MAE decreased by 45.8% and 44.4%, respectively, compared to the original CASA model. The variation of NPP showed gradients decreasing from southeast to northwest spatially, and displayed an overall decreasing trend for the study area temporally, with a mean value of −0.02 × 10⁻² kg∙C∙m−2∙a−1 due to climate change and increasing anthropogenic activities (i.e., land use and land cover change). Generally, 54% and 89% of the total pixels displayed a negative relationship between NPP and mean annual temperature, as well as annual cumulative precipitation, respectively, with average values of –0.0003 (kg∙C∙m−2 a−1)/°C and −0.254 (g∙C∙m−2∙a−1)/mm for mean annual temperature and annual cumulative precipitation, respectively. Additionally, about 68% of the total pixels displayed a positive relationship between annual cumulative solar radiation and NPP, with a mean value of 0.038 (g∙C∙m−2·a−1)/(MJ m−2). Anthropogenic activities had a negative effect on NPP variation, and it was larger than that of climate change, implying that human intervention plays a critical role in mitigating the degenerating ecosystem. In terms of human intervention, ecological destruction has a significantly negative effect on the NPP trend, and the absolute value was larger than that of ecological restoration, which has a significantly positive effect on NPP the trend. Our results indicate that ecological destruction should be paid more attention, and ecological restoration should be conducted to mitigate the overall decreasing trend of NPP in the plateau.

Graphical Abstract

1. Introduction

Net primary productivity (NPP) is the amount of net accumulation of organic matter by plants in a given period [1]. It is a critical component in a terrestrial ecosystem’s carbon cycle [2], and serves as a sensitive indicator of an ecosystem’s health and ecological balance at both the local and global scale [3]. Quantitative estimates of NPP are, therefore, critical for the assessment of carbon sequestration and ecological behavior, and for further understanding the changes in ecosystem function and structure [4,5].
Many previous studies have been conducted to simulate NPP at both the local and global scale through field measurements [6,7], the eddy covariance technique [8], and remote sensing [9,10]. However, field observation is time- and labor-consuming, and the measurements are usually dependent on the type of plant [11]. The eddy covariance technique currently seems to be the best way to estimate water, carbon, and energy exchange between terrestrial ecosystems and the atmosphere [12]. Unfortunately, the spatial coverage of this approach is limited [13] and the measurements vary with canopy characteristics, tower height, and wind velocity [8]. Remote sensing techniques provide a powerful and integrative tool for simulating vegetation NPP to obtain explicit and detailed information about carbon exchange at a larger spatial scale [11], and they have been applied widely [10,14,15]. Numerous remote sensing-based models for simulating NPP, such as the process-based Boreal Ecosystem Productivity Simulator (BEPS) model [16], the global production efficiency model (GLOPEM) [17], and the Carnegie–Ames–Stanford Approach (CASA) model [18], have been explored in recent decades. However, previous studies revealed that these models had a lot of uncertainties when they were applied in certain specific ecoregions (i.e., semi-arid region) [4,19]. Additionally, previous studies revealed that a time-lag effect of climatic factors exist that would affect vegetation growth [20,21], but these models were neglected. Moreover, the calculation of water stress coefficient in the widely-used CASA model was complex and needed numerous soil parameters, and usually these soil parameters are difficult to obtain in a larger area with high elevation, thus restricted the application of the CASA model. Therefore, improving and/or adjusting the input parameters for NPP estimate models in specific ecoregions is imperative and urgent [4]. Additionally, climate change will affect ecological, physiological, and other processes (i.e., biophysical) of species in ecosystems [22,23], and then will affect ecosystem productivity [24]. The study on the relationship between NPP and climatic factors in the Tibetan Plateau have been explored widely [9,10,11]. However, these studies are mostly based on an ordinary linear regression model and ignore the multicollinearity among climatic variables. In addition, the relative contribution of each climate variable to NPP is still far from clear. Moreover, early studies have illustrated that anthropogenic activities (i.e., land use and land cover change) and climate change are the two main factors that regulate a terrestrial ecosystem’s carbon cycle [25,26]. However, it is currently difficult to effectively separate them [27].
As a sensitive and fragile ecological environment, the Tibetan Plateau serves as an important ecological barrier (i.e., biodiversity, climate, and water cycle) in China [28,29] and plays a critical role in regulating water resources and climate change both in East Asia and worldwide [29,30]. Additionally, vegetation growth in the plateau has great effects on the ecological environment of China and East Asia [31]. However, it is widely acknowledged that the environmental conditions in the plateau have changed significantly in the last century [32,33], with the increasing impacts of anthropogenic activities such as agriculture, urbanization, and unsustainable logging practices [34]. All these changes result in a degradation of vegetation in the plateau [35,36], which would in turn threaten the livelihood that depends on the plateau’s resources and environment, affect biological geochemistry circulation and ecosystem services, and even threaten the ecological security of China and South Asia [29]. Due to the degradation of vegetation caused by climate change and/or increasing anthropogenic activities such as urbanization and unsustainable logging [28], the studies on vegetation growth in the plateau have attracted considerable attention [5,11,27]. NPP, which can act as an important indicator in the assessment of vegetation growth, has been widely used to reflect the growth of vegetation, and the variation of NPP and its correlation with climatic factors and anthropogenic activities in the plateau have also been widely studied [5,27,37]. However, due to the high elevation and inaccessibility, long time series observations of NPP in the plateau by field measurements based on harvest biomass or the eddy covariance technique have been limited. Most studies on the variation of NPP and its correlation with climatic factors in the plateau were based on remotely-sensed models [5,37]. However, the directions and amplitudes of NPP variation in the plateau were diverse. For instance, Xu [38] observed that the trend of NPP was significantly positive from 2000 to 2012 (1.15 g∙C∙m−2∙a−1), while Wang [10] showed that the trend was negative from 2000 to 2012 (−0.16 Tg∙C∙a−1). Moreover, climate change and anthropogenic activities are the two main factors that drive the variation of NPP [26,25]. In terms of climatic factors, such as temperature and precipitation, their relative importance on NPP variation in the plateau is unclear. Furthermore, anthropogenic activities, such as transportation construction, overgrazing, urbanization, and afforestation in the plateau, have a profound impact on the variation of NPP. Unfortunately, the knowledge on the relative contribution of these anthropogenic activities to NPP variation is limited. Therefore, it is necessary to improve our understanding of the relative contributions of climatic factors and anthropogenic activities to the variation of NPP in the plateau. However, only a few studies have attempted to quantify the isolated effects of climatic factors and anthropogenic activities on NPP variation in the Tibetan Plateau simultaneously [27]. Moreover, regarding anthropogenic activities, it is essential to separate the effects of ecological restoration (i.e., afforestation) and ecological destruction (i.e., deforestation) on the variation of NPP in the plateau. Due to the importance of vegetation growth and the study limitations mentioned above, the Tibetan Plateau is an ideal place to explore the relationship between vegetative growth and related driving forces (e.g., climate change) [21].
Due to ignorance of the time-lag effect of climatic factors in the CASA model, and the uncertainness of the CASA model applied in certain specific ecoregions mentioned above, as well as the numerous soil parameters needed for the complex calculation of potential and estimated evapotranspiration to estimate the water stress coefficient in the CASA model, the aim of this study is to apply a modified CASA model—which considers time-lag effects of the climatic factors and remote sensing information, which were easy to obtain with large spatial and temporal scales, included in the estimation of the water stress coefficient—to estimate NPP over the Tibetan Plateau during 2001–2015, and to explore the spatiotemporal variations of NPP. Furthermore, the relative contributions of climatic factors to NPP variation, along with the isolated effects of climate change and anthropogenic activities, were analyzed. The purpose of this study is to provide an improved CASA model for simulating vegetation NPP in the Tibetan Plateau, with the hope that it can be reproduced and used as a method to differentiate the combined effects of anthropogenic activities and climate change on NPP variation. Additionally, our findings could provide a theoretical basis for sustainable utilization, ecosystem management, and policy formulation related to the Tibetan Plateau.

2. Materials and Methods

2.1. Study Area

The Tibetan Plateau (26°00′12″–39°46′50″N, 73°18′52″–104°46′592″E), located in Western China (Figure S1) and covering an area of approximately 2.5 million km2 [39], is the highest and most extensive highland in the world, with an average elevation exceeding 4 km above sea level, and is called the “Third Pole” of the Earth [40]. According to long-term climatic records for 1961–2010, the mean annual temperature in the plateau varies in the range from –2.2 °C to 0 °C, and the mean annual precipitation varies between 415 and 512 mm [38]. The major land cover in the plateau includes forest, shrublands, grasslands, croplands, glaciers, and bare land, of which grassland is the major land cover type in the plateau, accounting for more than 55% of the total area [38]. Stations records show that most of the plateau has experienced statistically significant warming since the mid-1950s, while precipitation has been variable from region to region, with the southeast of the plateau receiving more precipitation and the northwest becoming drier during the last 40 years [34]. Additionally, the effect of anthropogenic activities, such as land cover changes, deforestation and afforestation, population increase, transportation construction, and tourism on vegetation growth in the plateau is increasing [27].

2.2. Dataset and Data Processing

2.2.1. Remote Sensing Data

Enhanced vegetation index (EVI) values from 2001 to 2015 were calculated on the basis of the Moderate Resolution Imaging Spectroradiometer (MODIS) Nadir Bidirectional reflectance distribution function Adjusted Reflectance (NBAR) product (MCD43A4, version 6). The spatial and temporal resolution of this product are 500 m and daily, respectively. The daily EVI was calculated and the Bidirectional Reflectance Distribution Function (BRDF) albedo quality flag (MCD43A2, version 6) was referenced to exclude pixels contaminated by snow or ice [41]. Monthly EVI was generated by using the maximum value composite (MVC) method [42]. Then, pixels with an EVI less than 0.1 were excluded.

2.2.2. Climate Data

Monthly mean temperature, monthly cumulated precipitation, and monthly cumulated solar radiation from 2001–2015 were downloaded from the China Meteorological Data Sharing Service System. The dataset has been verified by China’s Meteorological Information Center (located in Beijing) to exclude missing and false data [43]. Climate data were interpolated using the kriging spatial interpolation method, with a spatial resolution of 500 m across the study area. Although some uncertainty may be generated due to the limited meteorological stations, the kriging method is also regarded as a better method, with a lower bias than other interpolation methods [44].

2.2.3. Land Cover Data

The Global Land Cover 2000 (GLC-2000; Figure S2) dataset was applied to recognize land cover types in the Tibetan Plateau. This dataset, with a spatial resolution of 1 km, was generated by daily S1 data (from the SPOT-4 satellite) based on different classification methods, and local expert knowledge was considered to improve data accuracy [45]. Additionally, the dataset was independent from the MODIS dataset [43]. Since the MODIS land cover data were calculated with MODIS EVI, they could be less independent when analyzing them together. The GLC-2000 data were aggregated to 500 m to match the EVI data. However, the land cover changes, which may bias our results, were not considered in these categories when estimating NPP. Therefore, a change detection of land cover was applied based on the MODIS land cover type (MCD12A1) from 2001 to 2015. Our results indicate that 86.25% of grassland did not change, and 12.18% of grassland was transformed into built-up areas. Therefore, we assumed that the overall effects of grassland change on NPP were less during the study period.

2.2.4. Anthropogenic Datasets

To identify the effects of different types of anthropogenic activities, such as ecological restoration and ecological destruction, on the variation of NPP in the plateau, 30-m resolution land use/land cover data for the years of 2000 and 2015 were obtained from [46]. The dataset was developed from sources including Landsat TM/ETM remote sensing images, and generated by visual interpretation [47]. In this study, ecological restoration was defined as areas that were non-vegetated in 2000 and transformed into vegetated areas in 2015; similarly, ecological destruction was defined as areas vegetated in 2000 and transformed into non-vegetated areas in 2015.

2.3. Methods

2.3.1. NPP Estimation and Validation

The Carnegie–Ames–Stanford Approach (CASA) model (hereafter called the original CASA model) was applied in this study to simulate NPP over the Tibetan Plateau from 2001 to 2015. The NPP can be calculated as follows [18]:
N P P ( x , t ) = A P A R ( x , t ) × ε ( x , t )
where N P P ( x , t ) (g∙C∙m2) represents the vegetation NPP of pixel x in time t, A P A R ( x , t ) is the absorbed photosynthetically-active radiation (MJ∙m2), and ε ( x , t ) (g∙C∙mJ−1) shows the actual light-use efficiency.
A P A R ( x , t ) is determined by total solar radiation (SOL; MJ∙m−2) and the fraction of photosynthetically active radiation (FPAR), which is determined from the satellite-monitored vegetation index (e.g., EVI). ε ( x , t ) can be calculated as the combined effect of surrounding stressors from soil moisture (W) and temperature ( T 1 , T 2 ), as well as maximum light-use efficiency ( ε m a x , g∙C∙mJ‒1), and values of ε m a x for different vegetation types were used based on a previous study [48]. Therefore, the NPP can be calculated as follows:
NPP = S O L × F P A R × W × T 1 × T 2 × ε m a x × 0.5
where T 1 represents the effects of extreme low and high temperature on light-use efficiency, and T 2 is the light-use efficiency in the situations where temperature falls below or rises above the optimum temperature when the vegetation index (EVI) reaches the maximum value throughout the year.
Previous studies have reported a time-lag effect between vegetation growth and climatic factors on a monthly scale [20]. Therefore, a three-month time-lag effect of climatic factors on vegetation growth according to previous studies [20,21] was considered in the CASA model (hereafter called the modified CASA model). In addition, in the original CASA model, the stressors from soil moisture (W) are usually calculated based on potential and estimated evapotranspiration, and usually determined from a one-layer budget soil moisture model [14]. However, the model is complex and needs numerous soil parameters, and usually these data are extracted with low spatial and temporal resolution. In addition, soil parameter data are usually unavailable at a sufficiently detailed spatial scale [49], especially for areas with high elevation. Furthermore, remote sensing information was not included in the estimation of the parameter W, unlike the estimation of APAR and the temperature stress coefficient [14]. Such limitations introduced considerable uncertainty to the estimation of both the parameter W and final NPP [4]. Therefore, the parameter Wp was considered in the modified CASA model to replace W according to previous studies [14,50]. The calculation of Wp was based on remote-sensing data, and the input parameter LSWI (land surface water index) is a representative parameter of leaf and canopy, as well as of soil moisture [14], thus, Wp could decrease the uncertainness of the calculation of the moisture stress coefficient applied in the CASA model to some extent, when compared to W [14]. The calculation of Wp can be described as follows:
W p = 0.5 + P r e P r e m a x × [ ( 1 1 + L S W I 1 + L S W I m a x ) + 0.5 ]
where P r e and P r e m a x represent monthly precipitation and annual maximum monthly precipitation, respectively. L S W I is the land surface water index and can be calculated as:
L S W I = R e f 2 R e f 6 R e f 2 + R e f 6
where R e f 2 and R e f 6 represent the reflectence in a given band of MCD43A4.
Once the time-lag effect was considered and the parameter W was replaced by W p , the modified CASA model was applied without changing the estimation of other parameters in the original CASA model.
After NPP was estimated based on the original and modified CASA models, field-observed biomass data acquired from previously published studies encompassing the time range between 2001 and 2015 (Table S1) were used to evaluate the performance of the models. Similar to previous studies [51,52], the biomass was converted to NPP based on the following Equations (5)–(7):
N P P i = N P P a b o v e + N P P u n d e r
N P P a b o v e = B i o a b o v e × 0.475
N P P u n d e r = 0.25 + N P P a b o v e × 0.0009 ( g   m 2 ) × B i o u n d e r × 0.6
where N P P i is the NPP value at site i; N P P a b o v e and N P P u n d e r are the above- and under-ground NPP, respectively; and B i o a b o v e and B i o u n d e r are the above- and underground biomass, respectively.
For several sites at which only above-ground biomass were acquired, a constant ratio of 6.575 for underground biomass to above-ground biomass was assumed (a mean value of 5.26 and 7.89 for meadow and desert steppe, respectively, proposed by Piao [53]. Then, the underground NPP was calculated based on the equations mentioned above. After that, the corresponding years of converted NPP (hereafter, field–observed NPP) and modeled NPP were compared. Due to difficulties determining into which pixel a particular ground plot fell, as in previous studies [43,54], a mean value of nine pixels (3 × 3) was applied to represent the modeled NPP. Then, the corresponding NPP values from field observations and the model were compared, and the performance of the modeled results were evaluated by two statistical indicators: mean absolute error (MAE) and root mean square error (RMSE); the result with lower values of RMSE and MAE was considered better than the other, and finally the better result was considered for the flow analysis. MAE and RMSE were calculated as follows (Equations (8) and (9)):
M A E = 1 m i = 1 m | N P P i N P P i * |
R M S E = i = 1 m ( N P P i N P P i * ) m
where N P P i and N P P i * represent the estimated NPP and field–observed NPP at sample i, respectively; and m is the sample size.

2.3.2. Trend Analysis

The trend of NPP was calculated based on the Mann-Kendall (M-K) method. This method presents a monotonic trend, and independence and normality were not required [55]. Additionally, approximately a normal distribution of the test statistic Z is satisfied when the sample size is greater than 8 [55]; a negative Z value represents a decreasing trend, and vice versa. In addition, the significance of NPP trends were tested at α = 0.05. Furthermore, the magnitude of change of NPP was calculated based on the Theil-Sen median slope estimator, which is more appropriate to evaluate variable changes in short and/or noisy time series [56]. The calculation of M-K and the Theil-Sen median slope were as follows (see [57] for details):
S = m = 1 p 1 n = m + 1 p s g n ( x n x m )
where p is the number of data points, x m and x n are the data values at times m and n (n > m), respectively, and sgn(xnxm) is the sign function:
s g n ( x n x m ) = { + 1 , i f   x n x m > 0 0 , i f   x n x m = 0 1 , i f   x n x m < 0
The variance was calculated as:
V a r ( S ) = p ( p 1 ) ( 2 p + 5 ) m = 1 q f m ( f m 1 ) ( 2 f m + 5 ) 18
where p is the number of data points, q is the number of tied groups, and f m denotes the number of ties of extent m. A tied group is a set of sample data that have the same value.
The test statistic Z was calculated as follows (Equation (13)), and the trends were tested at α = 0.05:
Z = { S 1 V a r ( s ) ,   i f   S > 0 0 ,   i f   S = 0 S + 1 V a r ( s ) ,   i f   S < 0
Additionally, the Theil–Sen median slope was calculated as Equation (14):
β s = M e d i a n   ( x k x m k m )   f o r   s = 1 ,   ,   N
where x k and x m are the data values at times k and m (k > m), respectively.

2.3.3. Relationship between Climatic Factors and NPP

Multicollinearity usually exists among climatic factors (i.e., temperature vs. solar radiation), and bring errors into the predictions.To detect the extent to which a change in climatic factors affects NPP under multiple climate drivers simultaneously, and to avoid multicollinearity among climatic factors, a partial least squares (PLS) regression model–which encompasses the advantages of ordinary least squares linear regression, canonical correlation analysis, and pricinpal component analysis [58], and often gives improved prediction results coompared to the ordinary linear regression model [58,59] was applied at the pixel level. An F-test and a bilateral t-test, respectively, were used to evaluate the significance of the regression model and regression coefficients, with a significance level of 0.05. Only the pixels with both the regression model and their corresponding coefficients significant simultaneously were considered to calculate the sensitivity of NPP to climatic factors.

2.3.4. Isolated Effects of Climate Change and Anthropogenic Activities on Trends of NPP

The first difference ( Var = V a r t + 1 V a r t ) method was used to explore the isolated effects of climate change on NPP variation. This method is a common de-trending method for climate-yield relationships, and it has been applied widely [60,61]. Firstly, the first difference values of variables (e.g., NPP and climatic factors) were calculated, and then a partial least squares regression model, as mentioned above was used to estimate the sensitivities of NPP to climatic factors. The regression model was established as follows:
N P P = S e n t e m × T e m + S e n p r e × P r e + S e n s o l × S o l + i n t
where N P P denotes the first difference value of NPP; T e m , P r e , and S o l represent the first difference values of mean temperature, cumulative precipitation, and cumulative solar radiation, respectively; S e n t e m , S e n p r e , and S e n s o l represent the sensitivity of NPP to temperature (kg∙C∙m−2∙a−1 °C−1), precipitation (kg∙C∙m−2∙a−1 mm−1), and solar radiation (kg∙C∙m−2∙a−1)/(MJ∙m−2), respectively; and i n t is the intercept of the partial least squares regression model.
Therefore, the isolated impacts of climate change on NPP variation were calculated as follows:
N P P c l i = S e n t e m × T r e t e m + S e n p r e × T r e p r e + S e n r a d × T r e r a d
where N P P c l i represents the trend of NPP impacted just by climate change; T r e t e m , T r e p r e , and T r e r a d represent the trends of mean temperature, cumulative precipitation, and cumulative solar radiation for the corresponding period, respectively; and other parameters are defined as in Equation (15).
Based on the calculation above, the relative contribution from each climatic factor to the trend of NPP can be calculated by Equation (17):
R C i = | S e n i × T r e i | 1 n | S e n i × T r e i | × 100 %
where R C i represents the relative contribution of climatic factor i (e.g., temperature) to the trend of NPP; S e n i represents the sensitivity of NPP to climatic factor i; T r e i represents the trend of climatic factor i; and n is the number of climatic factors, with n = 3 in this study.
The isolated impacts of anthropogenic activities on NPP were obtained indirectly, and can be calculated as follows:
N P P a n t h r o = N P P c o m b N P P c l i
where N P P a n t h r o represents the trend of NPP under the isolated impacts of anthropogenic activities; N P P c o m b represents the trend of NPP affected by anthropogenic activities and climate change combined, and this value was calculated based on the modified CASA model in this study.
Notably, the isolated anthropogenic activities were based on the hypothesis that NPP variation was impacted by climate change and anthropogenic activities; thus, when climate impact was removed, the impacts of anthropogenic activities can be identified [62,63]. Therefore, the anthropogenic activities mentioned above include all types of anthropogenic activities.

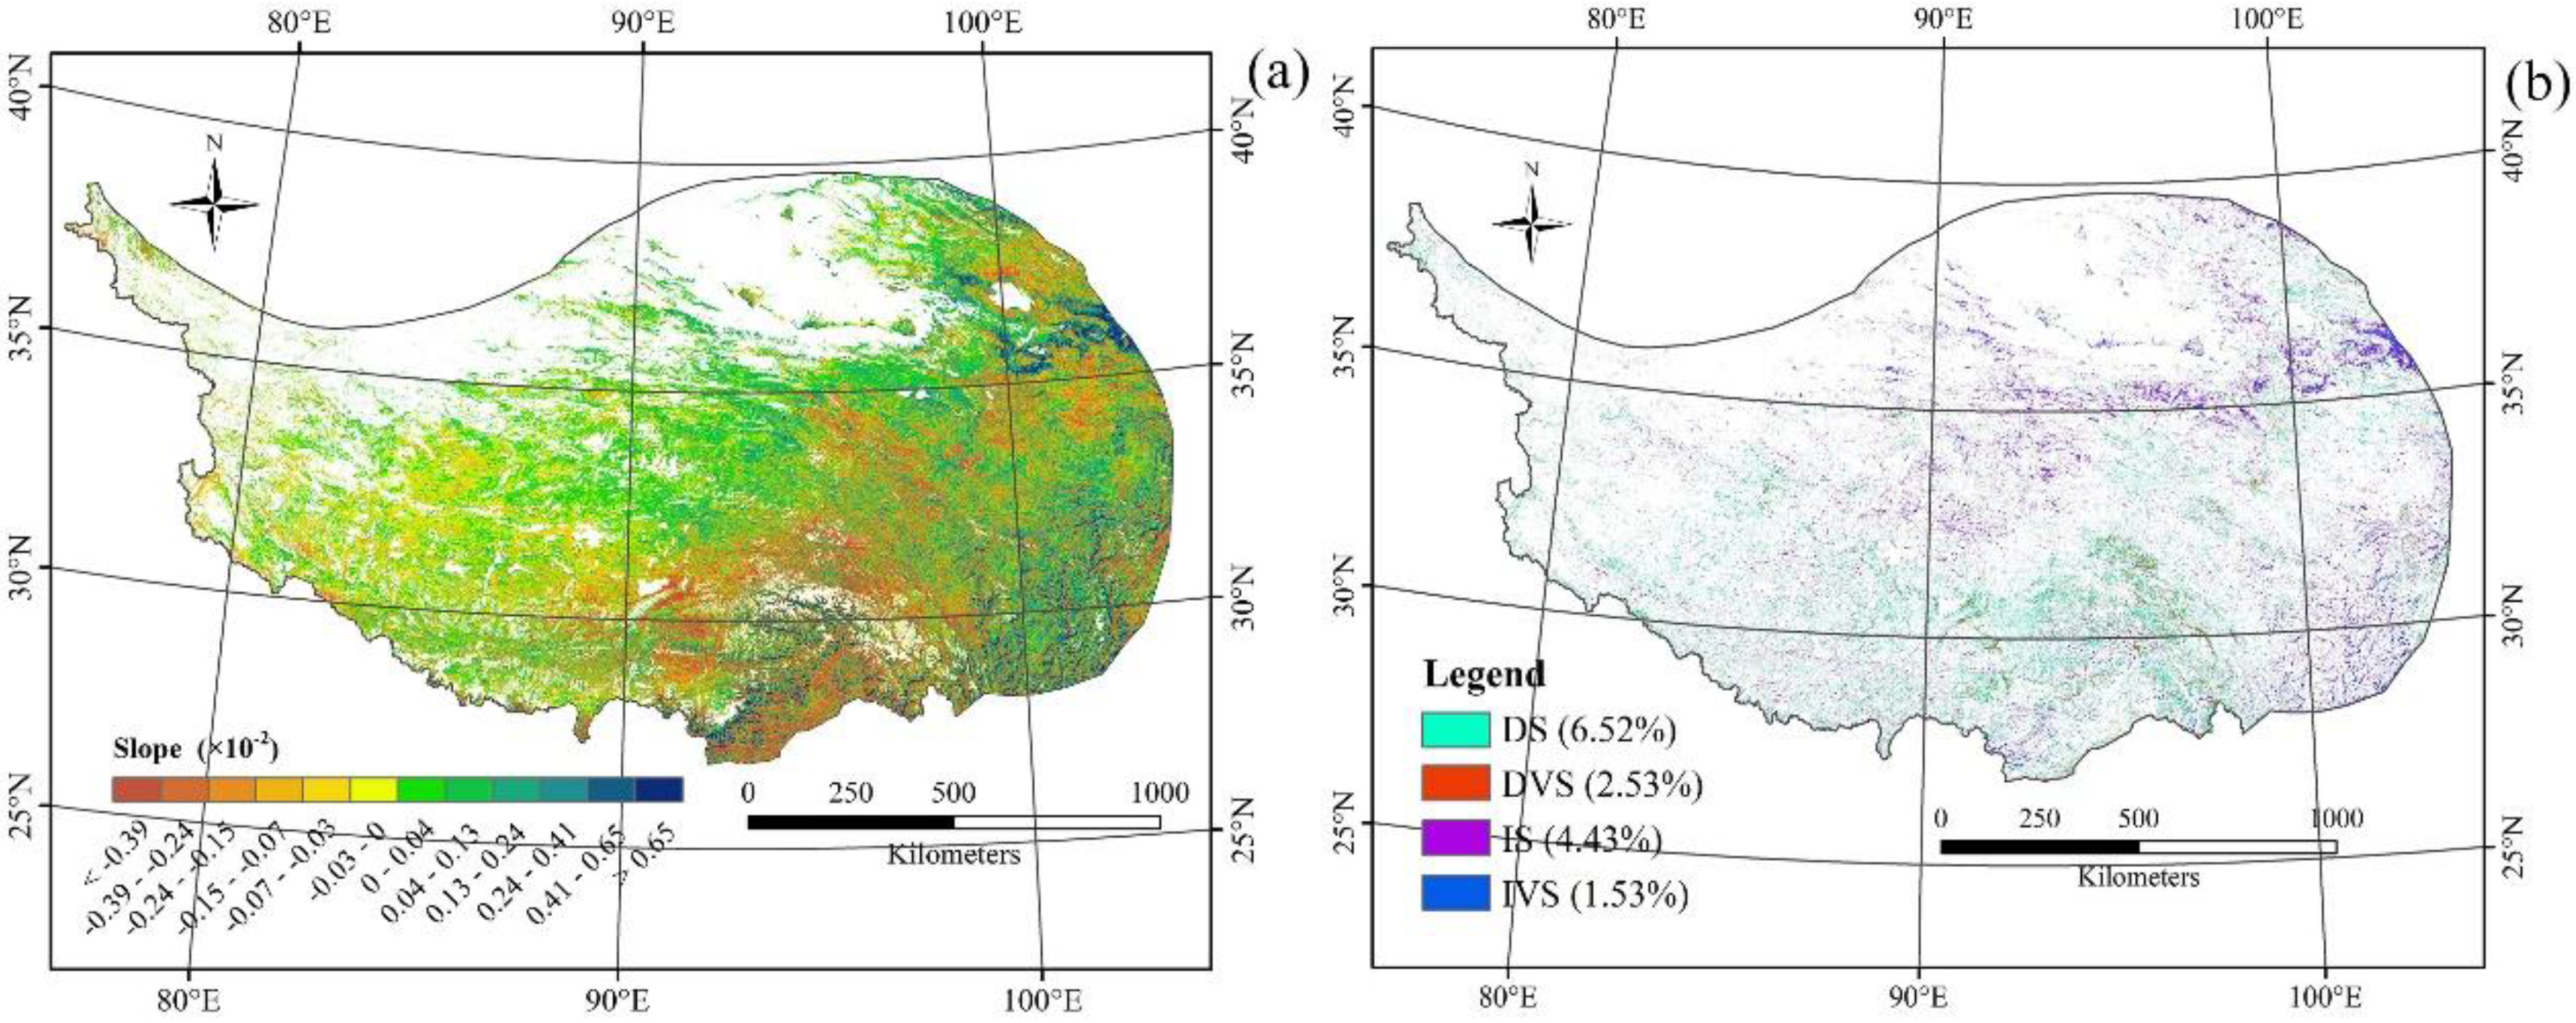
2.3.5. Ecological Restoration and Ecological Destruction Extraction

To identify the effect of different types of anthropogenic activities on NPP variation, ecological restoration, and ecological destruction data were extracted. As in a previous study [64], pixels labeled as non-vegetated (i.e., desert) in 2000 and as vegetated (i.e., grassland or forest) in 2015 at the same location were selected, and then the selected pixels were aggregated to a 500 m resolution. The ecological restoration data for each pixel were represented by the area fraction of conversion from non-vegetated in 2000 to vegetated in 2015. The processing of ecological destruction data was similar, but with pixels labeled as vegetated in 2000 and as non-vegetated in 2015. The ecological destruction data for each pixel were represented by the area fraction of conversion from vegetated in 2000 to non-vegetated in 2015.
All the calculations and analyses mentioned above were conducted in ARCGIS 10.3 (ESRI, Redlands, CA, USA), ENVI 5.3 (Exelis Visual Information Solutions, Boulder, CO, USA), and MATLAB R2017b (The Mathworks, Inc., Natick, MA, USA).

3. Results

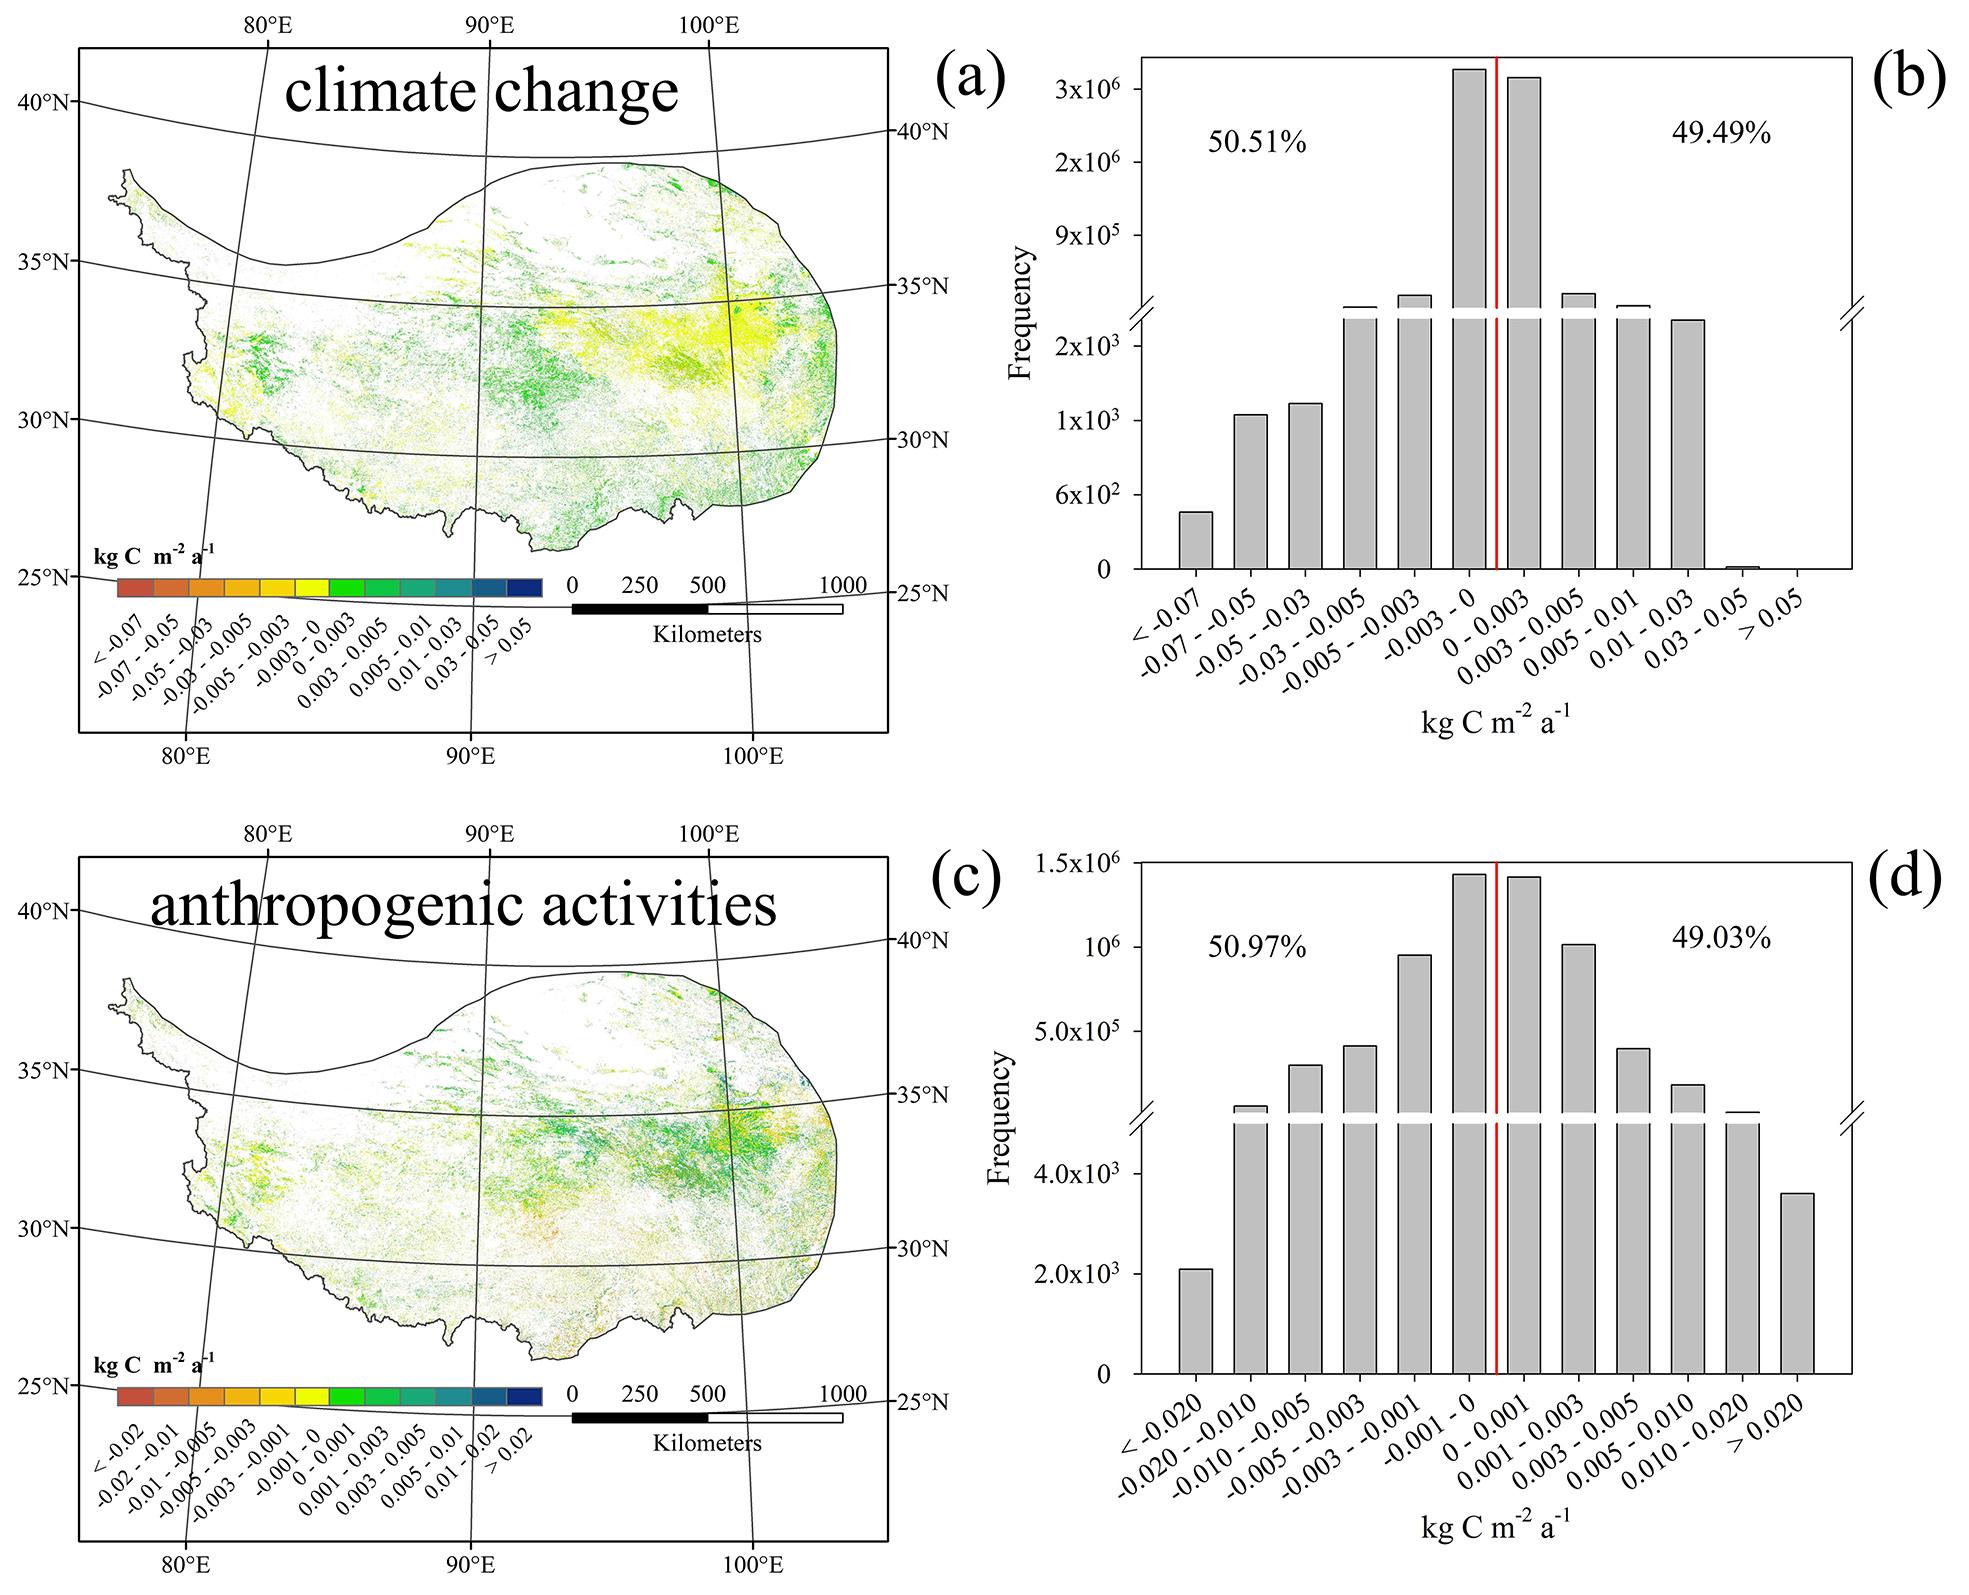
3.1. Validation of NPP Estimation

NPP values obtained from field observations were applied to validate the results from the two CASA models. The comparison (Figure 1) showed that very significant (p < 0.0001) correlations were found between field-observed NPP and the two modeled NPP. In addition, the MAE and RMSE for the original CASA model were 0.18 kg∙C∙m−2∙a−1 and 0.24 kg∙C∙m−2∙a−1, respectively, which decreased to 0.10 kg∙C∙m−2∙a−1 and 0.13 kg∙C∙m−2∙a−1, respectively, for the modified CASA model. Furthermore, the relative RMSE and MAE decreased by more than 44% compared to the original CASA model. Additionally, the R2 value for the original CASA model was 0.44, which increased by 9.09% using the modified CASA model. Our results indicate that not only were the results of the modified CASA model consistent with the values obtained from field observations, but the modified model performed better than the original model. We, therefore, assume that the modified CASA model is an appropriate estimator for grassland NPP over the Tibetan Plateau.

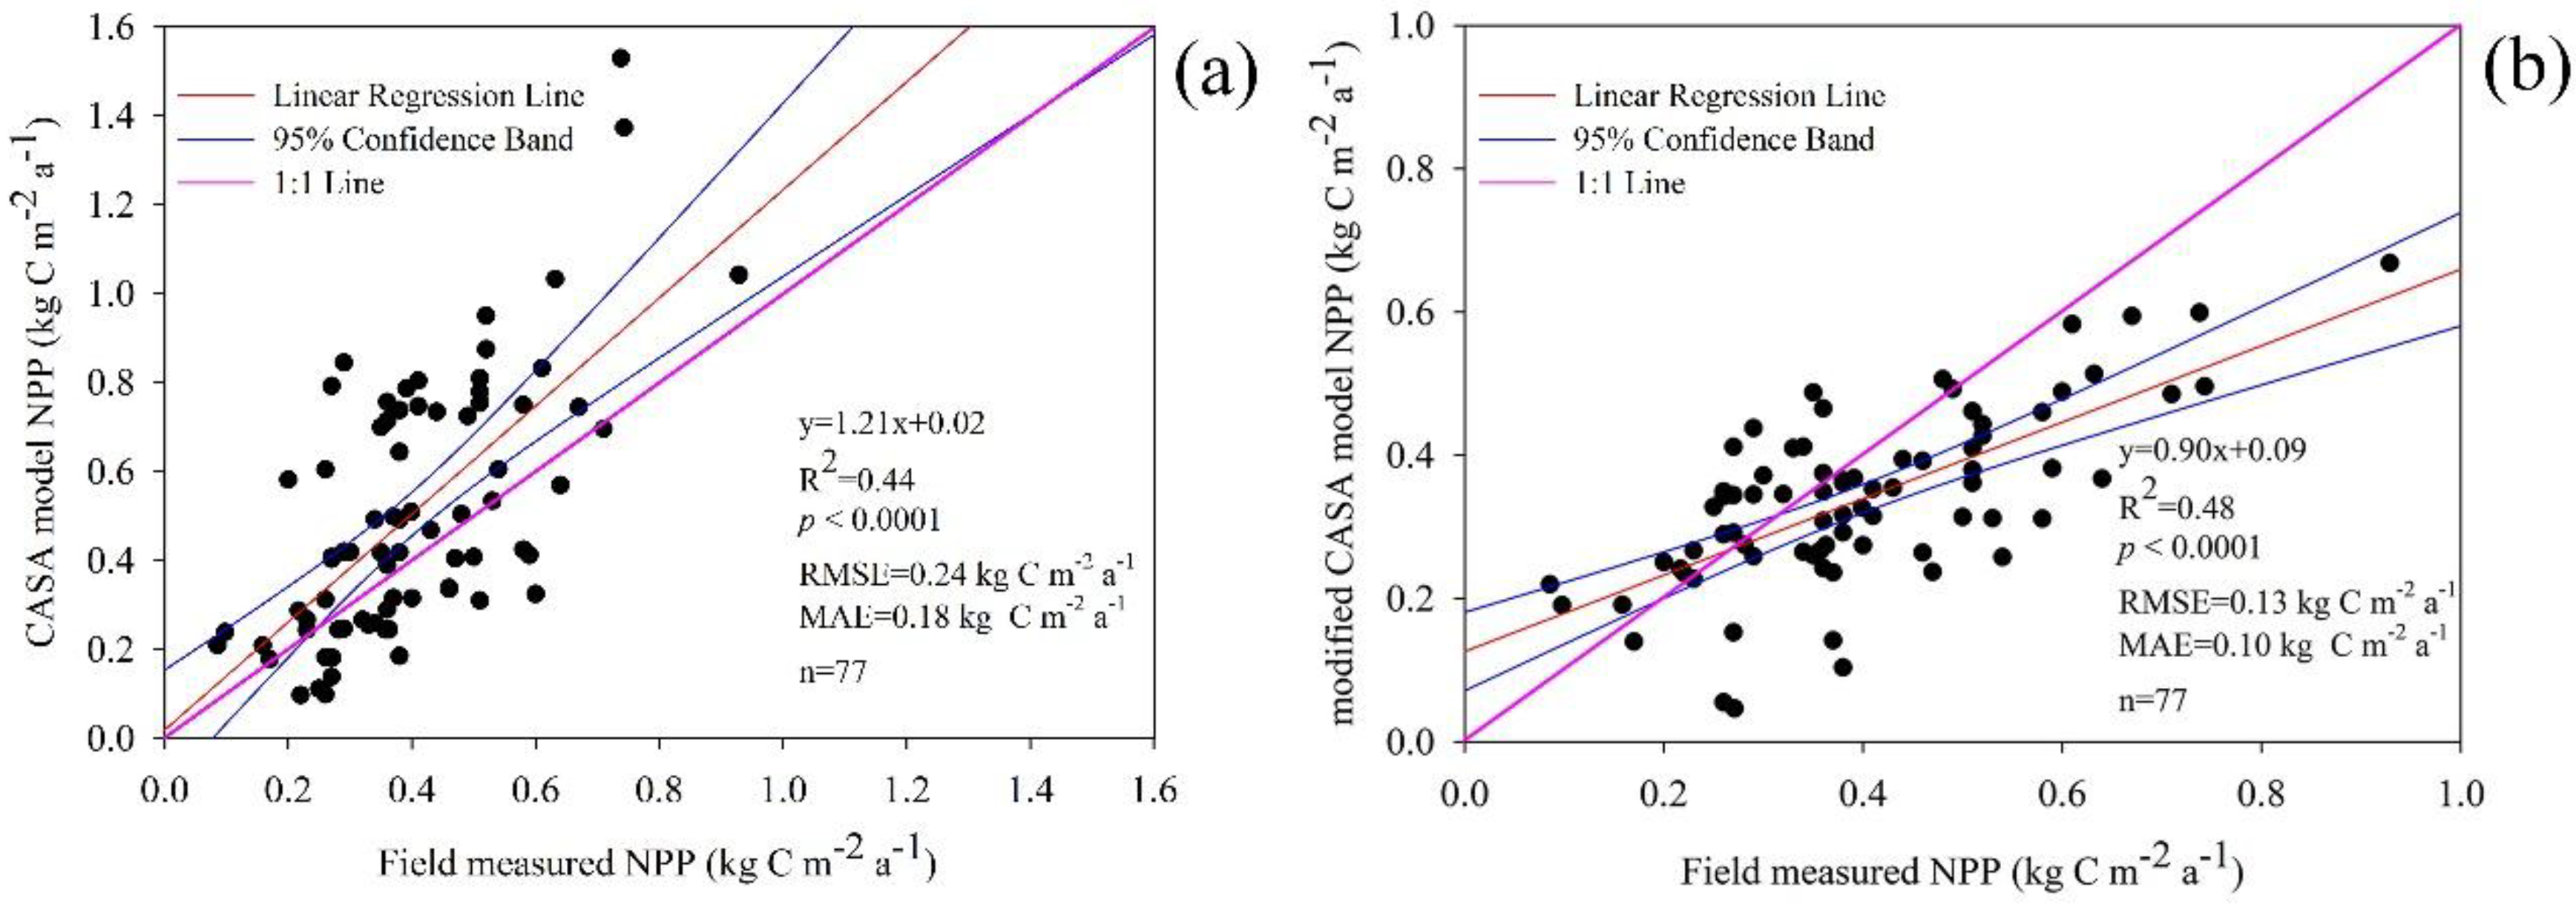
3.2. Spatial Patterns of NPP

Figure 2 illustrate the spatial pattern and standard deviation of NPP over 2001–2015 in the Tibetan Plateau. The mean annual NPP for these 15 years showed an increasing pattern from northwest to southeast (Figure 2a). The lowest values occurred in the west and north of the plateau, with values lower than 0.042 kg∙C∙m−2. In contrast, the highest values (more than 0.700 kg∙C∙m−2) were found in the southeast of the plateau. NPP values ranging from 0.250 and 0.700 kg∙C∙m−2 mostly occurred in the east of the plateau. For the remaining areas, NPP values mostly ranged from 0.042 to 0.250 kg∙C∙m−2, and they were mainly distributed in the middle and southwest of the plateau. Additionally, the spatial pattern of annual NPP for each year (2001–2015) was similar to that of mean annual NPP (Figure S3). The spatial pattern of the standard deviation (Figure 2b) was similar to that of the mean annual NPP. For most of the study area, the standard deviation was lower than 0.037 kg∙C∙m−2, accounting for 75.70% (Figure S4). However, higher values were found in the east and southeast of the plateau, with values more than 0.037 kg∙C∙m−2.

3.3. Temporal Trend of NPP

The temporal trend of annual NPP across the Tibetan Plateau is displayed in Figure 3a. During the study period (2001–2015), pixels that displayed either a significant decrease or increase (p < 0.05) accounted for 15.01% (Figure 3b). Of the total pixels, 53.20% displayed a decreasing trend, and 9.05% of the total pixels displayed a significantly negative trend (p < 0.05; Figure S3). Overall NPP decreased with a mean value of −0.02 × 10⁻² kg∙C∙m−2 a−1, and the magnitudes of decreasing NPP mostly ranged from 0 to −0.15 × 10⁻² kg∙C∙m−2∙a−1 (Figure S5), distributed in the south and southwest of the Tibetan Plateau. In contrast, 46.80% of the total pixels exhibited an increasing trend, of which approximately 6% showed a significantly positive trend (p < 0.05; Figure S5). The increasing trend of NPP was mostly distributed in the center of the plateau, with the magnitudes mainly ranging from 0 to 0.13 × 10⁻² kg∙C∙m−2∙a−1 (Figure S5).

3.4. Relationship Relating NPP and Climatic Factors

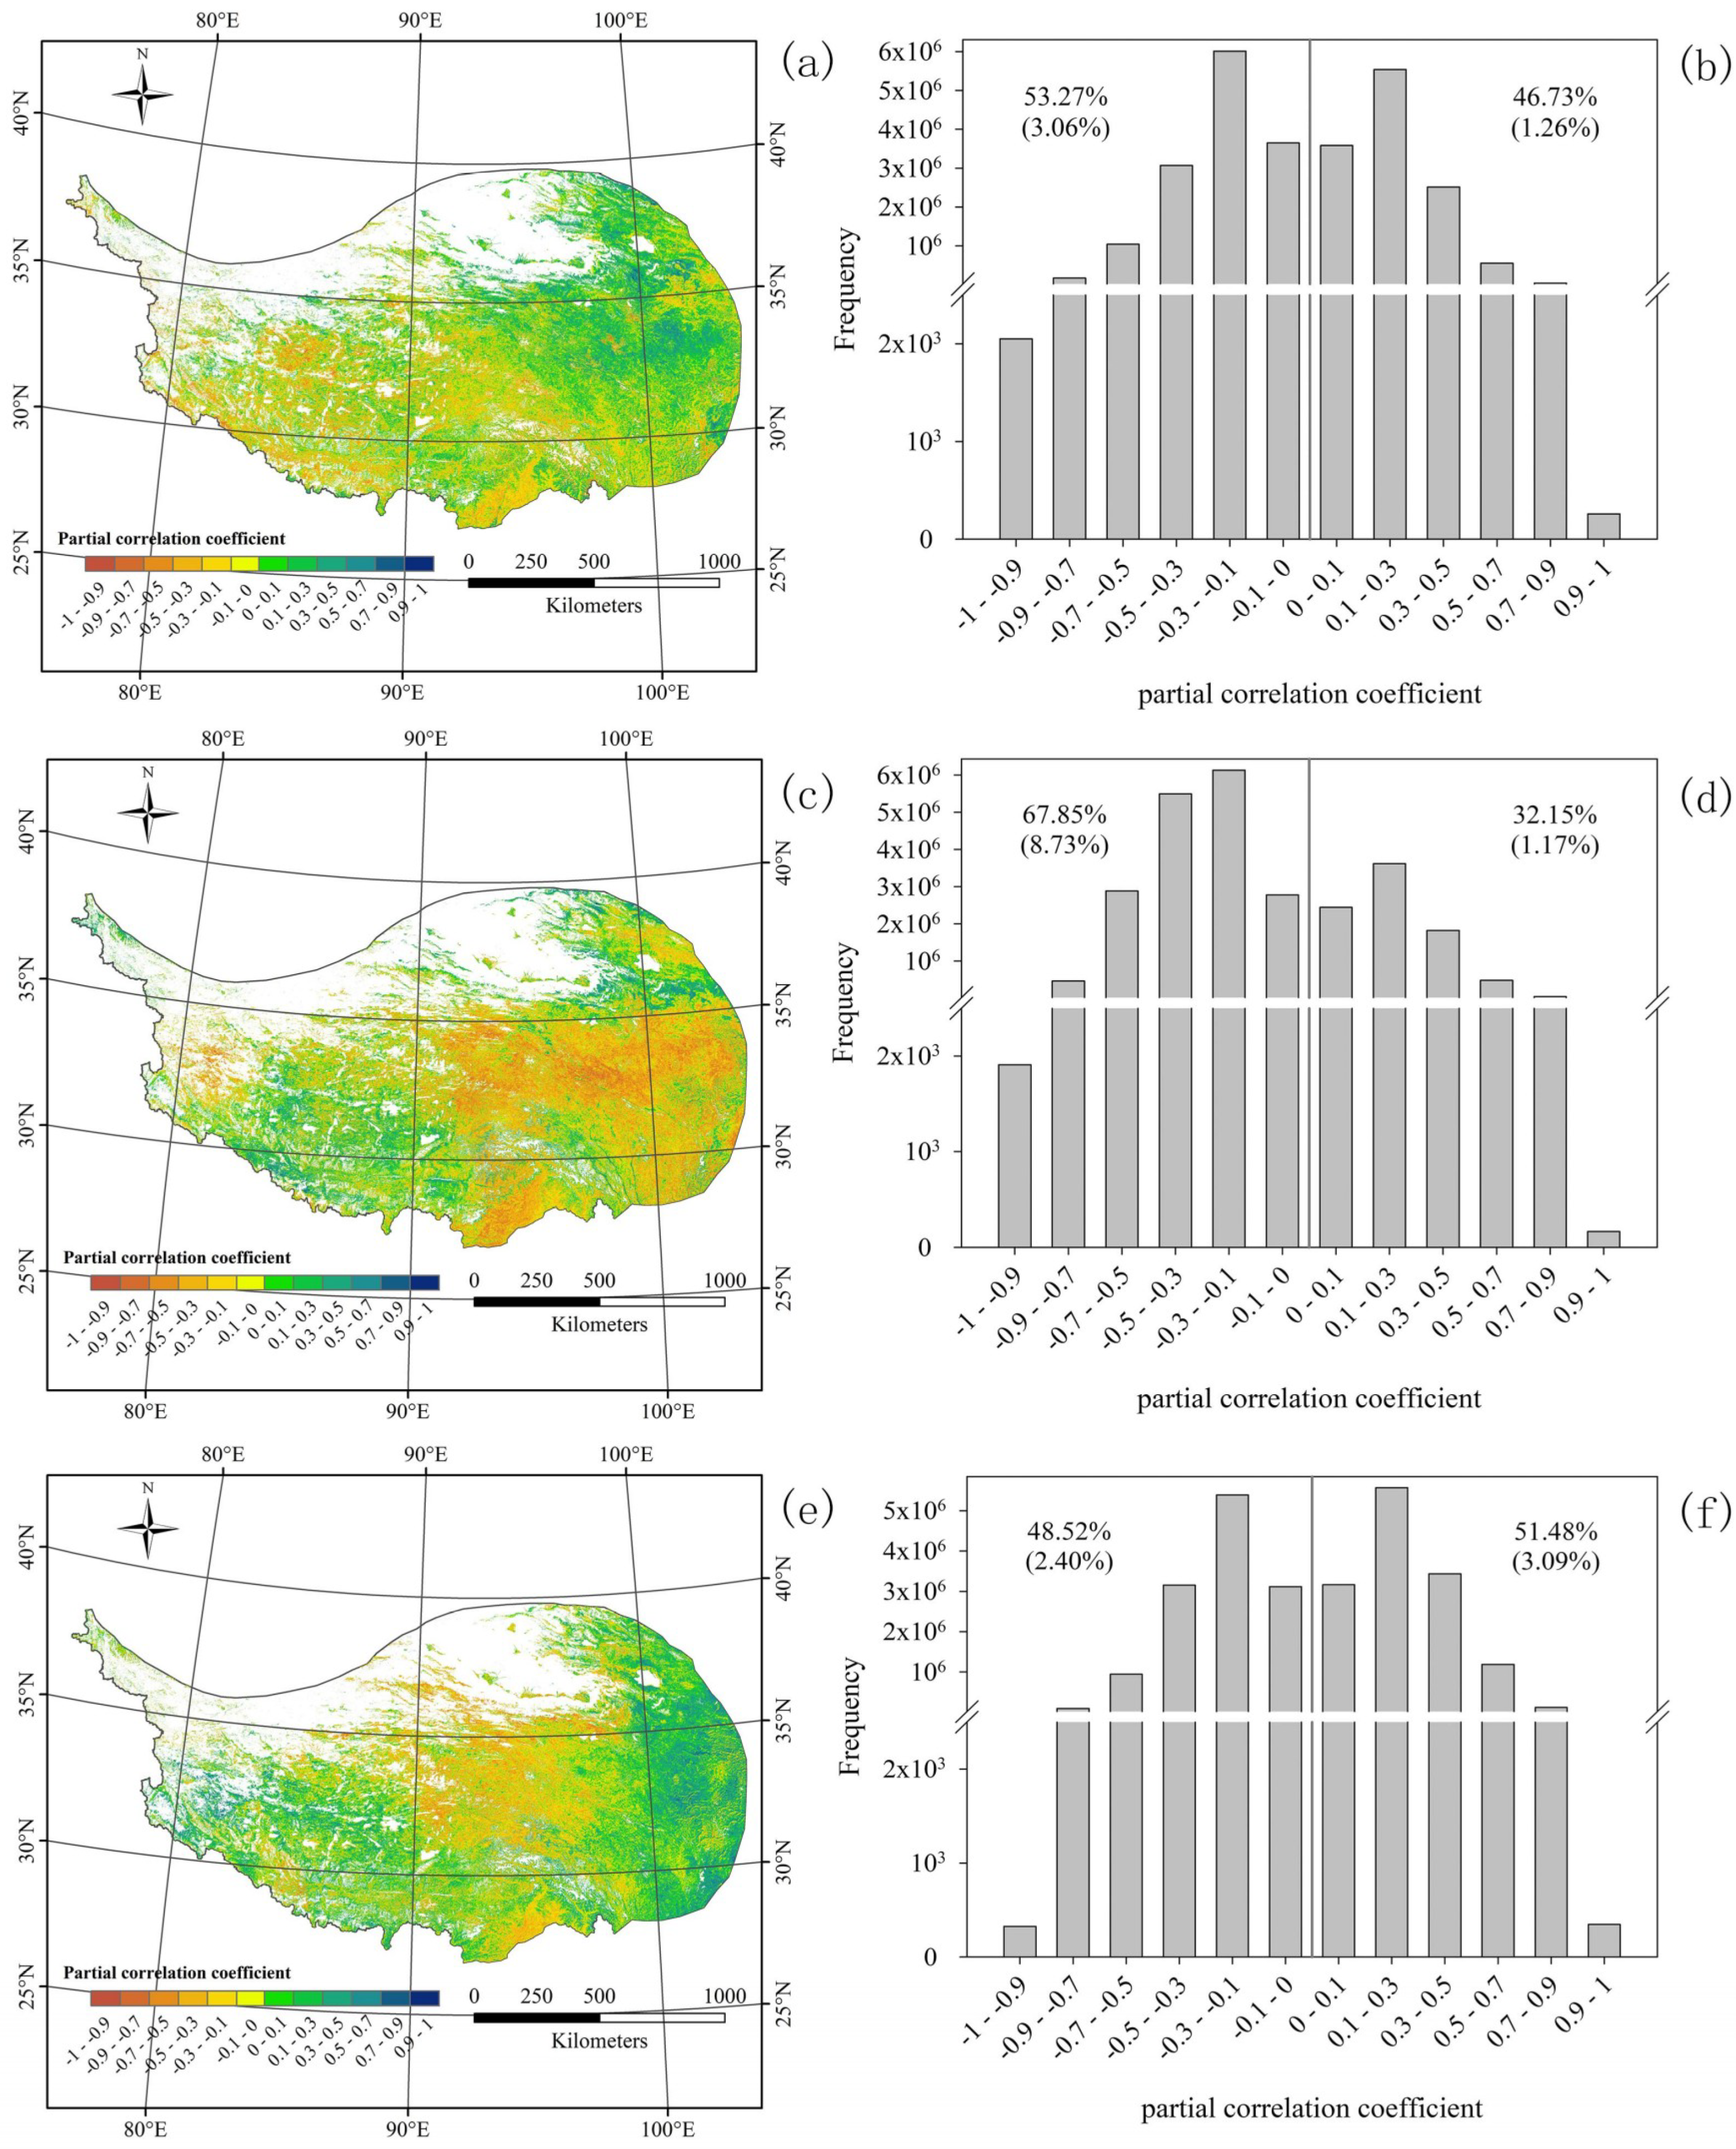
3.4.1. Sensitivity of NPP to Various Climatic Factors

Pixels with both the regression model and their corresponding coefficients that were significant were simultaneously selected to calculate the sensitivity of NPP to climatic factors, and they are shown in Figure 4. A positive response of NPP to temperature was mostly found in the east of the plateau (Figure 4a), while a negative sensitivity to temperature mostly occurred in the west of the plateau, accounting for 54.19% of the total pixels (Figure 4b). The responses of NPP to temperature mainly ranged from −0.02 to 0.04 (kg∙C∙m−2∙a−1)/°C, with a mean value of −0.0003 (kg∙C∙m−2∙a−1)/°C. Regarding precipitation sensitivities, about 89.29% of the total pixels had a negative coefficient related to NPP, and they were mainly distributed in the east and southeast of the plateau. In contrast, a positive relationship was mostly found in the southwest of the plateau (Figure 4c), accounting for 10.71% of all pixels. The responses of NPP to precipitation ranged from −0.8 to 1.2 (g∙C∙m−2∙a−1)/mm for most pixels (Figure 4d), with a mean value of −0.254 (g∙C∙m−2∙a−1)/mm. Positive sensitivity of NPP to total solar radiation was found for most pixels throughout the study area (Figure 4e), and they mainly ranged from 0 to 0.208 (g∙C∙m−2∙a−1)/(MJ∙m−2) (Figure 4f), with an average of 0.038 (g∙C∙m−2∙a−1)/(MJ∙m−2).

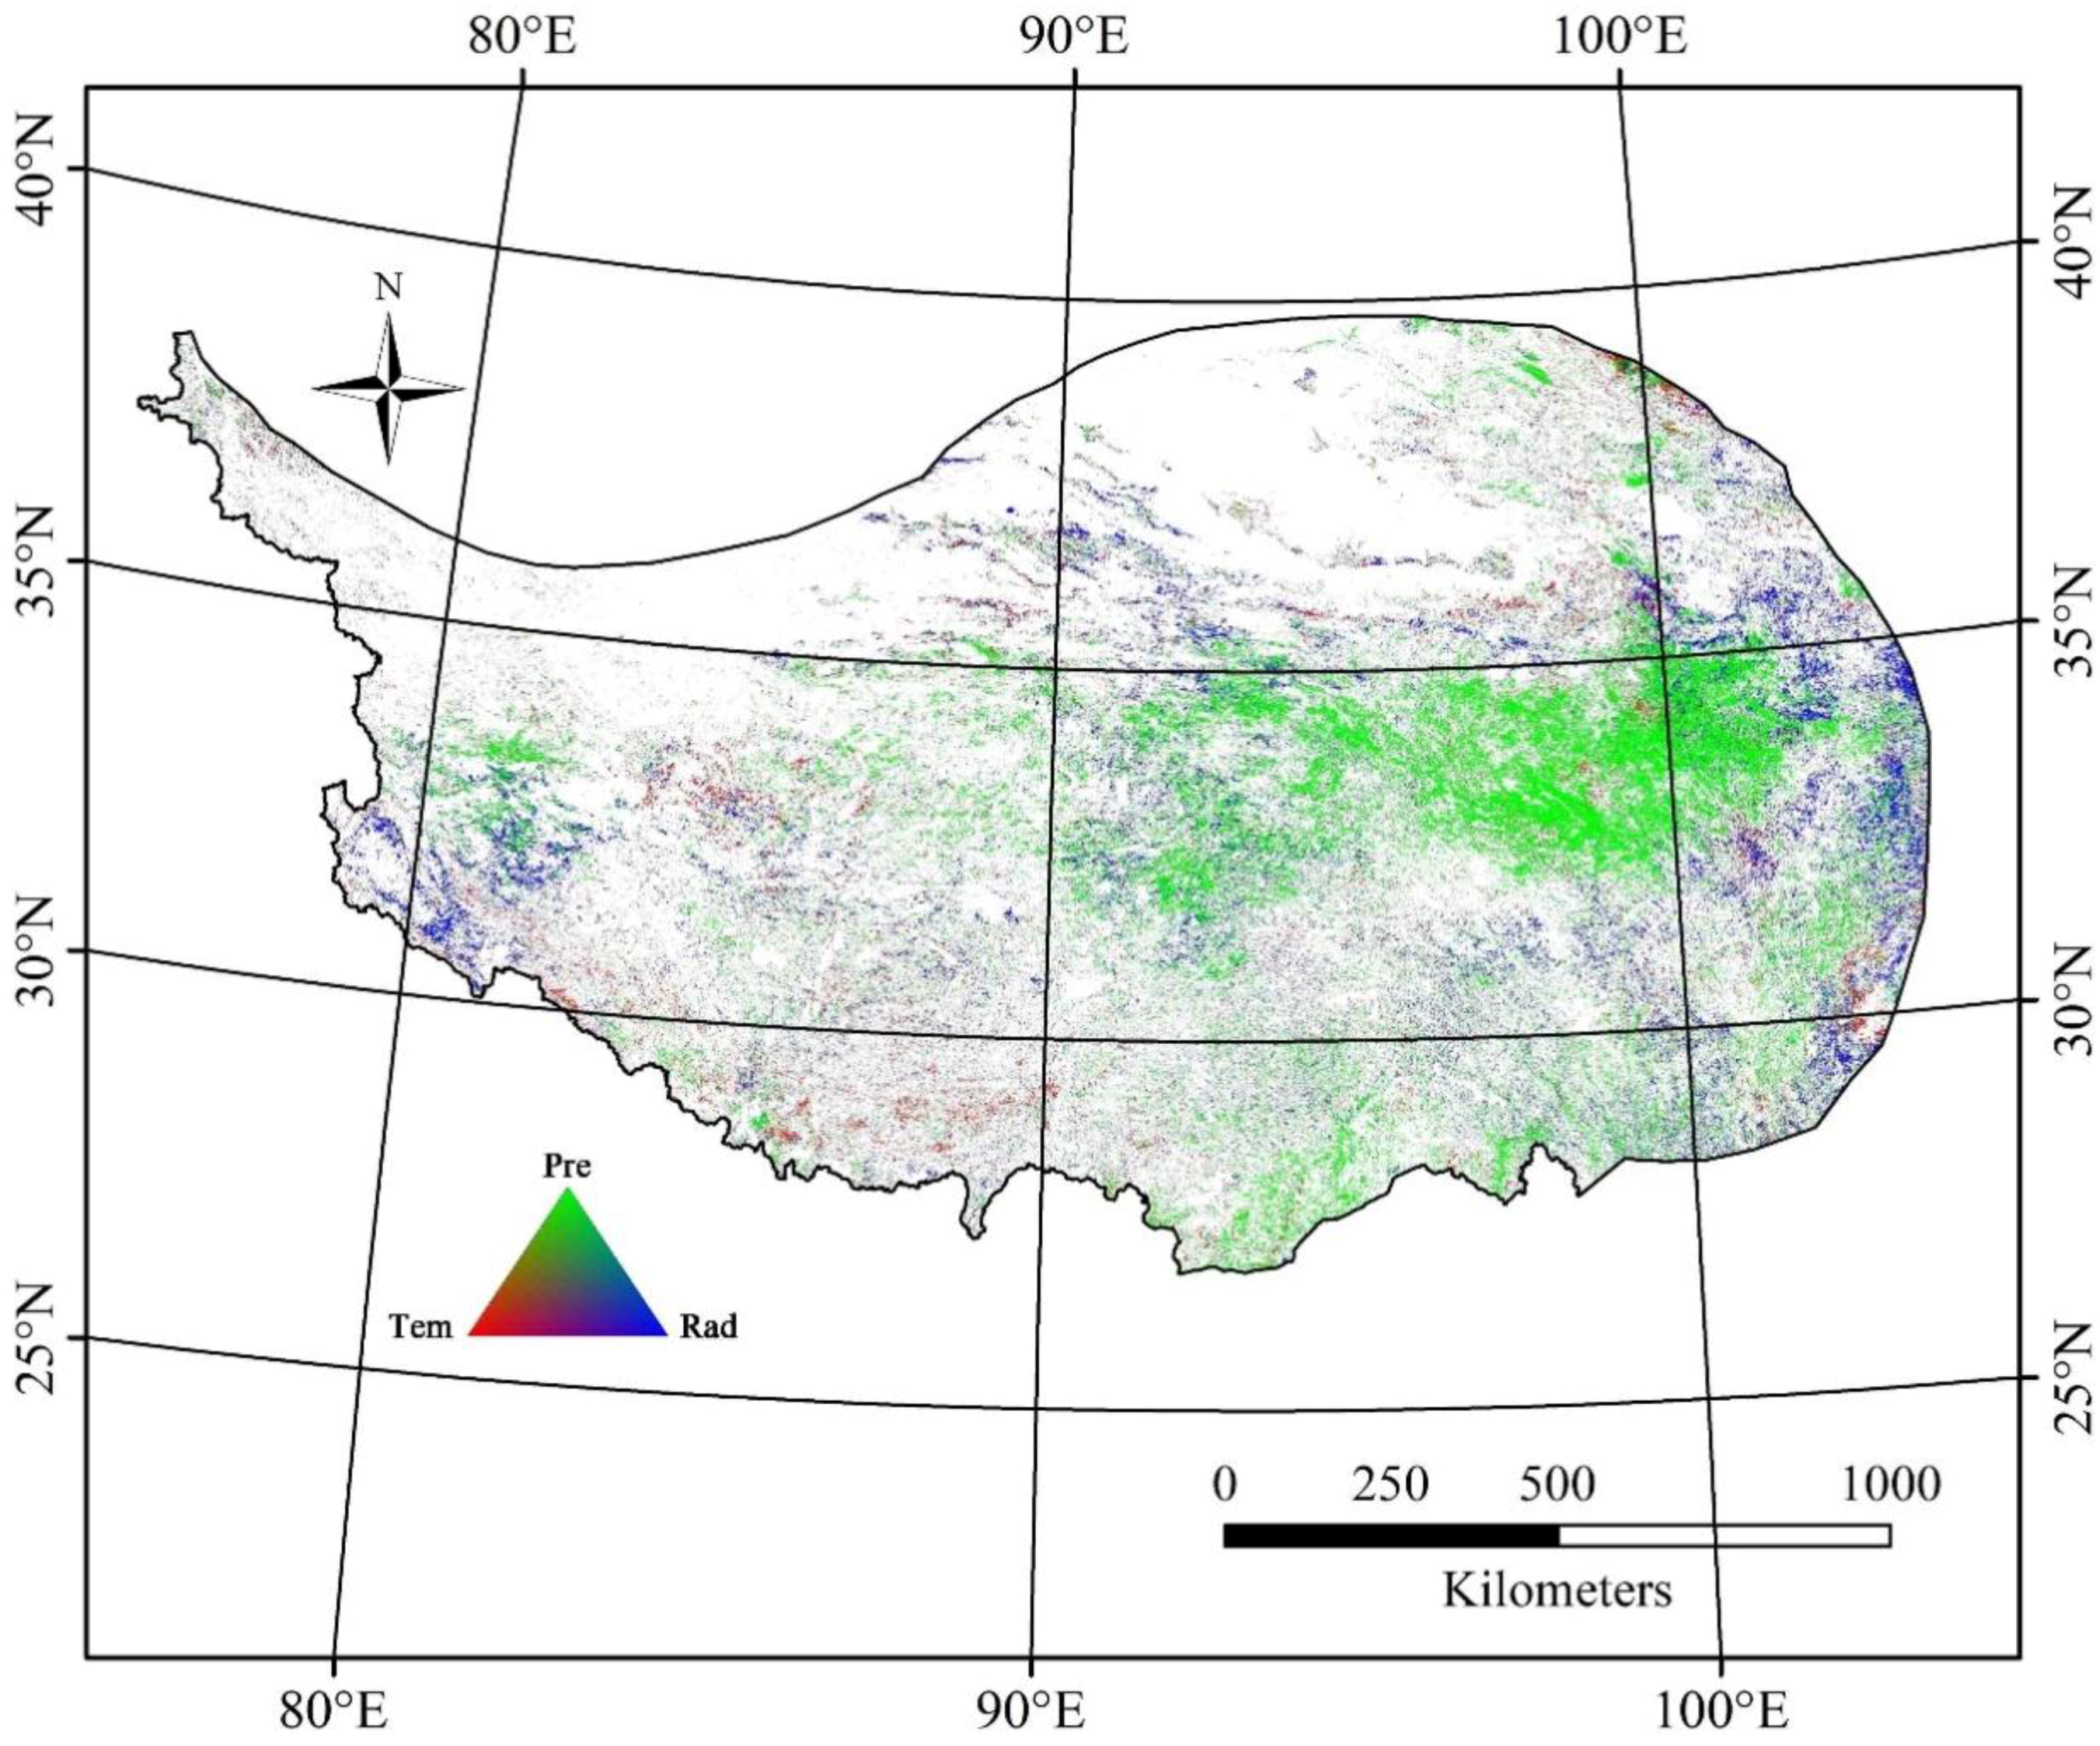
3.4.2. Relative Effects of Climatic Factors on NPP

The relative impacts of climate factors on NPP are illustrated in Figure 5. Among the three climate factors, the impact of annual cumulative precipitation was the greatest; mean annual cumulative precipitation contributed to over 58% of the total pixels, mainly scattered in the middle of the Tibetan Plateau. Annual cumulative solar radiation contributed to approximately 29% of the total pixels, mainly occurring in the eastern edge of the plateau. The extent of the impact of annual mean temperature seemed very limited when compared with the other two climatic factors (<13%), and those pixels were mostly scattered in the southwestern area of the plateau. Furthermore, annual cumulative precipitation contributed to 47.84% of significantly increasing NPP, followed by annual solar radiation—approximately 13.48%—and the lowest was annual mean temperature, only accounting for 13.48%. The percentage of relative contributions of climatic factors to significantly decreasing NPP was similar to that of significantly increasing NPP, approximately 44.58%, 31.98%, and 23.44% for annual cumulative precipitation, annual cumulative solar radiation, and annual mean temperature, respectively (Figure S6).

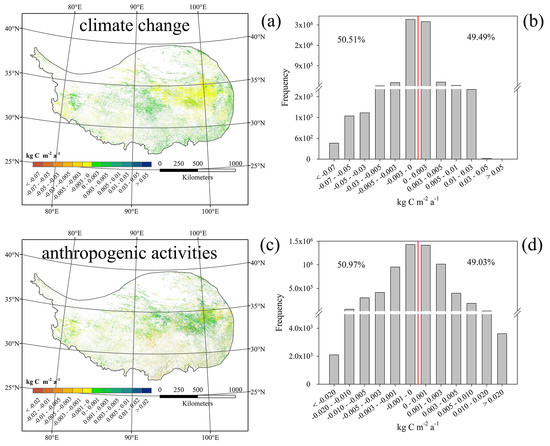
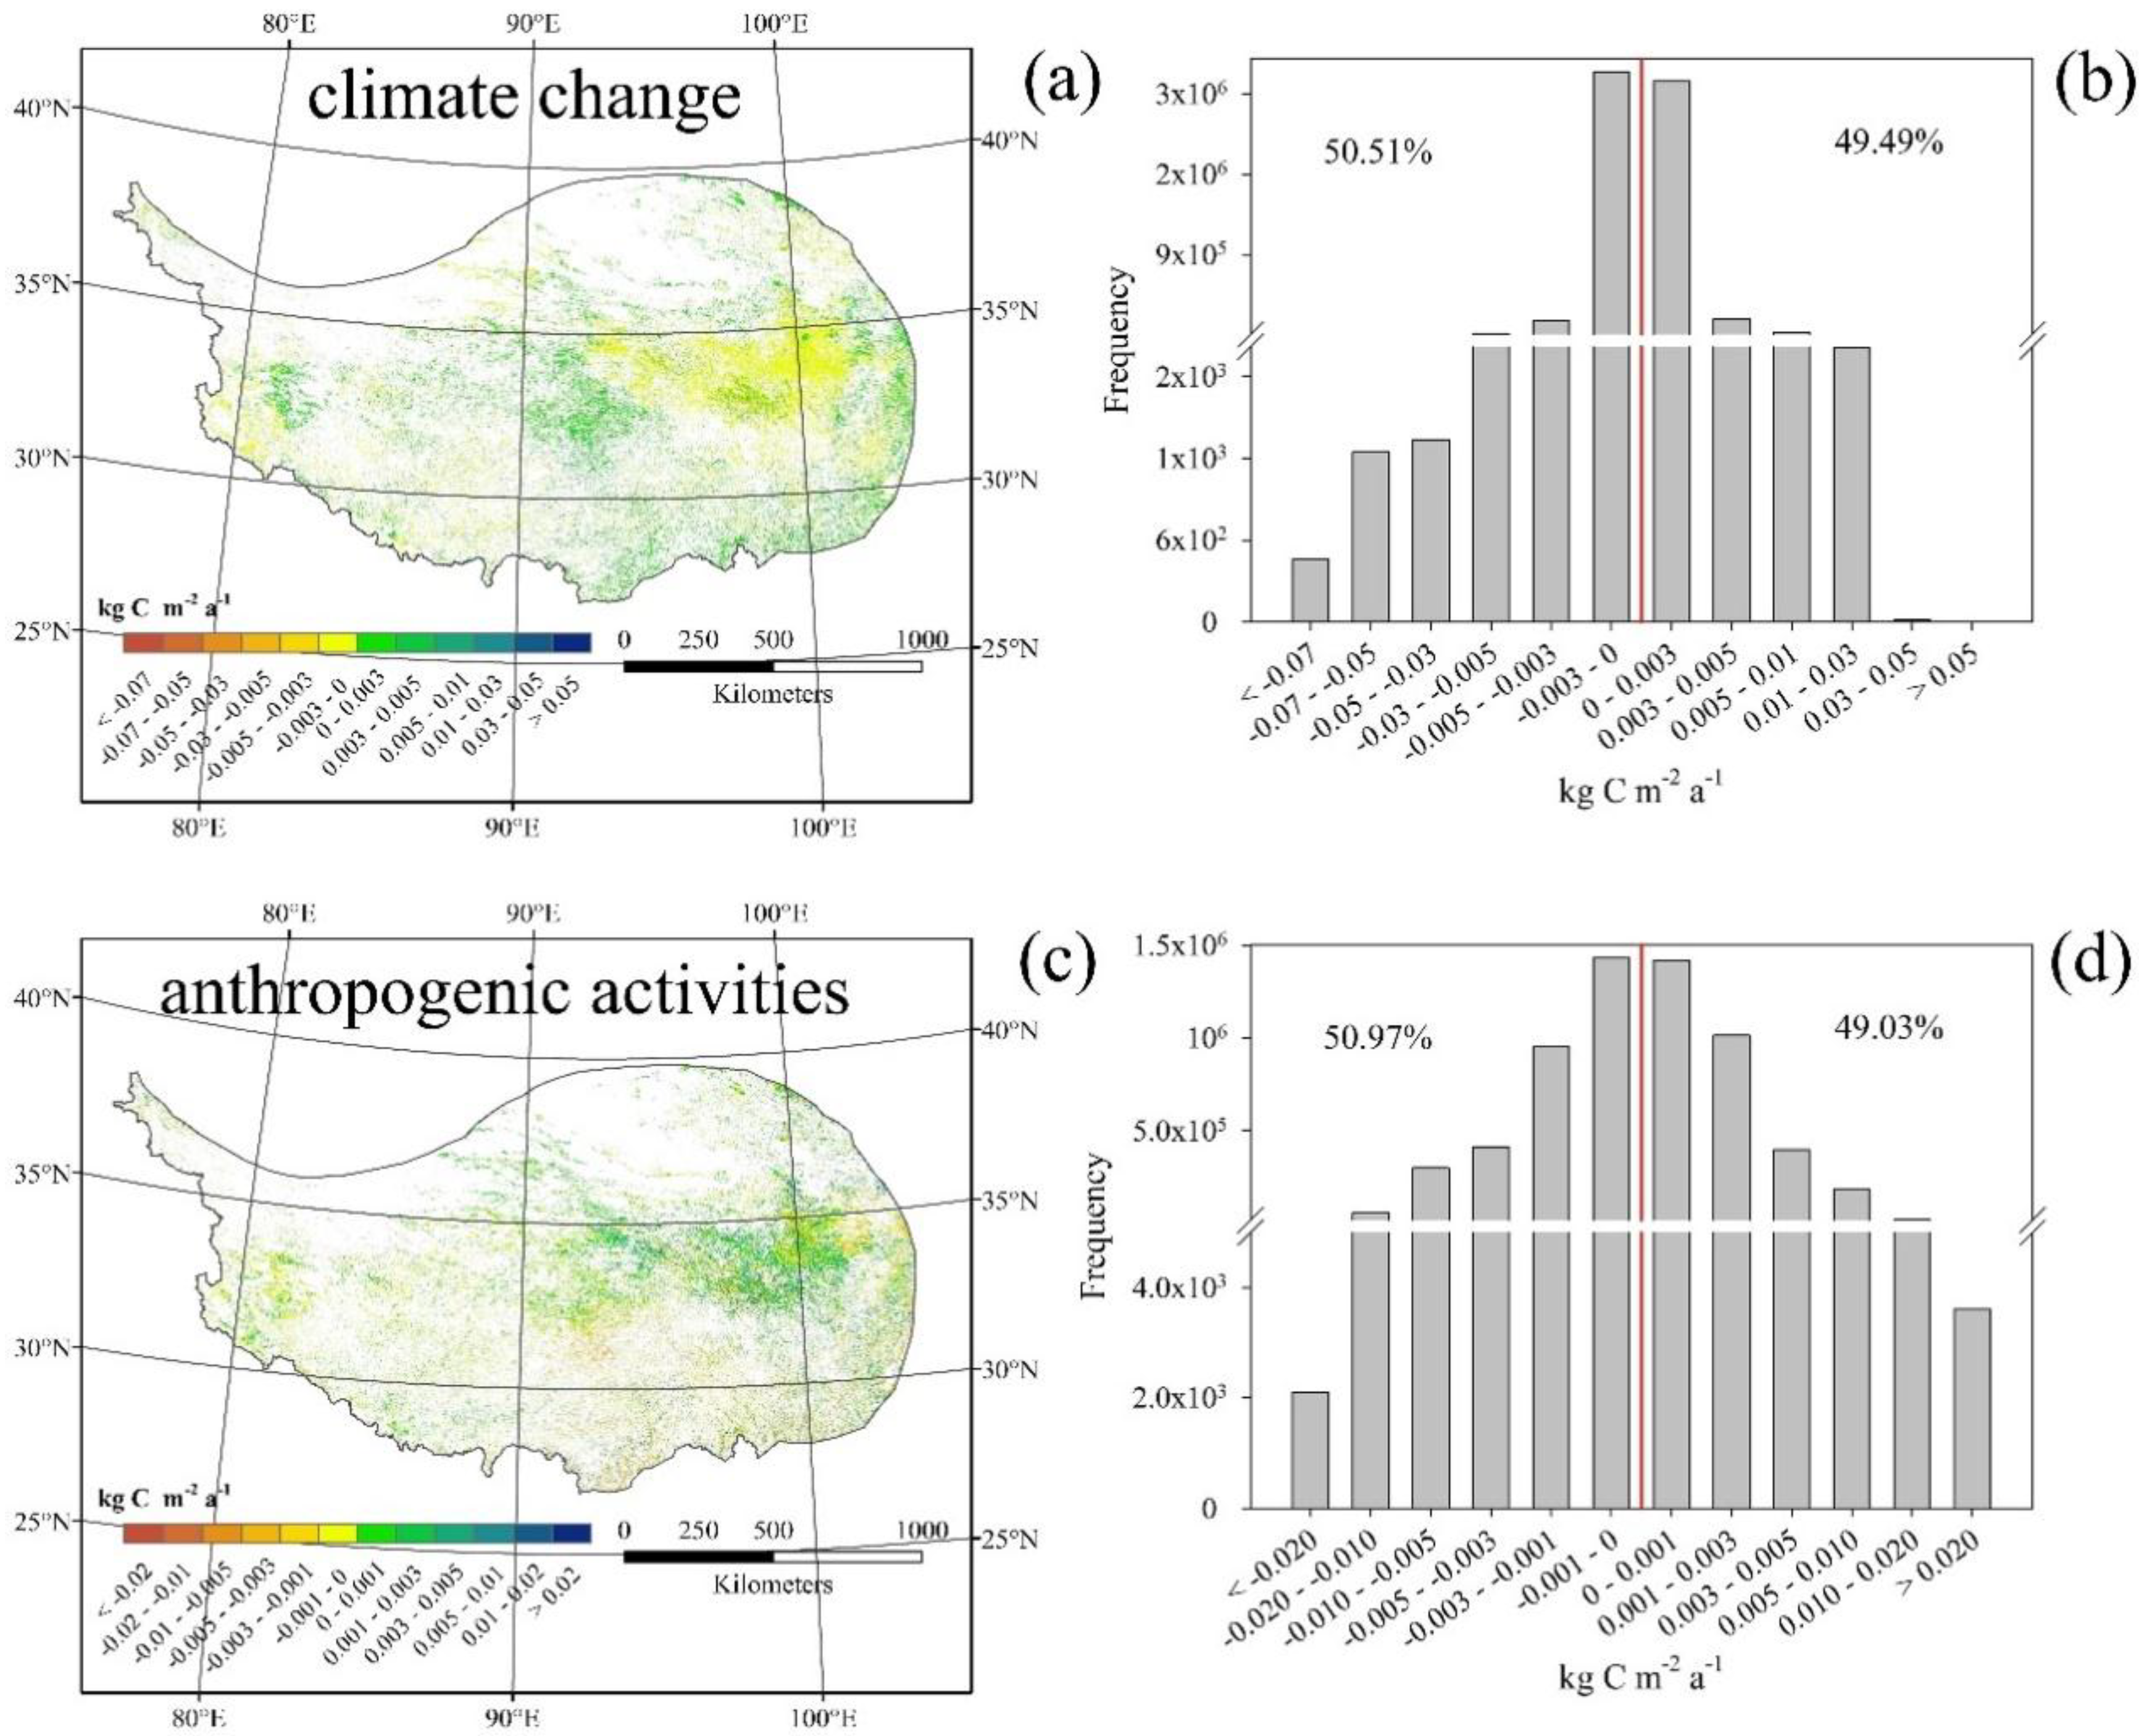
3.5. Comparison of Effects of Climate Change and Anthropogenic Activities on NPP

Figure 6 illustrates the trends of NPP under the isolated impacts of climate change and anthropogenic activities. Over 50.5% of the total pixels showed a decreasing trend for NPP under the isolated effects of climate change or anthropogenic activities. The direction of average trends of NPP under the isolated effects of climate change and anthropogenic activities was consistent, and the average rate of trends under the isolated impact of anthropogenic activities was larger than that of climate change, with an average rate of −0.180 g∙C∙m−2∙a−1 and –0.038 g∙C∙m−2∙a−1, respectively. In addition, the decreasing trend of NPP under the impact of isolated climate change was mostly distributed in the middle and southwest of the Tibetan Plateau, while the decreasing trend of NPP under the impact of isolated anthropogenic activities was mostly in the south and southwest of the plateau.
To identify the effects of different anthropogenic activity types on NPP variation, anthropogenic activities were classified into two types: ecological restoration and ecological destruction. The relationships between NPP trends and the two anthropogenic factors were quantitatively analyzed (Figure 7). Ecological restoration and ecological destruction had significantly positive and negative effects on NPP trend changes, respectively (p < 0.0001). The absolute effect of ecological destruction on NPP trend changes was larger than that of ecological restoration, and the fraction of ecological restoration and ecological destruction increased by 1%; NPP increased by 0.53 kg∙C∙m−2∙a−1 and decreased by 2.11 kg∙C∙m−2∙a−1, respectively.

4. Discussion

4.1. Uncertainties in NPP Simulations

Net primary productivity (NPP) plays a crucial role in carbon sink or source in ecosystems [10]. Therefore, the accuracy of NPP estimation is crucial for reliably quantifying the carbon source or sink potential of ecosystems [65], especially for regions (e.g., the Tibetan Plateau) with a rich diversity in species, climate, and ecological types [9]. The validation of our results indicates that the NPP derived from the modified CASA model was significantly correlated with field observations, and the RMSE and MAE were all lower than those of the original CASA model. This indicates that the modified CASA model was appropriate for calculating grassland NPP in the Tibetan Plateau. However, the modified CASA tended to underestimate high values of NPP. Moreover, the field observations applied in this study were converted from the biomass data due to the difficulties measuring of NPP directly. It should be recognized that this converted NPP data could not represent the true value of NPP fully [66]. Additionally, only 77 field observations were compared, and the field observations in the northwest were scarce due to the high elevation and inaccessibility (Figure S1), which may bias our results somewhat. Furthermore, the validation results may also be affected by pixel resolution heterogeneity and stand density [15]. For instance, a pixel may include several vegetation types (i.e., grass and shrub) and encompass complex surface reflectance in a special resolution of 500 m × 500 m, however, the field observations are usually based on an individual plant. Therefore, the modeled result based on remote sensing cannot precisely correspond with ground-based measurements. Thus, an increased number of field observation sites, longer observation period, high spatial resolution of the image used, and improvement of biomass measurement are necessary to validate simulation results. What is more, the application of forest inventory data and carbon flux data are also preferable for the validation of modeled NPP in the Tibetan Plateau. Moreover, long-time temporal trend analysis comparing a match between simulated NPP and field observations is also a good choice.

4.2. Spatiotemporal Variation of NPP

Generally, the spatial pattern of annual NPP increased from northwest to southeast, and this is consistent with previous studies [11,66]. The result may due to the hydrothermal conditions caused by the climatic gradient from the northwest to the southeast in the Tibetan Plateau [9]. NPP in the northwest of the plateau was mostly lower than 0.042 kg∙C∙m−2, and it may be caused by low temperature and the absence of precipitation due to the high elevation and inland location (Figure S1). In contrast, NPP in the southeast was mostly higher than 0.250 kg∙C∙m−2, which may be due to southwest and southeast monsoons creating favorable climate conditions for vegetation growth. Additionally, the spatial pattern of annual NPP was also affected by vegetation distribution. For instance, in the northwest of the Tibetan Plateau, desert vegetation and sparse woods are widely distributed, while in the southeast, vegetation is predominantly forests (Figure S2), which have higher plant primary productivity than desert vegetation and sparse woods.
The temporal trend of NPP showed spatial heterogeneity in the Tibetan Plateau, and an overall decreasing trend with a mean value of −0.02 × 10⁻² kg∙C∙m−2∙a−1 was found, which is similar to previous findings [3,10]. The reasons for the decreasing NPP include harsh environmental conditions caused by both climate change and anthropogenic activities. For instance, an increasing trend in temperature and a decreasing trend in cumulative precipitation (Figure S7) result in warmer and drier environmental conditions [67] for impending vegetation growth. Additionally, decreased cumulative solar radiation (Figure S7), which inhibits the photosynthesis of vegetation, also contributed to the decreasing NPP. Moreover, deforestation and grassland degradation due to agriculture use, unsustainable logging practices, rodent damage, collection of Chinese herbal medicines, overgrazing, and urbanization [5,68,69] were also responsible for the decreasing NPP. For instance, [68] revealed that forests in the southeast of the Tibetan Plateau have mainly disappeared because of urban and cropland expansion, and [70] showed that severely degraded grassland was observed in the head-water areas of the Three Rivers Source in the plateau. In addition, decreasing NPP was also found around lakes, which may be caused by over-reclamation and overgrazing [36,71]. Additionally, the sandy decertified lands around lake basins may be responsible for this result [72]. An increasing trend of NPP mostly occurred in the central Tibetan Plateau, which is in agreement with [34]. This may contribute to the application of reforestation and ecological restoration [73]. For instance, since the launch of the Returning Farming to Forest project, approximately 20 km2 of a man-made plant community has been preserved in Datong County, Qinghai Province [74].

4.3. Diverse NPP Correlations with Climatic Factors

Previous studies have revealed that climate-related factors are among the most important factors affecting vegetation NPP [15], of which temperature, precipitation, and solar radiation are the three main forces that drive vegetation growth [75]. Generally, mean annual temperature was negatively correlated with NPP for most of the study area, with a mean value of −0.0003 (kg∙C∙m−2∙a−1)/°C, which is in line with [3]. This result may be caused by the increased temperature and decreased precipitation, which result in high evapotranspiration and increased water scarcity. Alternatively, the melting frozen soil caused by increased temperature may destroy the structure of vegetative root systems and hinder growth [34]. However, a positive relationship between NPP and mean annual temperature was found in the east of the Tibetan Plateau. This may have resulted from the enhanced capacity for photosynthesis and increased activity of photosynthetic enzymes [76,77]. The positive relationship between NPP and annual cumulative solar radiation in that area also supports this conclusion. Precipitation generally showed a negative correlation with NPP, with a mean value of −0.254 (g∙C∙m−2∙a−1)/mm, consistent with [11]. This negative relationship was mainly in the southeast and east of the plateau, where the elevation is lower than 5000 m (Figure S1), and agrees with previous studies [5,11]. This may be because forests were predominantly in the east and southeast of the plateau; the southeast and southwest monsoons brought sufficient rainfall for vegetation growth, and the plant can utilize water from both deep and superficial soil profiles. However, more precipitation is usually accompanied by less solar radiation, which inhibits photosynthesis and prevents growth [78]. Additionally, an anaerobic soil condition may be created within the plant root zone by a higher soil moisture content that limits vegetation growth [79]. Alternatively, the content of soil organic matter may have decreased due to enhanced soil erosion caused by increased precipitation, thus reducing NPP [5]. A positive correlation between NPP and annual cumulative solar radiation was found for most pixels throughout the study area. Approximately 68% of the total pixels exhibited a positive relationship between NPP and annual cumulative solar radiation, with a mean sensitivity of 0.037 (g∙C∙m−2∙a−1)/(MJ∙m−2). This may be because sufficient materials and the energy that accompanies solar radiation are supplied for photosynthesis and promote vegetation NPP [21]. However, a negative relationship was found in the middle of the plateau, which concurs with [10]. This may be because abundant solar radiation causes the melting of snow and permafrost soils, creating an anaerobic soil condition due to higher soil moisture content within the plant root zone [79]. Alternatively, increased surface soil evaporation and limited water availability resulting from abundant solar radiation may prevent herbaceous plants with shallow root systems from growing [15].

4.4. Relative Contribution of Climatic Factors and Anthropogenic Activities to NPP

Climate change and anthropogenic activities are the two main factors that affect NPP variation. In terms of climatic factors, approximately 48.57% of the total pixels were regulated by annual cumulative precipitation, and they mainly occurred in the middle of the plateau. This is because precipitation is one of the most important factors affecting vegetation growth in arid and semi-arid areas, especially for grassland with a shallow root system. Additionally, the amount of precipitation in the plateau is usually small and varies extremely in time and space [80]. Moreover, the overall trend of precipitation in the plateau displayed a decreasing trend during the study period (Figures S7 and S8). Both of these reasons make precipitation a dominant climatic factor that regulates vegetation growth in the plateau. The relative contribution of annual cumulative solar radiation accounted for approximately 29% over the study region, and they were mainly distributed in the eastern edge of the plateau. Although solar radiation in the Tibetan Plateau is usually abundant due to less water vapor content, high elevation, and thin clouds [81], an overall decreasing trend of cumulative solar radiation (Figure S7) may also have contributed to the decreasing trend of NPP in the plateau, as it impacts photosynthesis—such as the composition of chlorophyll and carbohydrate, as well as the decomposition of CO2—and then impacts dry matter accumulation. The spatial distribution of annual mean temperature that contributed to NPP variation was lower than that of the other two factors, accounting for approximately 12.56% of the total number of pixels. Usually, temperature in the Tibetan Plateau is low due to the high elevation [82]. However, an overall increasing trend of annual mean temperature (Figures S7 and S8) in the plateau may have mitigated the restriction of low temperature on plant growth. Thus, the percentage of the relative contribution of annual mean temperature to NPP variation was lower than that of the other two climatic factors. Alternatively, this result may also be caused by the life strategy and/or adaptions of plants to local low temperature.
Previous studies showed that the effects of anthropogenic activities on NPP variation are great in the Tibetan Plateau [27,36]. Although our results revealed that both climate change and anthropogenic activities had a negative effect on NPP for most areas, anthropogenic activities had a larger effect than that of climate change, with an average rate of −0.180 g∙C∙m−2∙a−1 and −0.038 g∙C∙m−2∙a−1, respectively. Chen et al. [27] revealed that the impacts of anthropogenic activities on the percentage change of NPP in the Tibetan Plateau increased from 20.16% during 1982–2001 to 42.98% during 2001–2011, concluding that human intervention plays a more important role in regulating the alpine grassland ecosystem. The conclusion was similar to our results that human intervention (reducing the number of livestock, fencing degrading grassland, afforestation) may have a more important role than climate change in regulating NPP variation in the Tibetan Plateau. Therefore, more effort, such as the implementation of grassland protection policies, ecological restoration projects, and ecological compensation in the plateau, should be made in the future. However, we should recognize that the calculation of isolated effects of anthropogenic activities was based on the hypothesis that NPP variation was impacted by climate change and anthropogenic activities, and thus, after removing the climate influence, the human-induced vegetation variation could be identified [62,63]. Additionally, other factors, such as vegetation composition and succession, were ignored. Moreover, the isolated anthropogenic activities did not distinguish the impact of different anthropogenic activity types on NPP variation. Therefore, to identify the impact of different anthropogenic activity types on NPP variation, anthropogenic activities were classified into two types: ecological restoration and ecological destruction. In terms of human intervention, the effects of ecological destruction on NPP trend changes were larger than that of ecological restoration. For instance, 12.18% of the grassland transformed into built-up areas (Figure S9) in the plateau during 2001–2015, which seems to indicate that ecological destruction is responsible for the decreasing trend of NPP. Therefore, compared with the ecological restoration, such as Natural Forest Conservation Program and Grazing Withdrawal Program [73,83], ecological destruction, such as urbanization, unsustainable logging practices, and overgrazing, should be paid more attention in the plateau. Furthermore, more efforts, such as the implementation of grassland protection policies, ecological restoration projects, and ecological compensation in the plateau, should be made in the future to compensate for the negative effects of ecological destruction on decreasing NPP.

4.5. Limitations

Limited meteorological stations, especially for areas with an elevation more than 6 km, were used in this study, and may bias our results on the relationship between climatic factors and NPP. Moreover, numerous factors may affect the variation of vegetation NPP. However, only three climate factors were considered in this study, while other factors, such as CO2 concentration, effective precipitation, soil moisture and temperature, and N enrichment and deposition, were neglected. However, an early study [84] revealed that the impact of CO2 concentrations on grassland was weakest; the explanation only accounted for 0.3% of total NPP, and was obviously slighter than the other climatic factors in terms of carbon storage [85]. In addition, an early study [86] demonstrated that the impact of N deposition on NPP of alpine grass in the Tibetan Plateau was insignificant. Therefore, these climate-related factors have had less of an effect on our conclusion. Additionally, vegetation phenology, vegetation composition and succession, vegetation aging, site fertility, species competition, droughts, wildfires, pests, plant diseases, and the time-lag effect of factors should also be taken into consideration. Furthermore, the limited available data also restricts our understanding of the impacts of different factors on NPP. Although the method we applied in this study to isolate climatic factors and anthropogenic activities has been widely used [61,83,87], the calculation was based on the hypothesis mentioned above. Obviously, it ignores other factors (i.e., vegetation composition and succession) that may affect vegetation growth. Therefore, the method applied in this study cannot effectively assess the impact of anthropogenic activities on NPP variation, and it is urgent and necessary for us to effectively isolate the effects of climatic factors and anthropogenic activities and separately quantify the effects of different anthropogenic activities.

5. Conclusions

In this study, NPP based on the original and modified CASA models was estimated, and the modeled NPP and field observations were compared. In addition, we isolated and quantified the effects of climate change and anthropogenic activities on NPP variation across the Tibetan Plateau. Our results show that the results of the modified CASA model were appropriate, and the model performed better than the original CASA model over the plateau during the period of 2001–2015. The spatial pattern of annual NPP increased from northwest to southeast, and displayed a decreasing trend for most of the study area. The variation of NPP was driven by both climate change and anthropogenic activities. In terms of climate factors, the variation of NPP for most areas was regulated by annual mean temperature and annual cumulative precipitation. Warmer and drier environmental conditions and a decreasing trend of solar radiation may be responsible for the decreasing trend of NPP. Additionally, anthropogenic activities had a negative effect on NPP variation, which was larger than that of climate change. In terms of anthropogenic activities, ecological destruction had a significantly negative effect on the NPP trend, and the absolute value was larger than that of ecological restoration, which had a significantly positive effect on the NPP trend. This indicates that human intervention in grassland protection and restoration in the plateau plays a critical role in mitigating the degeneration of the ecosystem. Therefore, ecological destruction should be paid more attention and ecological restoration should be conducted to mitigate the decreasing trend of NPP in the plateau.

Supplementary Materials

The following are available online at https://www.mdpi.com/2072-4292/10/9/1352/s1, Table S1: Site information of field NPP data used in this study; Figure S1: Map of altitude for the Tibetan Plateau and also field observation sites for NPP on the plateau; Figure S2: Vegetation types across the Tibetan Plateau; Figure S3: Spatial patterns of annual NPP between 2001 and 2015; Figure S4: Frequency distributions of NPP standard deviation in the Tibetan Plateau; Figure S5: Frequency distributions of NPP trends in the Tibetan Plateau; Figure S6: Relative contributions of climate factors on significantly (p < 0.05) decreasing NPP (a) and significantly increasing NPP (b); Figure S7: Climatic factors variation in the Tibetan Plateau from 2001 to 2015; Figure S8: Spatial pattern of mean values of climatic factors and corresponding trends (temperature (a,b), precipitation (c,d), and solar radiation (e,f)) in the Tibetan Plateau between 2001 and 2015; Figure S9: Vegetation types in the Tibetan Plateau in 2001 (a) and 2015 (b).

Author Contributions

H.Z. outlined the research topic, assisted with the manuscript writing, and coordinated the revision activities. Z.L., W.W., and X.Y. performed the data analysis, interpretation of results, manuscript writing, and coordinated the revision activities. Q.S., J.Y., and J.W. performed the data collection and coordinated the revision activities.

Funding

This research was funded by the Central Fund Supporting Nonprofit Scientific Institutes for Basic Research and Development (No. PM-zx421-201803-056).

Acknowledgments

We thank four anonymous reviewers and the editor for their insightful comments that further improved our manuscript.

Conflicts of Interest

The authors declare no conflict of interest.

References

  1. Field, C.B.; Behrenfeld, M.J.; Randerson, J.T.; Falkowski, P. Primary production of the biosphere: Integrating terrestrial and oceanic components. Science 1998, 281, 237–240. [Google Scholar] [CrossRef] [PubMed]
  2. Haberl, H.; Erb, K.H.; Krausmann, F.; Gaube, V.; Bondeau, A.; Plutzar, C.; Gingrich, S.; Lucht, W.; Fischer-Kowalski, M. Quantifying and mapping the human appropriation of net primary production in earth’s terrestrial ecosystems. Proc. Natl. Acad. Sci. USA 2007, 104, 12942–12947. [Google Scholar] [CrossRef] [PubMed]
  3. Gao, Q.; Li, Y.; Wan, Y.; Qin, X.; Jiangcun, W.; Liu, Y. Dynamics of alpine grassland NPP and its response to climate change in Northern Tibet. Clim. Chang. 2009, 97, 515–528. [Google Scholar] [CrossRef]
  4. Yu, D.; Shi, P.; Shao, H.; Zhu, W.; Pan, Y. Modelling net primary productivity of terrestrial ecosystems in East Asia based on an improved CASA ecosystem model. Int. J. Remote Sens. 2009, 30, 4851–4866. [Google Scholar] [CrossRef] [Green Version]
  5. Zhang, Y.; Zhang, C.; Wang, Z.; Chen, Y.; Gang, C.; An, R.; Li, J. Vegetation dynamics and its driving forces from climate change and human activities in the Three-River Source Region, China from 1982 to 2012. Sci. Total Environ. 2016, 563–564, 210–220. [Google Scholar] [CrossRef] [PubMed]
  6. Allen, C.D.; Macalady, A.K.; Chenchouni, H.; Bachelet, D.; McDowell, N.; Vennetier, M.; Kitzberger, T.; Rigling, A.; Breshears, D.D.; Hogg, E.H.; et al. A global overview of drought and heat-induced tree mortality reveals emerging climate change risks for forests. For. Ecol. Manag. 2010, 259, 660–684. [Google Scholar] [CrossRef]
  7. Sisay, K.; Thurnher, C.; Belay, B.; Lindner, G.; Hasenauer, H. Volume and carbon estimates for the forest area of the amhara region in northwestern ethiopia. Forests 2017, 8, 122. [Google Scholar] [CrossRef]
  8. Osmond, B.; Ananyev, G.; Berry, J.; Langdon, C.; Kolber, Z.; Lin, G.; Monson, R.; Nichol, C.; Rascher, U.; Schurr, U.; et al. Changing the way we think about global change research: Scaling up in experimental ecosystem science. Glob. Chang. Biol. 2004, 10, 393–407. [Google Scholar] [CrossRef]
  9. Gao, Q.; Guo, Y.; Xu, H.; Ganjurjav, H.; Li, Y.; Wan, Y.; Qin, X.; Ma, X.; Liu, S. Climate change and its impacts on vegetation distribution and net primary productivity of the alpine ecosystem in the Qinghai-Tibetan Plateau. Sci. Total Environ. 2016, 554–555, 34–41. [Google Scholar] [CrossRef] [PubMed]
  10. Wang, J.; Dong, J.; Yi, Y.; Lu, G.; Oyler, J.; Smith, W.K.; Zhao, M.; Liu, J.; Running, S. Decreasing net primary production due to drought and slight decreases in solar radiation in china from 2000 to 2012. J. Geophys. Res. Biogeosci. 2017, 122, 261–278. [Google Scholar] [CrossRef]
  11. Gao, Y.; Zhou, X.; Wang, Q.; Wang, C.; Zhan, Z.; Chen, L.; Yan, J.; Qu, R. Vegetation net primary productivity and its response to climate change during 2001–2008 in the Tibetan Plateau. Sci. Total Environ. 2013, 444, 356–362. [Google Scholar] [CrossRef] [PubMed]
  12. Baldocchi, D.; Falge, E.; Gu, L.; Olson, R.; Hollinger, D.; Running, S.; Anthoni, P.; Bernhofer, C.; Davis, K.; Evans, R.; et al. Fluxnet: A new tool to study the temporal and spatial variability of ecosystem-scale carbon dioxide, water vapor, and energy flux densities. Bull. Am. Meteorol. Soc. 2001, 82, 2415–2434. [Google Scholar] [CrossRef]
  13. Veroustraete, F.; Sabbe, H.; Eerens, H. Estimation of carbon mass fluxes over Europe using the C-Fix model and Euroflux data. Remote Sens. Environ. 2002, 83, 376–399. [Google Scholar] [CrossRef]
  14. Bao, G.; Bao, Y.; Qin, Z.; Xin, X.; Bao, Y.; Bayarsaikan, S.; Zhou, Y.; Chuntai, B. Modeling net primary productivity of terrestrial ecosystems in the semi-arid climate of the Mongolian Plateau using LSWI-based CASA ecosystem model. Int. J. Appl. Earth Obs. Geoinf. 2016, 46, 84–93. [Google Scholar] [CrossRef]
  15. Yang, J.; Zhang, X.; Luo, Z.; Yu, X. Nonlinear variations of net primary productivity and its relationship with climate and vegetation phenology, China. Forests 2017, 8, 361. [Google Scholar] [CrossRef]
  16. Liu, Y.; Ju, W.; He, H.; Wang, S.; Sun, R.; Zhang, Y. Changes of net primary productivity in China during recent 11 years detected using an ecological model driven by MODIS data. Front. Earth Sci. 2013, 7, 112–127. [Google Scholar] [CrossRef]
  17. Prince, S.D. A model of regional primary production for use with coarse resolution satellite data. Int. J. Remote Sens. 1991, 12, 1313–1330. [Google Scholar] [CrossRef]
  18. Potter, C.S.; Randerson, J.T.; Field, C.B.; Matson, P.A.; Vitousek, P.M.; Mooney, H.A.; Klooster, S.A. Terrestrial ecosystem production: A process model based on global satellite and surface data. Glob. Biogeochem. Cycl. 1993, 7, 811–841. [Google Scholar] [CrossRef]
  19. Rasmus, F.; Inge, S.; Schultz, R.M.; Simon, S.; Alioune, D. Evaluation of satellite based primary production modelling in the semi-arid Sahel. Remote Sens. Environ. 2006, 105, 173–188. [Google Scholar]
  20. Wu, D.; Zhao, X.; Liang, S.; Zhou, T.; Huang, K.; Tang, B.; Zhao, W. Time-lag effects of global vegetation responses to climate change. Glob. Chang. Biol. 2015, 21, 3520–3531. [Google Scholar] [CrossRef] [PubMed]
  21. Piao, S.; Fang, J.; He, J. Variations in vegetation net primary production in the Qinghai-Xizang Plateau, China, from 1982 to 1999. Clim. Chang. 2006, 74, 253–267. [Google Scholar] [CrossRef]
  22. Lindner, M.; Maroschek, M.; Netherer, S.; Kremer, A.; Barbati, A.; Garcia-Gonzalo, J.; Seidl, R.; Delzon, S.; Corona, P.; Kolström, M.; et al. Climate change impacts, adaptive capacity, and vulnerability of European forest ecosystems. For. Ecol. Manag. 2010, 259, 698–709. [Google Scholar] [CrossRef]
  23. Luo, Z.; Tian, D.; Ning, C.; Yan, W.; Xiang, W.; Peng, C. Roles of Koelreuteria bipinnata as a suitable accumulator tree species in remediating Mn, Zn, Pb, and Cd pollution on Mn mining wastelands in southern China. Environ. Earth Sci. 2015, 74, 4549–4559. [Google Scholar] [CrossRef]
  24. Doherty, R.M.; Sitch, S.; Smith, B.; Lewis, S.L.; Thornton, P.K. Implications of future climate and atmospheric CO2 content for regional biogeochemistry, biogeography and ecosystem services across east Africa. Glob. Chang. Biol. 2010, 16, 617–640. [Google Scholar] [CrossRef]
  25. Esser, G. Sensitivity of global carbon pools and fluxes to human and potential climatic impacts. Tellus B Chem. Phys. Meteorol. 1987, 39B, 245–260. [Google Scholar] [CrossRef]
  26. Field, C.B. Sharing the garden. Science 2001, 294, 2490–2491. [Google Scholar] [CrossRef] [PubMed]
  27. Chen, B.; Zhang, X.; Tao, J.; Wu, J.; Wang, J.; Shi, P.; Zhang, Y.; Yu, C. The impact of climate change and anthropogenic activities on alpine grassland over the Qinghai-Tibet Plateau. Agric. For. Meteorol. 2014, 189–190, 11–18. [Google Scholar] [CrossRef]
  28. Liu, X.; Zhang, J.; Zhu, X.; Pan, Y.; Liu, Y.; Zhang, D.; Lin, Z. Spatiotemporal changes in vegetation coverage and its driving factors in the three-river headwaters region during 2000–2011. J. Geogr. Sci. 2014, 24, 288–302. [Google Scholar] [CrossRef]
  29. Yao, T.; Thompson, L.G.; Mosbrugger, V.; Zhang, F.; Ma, Y.; Luo, T.; Xu, B.; Yang, X.; Joswiak, D.R.; Wang, W.; et al. Third pole environment (TPE). Environ. Dev. 2012, 3, 52–64. [Google Scholar] [CrossRef]
  30. Yang, K.; Ye, B.; Zhou, D.; Wu, B.; Foken, T.; Qin, J.; Zhou, Z. Response of hydrological cycle to recent climate changes in the Tibetan Plateau. Clim. Chang. 2011, 109, 517–534. [Google Scholar] [CrossRef]
  31. Li, Q.; Zhang, C.; Shen, Y.; Jia, W.; Li, J. Quantitative assessment of the relative roles of climate change and human activities in desertification processes on the Qinghai-Tibet Plateau based on net primary productivity. CATENA 2016, 147, 789–796. [Google Scholar] [CrossRef]
  32. Jin, H.J.; Yu, Q.-h.; Wang, S.L.; Lü, L.Z. Changes in permafrost environments along the Qinghai–Tibet engineering corridor induced by anthropogenic activities and climate warming. Cold Reg. Sci. Technol. 2008, 53, 317–333. [Google Scholar] [CrossRef]
  33. Moors, E.J.; Groot, A.; Biemans, H.; van Scheltinga, C.T.; Siderius, C.; Stoffel, M.; Huggel, C.; Wiltshire, A.; Mathison, C.; Ridley, J.; et al. Adaptation to changing water resources in the Ganges basin, northern India. Environ. Sci. Policy 2011, 14, 758–769. [Google Scholar] [CrossRef]
  34. Cui, X.; Graf, H.-F. Recent land cover changes on the Tibetan plateau: A review. Clim. Chang. 2009, 94, 47–61. [Google Scholar] [CrossRef]
  35. An, R.; Wang, H.-L.; Feng, X.-Z.; Wu, H.; Wang, Z.; Wang, Y.; Shen, X.-J.; Lu, C.-H.; Quaye-Ballard, J.A.; Chen, Y.-H.; et al. Monitoring rangeland degradation using a novel local NPP scaling based scheme over the “three-river headwaters” region, hinterland of the Qinghai-Tibetan Plateau. Quat. Int. 2017, 444, 97–114. [Google Scholar] [CrossRef]
  36. Harris, R.B. Rangeland degradation on the Qinghai-Tibetan Plateau: A review of the evidence of its magnitude and causes. J. Arid Environ. 2010, 74, 1–12. [Google Scholar] [CrossRef]
  37. Zhang, Y.; Qi, W.; Zhou, C.; Ding, M.; Liu, L.; Gao, J.; Bai, W.; Wang, Z.; Zheng, D. Spatial and temporal variability in the net primary production of alpine grassland on the Tibetan Plateau since 1982. J. Geogr. Sci. 2014, 24, 269–287. [Google Scholar] [CrossRef]
  38. Xu, H.J.; Wang, X.P.; Zhang, X.X. Alpine grasslands response to climatic factors and anthropogenic activities on the Tibetan plateau from 2000 to 2012. Ecol. Eng. 2016, 92, 251–259. [Google Scholar] [CrossRef]
  39. Chen, X.; An, S.; Inouye, D.W.; Schwartz, M.D. Temperature and snowfall trigger alpine vegetation green-up on the world’s roof. Glob. Chang. Biol. 2015, 21, 3635–3646. [Google Scholar] [CrossRef] [PubMed]
  40. Wu, S.; Yin, Y.; Zheng, D.; Yang, Q. Climatic trends over the Tibetan plateau during 1971–2000. J. Geogr. Sci. 2007, 17, 141–151. [Google Scholar] [CrossRef]
  41. Cao, R.; Shen, M.; Zhou, J.; Chen, J. Modeling vegetation green-up dates across the Tibetan plateau by including both seasonal and daily temperature and precipitation. Agric. For. Meteorol. 2018, 249, 176–186. [Google Scholar] [CrossRef]
  42. Holben, B.N. Characteristics of maximum-value composite images from temporal AVHRR data. Int. J. Remote Sens. 1986, 7, 1417–1434. [Google Scholar] [CrossRef] [Green Version]
  43. Luo, Z.; Yu, S. Spatiotemporal variability of land surface phenology in China from 2001–2014. Remote Sens. 2017, 9, 65. [Google Scholar] [CrossRef]
  44. Li, X.; Cheng, G.; Lu, L. Spatial analysis of air temperature in the Qinghai-Tibet Plateau. Arct. Antarct. Alp. Res. 2005, 37, 246–252. [Google Scholar] [CrossRef]
  45. Dash, J.; Jeganathan, C.; Atkinson, P.M. The use of MERIS Terrestrial Chlorophyll index to study spatio-temporal variation in vegetation phenology over India. Remote Sens. Environ. 2010, 114, 1388–1402. [Google Scholar] [CrossRef]
  46. Resource and Environment Date Cloud Platform. Available online: http://www.Resdc.Cn (accessed on 15 July 2018).
  47. Pan, T.; Zou, X.; Liu, Y.; Wu, S.; He, G. Contributions of climatic and non-climatic drivers to grassland variations on the Tibetan Plateau. Ecol. Eng. 2017, 108, 307–317. [Google Scholar] [CrossRef]
  48. Zhu, W.; Pan, Y.; He, H.; Yu, D.; Hu, H. Simulation of maximum light use efficiency for some typical vegetation types in china. Chin. Sci. Bull. 2006, 51, 457–463. [Google Scholar] [CrossRef]
  49. Piao, S.; Fang, J.; Zhou, L.; Zhu, B.; Tan, K.; Tao, S. Changes in vegetation net primary productivity from 1982 to 1999 in China. Glob. Biogeochem. Cycl. 2005, 19, GB2027. [Google Scholar] [CrossRef]
  50. Xiao, X.; Hollinger, D.; Aber, J.; Goltz, M.; Davidson, E.A.; Zhang, Q.; Moore, B. Satellite-based modeling of gross primary production in an evergreen needleleaf forest. Remote Sens. Environ. 2004, 89, 519–534. [Google Scholar] [CrossRef]
  51. Gill, R.A.; Kelly, R.H.; Parton, W.J.; Day, K.A.; Jackson, R.B.; Morgan, J.A.; Scurlock, J.M.O.; Tieszen, L.L.; Castle, J.V.; Ojima, D.S.; et al. Using simple environmental variables to estimate below-ground productivity in grasslands. Glob. Ecol. Biogeogr. 2002, 11, 79–86. [Google Scholar] [CrossRef]
  52. Scurlock, J.M.O.; Cramer, W.; Olson, R.J.; Parton, W.J.; Prince, S.D. Terrestrial NPP: Toward a consistent data set forglobal model evaluation. Ecol. Appl. 1999, 9, 913–919. [Google Scholar] [CrossRef]
  53. Piao, S.; Fang, J.; Zhou, L.; Tan, K.; Tao, S. Changes in biomass carbon stocks in China’s grasslands between 1982 and 1999. Glob. Biogeochem. Cycl. 2007, 21. [Google Scholar] [CrossRef]
  54. Rahman, A.F.; Sims, D.A.; Cordova, V.D.; El-Masri, B.Z. Potential of MODIS EVI and surface temperature for directly estimating per-pixel ecosystem C fluxes. Geophys. Res. Lett. 2005, 3. [Google Scholar] [CrossRef]
  55. Neeti, N.; Eastman, J.R. A contextual Mann-Kendall approach for the assessment of trend significance in image time series. Trans. GIS 2011, 15, 599–611. [Google Scholar] [CrossRef]
  56. Zhou, J.; Cai, W.; Qin, Y.; Lai, L.; Guan, T.; Zhang, X.; Jiang, L.; Du, H.; Yang, D.; Cong, Z.; et al. Alpine vegetation phenology dynamic over 16years and its covariation with climate in a semi-arid region of china. Sci. Total Environ. 2016, 572, 119–128. [Google Scholar] [CrossRef] [PubMed]
  57. Gocic, M.; Trajkovic, S. Analysis of changes in meteorological variables using Mann-Kendall and Sen’s slope estimator statistical tests in Serbia. Glob. Planet. Chang. 2013, 100, 172–182. [Google Scholar] [CrossRef]
  58. Luedeling, E.; Gassner, A. Partial least squares regression for analyzing walnut phenology in California. Agric. For. Meteorol. 2012, 158–159, 43–52. [Google Scholar] [CrossRef]
  59. Engelen, S.; Hubert, M. Fast model selection for robust calibration methods. Anal. Chim. Acta 2005, 544, 219–228. [Google Scholar] [CrossRef]
  60. Verón, S.R.; de Abelleyra, D.; Lobell, D.B. Impacts of precipitation and temperature on crop yields in the pampas. Clim. Chang. 2015, 130, 235–245. [Google Scholar] [CrossRef]
  61. Liu, Y.; Chen, Q.; Ge, Q.; Dai, J.; Qin, Y.; Dai, L.; Zou, X.; Chen, J. Modelling the impacts of climate change and crop management on phenological trends of spring and winter wheat in China. Agric. For. Meteorol. 2018, 248, 518–526. [Google Scholar] [CrossRef]
  62. Herrmann, S.M.; Anyamba, A.; Tucker, C.J. Recent trends in vegetation dynamics in the african sahel and their relationship to climate. Glob. Environ. Chang. 2005, 15, 394–404. [Google Scholar] [CrossRef]
  63. Wessels, K.J.; Prince, S.D.; Malherbe, J.; Small, J.; Frost, P.E.; VanZyl, D. Can human-induced land degradation be distinguished from the effects of rainfall variability? A case study in south Africa. J. Arid Environ. 2007, 68, 271–297. [Google Scholar] [CrossRef]
  64. Wen, Z.; Wu, S.; Chen, J.; Lü, M. NDVI indicated long-term interannual changes in vegetation activities and their responses to climatic and anthropogenic factors in the Three Gorges Reservoir Region, China. Sci. Total Environ. 2017, 574, 947–959. [Google Scholar] [CrossRef] [PubMed]
  65. Zhao, M.; Running, S.W. Drought-induced reduction in global terrestrial net primary production from 2000 through 2009. Science 2010, 329, 940–943. [Google Scholar] [CrossRef] [PubMed]
  66. Zhang, Y.; Song, C.; Zhang, K.; Cheng, X.; Band, L.E.; Zhang, Q. Effects of land use/land cover and climate changes on terrestrial net primary productivity in the Yangtze River Basin, China, from 2001 to 2010. J. Geophys. Res. Biogeosci. 2014, 119, 1092–1109. [Google Scholar] [CrossRef] [Green Version]
  67. Cui, X.; Graf, H.-F.; Langmann, B.; Chen, W.; Huang, R. Climate impacts of anthropogenic land use changes on the Tibetan Plateau. Glob. Planet. Chang. 2006, 54, 33–56. [Google Scholar] [CrossRef] [Green Version]
  68. Houghton, R.A.; Hackler, J.L. Sources and sinks of carbon from land-use change in China. Glob. Biogeochem. Cycl. 2003, 17, 1034. [Google Scholar] [CrossRef]
  69. Liu, J.; Tian, H.; Liu, M.; Zhuang, D.; Melillo, J.M.; Zhang, Z. China’s changing landscape during the 1990s: Large-scale land transformations estimated with satellite data. Geophys. Res. Lett. 2005, 32, L02405. [Google Scholar] [CrossRef]
  70. Shang, Z.; Long, R. Formation causes and recovery of the “black soil type” degraded alpine grassland in Qinghai-Tibetan Plateau. Front. Agric. Chin. 2007, 1, 197–202. [Google Scholar] [CrossRef]
  71. Pan, Y.; Yu, C.; Zhang, X.; Chen, B.; Wu, J.; Tu, Y.; Miao, Y.; Luo, L. A modified framework for the regional assessment of climate and human impacts on net primary productivity. Ecol. Indic. 2016, 60, 184–191. [Google Scholar] [CrossRef] [Green Version]
  72. Liu, Y.H.; Dong, G.R.; Li, S.; Dong, Y.X. Status, causes and combating suggestions of sandy desertification in Qinghai-Tibet Plateau. Chin. Geogr. Sci. 2005, 15, 289–296. [Google Scholar] [CrossRef]
  73. Zhang, P.; Shao, G.; Zhao, G.; Le Master, D.C.; Parker, G.R.; Dunning, J.B.; Li, Q. China’s forest policy for the 21st century. Science 2000, 288, 2135–2136. [Google Scholar] [CrossRef] [PubMed]
  74. Yin, J.; Liu, C.; Zhao, W.; He, K. Tree productivity and water potential productivity in returning farmland to forest project in Datong county, Qinghai province. For. Stud. Chin. 2004, 6, 36–42. [Google Scholar] [CrossRef]
  75. Richardson, A.D.; Keenan, T.F.; Migliavacca, M.; Ryu, Y.; Sonnentag, O.; Toomey, M. Climate change, phenology, and phenological control of vegetation feedbacks to the climate system. Agric. For. Meteorol. 2013, 169, 156–173. [Google Scholar] [CrossRef]
  76. Shi, C.; Sun, G.; Zhang, H.; Xiao, B.; Ze, B.; Zhang, N.; Wu, N. Effects of warming on chlorophyll degradation and carbohydrate accumulation of alpine herbaceous species during plant senescence on the Tibetan Plateau. PLoS ONE 2014, 9, e107874. [Google Scholar] [CrossRef] [PubMed]
  77. Liu, Q.; Fu, Y.H.; Zhu, Z.; Liu, Y.; Liu, Z.; Huang, M.; Janssens, I.A.; Piao, S. Delayed autumn phenology in the northern hemisphere is related to change in both climate and spring phenology. Glob. Chang. Biol. 2016, 22, 3702–3711. [Google Scholar] [CrossRef] [PubMed]
  78. Mao, D.; Wang, Z.; Luo, L.; Ren, C. Integrating AVHRR and MODIS data to monitor NDVI changes and their relationships with climatic parameters in northeast China. Int. J. Appl. Earth Obs. Geoinf. 2012, 18, 528–536. [Google Scholar] [CrossRef]
  79. Yang, Y.; Guan, H.; Shen, M.; Liang, W.; Jiang, L. Changes in autumn vegetation dormancy onset date and the climate controls across temperate ecosystems in China from 1982 to 2010. Glob. Chang. Biol. 2015, 21, 652–665. [Google Scholar] [CrossRef] [PubMed]
  80. Ueno, K.; Fujii, H.; Yamada, H.; Liu, L. Weak and frequent monsoon precipitation over the Tibetan Plateau. J. Meteorol. Soc. Jpn. 2001, 79, 419–434. [Google Scholar] [CrossRef]
  81. Wang, Q.; Qiu, H.N. Situation and outlook of solar energy utilization in Tibet, China. Renew. Sustain. Energy Rev. 2009, 13, 2181–2186. [Google Scholar] [CrossRef]
  82. Shen, M.; Tang, Y.; Chen, J.; Zhu, X.; Zheng, Y. Influences of temperature and precipitation before the growing season on spring phenology in grasslands of the central and eastern Qinghai-Tibetan Plateau. Agri. For. Meteorol. 2011, 151, 1711–1722. [Google Scholar] [CrossRef]
  83. Cai, H.; Yang, X.; Xu, X. Human-induced grassland degradation/restoration in the central Tibetan Plateau: The effects of ecological protection and restoration projects. Ecol. Eng. 2015, 83, 112–119. [Google Scholar] [CrossRef] [Green Version]
  84. Mu, Q.; Zhao, M.; Running, S.W.; Liu, M.; Tian, H. Contribution of increasing CO2 and climate change to the carbon cycle in china’s ecosystems. J. Geophys. Res. Biogeosci. 2008, 113. [Google Scholar] [CrossRef]
  85. Sui, X.; Zhou, G.; Zhuang, Q. Sensitivity of carbon budget to historical climate variability and atmospheric CO2 concentration in temperate grassland ecosystems in china. Clim. Chang. 2013, 117, 259–272. [Google Scholar] [CrossRef]
  86. Lv, L.Y. Effects of Atmospheric Nitrogen Deposition on the Carbon Cycle in the Haibei Alpine Meadow Ecosystem. Master’s Thesis, Shenyang Agricultural University, Shengyang, China, 2016. [Google Scholar]
  87. Li, A.; Wu, J.; Huang, J. Distinguishing between human-induced and climate-driven vegetation changes: A critical application of RESTREND in inner Mongolia. Landsc. Ecol. 2012, 27, 969–982. [Google Scholar] [CrossRef]
Figure 1. Validation of net primary productivity (NPP) of field measurements, and NPP estimated from (a) the original Carnegie–Ames–Stanford Approach (CASA) model, as well as (b) the modified CASA model, between 2001 and 2015. Note that the 95% confidence intervals of slopes for the CASA model and modified CASA model ranges from 0.90 to 1.53 and between 0.69 and 1.12, respectively.
Remotesensing 10 01352 g001
Figure 2. (a) Spatial patterns of mean NPP and (b) standard deviation in the Tibetan Plateau between 2001 and 2015.
Remotesensing 10 01352 g002
Figure 3. (a) Trends in annual NPP within the Tibetan Plateau between 2001 and 2015, where negative values indicate a decreasing trend of NPP, and vice versa; and (b) very significant (p < 0.01) and significant (p < 0.05) trends for NPP variation. DS, decreased significantly; DVS, decreased very significantly; IS, increased significantly; IVS increased very significantly. Values in parentheses show the percentage of significant pixels at p < 0.05.
Remotesensing 10 01352 g003
Figure 4. Spatial distribution of sensitivity of NPP to (a,d) temperature, (b,e) total precipitation, and (c,f) total solar radiation, with corresponding frequency distributions. Note that only pixels with both the regression model and their corresponding coefficients that were significant simultaneously are shown. Tem, Pre, and Rad represent mean temperature, cumulative precipitation, and cumulative solar radiation, respectively.
Remotesensing 10 01352 g004
Figure 5. Relative impacts of climate factors on NPP. Tem, temperature; Pre, precipitation; Rad, solar radiation. Only pixels with significant (p < 0.05) sensitivity are displayed.
Remotesensing 10 01352 g005
Figure 6. Trends of NPP under the isolated impact of (a) climate change and (b) anthropogenic activities; (c,d) show the corresponding frequency distributions of impacts of climate change and human activities, respectively.
Remotesensing 10 01352 g006
Figure 7. Effects of anthropogenic activities on NPP trends: (a) the percentage of ecological restoration; and (b) the percentage of ecological destruction.
Remotesensing 10 01352 g007

