Article

Mapping and Classification of Ecologically Sensitive Marine Habitats Using Unmanned Aerial Vehicle (UAV) Imagery and Object-Based Image Analysis (OBIA)

by
Daniele Ventura
1,*,
Andrea Bonifazi
2,
Maria Flavia Gravina
2,
Andrea Belluscio
1 and
Giandomenico Ardizzone
1
1
Department of Environmental Biology, University of Rome “La Sapienza”, V. le dell’Università 32, 00185 Rome, Italy
2
Laboratory of Experimental Ecology and Aquaculture, University of Rome “Tor Vergata”, Via della Ricerca Scientifica, 00133 Rome, Italy
*
Author to whom correspondence should be addressed.
Remote Sens. 2018, 10(9), 1331; https://doi.org/10.3390/rs10091331
Submission received: 13 June 2018 / Revised: 16 August 2018 / Accepted: 20 August 2018 / Published: 21 August 2018

Abstract

:
Nowadays, emerging technologies, such as long-range transmitters, increasingly miniaturized components for positioning, and enhanced imaging sensors, have led to an upsurge in the availability of new ecological applications for remote sensing based on unmanned aerial vehicles (UAVs), sometimes referred to as “drones”. In fact, structure-from-motion (SfM) photogrammetry coupled with imagery acquired by UAVs offers a rapid and inexpensive tool to produce high-resolution orthomosaics, giving ecologists a new way for responsive, timely, and cost-effective monitoring of ecological processes. Here, we adopted a lightweight quadcopter as an aerial survey tool and object-based image analysis (OBIA) workflow to demonstrate the strength of such methods in producing very high spatial resolution maps of sensitive marine habitats. Therefore, three different coastal environments were mapped using the autonomous flight capability of a lightweight UAV equipped with a fully stabilized consumer-grade RGB digital camera. In particular we investigated a Posidonia oceanica seagrass meadow, a rocky coast with nurseries for juvenile fish, and two sandy areas showing biogenic reefs of Sabelleria alveolata. We adopted, for the first time, UAV-based raster thematic maps of these key coastal habitats, produced after OBIA classification, as a new method for fine-scale, low-cost, and time saving characterization of sensitive marine environments which may lead to a more effective and efficient monitoring and management of natural resources.

1. Introduction

1.1. General Overview and Aims of the Work

Over the past decade, there has been a growing interest in the use of small unmanned aerial systems or vehicles (UAS/UAVs), as new tools for remote sensing. In fact, they have been widely employed to assess landscape changes in a rapid and cost-effective manner. Nowadays, UAV-based imagery has become one of the most used methods for mapping vast surfaces [1,2,3], remote or inaccessible areas [4,5], agriculture/crop fields [6,7], geological discontinuities [8], and for monitoring wildlife [9,10,11], forests dynamics [12], rangelands [13], and impacted sites [14,15]. Conventional satellite sensors can provide regional- to global-scale observations and repeat time-series sampling. However, satellite-based imagery shows some disadvantages, such as their reliance on weather conditions (i.e., cloud contamination), high cost per scene, the revisit period (e.g., 18 days for Landsat), and the scale of many ecological processes. However, it should be noted that recent advances in remote sensing sensors are overcoming these limitations. In fact, clouds are not relevant for synthetic aperture radar (SAR) [16] and the SENTINEL-1 constellation provides high reliability, improved revisit time (12 days), geographical coverage (up to 400 km in extra wide swath mode) with high geometric (typically 20 m Level-1 product resolution) and radiometric resolutions, suitable for most applications aimed at supporting operational applications in the priority areas of marine monitoring, land monitoring, and emergency services [17,18]. Although the spatial resolution of satellite imagery has significantly improved in the last decade, the data collected is still not sufficient for medium to small coastal dynamics. Airborne-based data obtained from imaging sensors on board civilian aircraft platforms may also be used; these can provide data for fine-scale ecological studies [19]. Airborne photography data also reveal some operational constraints due to flight altitude and speed, expensive data acquisition, and well-trained personnel. All these aspects can affect the possibility to use such methods, especially when low-cost and time-saving aerial data are required.
As technological developments rapidly advance the versatility and functionality of affordable UAVs, their potential as aerial survey tools is quickly gaining attention both for recreational and professional uses [20], opening new possibilities for remote sensing applications using commercial off-the-shelf instrumentation. In addition, the use of consumer-grade digital cameras for field operations has generated a promising research avenue regarding the development of very high-resolution digital elevation models (DEMs) and automated approaches for very high spatial resolution imagery classification. Therefore, structure-from-motion (SfM), multiview-stereo (MVS) algorithms, and object-based image analysis (OBIA) are becoming the methods generally proposed when consumer-grade cameras are used on board the recent UAVs [21]. As a result, UAV technology can address tasks otherwise poorly suited for light detection and ranging (LiDAR) systems and rigorous ortho-photogrammetric airborne campaigns by filling some gaps regarding both the application costs and spatial resolution.
Although widely used and recognized in the scientific community as new tools capable of provide unprecedented scientific applications in the most diverse fields of science [19], further evaluations regarding the utility of small UAVs are required in the field of marine ecology. Whilst in the marine fauna context, some studies have suggested that UAVs may provide better sampling efficiency and data quality in place of manned aircraft [20], there are currently no published studies aimed at demonstrating their potential as a marine aerial survey tool for monitoring benthic-sensitive habitats along Mediterranean coasts.
For this reason, in this work, we illustrate through case studies the great potential of a small UAV coupled with SfM photogrammetry in delivering very high spatial resolution maps usable for the identification and characterization of three sensitive coastal marine habitats: Posidonia oceanica (P. oceanica) meadows, juvenile sparid fishes nursery grounds, and Sabellaria alveolata (S. alveolata) biogenic reefs. In addition, we evaluate the suitability of georeferenced orthomosaics and the accuracy of OBIA in detecting and classifying coastal features of these specific habitats. We show that, with some limitations essentially due to optical refractive distortion effects created by the water surface, SfM techniques applied to aerial imagery obtained with a consumer-grade drone can be used for high-resolution mapping of sensitive marine habitats in temperate environments.

1.2. Background

Low-cost aerial platforms have been used in a broad range of ecological research projects in the field of environmental sciences such as: assessment of vegetation dynamics and forests biodiversity [22,23,24], wildlife research and management [25,26], river habitat mapping [27,28], and ecosystem processes [29]. These research projects dealing with remote sensing data, derived from low-altitude aerial photography, have been successfully classified through the OBIA approach because of its suitability for very high spatial resolution imagery (<10 cm/pixels), the ability to delineate ecologically meaningful image objects, and to derive spectral, spatial, and contextual features from these objects [30,31,32]. However, only few studies [33,34,35] have evaluated the accuracy of OBIA methods in classifying UAV-based remotely-sensed data of shallow marine environments. Pixel-based remote sensing classifiers (e.g., supervised classifiers) using spectral information are used with medium- and low-resolution imagery and are often unsuitable for classifying very high spatial resolution data. In fact, as spatial resolution becomes finer, variance in observed spectral values within landcover classes increases making spectral separation between them more difficult, resulting in a lower overall classification accuracy [36]. Object-based image analysis methods differ from traditional pixel-based classification methods (i.e., maximum likelihood classifiers) because these techniques group similar, neighboring pixels into distinct image objects within designated parameters [37]. A typical OBIA workflow involves firstly image segmentation (sequence of processes that are executed in a defined order including segmentation parameters that create meaningful objects made up of multiple neighbouring pixels sharing similar spectral values) and secondly classification of the segmented data. The application of such methodology aimed at classifying also underwater cover classes may become an important tool along shallow coastal environments because it could detect in a rapid, accurate and cost-effective way the health status as well as the impacts acting on these habitats. In fact, coastal habitats are typically the most affected by human activities [38] and therefore require specific measures for their monitoring and protection. For instance, P. oceanica (Linnaeus) Delile meadows are experiencing a steep decline throughout the Mediterranean Sea due to anthropogenic disturbances such as illegal trawling, fish farming, construction of marinas, and mechanical damage caused by boat anchoring or moorings [39,40,41]. Likewise, juvenile sparid fish (Diplodus several species, spp.) nursery grounds are key marine habitats that should be protected because their availability can affect the distribution and abundance of juvenile fishes and, therefore, determining the renewal of populations and the structure of adult assemblages [42]. In addition, these species are an important fishery resource being widely exploited by artisanal and recreational fisheries [42]. Similarly, along shallow sandy environments the bioconstructor polychaete worm Sabellaria alveolata (Linnaeus) is an engineer species capable of modifying the coastal geomorphology by providing new hard substrates for the settlement of sessile and vagile species [43]. Due to its great vulnerability to anthropogenic disturbance (pollution, beach nourishment, trampling) Sabellaria reefs are included in the European Red List of Habitats [44] and are also listed under Annex I of the European Commission (EC) Habitats Directive (Council Directive EEC/92/43) as a marine habitat to be protected by the designation of ‘Special Areas of Conservation’. Recent studies carried out in the Bay of Mont-Saint-Michel [45] and Northwest Portugal [46] have demonstrated that a combination of several factors such as trophic competition with suspension-feeders, modification in the hydrodynamics and consequently in sedimentary patterns and an increase in reef trampling, can explain rapid reef deterioration. The degradation of such habitats could not only adversely affect the whole coastal biota, but it could also have strong socio-economic implications.

2. Materials and Methods
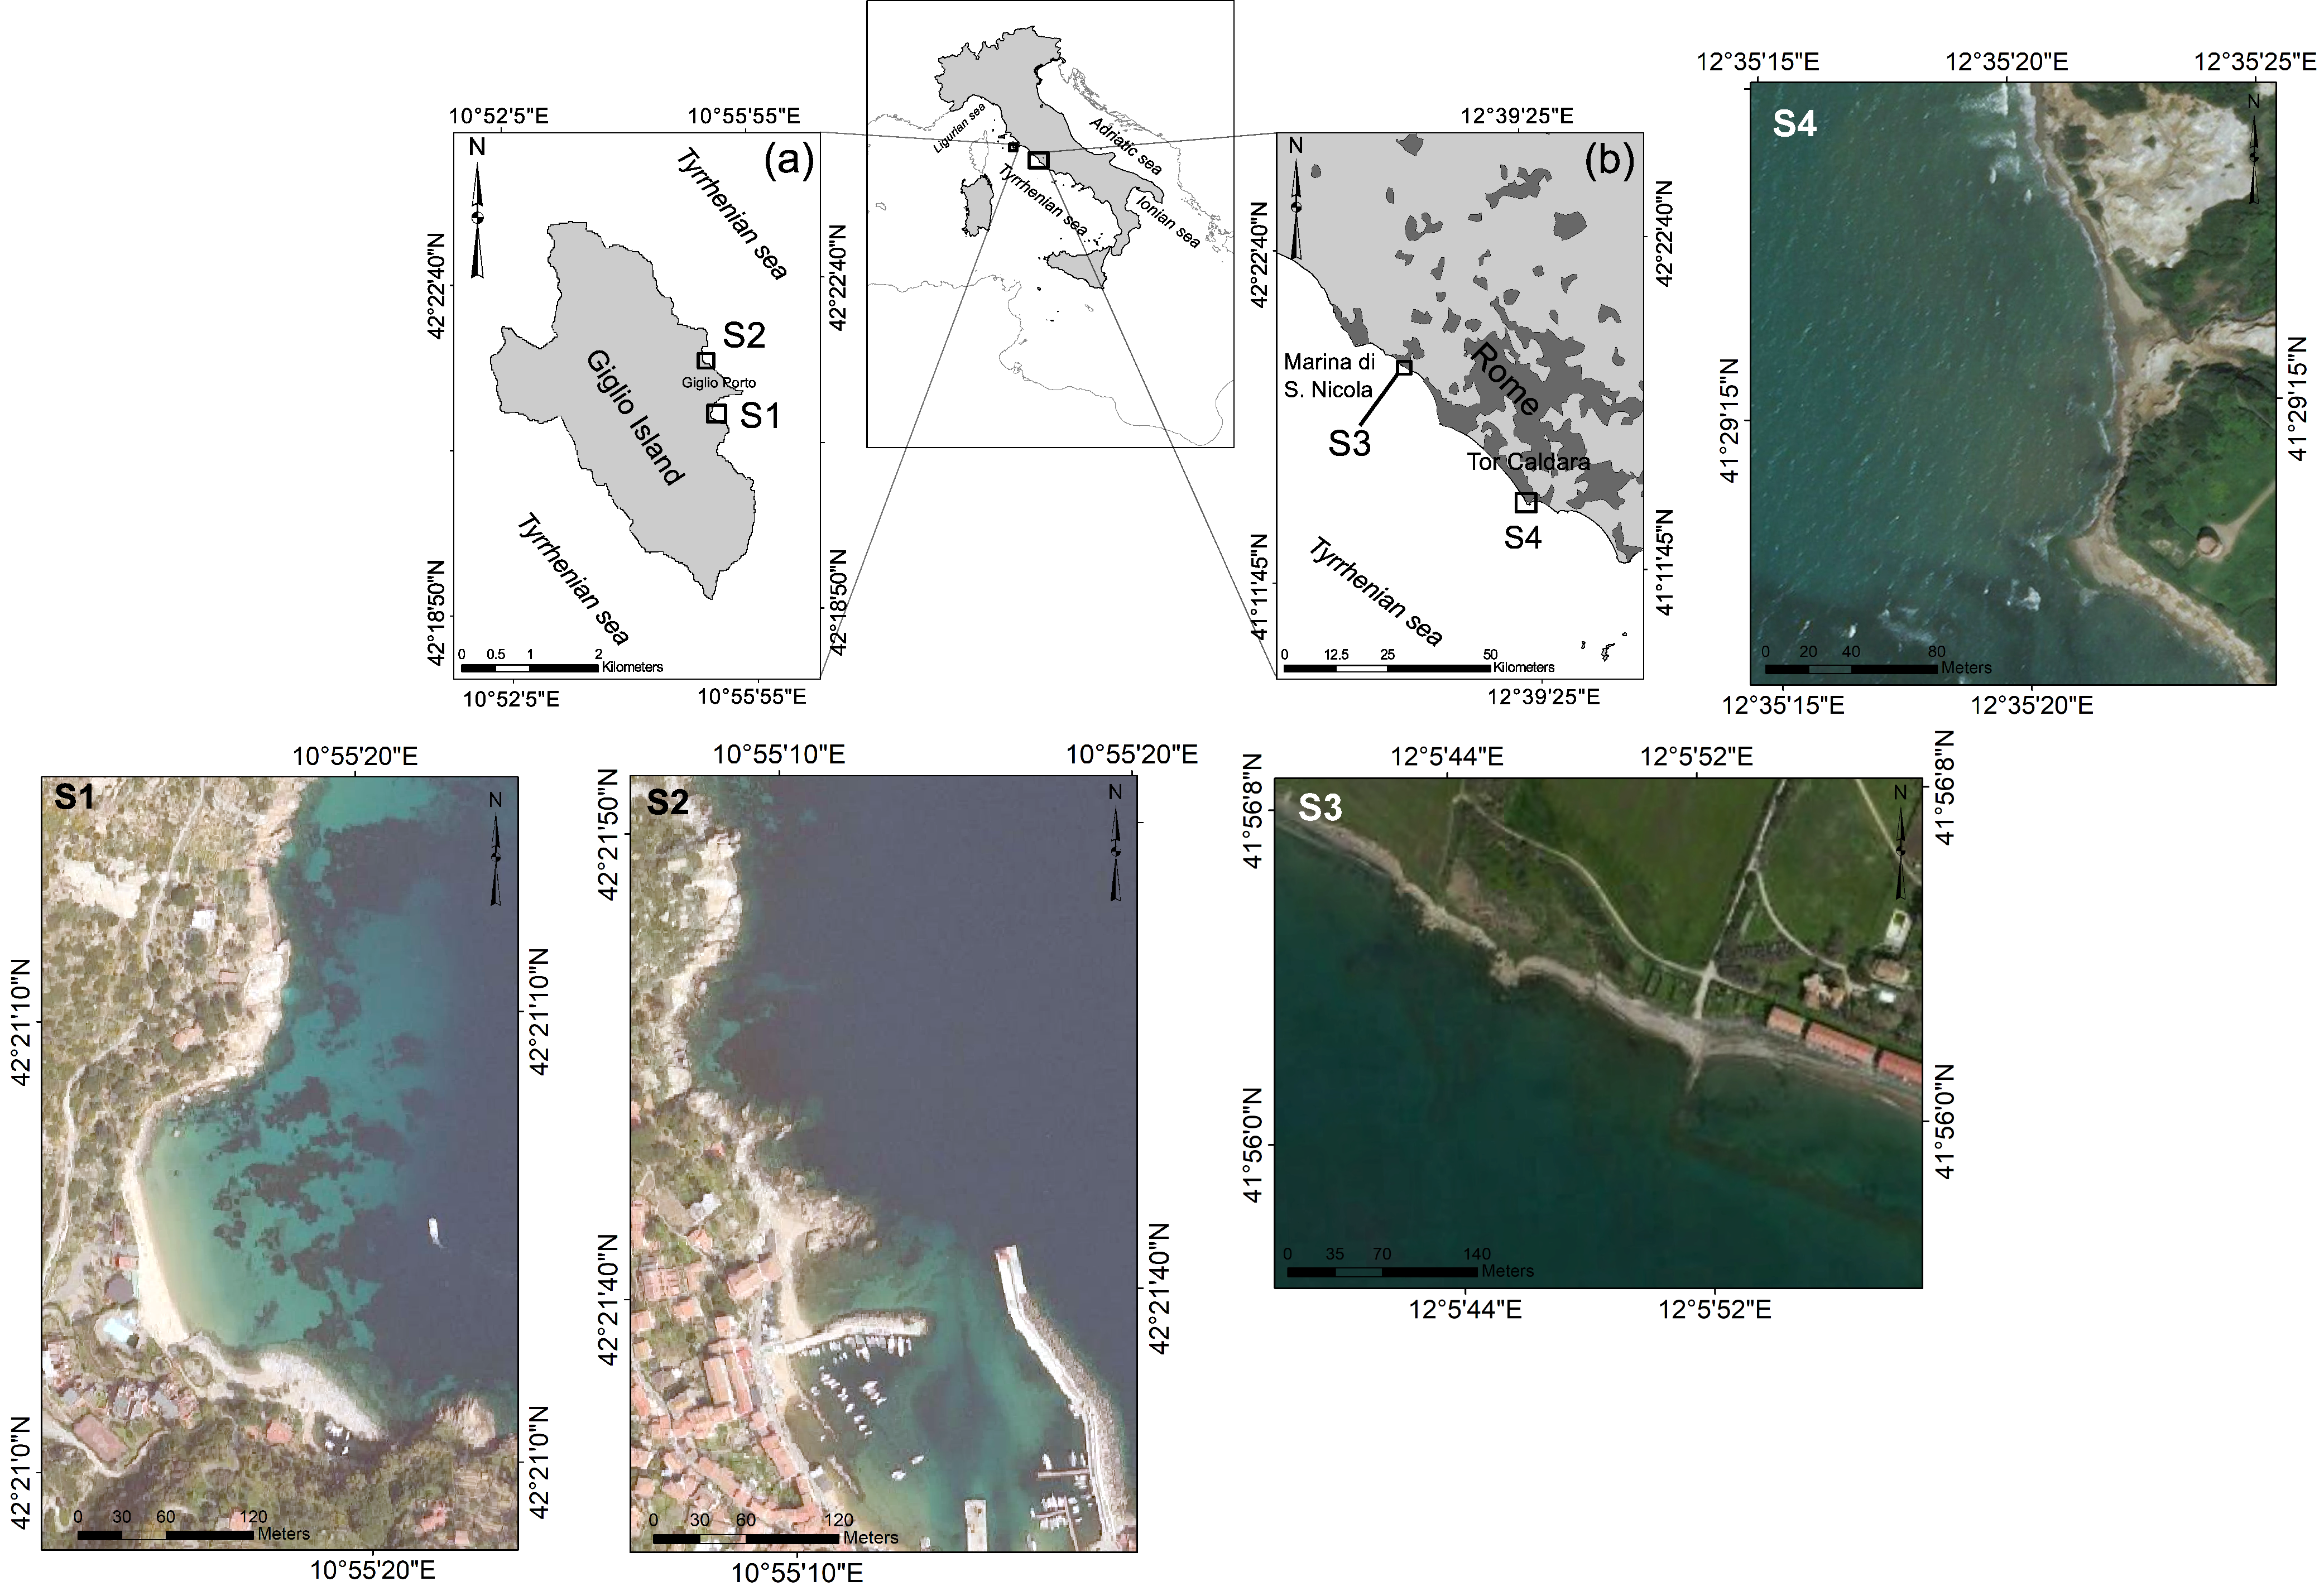
2.1. Study Sites

Case study research of some useful application of small UAV in sensitive coastal habitats, were carried out in four different sites, along the central Tyrrhenian coast: S1 and S2 were located in Giglio Island (Tuscany); whereas S3 (Marina di S. Nicola) and S4 (Tor Caldara) were located in the northern and southern coast of Latium, respectively (Figure 1).
The Giglio Island is partly included in the Tuscan Archipelago National Park (DPR 22/07/1996) due to its notable landscapes and natural interest. The general components of the island’s ecosystems include beaches with coarse sand and rocky shores with granitic cliffs. The coastal zone is characterized by high heterogeneity, due to the co-occurrence of sandy bottoms colonised by the sea-grass Posidonia oceania and biogenic outcrops (i.e., coralligenous assemblages) which occur in water deeper than 30 m [47]. Shallow rocky environments show hard granitic substrates often forming small coves with gentle slope where the rocky areas are covered by a dense carpet of photophilic algae such as brown seaweed Cystoseira spp. and calcified red algae of the order Corallinales, suitable for the settlement of juvenile fish.
On the contrary, along Latium, the coasts in proximity of Marina di San Nicola and Tor Caldara are dominated by soft bottom assemblages with sporadic hard biogenic outcrops. Being wave-dominated beaches mainly fed by terrigenous inputs from major rivers (approximately 20 km N/S far from the mouth of Tiber River), most of these areas are characterized by high water turbidity. The reef building species most widespread along this Mediterranean coast is S. alveolata whose bioconstructions occur not only in the low intertidal zone, but also in the midlittoral-upper-infralittoral zone [48].

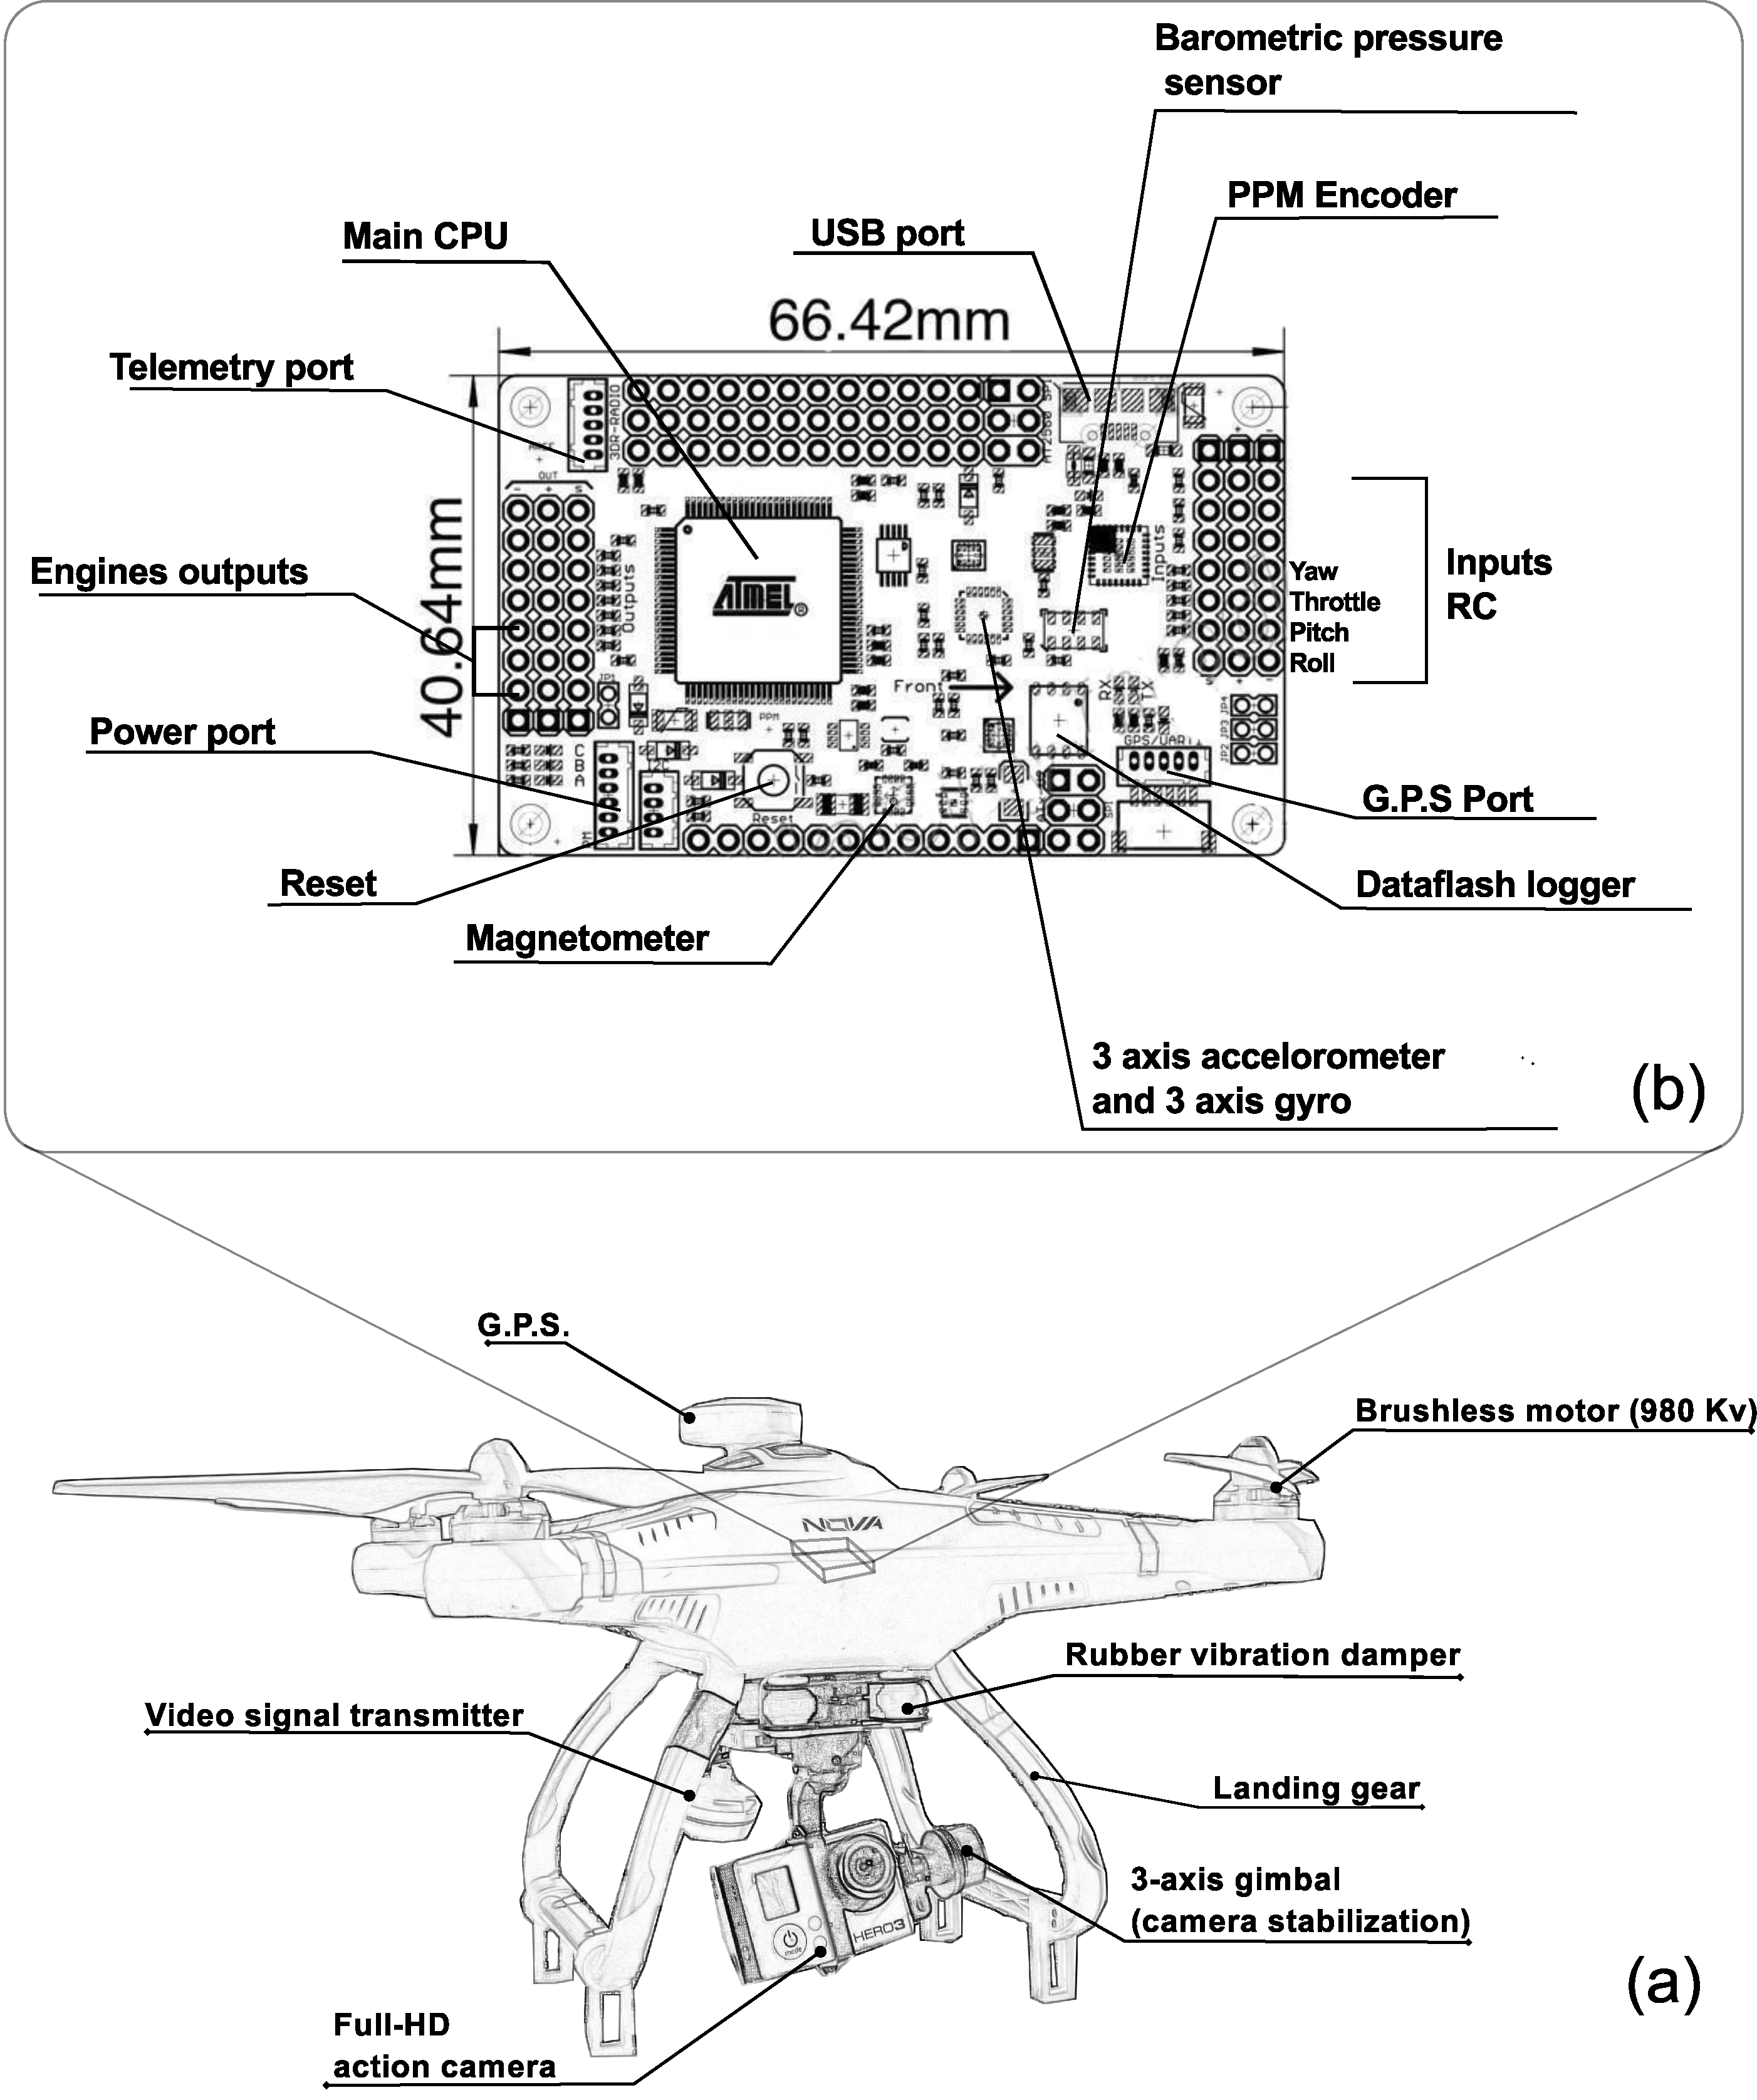
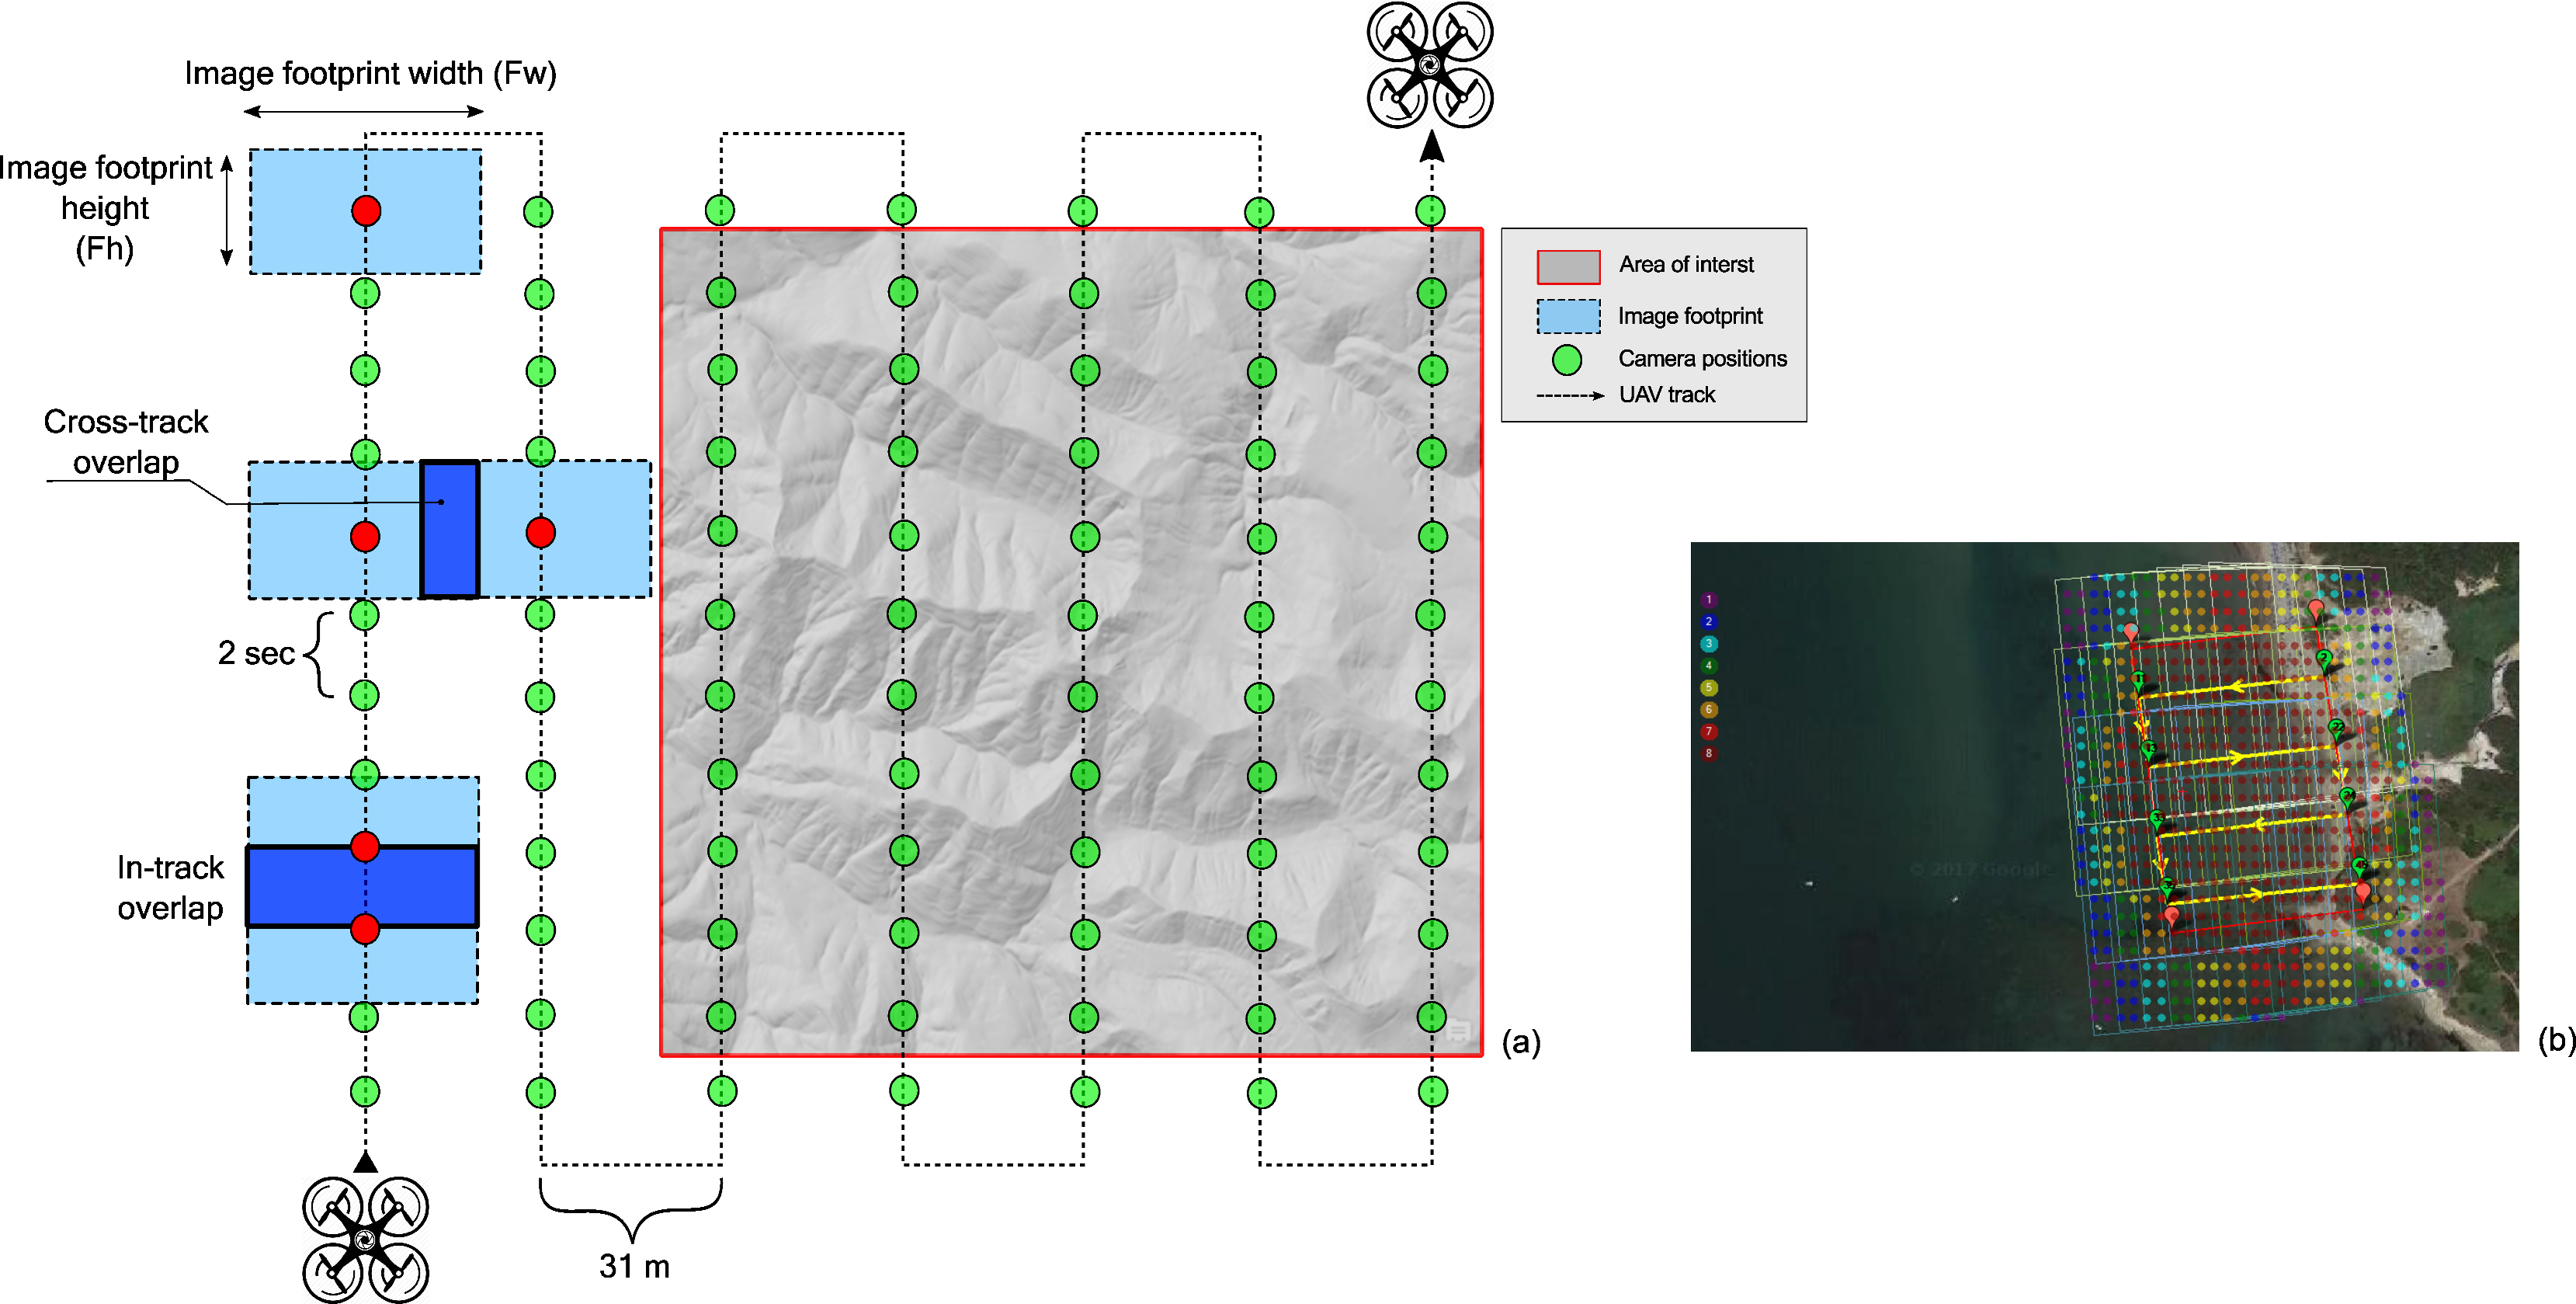
2.2. Field Data Collection and Unmanned Aerial System Settings

For all three case studies a modified rotary-wing platform (Quanum Nova Cheerson CX-20, Figure 2a) was chosen [49]. Compared to fixed-wing platforms, a multirotor platform sacrifices flight time in exchange for vertical takeoff and landing capability (VTOL capability is essential over rugged and inaccessible coastal areas). This quadcopter was equipped with an integrated autopilot system consisting of an Arduino-based microprocessor board (ArduPilot Mega or APM, http://www.ardupilot.co.uk/). The APM (v2.5) includes a computer processor, Global Positioning System (GPS) module (Neo-6P Gps, U-blox, Thalwil, Switzerland), data logger with an inertial measurement unit (IMU), pressure (BMP085 digital barometric altimeter, Bosch Sensortec, Kusterdingen, Germany), temperature sensor, triple-axis gyro, and an accelerometer (Figure 2b).
The take-off payload capacity of this UAV was 1.2 kg and it was powered by a ZIPPY 4000 mAh (14.8 V) 4S 25C Lipo battery, which allowed a maximum flight time of approximately 15 min, depending on wind speed. A remote control was used for sending commands within the 2.4 GHz frequency band to be subsequently processed by the flight control board. This quadcopter is relatively inexpensive (<600 euros), lightweight, and was equipped with a consumer-grade RGB, FULL-HD action camera (Gopro Hero 4 Black Edition, Table 1) in combination with a Feiyu Mini 3D Pro (Feiyu Tech, Guilin, China) three-axis brushless gimbal (to ensure a good stabilization on acquired images, avoiding motion blur. In each flight mission (taking approximately 12–15 min) we collected from 200 to 450 images in medium field of view or FOV (7 MP JPEG files, 3000 × 2250 pixels). We used the medium FOV which is a crop of the wide FOV (12 MP, 4000 × 3000 pixels) to reduce geometric distortion since the camera used in this study had a very wide-angle lens (fish eye lens) and a short focal length. We collected the imagery with a nadir look angle at 40 m altitude above mean sea level (AMSL) in order to achieve a ground sample distance (GSD) of ~3 cm per pixel according to the following formula:
GSD cm / pix = Sw mm Fh m FL mm Iw pix 100
where GSD is the photo resolution on the ground, Sw is the sensor width, Fh is the flight height, FL is the focal length of the camera, and Iw is the image width. It should be noted that the current formula is referred to the estimated GSD at the sea surface so at the sea floor it could decrease up to 3.5 cm/pixel due to the height of the water column (6 m in the deepest areas).
The image footprint on the ground covered an area of approximately 90 m (3000 × 3/100) by 67 m (2250 × 3/100). We oriented the camera on the UAV so that the 67 m axis is parallel to in-track and 90 m axis along the cross-track direction. Since an in-track overlap (overlap between each photo along the transects) of 75% is recommended the UAV moved 17 m relative to the ground (75% of 67 m = 50 m; 67 − 50 m = 17 m) and took a photo. Thus, at 7 m/s GPS airspeed subject to wind) to maintain a sufficient overlap between photos, we needed to take photos every 2 s. We set the time lapse mode with auto white balance and exposure. Additionally, at least 65% cross-track overlap (overlap between consecutive transects) is required to ensure good results in orthophoto generation so the UAV flight lines were spaced no greater than 31.5 m (Figure 3a). According to these parameters, the camera positions and the image footprints, directly estimated from the open-source software APM Mission Planner (v. 1.3.34), are shown in Figure 3b. To perform programmed GPS missions (i.e., autonomous survey grids) we combined the drone’s APM with Mission Planner 1.3.5. Some important features of Mission Planner are that it can plan, save, and load autonomous missions into the autopilot using Google or Bing satellite maps. It is also able to record telemetry logs which contain information logs and, finally, it is possible to download and analyse mission logs created by the APM autopilot. To avoid water motion and reflections, we timed the survey to coincide with the virtual absence of wind, low tide and optimal location of the sun as suggested in Casella et al. [50].
Since we wanted to maintain this application at low-cost and for our georeferencing purposes high accuracy was not required, we used a direct georeferencing technique [51,52]. The camera positions at the time of each photograph (i.e., exposure stations) were determined using the UAV onboard GPS receiver and recorded in the exchangeable image file format (Exif) metadata for each image, after estimating time offset (with pre-flight synchronisation of the camera’s internal clock with GPS time for better results) with Mission Planner (v.1.3 or higher) geotagging images tool (a quick tutorial is available at http://ardupilot.org/copter/docs/common-geotagging-images-with-mission-planner.html).
The height measurements from navigation-grade GPS receivers are relatively inaccurate (±5–10 m), hence, we use height measurements provided by the barometric altimeter which is estimated to be accurate to 1 m when used over short time periods (without strong variation in barometric pressure due to changes in weather conditions). This approach, which does not rely on ground control points (GCPs) in the imagery, is useful when working in unsafe or inaccessible areas where GCPs cannot be physically measured on the ground. The absolute accuracy of derived point cloud was limited primarily by the navigation grade GPS, but as reported in Turner et al. [51] that used a similar GPS module (LEA6S, U-blox, Thalwil, Switzerland) to our study, the translation parameters (after the Helmert transformation used to describe the relationship between the point cloud coordinate system and the real-world coordinate system), typically have low formal errors (often <±40 cm) indicating that the relative position of the GPS points has comparatively high precision. In addition, these measured values (from the on-board GPS) can be useful to estimate the camera’s approximate external orientation parameters to speed up the photogrammetric workflow (bundle adjustment) in Agisoft Photoscan.

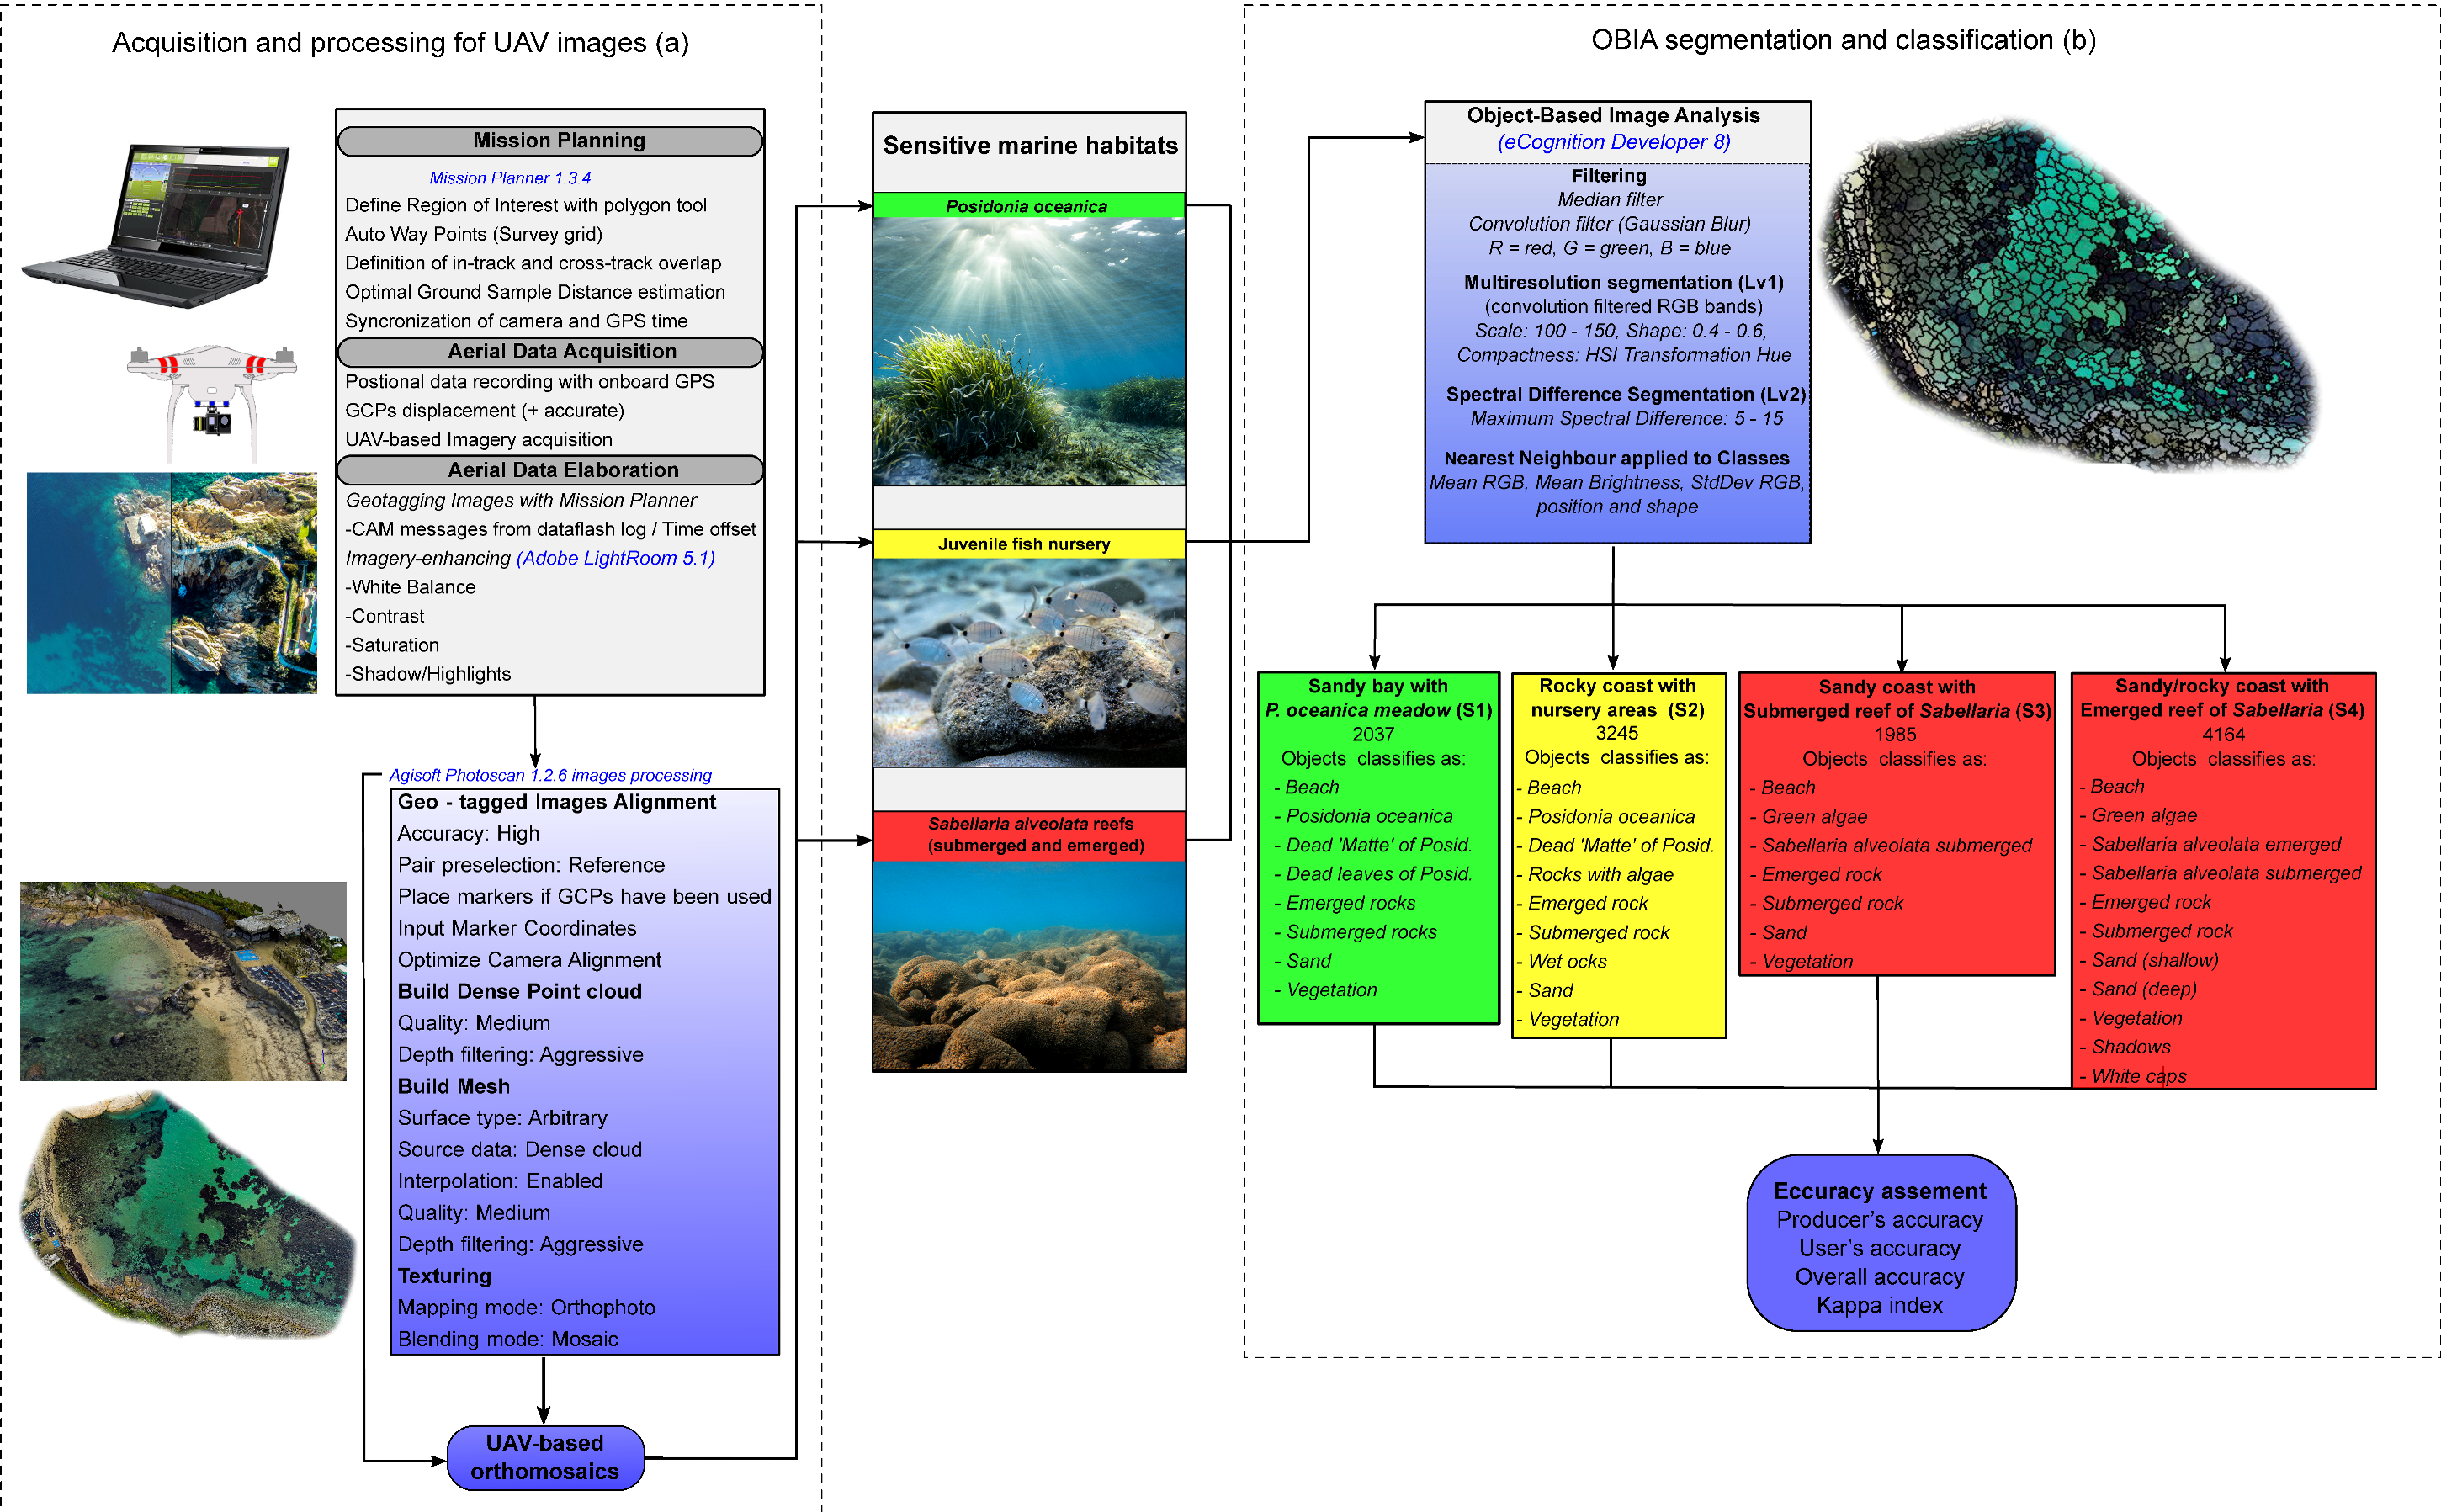
2.3. Structure from Motion Workflow and Orthophoto Map Generation

The photos were mosaicked using Agisoft photoscan 1.2.6 (LLC Agisoft, St. Petersburg, Russia) [53]. The software was designed to create 3D models from overlapping 2D still images using automated reconstruction algorithms. Generating orthophoto mosaics is a workflow of five steps [54,55]: (i) imagery and metadata input; (ii) photo alignment and generation of a sparse point cloud through tie point matching. Structure from Motion algorithms detected image features points and subsequently monitored the movement of those points throughout the sequence of multiple images with different angles. Using this information as the input, the locations of those feature points were estimated and rendered as a sparse three-dimensional point cloud; (iii) densification of the point cloud using MVS for the reconstruction of the scene geometry via creation of a 3D polygon mesh. The software used dense, multiview stereo-matching algorithms in order to create a polygonal mesh that could be visualized in a solid, shaded, and wireframe mode; (iv) texture atlas production of the 3D polygon mesh into an orthophoto mapping projection; and (v) exportation of the orthophoto mosaic as GeoTIFF files.
Before importing remote sensing imagery into Agisoft Photoscan, the photographs were first corrected and enhanced. Lens distortion corrections and camera calibration parameters were estimated using Agisoft Lens software (LLC Agisoft, St. Petersburg, Russia). The estimation of these geometric characteristics (i.e., the focal length of the lens, the coordinates of the centre of projection of the image, the radial lens distortion coefficients) is performed through the camera calibration process in order to be able to extract accurate 3D metric information from images [56]. In addition, since GoPro photographs were originally recorded with Protune mode activated we enhanced them (white balance, colour contrast and saturation, exposure, shadows/highlights) with Adobe Lightroom v. 5.1 (Adobe Systems, San Jose, CA, USA).
After photo alignment, firstly sparse point clouds, and thereafter dense point clouds, were generated with “medium” quality and “aggressive” depth-filtering settings. We used these settings in order to speed up the processing time. However, if the area to be reconstructed contains meaningful small details, then it would be reasonable to choose high quality and moderate depth filtering to avoid sorting out most of the outliers, as suggested in Agisoft LCC user guide [53]. Typical acquisition and processing pipeline for UAV images are shown in Figure 4a.
The resulting point clouds usually had 2 to 6 million points (80 to 200 points/m2). Finally, dense 3D point clouds were used to create 3D meshes of the scene geometry and digital surface models (DSMs) to correct (ortho-rectify) for features that appear oblique due to the wide angle and low altitude photography. However, it should be noted that our results are affected by measurement errors due to the effects of two-media photogrammetry (i.e., light breaking at the water/air interface) and poor positional accuracy (stems from the use of on-board GPS). We used them in this paper only for visualization purposes because further processing techniques are needed to quantify bathymetry from SfM-based DTMs. For a rigorous workflow that takes into account these aspects please refer to Tamminga et al. and Woodget et al. [28,57].

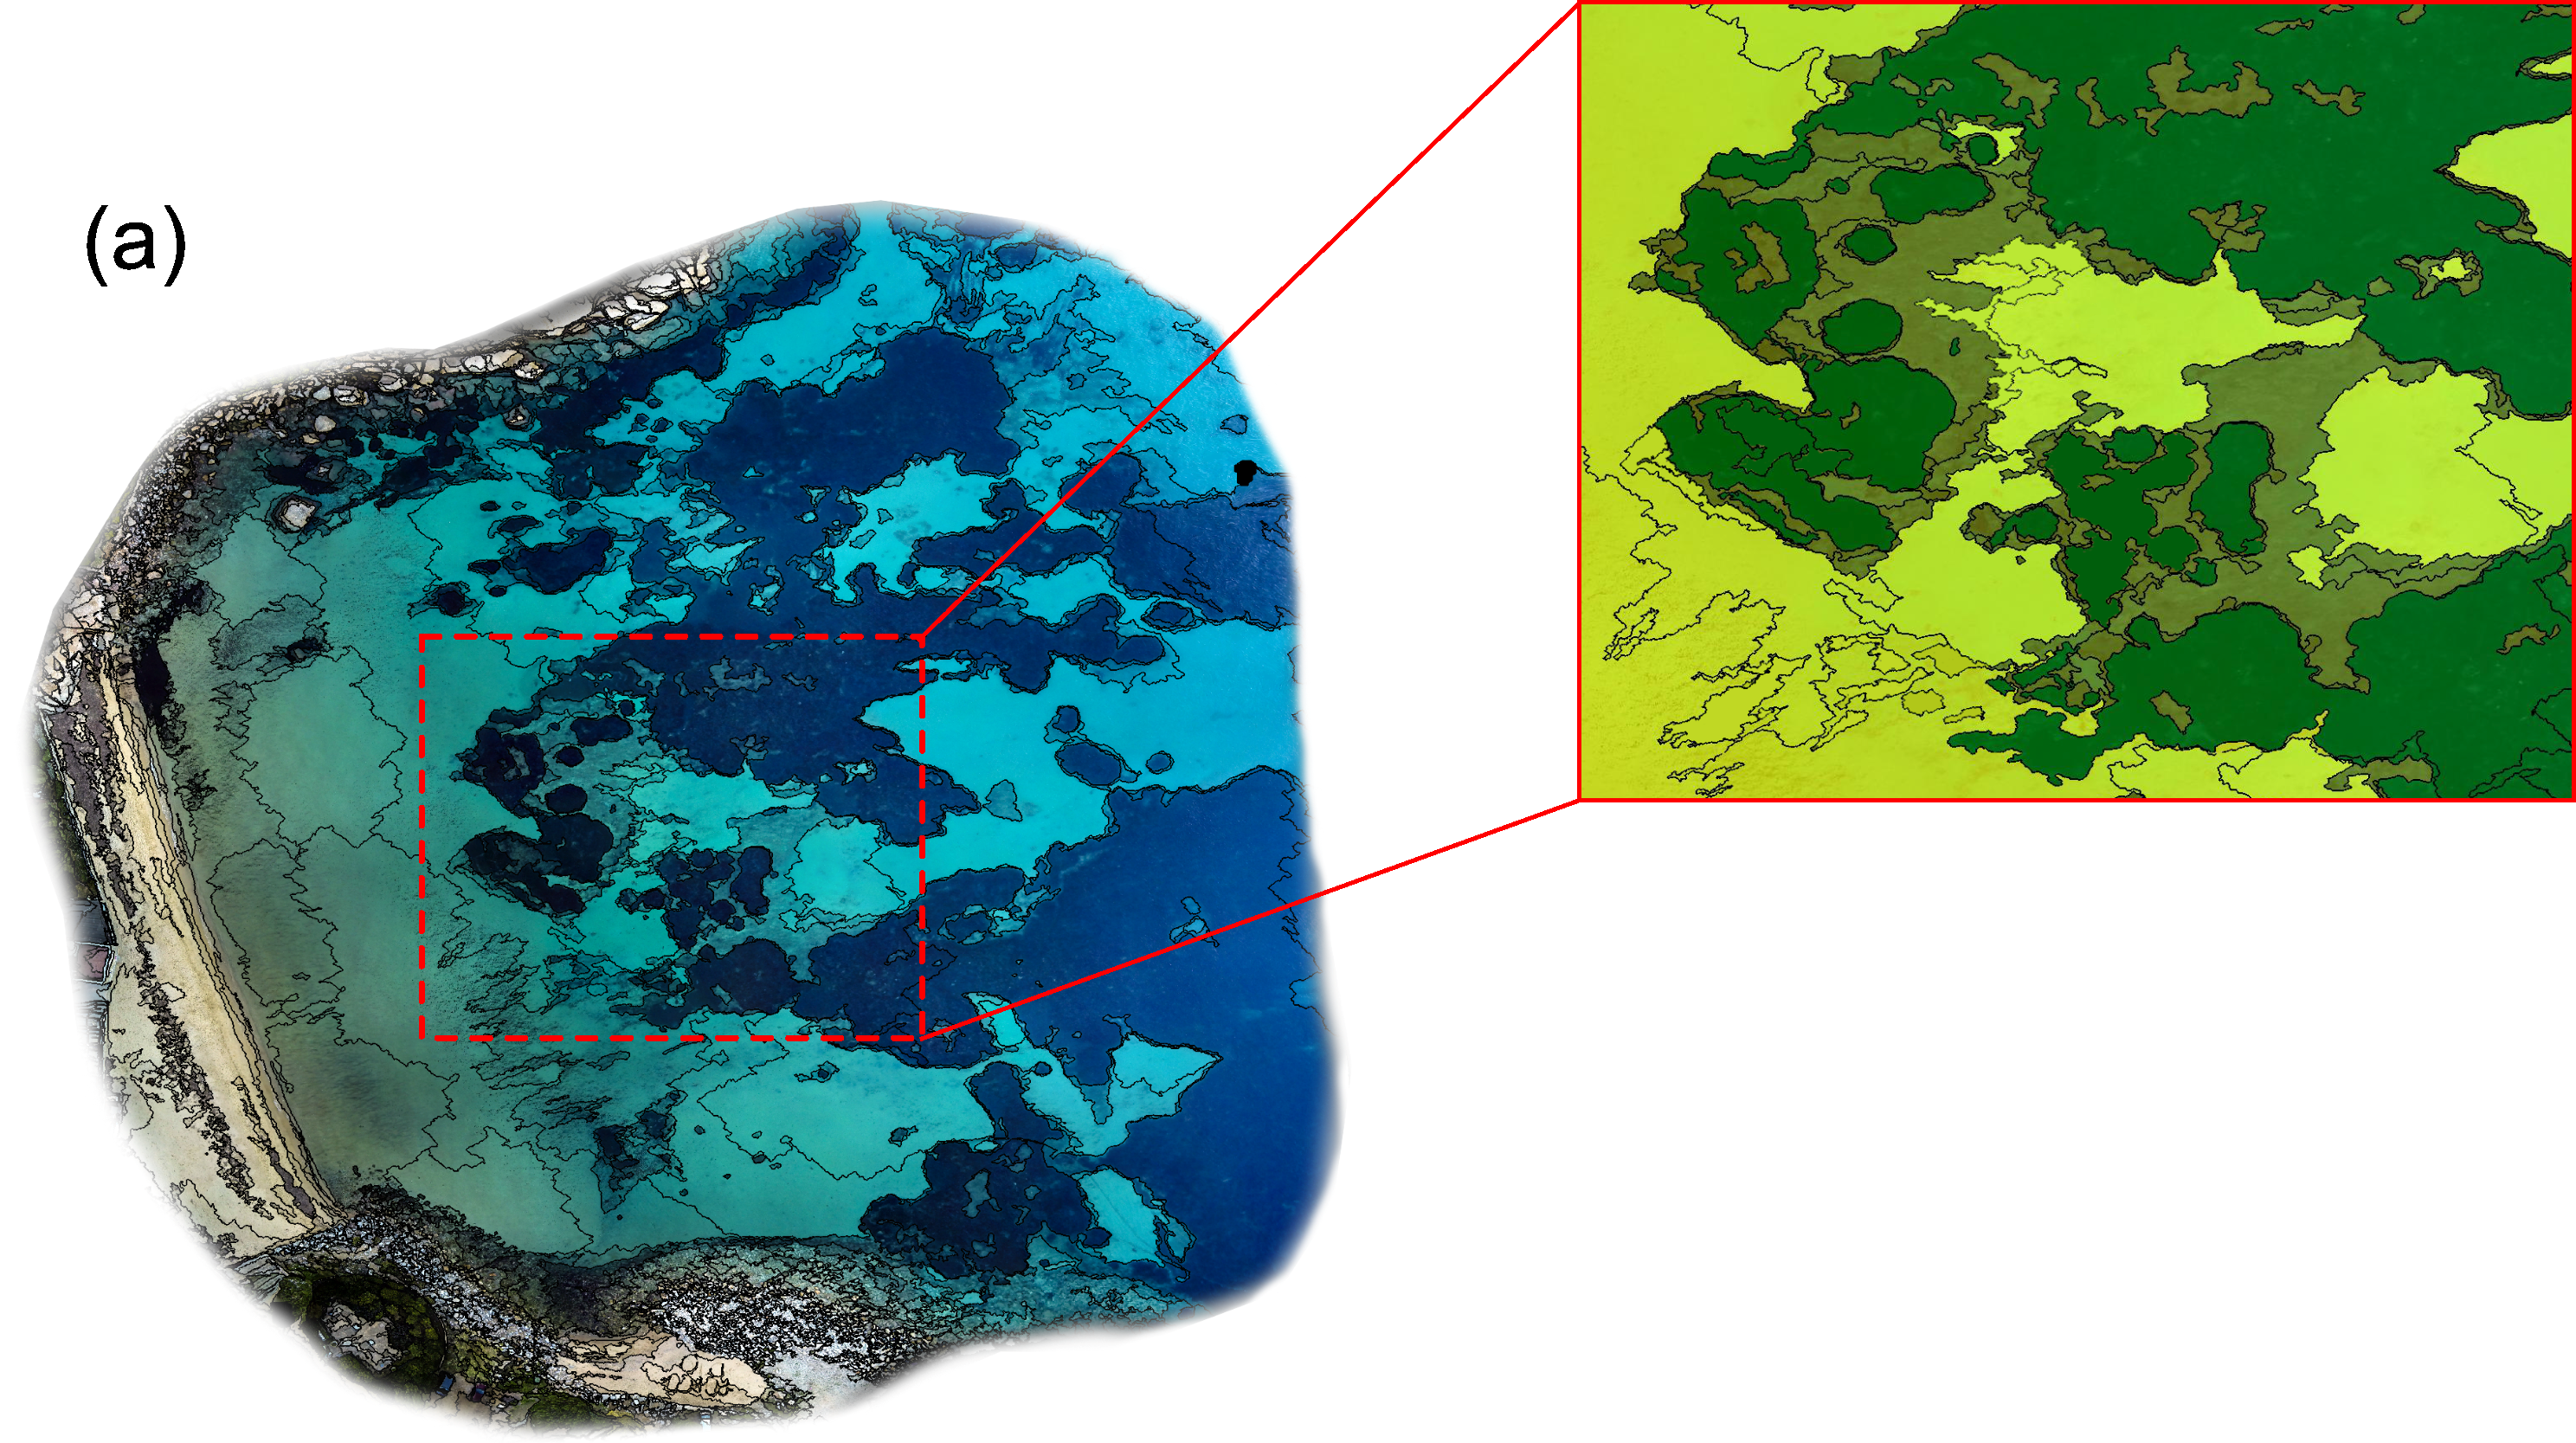
2.4. Image Processing and Classification Procedures

Due to very high spatial resolution of the images, a powerful procedure of image analysis is needed. At this stage, classification methods based only on pixel information are very limited due to the spectral similarities. To solve this limitation, object-based image analysis (OBIA) can be a useful tool to discriminate cover classes. The software eCognition Developer 8 (Definens AG, Munchen, Germany) [58] was used for our OBIA. Rule sets were developed based on the segmentation process of images into homogenous segments (i.e., objects). Rule sets, which are a sequence of processes that are executed in a defined order [59], include segmentation parameters that create meaningful objects generated by one or more criteria of homogeneity (e.g., scale, shape, compactness). The heterogeneity of the pixel values within image objects is defined by the “scale” factor, a higher value of this parameter results in fewer, more heterogeneous objects with a larger average size. In eCognition image objects may also be delineated based on their geometric properties, and the weight of this factor is controlled by the “shape” and “compactness” parameters. Rule sets allow the user to examine what cover classes are least distinguishable from others and to refine specific thresholds, through several iterative classification trials, to better capture the variation of that class in order to optimize our OBIA cover estimates with the ground-truthed cover data [37]. The following classification is based on features calculated for each object that not only deal with spectral values but may also be related to size, form, texture, neighbourhood [31]. Prior to segmentation, imagery was filtered to remove noise (extraneous information irrelevant to the OBIA) through a median filter and a convolution filter. Further detail and formulae for calculating filters can be found in Trimble’s eCognition Developer 8 reference book [59].
The classification approach is carried out as a top-down approach, within a multi-scale (two level) hierarch segmentation process consisted of a multiresolution segmentation algorithm followed by a spectral difference segmentation algorithm. First, we performed a multiresolution segmentation on level 1 where we chose the scale, shape and compactness as variables in order to define objects boundaries. Essentially, the procedure identified single image objects, applying an optimization procedure which locally minimizes the average heterogeneity of image objects based on relative homogeneity criteria [37,60]. Twenty features were derived from layer values (e.g., mean band value, standard deviation of band values, border contrast, pixel ratio, intensity, hue, saturation). However, after iterative trials we found that the best feature capable of improving the multiresolution segmentation when selected as compactness criterion is the mean hue. The selection of features was based on previous studies of UAS imagery acquired with a digital camera [30]. The scale parameter varied in the function of the sensor and the spatial resolution and for our high-resolution UAV-based imagery the best values are comprised between 100 and 150, and the remaining segmentation parameter (i.e., shape) was always <0.6. The low values for shape resulted in a much higher influence of colour (spectral information) on the segmentation process. A second level was created by merging existing objects of level 1 based on the absolute spectral difference. Spectral difference segmentation merged neighbouring image objects when the difference between their layer mean intensities was below the value given by the maximum spectral difference [58]. It was designed to refine existing segmentation results, by merging spectrally similar image objects, avoiding an over-segmentation which may produce a scattered classification. Afterwards, segmented image objects can be classified by nearest neighbour classification which uses a set of samples of different classes in an attempt to assign class values to a segmented object [60]. The subsequent object-based classification (nearest neighbour algorithm) was realized by selecting thresholds of class specific image features (mean RGB values, mean brightness, standard deviation RGB, position, and shape). The thresholds of these features were automatic registered by selecting manually class specific samples via an on-screen interpretation [32]. At least 40 training areas for each class were used. Overall, considering the three coastal habitats investigated, 16 cover classes were defined: beach, shallow (0–1 m) and deep (>1 m) sandy areas, Posidonia oceanica, dead ‘matte’ of P. oceanica, dead leaves of P. oceanica, emerged rocks, wet rocks, submerged rocks, rocks with algae, green algae, S. alveolata emerged and submerged reefs, vegetation (shrubs and grass), whitecaps and shadows. The OBIA flowchart and segmentation parameters for each marine sensitive habitats are shown in Figure 4b.
We assessed the accuracy of the land cover classification algorithm by comparing the reported land cover of randomly selected points to the actual land cover and generated a confusion matrix which reports how well the OBIA algorithms classified the imagery [61]. We randomly placed 200–450 accuracy assessment points (distinct from the training areas) proportionally by total land cover area of each class. We manually classified each point and the accuracy of the classified imagery was assessed visually using the original true colour UAV orthophotos. Due to the high spatial resolution of the imagery visual inspection is very reliable for assessing accuracy [36]. However, in the most difficult areas such as the deepest patches of Posidonia, accumulation areas of dead leaves, isolated Sabellaria formations on sand we used underwater video survey to confirm the visual interpretation of UAV-based imagery. For this purpose, high-resolution orthomosaics with a positional accuracy of (±1.5–2 m) were converted into kmz files and uploaded into a handheld GPS unit with European Geo-stationary Navigation Overlay System (EGNOS) correction (Garmin GPSmap 62). A more detailed description regarding ground truth data with illustrations is available in Supplementary Material Section.
Finally, a confusion matrix was calculated to evaluate the accuracy of the final classifications including: (i) the producer’s accuracy, which is defined as proportion of correctly classified objects to the reference samples of a class; (ii) the user’s accuracy, which is defined as the proportion of correctly classified objects within the total number of samples classified; (iii) the overall accuracy, which is defined as the proportion of all correctly classified objects and the total sample size; and (iv) the Kappa index of agreement (KIA), which is defined as the agreement of the classification results with the corresponding reference data. Congalton et al. and Sim et al. [62,63] proposed categories for assessment of the classification performance measured by the Kappa value as poor (≤0), slight (1–0.20), fair (0.21–0.40), moderate (0.41–0.60), substantial (0.61–0.80), and excellent (≥0.81).

3. Results

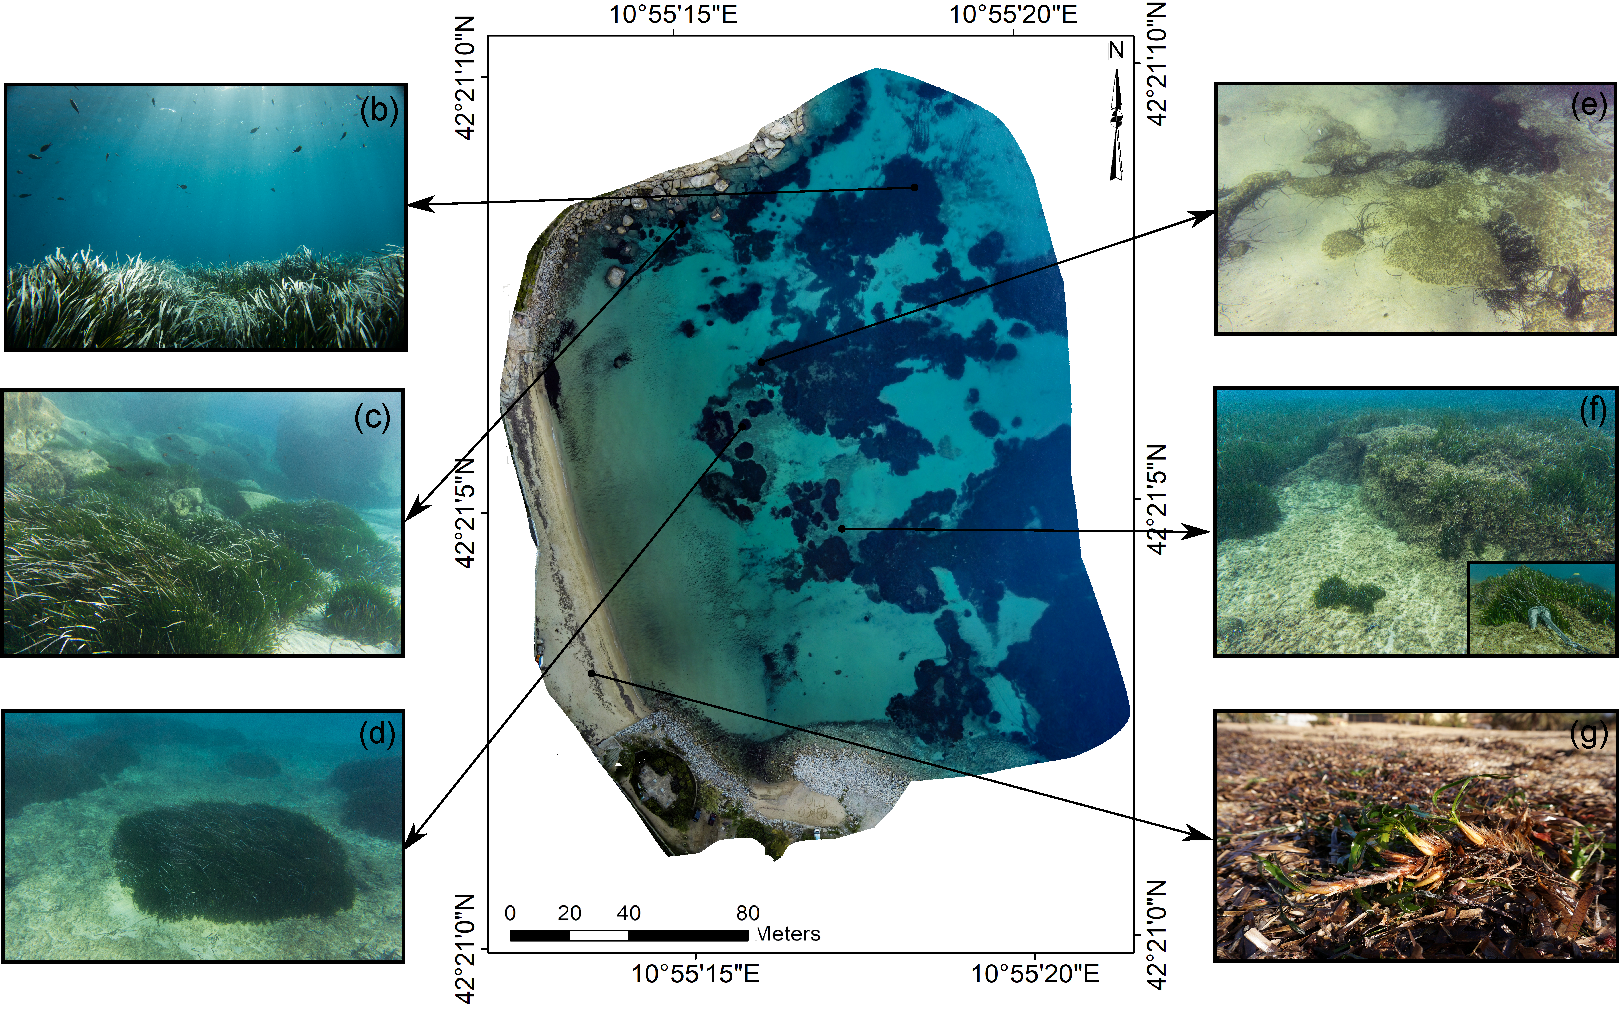
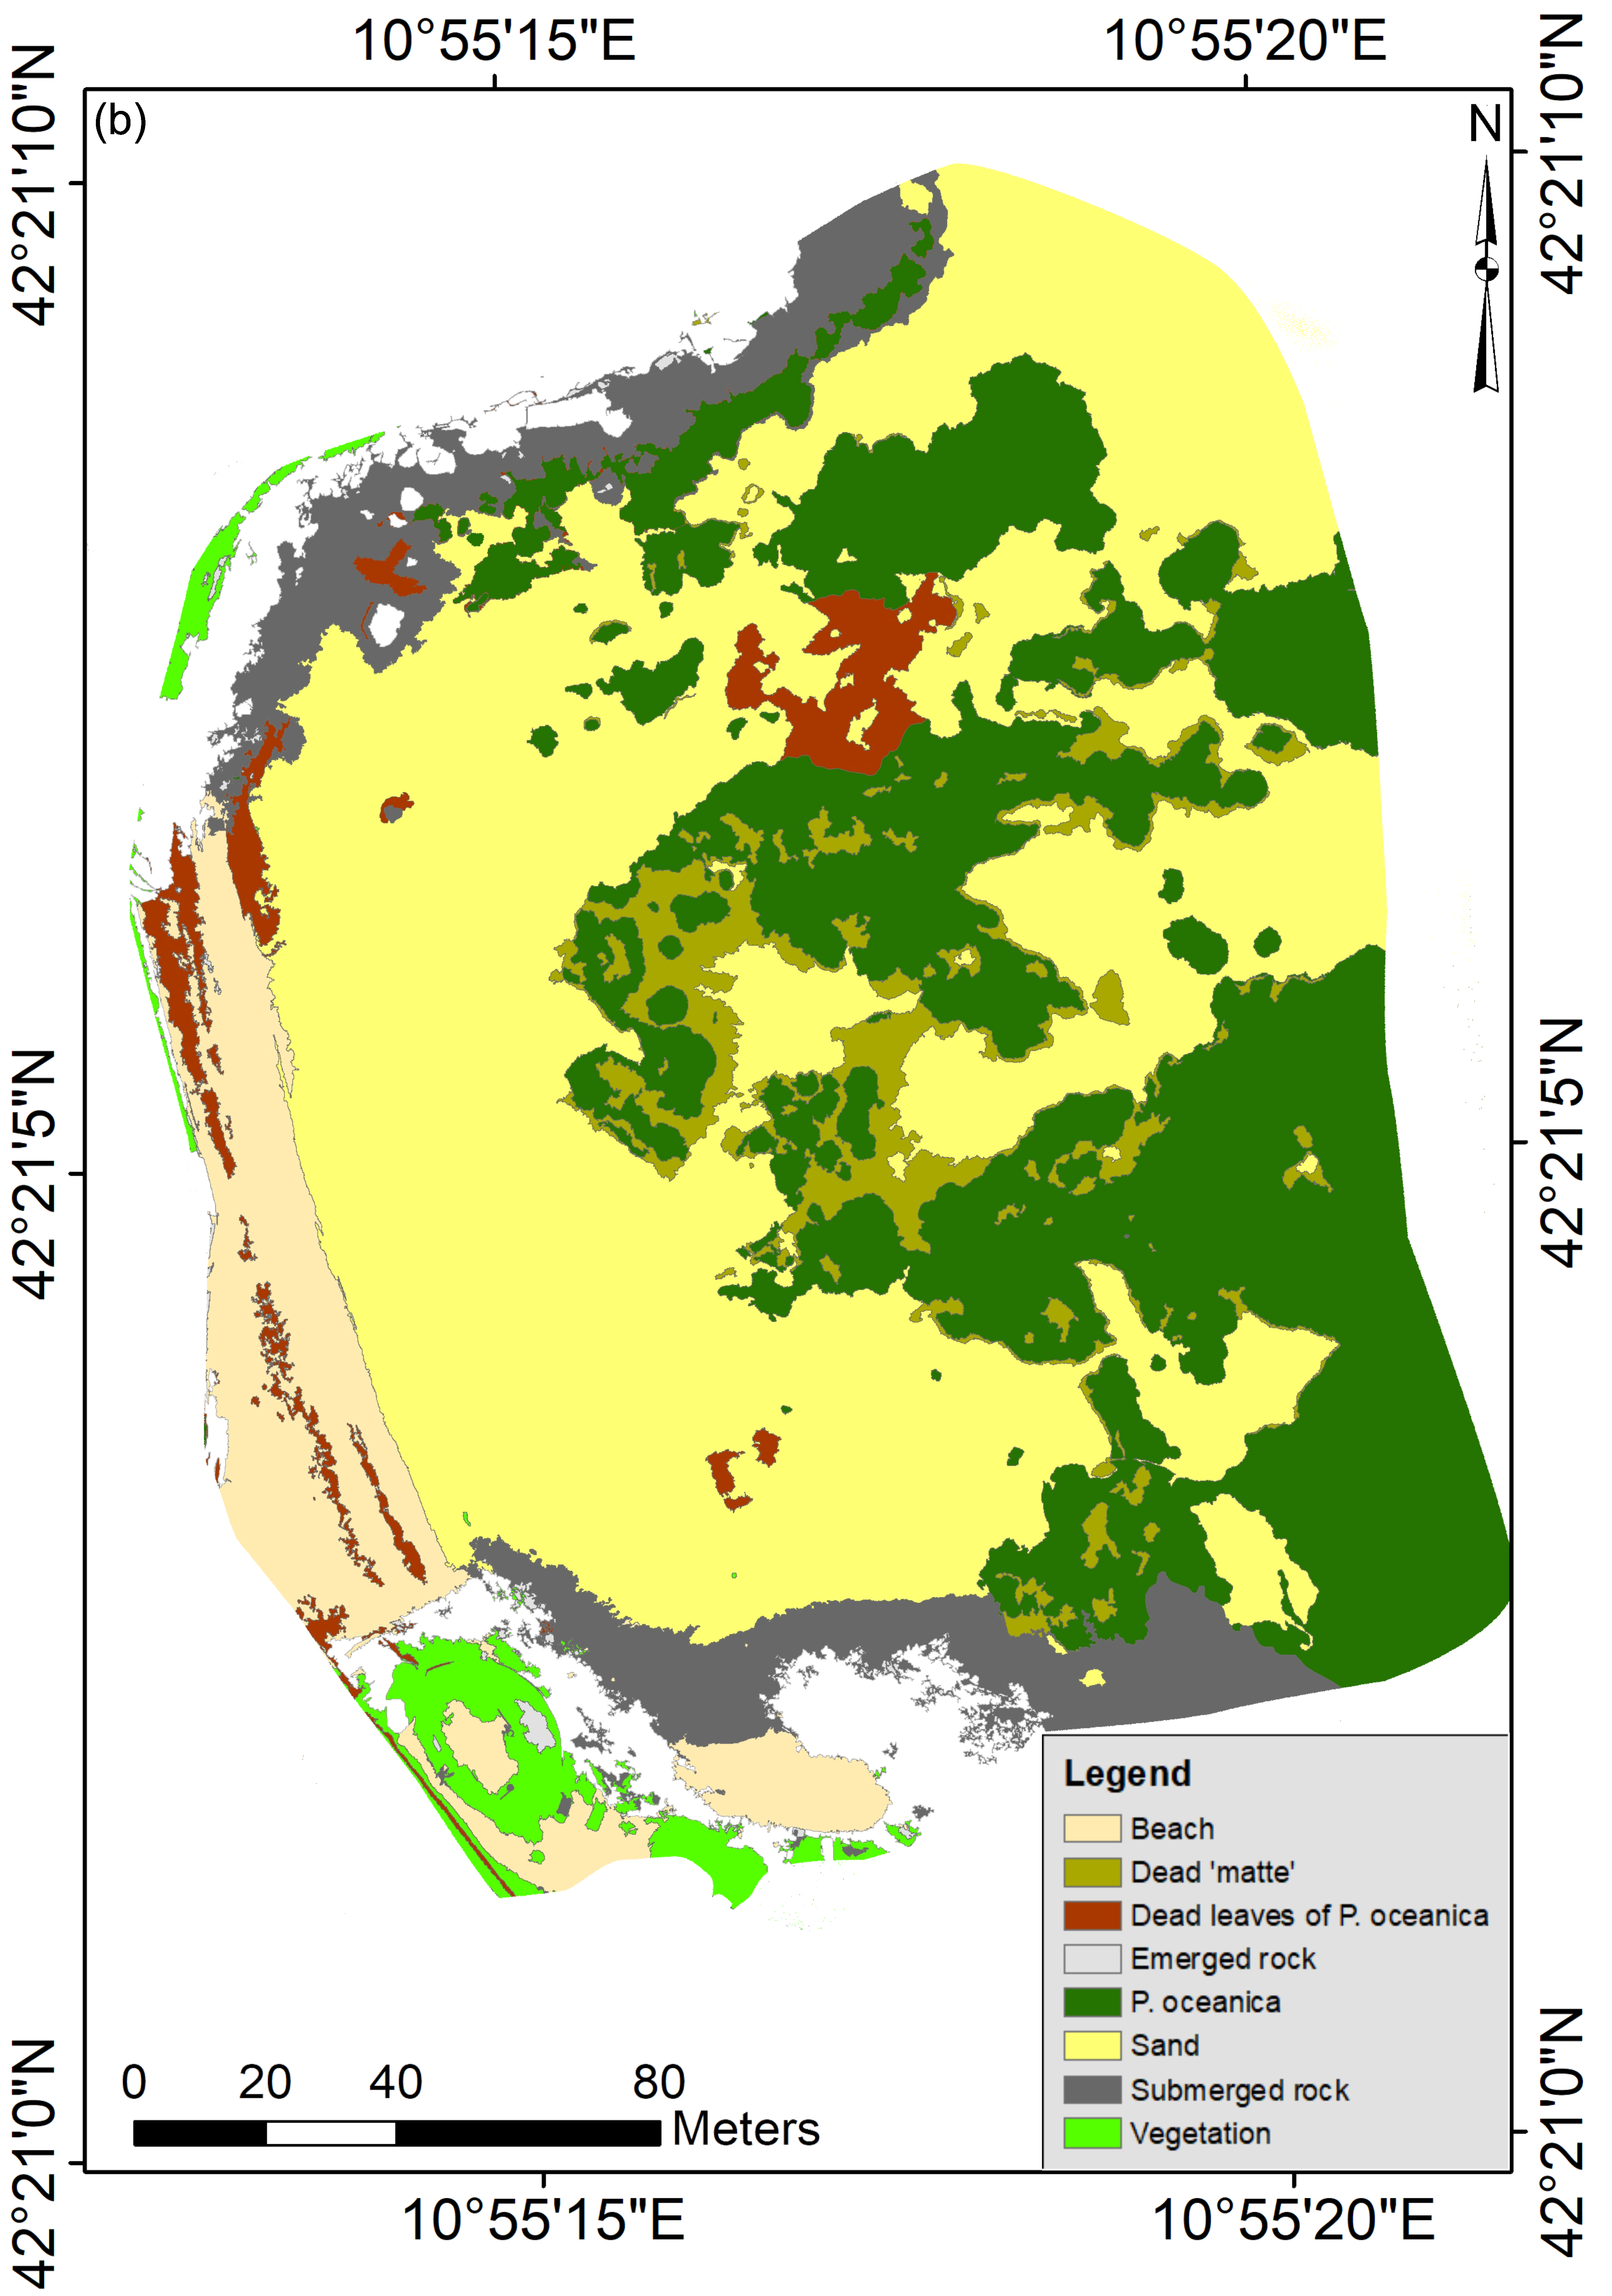
3.1. Posidonia oceanica Meadow

In the S1 site the generated orthophoto of the Posidonia oceanica meadow in front of the beach of Cannelle had a resolution of 2.76 cm/pix (Figure 5a). The high level of detail of the generated map clearly showed some important features both of the coastal zones and of the sea bottom, providing useful data for low-cost monitoring these shallow sensitive coastal environments. In fact, other than the meadow (Figure 5b), patch formation of the seagrass on rocks (Figure 5c) and sand (Figure 5d), dead leaves of Posidonia oceanica lying on the sea bottom (Figure 5e), impacted areas from boat anchoring with exposed root-rhizomes (called “matte”, which may continue to persist after the death of the dense leaf canopy; Figure 5f), and the accumulation areas of beached organic debris (called “banquettes”, 95% of which consists of dead leaves of the seagrass, [64], Figure 5g), were clearly distinguishable.
The segmentation of the orthophotos is a critical phase during thematic maps production through OBIA since the characteristics of various objects can be used in the classification process. For this reason, the segmentation results that determine the geometry objects in the multi-resolution segmentation should be carefully assessed (Figure 6a). Major land-cover misclassification errors involved spectral confusion among P. oceanica dead leaves (with a total of 38% of samples interpreted as P. oceanica) and Posidonia meadow. Additionally, exposed “matte” (with a total of 11% of samples interpreted as sand) illustrated the difficulty in separating these two land-cover classes. The inset of Figure 6a demonstrates that the complex meadow area which include spectrally different features, such as isolated Posidonia oceanica patches, dead ‘matte’ and sandy areas have been successfully segmented into 2037 different image objects and finally correctly classified. Classified map (Figure 6b) regarding Posidonia meadow’s features, demonstrated a good match between classified land-cover and the original aerial imagery leading to an overall classification accuracy and a KIA of 85% and 83%, respectively (Table S1). Thanks to this classification, we were able to identify the most damaged parts of the meadow. In fact, in this bay we reported that the meadow could be considered impacted because large areas with dead ‘matte’ (1630 m2 equivalent to 15% of the meadow) were clearly visible.

3.2. Nursery Area of Juvenile Fish

The case study for mapping juvenile sparid fish nursery areas was carried out along a rocky shoreline (~1 km long, coverage area: 0.0431 km2) north of Giglio Porto (Site S2). In this area, the coast is sheltered from winds blowing both southward and northward due to the presence of the harbour and of a natural promontory. From the orthomosaic generated by 160 overlapping images the high heterogeneity over the whole extent of the mapped area was clearly visible. Along this jagged coastline we identified two small coves (Figure 7a) were the presence of particular natural features such as sandy patches, pebbles and large boulders made such area suitable for settlement of juvenile sparid fish [42,65,66]. In fact, thanks to the high resolution (3 cm/pix) of the imagery after a visual inspection we were able to identify the most suitable habitats for juvenile fish of the genus Diplodus. Generally, sheltered areas with gently slope and the rocky substrates, colonized with shrubby brown algae (e.g., Phaeophyceae) characterized by the presence of sandy patches with coarse sand and pebbles, near to large boulders (diameter > 1 m) were particularly favourable for the settlement of Diplodus spp. In addition, by integrating the generated 3D outputs (e.g., point clouds and DEM with appropriate corrections due to two-media photogrammetry effects) also the structure of the coastal zones, such as the height of boulders and the main morphologies of seabed in the shallower areas can be assessed (Figure 7b,c).
On the orthophoto (total area of about three hectares), representing a suitable area for the settlement of juvenile sparid fishes, the OBIA approach was implemented to classify nine cover classes. The classified image yielded an overall accuracy of 84% (Table S2). In terms of per class accuracy, all classes were relatively high (>70%), except for the classification of submerged rocks, wrongly classified as sand and dead “matte” of P. oceanica. However, classification of submerged rocks is difficult because of the lack of spectral contrast between the surrounding bottoms mainly due to absorption of light in the 550–750 nm spectral range by water molecules. In fact, emerged cover classes such as beach and dry rocks showed higher classification accuracies. The classified orthophoto (Figure 8a) clearly showed some important features characterizing these coastal environments. For instance, we reported the presence of brown macroalgae (especially Cystoseira spp., Figure 8b–d). This species is very important along rocky coasts because well-developed Cystoseira belt communities indicate good water quality [67] and, in general, arborescent macro-algae forests covering temperate rocky reefs are a known habitat for juvenile fish [68]. On the other hand, the southern part of the P. oceanica meadow presented an impacted area (represented by dead “matte”, Figure 8e–g) near to the port, probably due to the works for the expansion of the breakwater.

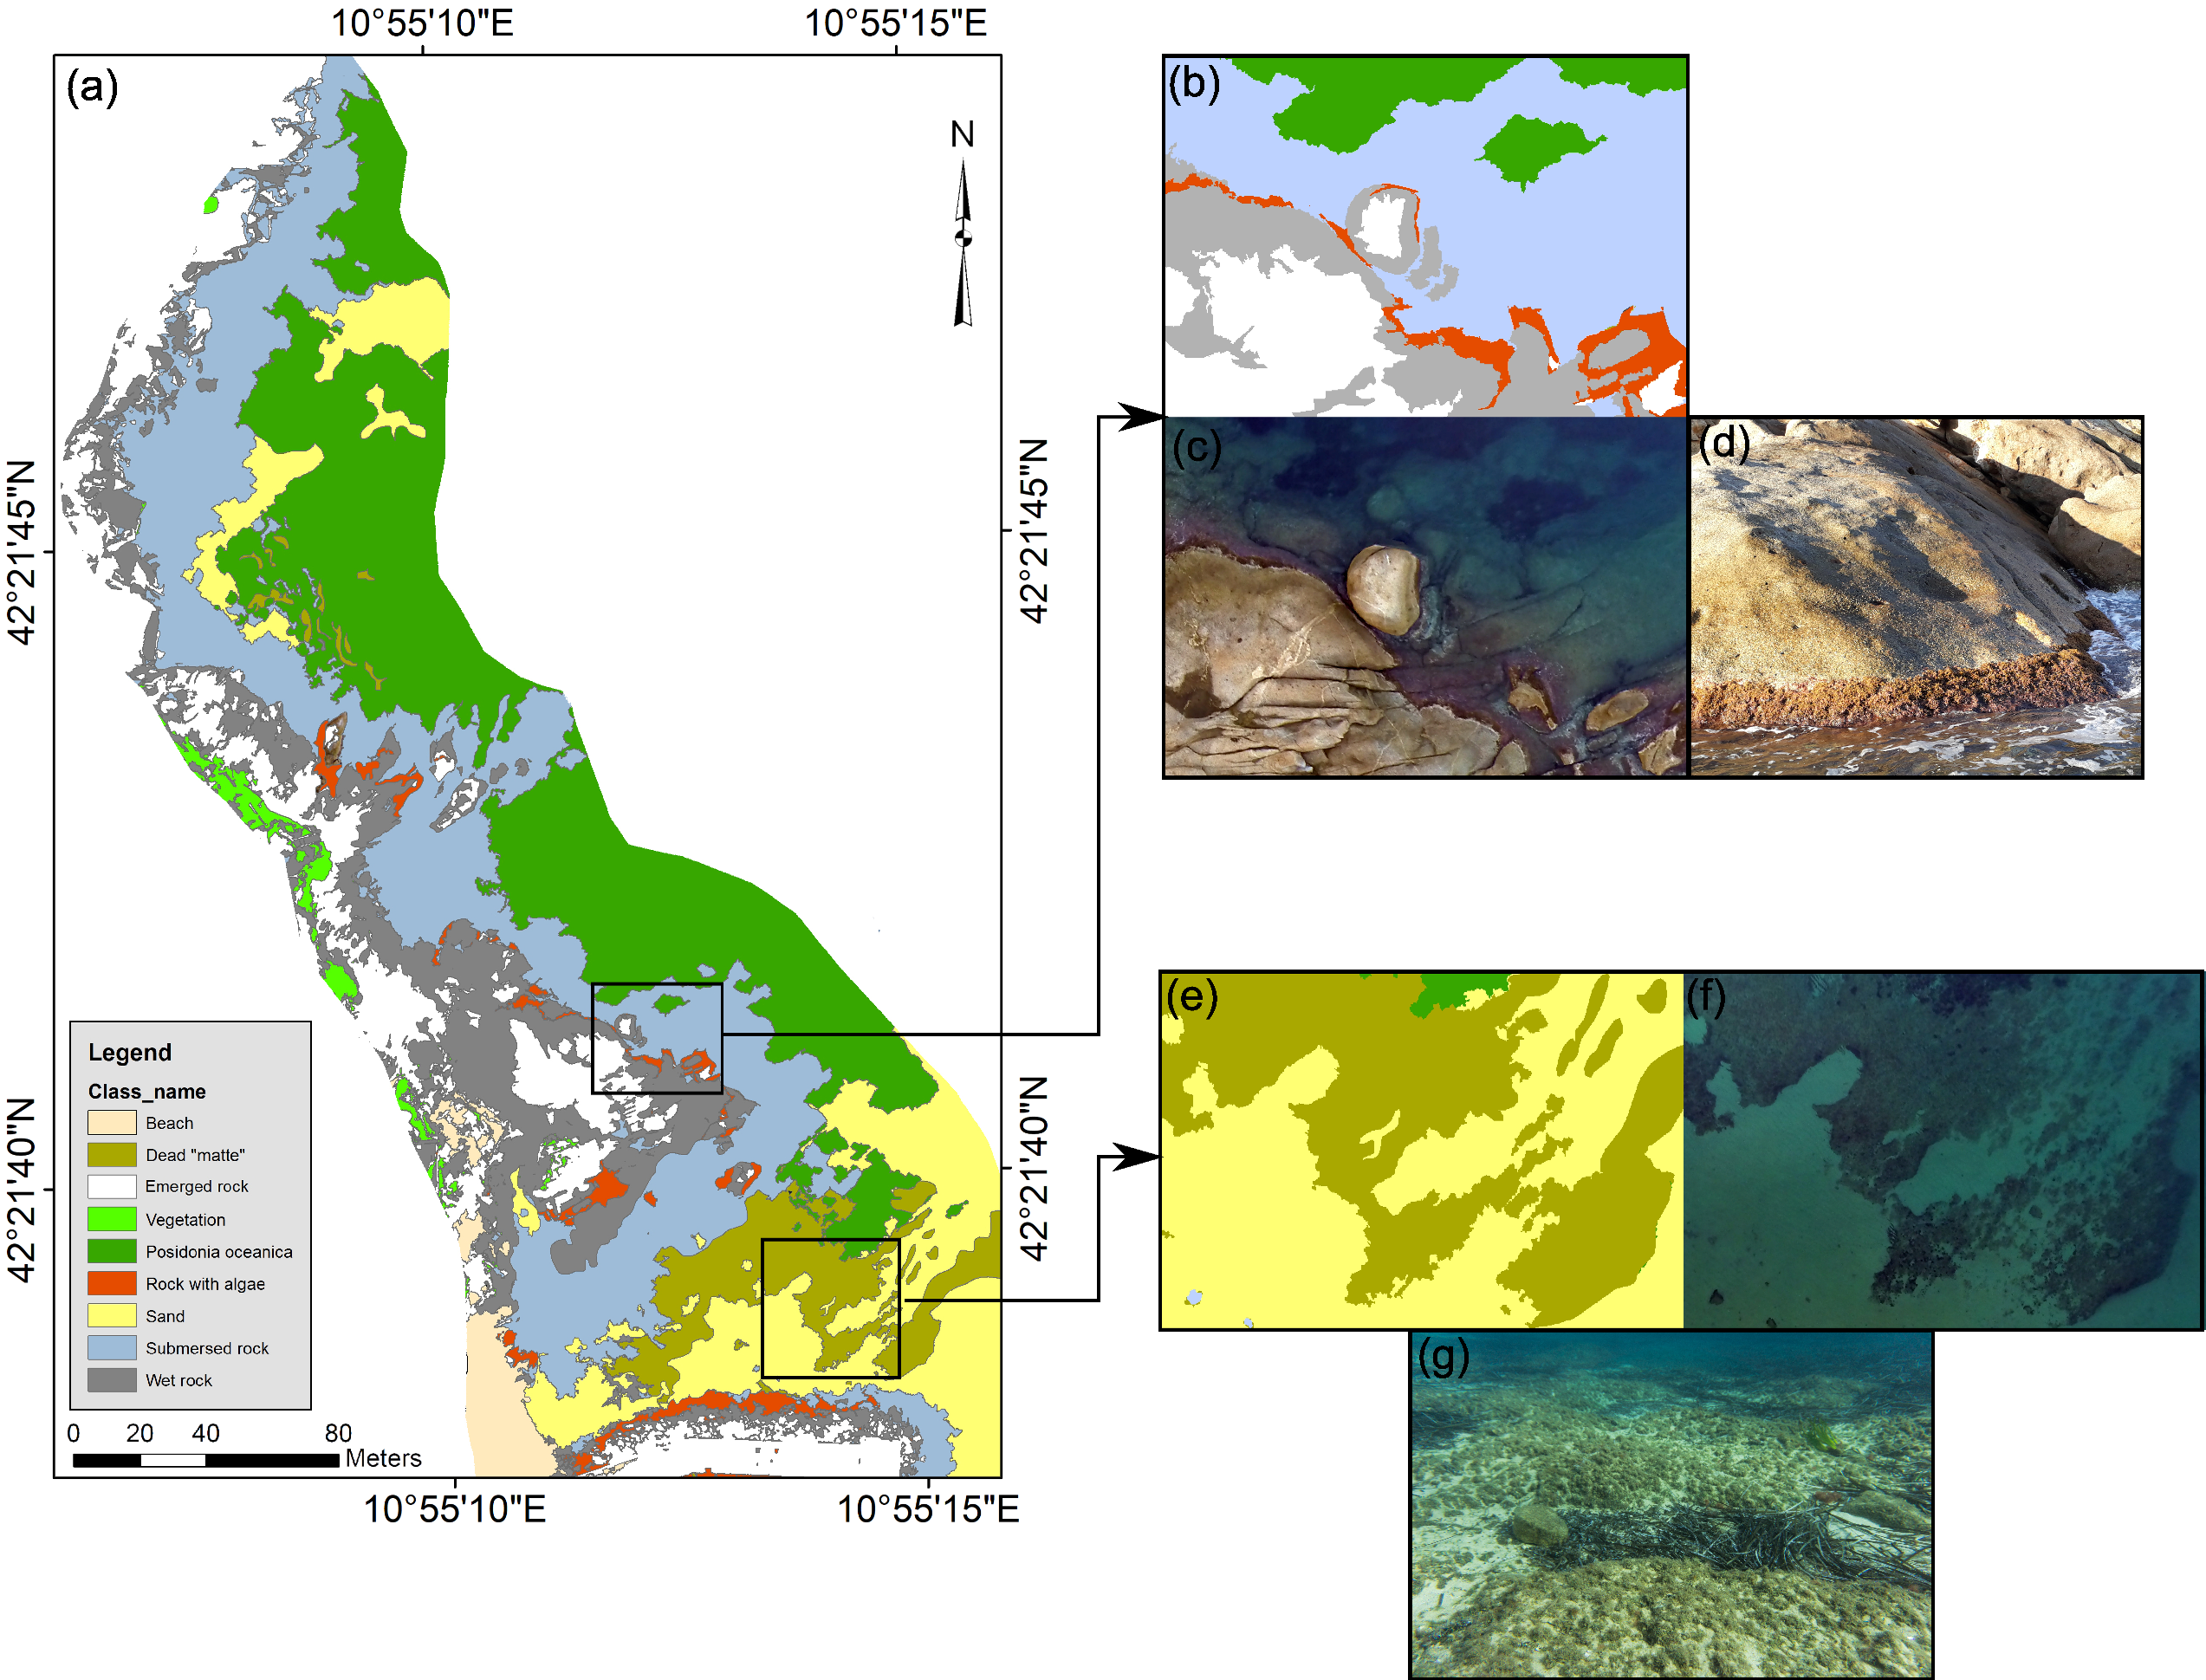
3.3. Sabellaria alveolata Biogenic Reefs

To evaluate the utility of the UAS-based imagery also along sandy coasts, characterized by the presence of Sabellaria alveolata reefs, two specific mission were carried out along Central Latium, approximately 33 km north (site S3) and 45 km south of Rome (Site S4). The two sites differ from each other because, in site S3, the biogenic reef is only present far from the coast, from 2 to 5 m depth. By contrast site S4 shows a Sabellaria reef also along the emerged part of the beach. In these areas, thematic map generation to highlight the characteristics of biogenic reefs is not an easy task, mainly due to water turbidity which often characterizes these shallow sandy environments. In addition, the polychaete worm Sabellaria builds its tube and forms large intertidal colonies by cementing sand grains with mucous secretions. Therefore, being made of sand, these reefs show a very similar spectral signature with neighbouring cover classes (sandy areas). However, despite these limiting factors, we achieved satisfactory classification accuracies (Tables S3 and S4) following OBIA workflow both for site S3 (Figure 9a,b) and for site S4 (Figure 10a,b). In fact, both sites had an overall accuracy >80%, however, site S3 showed a slightly lower level (moderate) of the Kappa index of agreement (0.77). As expected, the most misclassified classes were S. aleveolata bioconstructions (both considered as emerged or submerged reefs), incorrectly assigned to sandy areas of the bottom, emerged beach and submerged rocks. In addition, in site S3 also the submerged rocks tended to be misclassified as sand due to water turbidity and depth. Obviously, as in the other study cases a close examination of the imagery revealed variation in water surface perturbation throughout the orthomosaic (calm to light ripples, waves and whitecaps) that may have hindered classification of submerged features. Moreover, the accuracy of coastline segmentation and classification, depends on the complexity of the beach [33]. In fact, in complicated areas, such as the S4 site, where the beach is a mixture of rocks, algae formations, tree shadows and erosion gaps, the segmentation of the coastline is more difficult (inset of Figure 10b). Aside from the coastline, also the emerged sector of the reef consisting of small Sabellaria colonies (517 m2), are clearly visible over the whole extent of the mapped area (Figure 10c,d).

4. Discussion

Remote-sensing techniques have revolutionized spatial ecology by delivering very fine spatial resolution data, at user-controlled revisit periods, which would otherwise be difficult to study [19]. Off-the-shelf, survey-grade unmanned aerial platforms, data processing and analysis tools are now readily available to ecologists, botanists, and coastal engineers. In fact, the understanding of particular ecological processes and our capability in summarizing their variability trough further integration in geographical information systems (GIS) often depend on the spatial scale of the imagery, which in turn influences the selection of the rule set scale [37] during OBIA classification. In this context, UAVs have considerable potential to radically improve environmental monitoring [69]. Our research demonstrates that very high UAV-based data and multi-resolution segmentation (MRS) with specific rule sets can capture most variations for our land cover classes of sensitive costal habitats, providing appropriate data for maps production, at fine spatial and temporal resolutions and at reasonable costs. However, trade-offs regarding the subjectivity in the choice of scale parameter (SP) during MRS and specificity of rule sets are likely. For instance, MRS relies on the SP to control the internal (spectral) heterogeneity of the image objects and is therefore correlated with their average size, and then with the accuracy of the further classification [70]. However, the selection of SP is a trial-and-error optimisation which is based on a visual assessment of segmentation suitability making this procedure hardly reproducible [70,71].
Results are specific for our high–spatial resolution imagery concerning our three sensitive coastal habitats (P. oceanica meadows, rocky coast with nursery areas, and sandy areas with S. alveolata reefs) and should not automatically be extended to other typologies of shallow marine habitats (e.g., other phanerogames meadows, lagoons and coral reefs). Thus, one of the limitations of OBIA is that it is highly dependent both on the kind of imagery and on the user experience and will likely vary even among experienced analysts [37]. For these reasons, further research should include more consistent, and less subjective, procedures for the repeatability and parameterisation of feature selection during the OBIA workflow [70,72,73].
However, the approach used in this study concerning the utility of OBIA for the classification of shallow temperate marine environments which essentially increased the homogeneity of each object and increased our edge effect, reducing texture analysis possibilities [74] will likely be consistent for small-scale surveys and might provide a starting point for further studies, including multiple spatial resolutions and larger extents. Obviously, low spectral separation between classes, sunlight reflection, water transparency, and sea state are causes of cover class misclassification. However, if aerial imagery acquisition is performed during optimal wind/light conditions (our survey was carried out in the afternoon from 1600 to 1800 h with wind speeds less 5 m/s and clear water conditions) a more accurate image classification might be achieved.
In addition, UAV mapping and dense point-cloud generated by the SfM algorithms will probably become more and more used especially when the availability of off-the-shelf UAV, incorporating on-board precision real-time kinematic (RTK) GPS, will remove the need for any additional ground surveying or equipment (e.g., time-consuming pre-flight GCP displacements and their collection with D-GNSS system), allowing an accurate transformation from the ‘arbitrary’ coordinate system to the required real-world coordinate system [75]. In fact, despite the fact that the absolute positional accuracy of our data is rather poor (~2 m) because the use of a navigation-grade GPS receiver used for direct georeferencing, and we have not considered the effect of light breaking at the water/air interface according to Snell’s Law [57,76], our results show that consumer-grade drones can be effectively applied in the monitoring of coastal sensitive habitats at scales that lie between the typical scales of SCUBA surveys and those typical of airborne or satellite mapping, as also reported for coral reefs [50]. Additionally, because seabed surfaces can be visible through the water, with further processing it may be possible to quantify bathymetry from digital terrain models (DTMs) [28,77].
The use of UAVs is a major step toward more cost-effective and efficient operational monitoring and management of natural resources in the coastal zone. In fact, raster outputs produced from low-altitude aerial images using SfM, such as orthomosaic images and DEMs, demonstrate the degree to which landscape features are resolved in these products. High spatial and temporal resolution make it possible to detect local or very fast changes along shallow sensitive coastal habitats, offering an effective tool for the management and conservation of the coastal area. For instance, the anthropogenic disturbance acting on the three Mediterranean sensitive habitats, here considered, cannot be ascribed to a sole cause, but rather to a complex set of direct and indirect causes. In fact, the decline of seagrasses (including P. oceanica meadows) on a large spatial scale has been attributed to anthropic activities such as illegal trawling [78], fish farming [79], and pollution [80]. By contrast, on a smaller spatial scale, particularly in coastal areas subjected to intense recreational activity, meadows are impacted by mechanical damage caused by boat anchoring or moorings due to dragging anchors and scraping anchor chains along the bottom, generally resulting in dislodgement of plant rhizomes or leaves [40,81,82]. Thus, the understanding of within-meadow heterogeneity, highlighting the aforementioned negative effects of human activities through high-resolution UAV-based imagery can be a complementary approach to more traditional boundary mapping which has often been conducted using underwater SCUBA or remotely-operated vehicle (ROV) surveys [83].
Furthermore, along heterogeneous rocky coasts, often inaccessible due to the presence of abrupt rocky cliffs, drones bring the ability to capture useful data for environmental variation analysis. In fact, highlighting the most suitable areas that could serve as nursery grounds for fish is a key issue for the management of these nearshore ecosystems. The importance of nurseries is an established ecological concept accepted by scientists, conservation groups, managers, and cited as justification for the protection and conservation of these areas [84]. In fact, human pressure has changed the coastal strip [85], particularly through the construction of ports, beach nourishment and implants for fish farming, with no consideration for the possible effects induced by their construction on the connectivity dynamics of coastal fish species [86]. Given the essential role that nurseries play in the functioning of fish populations, drone-based remote sensing gives a great promise to investigate their status to inform researchers and managers for better manage conservation efforts. Moreover, to place our results in their wider context, the ability of delivering images of high spatial resolution, DEMs and accurate thematic maps can considerably improve also traditional techniques used along shallow marine habitats such as the Underwater Visual Census [87,88], often implying rich datasets regarding fish abundances and habitat characteristics which often need to be implemented into specific GIS. In fact, UAV-based imagery and SfM by depicting costal morphology, slope, orientation, and the geometry of underwater features can provide to ecologists a new tool to infer other important characteristics of nursery areas, leading to a more comprehensive understanding of the requirements needed by early life stages of costal fish species.
While UAVs cannot compete with satellite imagery in terms of spatial coverage, they provide unprecedented spatial and temporal resolutions unmatched by satellites, providing a key tool for coastal monitoring [69]. Conservation of the marine environment mainly focuses on threatened elements and more precisely on vulnerable species. Indeed, a pivotal issue for the management of sandy coasts would thereby acquire spatial data regarding the distribution of biogenic reefs which can increase biodiversity, are attractive feeding grounds for birds and fish, and have a high socio-economic implication [89]. In these context, biogenic reefs formed by the honeycomb worm Sabellaria alveolata become an important natural feature to be detected and monitored. In addition, human trampling is one of the main anthropogenic threats to coastal communities, especially for biogenic reefs [46]. Therefore UAV-based imagery coupled with SfM photogrammetry might be further refined to become a standardized, objective tool for monitoring these kinds of impacts and better understand the resilience capacity of the endangered biological inheritance represented by S. alveolata reefs [90]. We demonstrated that orthomosaics derived from a lightweight UAV coupled with OBIA can be successfully used to map emerged and submerged (up to 5 m depth) Sabellaria reefs. These environments result quite complex for mapping because they are characterized by high water turbidity, and strong water movements due to shallow depths resulting in spectral reflectance of whitecaps. Moreover, shadows of adjacent coastal features such as dune systems and trees may mask important areas. These aspects influence most remote-sensing classification processes, and although their effects can be minimized by collecting imagery during calm sea state and close to solar noon, or even just before sunset or sunrise, sea surface roughness and shadow inaccuracies often occur. However, as we have demonstrated, subdecimeter resolution remote sensing data, classified using OBIA methods have the potential to provide low-cost solutions for monitoring coastal sandy environments which contain key features that are potentially difficult to classify using spectral information contained within the pixels of airborne and satellite imagery.

5. Conclusions

Unmanned aerial vehicle -based remote sensing provides new advanced tool for the monitoring of key coastal areas, including sensitive shallow habitats, where often species are threatened by human activities. Our work provides an overview of some applications along three different coastal areas, testifying the great potential of these techniques along temperate environments. Within the regulatory constraints that determine their use, UAVs provide an efficient and cost-effective survey tool for mapping and measurement in the coastal zone. In fact, before undertaking research projects involving UAVs, we must consider national regulatory frameworks that impose restrictions, such as the maximum flight altitude, no fly zone, clear landing and take-off areas [75]. However, the evolution and perspectives of UAV-based applications looks very promising due to the relative low cost with respect to the benefits obtained. In fact, the field of ecology is severely hindered by the difficulties of acquiring scale-appropriate data of ecological processes, and land cover information at user-specified temporal resolutions with reasonable costs [19]. The results of this study demonstrate how the combination of two new remote sensing technologies in the form of UAVs and OBIA methods can be successfully combined to reach very fine mapping and classification of coastal habitats. High-resolution imagery allows rapid detection of key habitats and, thus, can be used to identify sensitive areas where management action should be implemented to improve or maintain habitat quality and biodiversity. Finally, we should consider that even if the camera equipment used herein only captures three colour (RGB) channels, more recent remote sensing technological developments show great promise for future research projects. For example, by adding the near infrared (NIR) sensors would not help during the classification of underwater features because of rapid absorption in the water column, however, it would help in classifying surfacing algae and vegetation (even beached or decomposing material) on beaches and rocks. However, in such cases, atmospheric and radiometric corrections need to be quantified in order to properly obtain radiance values for proper interpretation of vegetation presence through normalized difference vegetation index (NDVI), even if these effects are much lower in UAV than satellite images [91]. Moreover, in the next few years, it is likely that even higher accuracies will be obtained thanks to the development of a “fluid lens”, which is still experimental, but holds great promise [92]. In fact, due to rapid advances in technology and miniaturized components a wider spectrum of sensors, including multispectral, hyperspectral cameras, lightweight LiDAR systems are becoming more available on small aerial platforms [69].
Indeed, the combination of lightweight AUVs with image processing techniques and increasingly efficient software solutions can provide accurate systems for producing very high- resolution map of sensitive coastal areas that can be efficiently transformed into usable products for a broad range of ecological applications.

Supplementary Materials

The following data (ground truth survey information) and tables (S1, S2, S3 and S4) are available online at https://www.mdpi.com/2072-4292/10/9/1331/s1.

Author Contributions

D.V. conceived, designed, and performed the analysis, wrote the manuscript, provided the UAV, and conducted the UAV operations. A.B., M.F.G., A.B., and G.A. shared the project and assisted in writing the manuscript, and during the publishing process.

Funding

This research received no external funding. Any use of trade, firm, or product names is for descriptive purposes and had no role in the design of the study, in data collection or analyses.

Acknowledgments

We thank the three anonymous journal reviewers for their highly constructive feedback provided during the reviewing process that improved the manuscript.

Conflicts of Interest

The authors declare no conflict of interest.

References

  1. Laliberte, A.; Laliberte, A.; Herrick, J.E.; Winters, C.; Havstad, K.; Steele, C.; Browning, D. Unmanned aerial vehicle-based remote sensing for rangeland assessment, monitoring, and management. J. Appl. Remote Sens. 2009, 3, 033542. [Google Scholar] [CrossRef]
  2. Getzin, S.; Wiegand, K.; Schöning, I. Assessing biodiversity in forests using very high-resolution images and unmanned aerial vehicles. Methods Ecol. Evol. 2012, 3, 397–404. [Google Scholar] [CrossRef]
  3. Salamí, E.; Barrado, C.; Pastor, E. UAV flight experiments applied to the remote sensing of vegetated areas. Remote Sens. 2014, 6, 11051–11081. [Google Scholar] [CrossRef] [Green Version]
  4. Obanawa, H.; Hayakawa, Y.S.; Gomez, C. 3D modelling of inaccessible areas using uav-based aerial photography and structure from motion. In Chikei/Transactions, Japanese Geomorphological Union; Nihon Chikeigaku Rengō: Uji, Japan, 2014; Volume 35, pp. 283–294. [Google Scholar]
  5. Dauwalter, D.C.; Fesenmyer, K.A.; Bjork, R. Using aerial imagery to characterize redband trout habitat in a remote desert landscape. Trans. Am. Fish. Soc. 2015, 144, 1322–1339. [Google Scholar] [CrossRef]
  6. Honkavaara, E.; Saari, H.; Kaivosoja, J.; Pölönen, I.; Hakala, T.; Litkey, P.; Mäkynen, J.; Pesonen, L. Processing and assessment of spectrometric, stereoscopic imagery collected using a lightweight UAV spectral camera for precision agriculture. Remote Sens. 2013, 5, 5006–5039. [Google Scholar] [CrossRef] [Green Version]
  7. Peña, J.M.; Torres-Sánchez, J.; de Castro, A.I.; Kelly, M.; López-Granados, F. Weed Mapping in Early-Season Maize Fields Using Object-Based Analysis of Unmanned Aerial Vehicle (UAV) Images. PLoS ONE 2013, 8, e77151. [Google Scholar] [CrossRef] [PubMed]
  8. Vollgger, S.A.; Cruden, A.R. Mapping folds and fractures in basement and cover rocks using UAV photogrammetry, Cape Liptrap and Cape Paterson, Victoria, Australia. J. Struct. Geol. 2016, 85, 168–187. [Google Scholar] [CrossRef]
  9. Jones, G.P.I.; Pearlstine, L.G.; Percival, H.F. An Assessment of Small Unmanned Aerial Vehicles for Wildlife Research. Wildl. Soc. Bull. 2006, 34, 750–758. [Google Scholar] [CrossRef] [Green Version]
  10. Koh, L.P.; Wich, S.A. Dawn of drone ecology: Low-cost autonomous aerial vehicles for conservation. Trop. Conserv. Sci. 2012, 5, 121–132. [Google Scholar] [CrossRef] [Green Version]
  11. Linchant, J.; Lisein, J.; Semeki, J.; Lejeune, P.; Vermeulen, C. Are unmanned aircraft systems (UASs) the future of wildlife monitoring? A review of accomplishments and challenges. Mamm. Rev. 2015, 45, 239–252. [Google Scholar] [CrossRef]
  12. Wallace, L.; Lucieer, A.; Watson, C.; Turner, D. Development of a UAV-LiDAR system with application to forest inventory. Remote Sens. 2012, 4, 1519–1543. [Google Scholar] [CrossRef]
  13. Laliberte, A.S.; Herrick, J.E.; Rango, A.; Winters, C. Acquisition, Orthorectification, and Object-based Classification of Unmanned Aerial Vehicle (UAV) Imagery for Rangeland Monitoring. Photogramm. Eng. Remote Sens. 2010, 76, 661–672. [Google Scholar] [CrossRef]
  14. Casbeer, D.W.; Li, S.-M.; Beard, R.W.; Mehra, R.K.; McLain, T.W. Forest fire monitoring with multiple small UAVs. In Proceedings of the 2005 American Control Conference, Portland, OR, USA, 8–10 June 2015; IEEE: New York, NY, USA, 2005; pp. 3530–3535. [Google Scholar]
  15. Meyer, D.; Hess, M.; Lo, E.; Wittich, C.E.; Hutchinson, T.C.; Kuester, F. UAV-based post disaster assessment of cultural heritage sites following the 2014 South Napa Earthquake. In Proceedings of the 2015 Digital Heritage International Congress, Digital Heritage, Granada, Spain, 28 September–2 October 2015; IEEE: New York, NY, USA, 2015; Volume 2, pp. 421–424. [Google Scholar]
  16. Bamler, R.; Hartl, P. Synthetic aperture radar interferometry. Inverse Probl. 1998, 14, R1. [Google Scholar] [CrossRef]
  17. Malenovský, Z.; Rott, H.; Cihlar, J.; Schaepman, M.E.; García-Santos, G.; Fernandes, R.; Berger, M. Sentinels for science: Potential of Sentinel-1,-2, and-3 missions for scientific observations of ocean, cryosphere, and land. Remote Sens. Environ. 2012, 120, 91–101. [Google Scholar] [CrossRef]
  18. Geudtner, D.; Torres, R.; Snoeij, P.; Davidson, M.; Rommen, B. Sentinel-1 system capabilities and applications. In Proceedings of the 2014 IEEE Geoscience and Remote Sensing Symposium (IGARSS), Quebec City, QC, Canada, 13–18 July 2014; IEEE: New York, NY, USA, 2014; pp. 1457–1460. [Google Scholar]
  19. Anderson, K.; Gaston, K.J. Lightweight unmanned aerial vehicles will revolutionize spatial ecology. Front. Ecol. Environ. 2013, 11, 138–146. [Google Scholar] [CrossRef] [Green Version]
  20. Colefax, A.P.; Butcher, P.A.; Kelaher, B.P. The potential for unmanned aerial vehicles (UAVs) to conduct marine fauna surveys in place of manned aircraft. ICES J. Mar. Sci. 2018, 75, 1–8. [Google Scholar] [CrossRef]
  21. Zarco-Tejada, P.J.; Diaz-Varela, R.; Angileri, V.; Loudjani, P. Tree height quantification using very high resolution imagery acquired from an unmanned aerial vehicle (UAV) and automatic 3D photo-reconstruction methods. Eur. J. Agron. 2014, 55, 89–99. [Google Scholar] [CrossRef] [Green Version]
  22. Getzin, S.; Nuske, R.S.; Wiegand, K. Using unmanned aerial vehicles (UAV) to quantify spatial gap patterns in forests. Remote Sens. 2014, 6, 6988–7004. [Google Scholar] [CrossRef]
  23. Lucieer, A.; Turner, D.; King, D.H.; Robinson, S.A. Using an unmanned aerial vehicle (UAV) to capture micro-topography of antarctic moss beds. Int. J. Appl. Earth Obs. Geoinf. 2014, 27, 53–62. [Google Scholar] [CrossRef]
  24. Torres-sánchez, J.; Arquero, O.; Torres-sánchez, J.; López-granados, F.; Serrano, N.; Arquero, O. High-Throughput 3-D Monitoring of Agricultural-Tree Plantations with Unmanned Aerial Vehicle (UAV) Technology High-Throughput 3-D Monitoring of Agricultural-Tree Plantations with Unmanned Aerial Vehicle (UAV) Technology. PLoS ONE 2015, 10, e0130479. [Google Scholar] [CrossRef] [PubMed]
  25. Schiffman, R. Drones flying high as new tool for field biologists. Science 2014, 344, 459. [Google Scholar] [CrossRef] [PubMed]
  26. Gonzalez, L.F.; Montes, G.A.; Puig, E.; Johnson, S.; Mengersen, K.; Gaston, K.J. Unmanned aerial vehicles (UAVs) and artificial intelligence revolutionizing wildlife monitoring and conservation. Sensors (Switzerland) 2016, 16, 97. [Google Scholar] [CrossRef] [PubMed] [Green Version]
  27. Casado, M.R.; Gonzalez, R.B.; Kriechbaumer, T.; Veal, A. Automated identification of river hydromorphological features using UAV high resolution aerial imagery. Sensors (Switzerland) 2015, 15, 27969–27989. [Google Scholar] [CrossRef] [PubMed] [Green Version]
  28. Tamminga, A.; Hugenholtz, C.; Eaton, B.; Lapointe, M. Hyperspatial Remote Sensing of Channel Reach Morphology and Hydraulic Fish Habitat Using an Unmanned Aerial Vehicle (UAV): A First Assessment in the Context of River Research and Management. River Res. Appl. 2015, 31, 379–391. [Google Scholar] [CrossRef]
  29. Carvell, A.C.; Osborne, J.L.; Bourke, A.F.G.; Freeman, S.N.; Pywell, R.F.; Applications, E.; Carvell, C. Bumble Bee Species’ Responses to a Targeted Conservation Measure Depend on Landscape Context and Habitat Quality. Ecol. Appl. 2015, 21, 1760–1771. Available online: http://www.jstor.org/stable/23023115 (accessed on 20 April 2018). [CrossRef] [Green Version]
  30. Laliberte, A.S.; Rango, A. Image Processing and Classification Procedures for Analysis of Sub-decimeter Imagery Acquired with an Unmanned Aircraft over Arid Rangelands. GISci. Remote Sens. 2011, 48, 4–23. [Google Scholar] [CrossRef]
  31. Blaschke, T. Object Based Image Analysis for Remote Sensing. J. Photogramm. Remote Sens. 2010, 65, 2–16. [Google Scholar] [CrossRef]
  32. Lehmann, J.R.K.; Nieberding, F.; Prinz, T.; Knoth, C. Analysis of unmanned aerial system-based CIR images in forestry—A new perspective to monitor pest infestation levels. Forests 2015, 6, 594–612. [Google Scholar] [CrossRef] [Green Version]
  33. Papakonstantinou, A.; Topouzelis, K.; Pavlogeorgatos, G. Coastline Zones Identification and 3D Coastal Mapping Using UAV Spatial Data. ISPRS Int. J. Geo-Inf. 2016, 5, 75. [Google Scholar] [CrossRef]
  34. Duffy, J.P.; Pratt, L.; Anderson, K.; Land, P.E.; Shutler, J.D. Spatial assessment of intertidal seagrass meadows using optical imaging systems and a lightweight drone. Estuar. Coast. Shelf Sci. 2018, 200, 169–180. [Google Scholar] [CrossRef]
  35. Topouzelis, K.; Doukari, M.; Papakonstantinou, A.; Stamatis, P.; Makri, D.; Katsanevakis, S. Coastal habitat mapping in the Aegean Sea using high resolution orthophoto maps. In Proceedings of the Fifth International Conference on Remote Sensing and Geoinformation of the Environment (RSCy2017), Paphos, Cyprus, 20–23 March 2017; International Society for Optics and Photonics: Bellingham, WA, USA, 2017; Volume 10444, p. 52. [Google Scholar]
  36. Lechner, A.M.; Fletcher, A.; Johansen, K.; Erskine, P. Characterising Upland Swamps Using Object-Based Classification Methods and Hyper-Spatial Resolution Imagery Derived From an Unmanned Aerial Vehicle. ISPRS Ann. Photogramm. Remote Sens. Spat. Inf. Sci. 2012, 4, 101–106. [Google Scholar] [CrossRef]
  37. Hulet, A.; Roundy, B.A.; Petersen, S.L.; Jensen, R.R.; Bunting, S.C. Cover estimations using object-based image analysis rule sets developed across multiple scales in pinyon-juniper woodlands. Rangel. Ecol. Manag. 2014, 67, 318–327. [Google Scholar] [CrossRef]
  38. Claudet, J.; Fraschetti, S. Human-driven impacts on marine habitats: A regional meta-analysis in the Mediterranean Sea. Biol. Conserv. 2010, 143, 2195–2206. [Google Scholar] [CrossRef]
  39. Peres, J.M.; Picard, J. Causes de la rarefaction et de la disparition des herbiers de Posidonia oceanica sur les cotes Francaises de la Mediterranee Causes of decrease and disappearance of the seagrass Posidonia oceanica on the French Mediterranean coast. Aquat. Bot. 1975, 1, 133–139. [Google Scholar] [CrossRef]
  40. Milazzo, M.; Badalamenti, F.; Ceccherelli, G.; Chemello, R. Boat anchoring on Posidonia oceanica beds in a marine protected area (Italy, western Mediterranean): Effect of anchor types in different anchoring stages. J. Exp. Mar. Bio. Ecol. 2004, 299, 51–62. [Google Scholar] [CrossRef]
  41. Boudouresque, C.F.; Bernard, G.; Pergent, G.; Shili, A.; Verlaque, M. Regression of Mediterranean seagrasses caused by natural processes and anthropogenic disturbances and stress: A critical review. Bot. Mar. 2009, 52, 395–418. [Google Scholar] [CrossRef]
  42. Vigliola, L.; Harmelin-Vivien, M.L.; Biagi, F.; Galzin, R.; Garcia-Rubies, A.; Harmelin, J.G.; Jouvenel, J.Y.; Direach-Boursier, L.L.; Macpherson, E.; Tunesi, L. Spatial and temporal patterns of settlement among sparid fishes of the genus Diplodus in the northwestern Mediterranean. Mar. Ecol. Prog. Ser. 1998, 168, 45–56. [Google Scholar] [CrossRef] [Green Version]
  43. Naylor, L.A.; Viles, H.A. A temperate reef builder: An evaluation of the growth, morphology and composition of Sabellaria alveolata (L.) colonies on carbonate platforms in South Wales. Geol. Soc. Lond. Spec. Publ. 2000, 178, 9–19. [Google Scholar] [CrossRef]
  44. Gubbay, S.; Sanders, N.; Haynes, T.; Janssen, J.A.M.; Rodwell, J.R.; Nieto, S.; Garcia Criado, M.; Beal, S.; Borg, J.; Kennedy, M. European Red List of Habitats. Part 1. Marine Habitats; European Commission: Brussels, Belgium, 2016. [Google Scholar]
  45. Desroy, N.; Dubois, S.F.; Fournier, J.; Ricquiers, L.; Le Mao, P.; Guérin, L.; Gerla, D.; Rougerie, M.; Legendre, A. The conservation status of Sabellaria alveolata (L.) (Polychaeta: Sabellariidae) reefs in the Bay of Mont-Saint-Michel. Aquat. Conserv. Mar. Freshw. Ecosyst. 2011, 21, 462–471. [Google Scholar] [CrossRef]
  46. Plicanti, A.; Domínguez, R.; Dubois, S.F.; Bertocci, I. Human impacts on biogenic habitats: Effects of experimental trampling on Sabellaria alveolata (Linnaeus, 1767) reefs. J. Exp. Mar. Biol. Ecol. 2016, 478, 34–44. [Google Scholar] [CrossRef]
  47. Casoli, E.; Ventura, D.; Cutroneo, L.; Capello, M.; Jona-Lasinio, G.; Rinaldi, R.; Criscoli, A.; Belluscio, A.; Ardizzone, G.D. Assessment of the impact of salvaging the Costa Concordia wreck on the deep coralligenous habitats. Ecol. Indic. 2017, 80, 124–134. [Google Scholar] [CrossRef]
  48. Gravina, M.F.; Cardone, F.; Bonifazi, A.; Bertrandino, M.S.; Chimienti, G.; Longo, C.; Marzano, C.N.; Moretti, M.; Lisco, S.; Moretti, V. Sabellaria spinulosa (Polychaeta, Annelida) reefs in the Mediterranean Sea: Habitat mapping, dynamics and associated fauna for conservation management. Estuar. Coast. Shelf Sci. 2018, 200, 248–257. [Google Scholar] [CrossRef]
  49. Ventura, D.; Bonifazi, A.; Gravina, M.F.; Ardizzone, G.D. Unmanned Aerial Systems (UASs) for Environmental Monitoring: A Review with Applications in Coastal Habitats. In Aerial Robots-Aerodynamics, Control and Applications; InTech: Vienna, Austria, 2017. [Google Scholar] [Green Version]
  50. Casella, E.; Collin, A.; Harris, D.; Ferse, S.; Bejarano, S.; Parravicini, V.; Hench, J.L.; Rovere, A. Mapping coral reefs using consumer-grade drones and structure from motion photogrammetry techniques. Coral Reefs 2017, 36, 269–275. [Google Scholar] [CrossRef]
  51. Turner, D.; Lucieer, A.; Watson, C. An automated technique for generating georectified mosaics from ultra-high resolution unmanned aerial vehicle (UAV) imagery, based on structure from motion. Remote Sens. 2012, 4, 1392–1410. [Google Scholar] [CrossRef]
  52. Pfeifer, N.; Glira, P.; Briese, C. Direct georeferencing with on board navigation components of light weight UAV platforms. Int. Arch. Photogramm. Remote Sens. Spat. Inf. Sci. 2012, 39, 487–492. [Google Scholar] [CrossRef]
  53. Agisoft LLC. St. Petersburg, Russia. Agisoft PhotoScan User Manual, Professional Edition, Version 1.4. 2016, pp. 1–124. Available online: http://www.agisoft.com (accessed on 10 July 2018).
  54. Zweig, C.L.; Burgess, M.A.; Percival, H.F.; Kitchens, W.M. Use of Unmanned Aircraft Systems to Delineate Fine-Scale Wetland Vegetation Communities. Wetlands 2015, 35, 303–309. [Google Scholar] [CrossRef]
  55. De Reu, J.; Plets, G.; Verhoeven, G.; De Smedt, P.; Bats, M.; Cherretté, B.; De Maeyer, W.; Deconynck, J.; Herremans, D.; Laloo, P.; et al. Towards a three-dimensional cost-effective registration of the archaeological heritage. J. Archaeol. Sci. 2013, 40, 1108–1121. [Google Scholar] [CrossRef]
  56. Balletti, C.; Guerra, F.; Tsioukas, V.; Vernier, P. Calibration of action cameras for photogrammetric purposes. Sensors 2014, 14, 17471–17490. [Google Scholar] [CrossRef] [PubMed]
  57. Woodget, A.S.; Carbonneau, P.E.; Visser, F.; Maddock, I.P. Quantifying submerged fluvial topography using hyperspatial resolution UAS imagery and structure from motion photogrammetry. Earth Surf. Process. Landf. 2015, 40, 47–64. [Google Scholar] [CrossRef]
  58. eCognition Developer 8.7—Reference Book; Trimble: Munich, Germany, 2011; pp. 30–31.
  59. Trimble eCognition Developer 8.7 Reference; Trimble Germany GmbH: Munich, Germany, 2011.
  60. Kavzoglu, T.; Yildiz, M. Parameter-Based Performance Analysis of Object-Based Image Analysis Using Aerial and Quikbird-2 Images. ISPRS Ann. Photogramm. Remote Sens. Spat. Inf. Sci. 2014, II-7, 31–37. [Google Scholar] [CrossRef]
  61. Foody, G.M. Status of land cover classification accuracy assessment. Remote Sens. Environ. 2002, 80, 185–201. [Google Scholar] [CrossRef]
  62. Congalton, R.G.; Green, K. Assessing the Accuracy of Remotely Sensed Data: Principles and Practices; CRC Press: Boca Raton, FL, USA, 2002; ISBN 9781420048568. [Google Scholar]
  63. Sim, J.; Wright, C.C. Interpretation, and Sample Size Requirements The Kappa Statistic in Reliability Studies: Use, Interpretation, and Sample Size Requirements. Phys. Ther. 2005, 85, 257–268. [Google Scholar] [CrossRef] [PubMed]
  64. Mateo, M.Á.; Sánchez-Lizaso, J.L.; Romero, J. Posidonia oceanica “banquettes”: A preliminary assessment of the relevance for meadow carbon and nutrients budget. Estuar. Coast. Shelf Sci. 2003, 56, 85–90. [Google Scholar] [CrossRef]
  65. Harmelin-Vivien, M.L.; Harmelin, J.G.; Leboulleux, V. Microhabitat requirements for settlement of juvenile sparid fishes on Mediterranean rocky shores. Hydrobiologia 1995, 300–301, 309–320. [Google Scholar] [CrossRef]
  66. Ventura, D.; Jona Lasinio, G.; Ardizzone, G. Temporal partitioning of microhabitat use among four juvenile fish species of the genus Diplodus (Pisces: Perciformes, Sparidae). Mar. Ecol. 2015, 36, 1013–1032. [Google Scholar] [CrossRef]
  67. Lasinio, G.J.; Tullio, M.A.M.A.; Ventura, D.; Ardizzone, G.; Abdelahad, N.; Jona Lasinio, G.; Tullio, M.A.M.A.; Ventura, D.; Ardizzone, G.; Abdelahad, N.; et al. Statistical analysis of the distribution of infralittoral Cystoseira populations on pristine coasts of four Tyrrhenian islands: Proposed adjustment to the CARLIT index. Ecol. Indic. 2017, 73, 293–301. [Google Scholar] [CrossRef]
  68. Cheminée, A.; Pastor, J.; Bianchimani, O.; Thiriet, P.; Sala, E.; Cottalorda, J.-M.; Dominici, J.-M.; Lejeune, P.; Francour, P. Juvenile fish assemblages in temperate rocky reefs are shaped by the presence of macro-algae canopy and its three-dimensional structure. Sci. Rep. 2017, 7, 14638. [Google Scholar] [CrossRef] [PubMed] [Green Version]
  69. Manfreda, S.; McCabe, M.F.; Miller, P.E.; Lucas, R.; Pajuelo Madrigal, V.; Mallinis, G.; Ben Dor, E.; Helman, D.; Estes, L.; Ciraolo, G. On the Use of Unmanned Aerial Systems for Environmental Monitoring. Remote Sens. 2018, 10, 641. [Google Scholar] [CrossRef]
  70. Drăguţ, L.; Eisank, C. Automated object-based classification of topography from SRTM data. Geomorphology 2012, 141, 21–33. [Google Scholar] [CrossRef] [PubMed]
  71. Whiteside, T.G.; Boggs, G.S.; Maier, S.W. Comparing object-based and pixel-based classifications for mapping savannas. Int. J. Appl. Earth Obs. Geoinf. 2011, 13, 884–893. [Google Scholar] [CrossRef]
  72. Espindola, G.M.; Câmara, G.; Reis, I.A.; Bins, L.S.; Monteiro, A.M. Parameter selection for region-growing image segmentation algorithms using spatial autocorrelation. Int. J. Remote Sens. 2006, 27, 3035–3040. [Google Scholar] [CrossRef]
  73. Drǎguţ, L.; Tiede, D.; Levick, S.R. ESP: A tool to estimate scale parameter for multiresolution image segmentation of remotely sensed data. Int. J. Geogr. Inf. Sci. 2010, 24, 859–871. [Google Scholar] [CrossRef]
  74. Laliberte, A.S.; Rango, A. Texture and scale in object-based analysis of subdecimeter resolution unmanned aerial vehicle (UAV) imagery. IEEE Trans. Geosci. Remote Sens. 2009, 47, 761–770. [Google Scholar] [CrossRef]
  75. Turner, I.L.; Harley, M.D.; Drummond, C.D. UAVs for coastal surveying. Coast. Eng. 2016, 114, 19–24. [Google Scholar] [CrossRef]
  76. Lejot, J.; Delacourt, C.; Piégay, H.; Fournier, T.; Trémélo, M.; Allemand, P. Very high spatial resolution imagery for channel bathymetry and topography from an unmanned mapping controlled platform. Earth Surf. Process. Landf. J. Br. Geomorphol. Res. Gr. 2007, 32, 1705–1725. [Google Scholar] [CrossRef]
  77. Puttock, A.K.; Cunliffe, A.M.; Anderson, K.; Brazier, R.E. Aerial photography collected with a multirotor drone reveals impact of Eurasian beaver reintroduction on ecosystem structure. J. Unmanned Veh. Syst. 2015, 3, 123–130. [Google Scholar] [CrossRef]
  78. Kiparissis, S.; Fakiris, E.; Papatheodorou, G.; Geraga, M.; Kornaros, M.; Kapareliotis, A.; Ferentinos, G. Illegal trawling and induced invasive algal spread as collaborative factors in a Posidonia oceanica meadow degradation. Biol. Invasions 2011, 13, 669–678. [Google Scholar] [CrossRef]
  79. Delgado, O.; Ruiz, J.; Pérez, M.; Romero, J.; Ballesteros, E. Effects of fish farming on seagrass (Posidonia oceanica) in a Mediterranean bay: Seagrass decline after organic loading cessation. Oceanol. Acta 1999, 22, 109–117. [Google Scholar] [CrossRef]
  80. Ruiz, J.M.; Romero, J. Effects of disturbances caused by coastal constructions on spatial structure, growth dynamics and photosynthesis of the seagrass Posidonia oceanica. Mar. Pollut. Bull. 2003, 46, 1523–1533. [Google Scholar] [CrossRef] [PubMed]
  81. Walker, D.I.; Lukatelich, R.J.; Bastyan, G.; McComb, A.J. Effect of boat moorings on seagrass beds near Perth, Western Australia. Aquat. Bot. 1989, 36, 69–77. [Google Scholar] [CrossRef]
  82. Francour, P.; Ganteaume, A.; Poulain, M. Effects of boat anchoring in Posidonia oceanica seagrass beds in the Port-Cros National Park (north-western Mediterranean Sea). Aquat. Conserv. Mar. Freshw. Ecosyst. 1999, 9, 391–400. [Google Scholar] [CrossRef]
  83. Montefalcone, M.; Baudana, M.; Venturini, S.; Lasagna, R.; Bianchi, C.N.; Albertelli, G. Distribuzione spaziale delle praterie di Posidonia oceanica nell’Area Marina Protetta di Portofino. Biol. Mar. Mediterr. 2006, 13, 90–91. [Google Scholar]
  84. Beck, M.W.; Heck, K.L., Jr.; Able, K.W.; Childers, D.L.; Eggleston, D.B.; Gillanders, B.M.; Halpern, B.; Hays, C.G.; Hoshino, K.; Minello, T.J. The identification, conservation, and management of estuarine and marine nurseries for fish and invertebrates: A better understanding of the habitats that serve as nurseries for marine species and the factors that create site-specific variability in nurse. Bioscience 2001, 51, 633–641. [Google Scholar] [CrossRef]
  85. Pastor, J.; Koeck, B.; Astruch, P.; Lenfant, P. Coastal man-made habitats: Potential nurseries for an exploited fish species, Diplodus sargus (Linnaeus, 1758). Fish. Res. 2013, 148, 74–80. [Google Scholar] [CrossRef]
  86. JoNeS, G.P.; SriNiVaSaN, M.; Almany, G.R. Population connectivity and conservation of marine biodiversity. Oceanography 2007, 20, 100–111. [Google Scholar] [CrossRef]
  87. Friedlander, A.M.; Parrish, J.D. Habitat characteristics affecting fish assemblages on a Hawaiian coral reef. J. Exp. Mar. Biol. Ecol. 1998, 224, 1–30. [Google Scholar] [CrossRef]
  88. De La Moriniere, E.C.; Pollux, B.J.A.; Nagelkerken, I.; Van der Velde, G. Post-settlement life cycle migration patterns and habitat preference of coral reef fish that use seagrass and mangrove habitats as nurseries. Estuar. Coast. Shelf Sci. 2002, 55, 309–321. [Google Scholar] [CrossRef] [Green Version]
  89. Godet, L.; Toupoint, N.; Olivier, F.; Fournier, J.; Retière, C. Considering the functional value of common marine species as a conservation stake: The case of sandmason worm Lanice conchilega (Pallas 1766) (Annelida, Polychaeta) beds. Ambio J. Hum. Environ. 2008, 37, 347–355. [Google Scholar] [CrossRef]
  90. Dubois, S.; Comtet, T.; Retière, C.; Thiébaut, E. Distribution and retention of Sabellaria alveolata larvae (Polychaeta: Sabellariidae) in the Bay of Mont-Saint-Michel, France. Mar. Ecol. Prog. Ser. 2007, 346, 243–254. [Google Scholar] [CrossRef]
  91. Ballari, D.; Orellana, D.; Acosta, E.; Espinoza, A.; Morocho, V. Uav Monitoring for Environmental Management in Galapagos Islands. Int. Arch. Photogramm. Remote Sens. Spat. Inf. Sci. 2016, 41, 1105–1111. [Google Scholar] [CrossRef]
  92. Chirayath, V.; Earle, S.A. Drones that see through waves—Preliminary results from airborne fluid lensing for centimetre-scale aquatic conservation. Aquat. Conserv. Mar. Freshw. Ecosyst. 2016, 26, 237–250. [Google Scholar] [CrossRef]
Figure 1. Location of the four surveyed areas where sensitive coastal marine habitats are present. In particular, Giglio Island (a) show Posidonia oceanica meadows (site S1) and shallow rocky habitats suitable for the settlement of juvenile fish (site S2), on the other hand along the Latium Coast; (b) the presence of sandy areas constitutes a favourable environment for the formation of submerged (sites S3) and intertidal (site S4) biogenic reefs built by the polychaete worm Sabellaria alveolata.
Remotesensing 10 01331 g001
Figure 2. The modified lightweight quadcopter used in this study (a) and a schematic representation; (b) of the integrated navigation and autopilot systems (APM 2.5).
Remotesensing 10 01331 g002
Figure 3. Schematic drawing displaying a typical aerial survey grid used during Unmanned Aerial Vehicle (UAV) mapping (a). Light blue rectangles indicate the image footprint and blue areas the cross-track and in-track overlaps, dotted black line represents the fly path and green dots within the flight path represent the location of the camera at the time of capturing each photograph. In (b) is represented a snapshot from the grid configuration panel in Mission Planner before the aerial acquisition was carried out in the S4 site.
Remotesensing 10 01331 g003
Figure 4. Typical acquisition and processing pipeline regarding acquisition, planning and processing of UAV-based aerial images (a) and object-based image analysis (OBIA) segmentation and classification of marine habitats (b).
Remotesensing 10 01331 g004
Figure 5. High-resolution orthophoto (2.76 cm/pix) of the Posidonia oceanica meadow in front of the beach of Cannelle (a). Important underwater features characterizing this environment are shown trough underwater photos used as ground truth data. P. oceanica seagrass meadow (b), patch formation of the seagrass on rocks (c) and sand (d), dead leaves of Posidonia oceanica lying on the sea bottom (e), impacted areas from boat anchoring with exposed root-rhizomes (f), and accumulation areas of beached leaves and rhizomes (g).
Remotesensing 10 01331 g005
Figure 6. Segmentation results of the S1 site after OBIA methods (a) clearly demonstrate that the complex meadow area has been successfully segmented into different image objects and subsequently correctly classified into eight cover classes, producing a high-quality thematic map (b).
Remotesensing 10 01331 g006aRemotesensing 10 01331 g006b
Figure 7. The orthomosaic generated by 160 overlapping images representing the rocky coastline of the S2 site (a). Red frames highlight the two small coves were the presence of particular natural features such as sandy patches, pebbles and large boulders made these areas suitable for settlement of juvenile sparid fish. The generated 3D outputs from structure from motion (SfM) routine: The 3D model (b) and digital elevation model (c) demonstrate the detail level to which coastal features are resolved in these products. Note that the elevation reported are affected by the effect of light breaking at the water/air interface.
Remotesensing 10 01331 g007
Figure 8. The classified orthophoto (a) through OBIA method of the S2 site showing some important features characterizing this coastal environment, such as arborescent macro-algae (Cystoseira spp.) belts (bd); and a degraded area of the P. oceanica meadow (represented by dead ‘matte’) near to the port (eg).
Remotesensing 10 01331 g008
Figure 9. High-resolution orthomosaic of the site S3 (a) representing a sandy coast with underwater formation of reef-building tube worm Sabellaria alveolata. Thematic map of the same areas generated after image segmentation and classification through OBIA algorithm (b).
Remotesensing 10 01331 g009
Figure 10. Orthomosaic of the S4 site (a) generated through UAV imagery representing a complex sandy/rocky coast with both a submerged and an emerged (highlighted area) reef of Sabellaria alveolata. Raster map produced after segmentation and classification following OBIA routine (b). The inset shows the effects of tree shadows during segmentation steps, leading to the misclassification of the emerged beach. Detailed view (c) of the emerged reef (1:500) and the same area after image classification performed by the OBIA algorithm (d).
Remotesensing 10 01331 g010
Table 1. GoPro Hero 4 black edition camera specifics and its relative field of views (FOVs).
PartsSpecifics
ModelGoPro Hero 4 Black Editition
Camera41 mm × 59 mm × 31 mm (H × W × D), 88 g
Battery28 mm × 35 mm × 13 mm (H × W × D), 28 g
ShutterRolling
Sensor
TypeHD CMOS 6.17 mm × 4.55 mm, 5.5 g
Focal length2.77 mm
Pixel size1.55 µm
Aperture (f Stop)f/2.8
Native megapixel support12 MP
35 mm Equivalent Field of View (FOV)
Wide (W)17.2 mm
Medium (M)21.9 mm
Narrow (N)34.4 mm
Verical FOV in degrees4:3 (W) = 94.4; 4:3 (M) = 72.2; 4:3 (N) = 49.1; 16:9 (W) = 69.5; 16:9 (M) = 55; 16:9 (N) = 37.2
Horizontal FOV in degrees4:3 (W) = 122.6; 4:3 (M) = 94.4; 4:3 (N) = 64.6; 16:9 (W) = 118.2; 16:9 (M) = 94.4; 16:9 (N) = 64.4
Diagonal FOV in degrees4:3 (W) = 149.2; 4:3 (M) = 115.7; 4:3 (N) = 79.7; 16:9 (W) = 133.6; 16:9 (M) = 107.1; 16:9 (N) = 73.6

