Article

Evaluation of MODIS—Aqua Chlorophyll-a Algorithms in the Basilicata Ionian Coastal Waters

1
Institute of Methodologies for Environmental Analysis, Italian National Research Council, C.da Santa Loja, Tito Scalo, 85050 Potenza, Italy
2
School of Engineering, University of Basilicata, Via dell’Ateneo Lucano 10, 85100 Potenza, Italy
3
Laboratory of Experimental Oceanology and Marine Ecology, Department of Ecological and Biological Sciences, Tuscia University, Molo Vespucci snc, Port of Civitavecchia, 00053 Civitavecchia (RM), Italy
*
Author to whom correspondence should be addressed.
Remote Sens. 2018, 10(7), 987; https://doi.org/10.3390/rs10070987
Submission received: 10 May 2018 / Revised: 11 June 2018 / Accepted: 18 June 2018 / Published: 21 June 2018
(This article belongs to the Special Issue Remote Sensing of Ocean Colour)

Abstract

:
Standard chlorophyll-a (chl-a) algorithms, which rely on Moderate Resolution Imaging Spectro-radiometer (MODIS) data aboard the Aqua satellite, usually show different performances depending on the area under consideration. In this paper, we assessed their accuracy in retrieving the chl-a concentration in the Basilicata Ionian Coastal waters (Ionian Sea, South of Italy). The outputs of one empirical (Med-OC3) and two semi-analytical algorithms, the Garver–Siegel–Maritorena (GSM) and the Generalized Inherent Optical Properties (GIOP) model, have been compared with ground measurements acquired during three different measurement campaigns. The achieved results prove the poor accuracy (adjusted R2 value of 0.12) of the investigated empirical algorithm and, conversely, the good performance of semi-analytical algorithms (adjusted R2 ranging from 0.74 to 0.79). The co-existence of Coloured Dissolved Organic Matter (CDOM) and Non-Algal Particles (NAP) has likely determined large errors in the reflectance ratios used in the OCx form algorithms. Finally, a local scale assessment of the bio-optical properties, on the basis of the in situ dataset, allowed for the definition of an operational local scale-tuned version of the MODIS chl-a algorithm, which assured increased accuracy (adjusted R2 value of 0.86). Such a tuned algorithm version can provide useful information which can be used by local authorities within regional management systems.

1. Introduction

The European Marine Strategy Framework Directive (MSFD) aims at developing a comprehensive structure in which member states are required to develop and implement adequate measures necessary to achieve or maintain “good environmental status” (GES) by 2020 through the establishment of eleven key descriptors [1]. Ocean colour (OC) remote sensing data offer potential advantages for monitoring GES, providing near real-time and synoptic information as well as long-term archive data about optical in-water constituents such as Coloured Dissolved Organic Matter (CDOM), Suspended Particulate Matter (SPM), and phytoplankton [2]. Among these, phytoplankton represents a key parameter both to ensure the sustainable exploitation of the food chain and to confront marine environmental threats, such as eutrophication, one of the above-mentioned descriptors [3]. Satellite retrievals of chlorophyll-a (chl-a) concentration, commonly used as a proxy of phytoplankton, can be easily assimilated into marine forecasting models for the detection of harmful algal blooms as well as the investigation of ongoing eutrophication phenomena [4]. Efficient exploitation of this framework requires a detailed analysis of possible error sources associated with retrieval procedures as well as the selection of the most suitable chl-a algorithm for a specific study area [5].
Since the launch of the NASA Coastal Zone Color Scanner (CZCS) on the Nimbus-7 satellite in 1978, empirical relationships of blue-to-green water reflectance ratios have been used to derive total chl-a concentration [6]. O’Reilly et al. [7] developed the first version of the “band ratio” algorithm for the Sea-viewing Wide Field-of-view Sensor (SeaWiFS) data by exploiting a large optical dataset of remote-sensing reflectance, Rrs(λ), i.e., just above the sea surface, and in situ sea water chl-a measurements. This empirical blue-green band ratio algorithm, named Ocean-Chlorophyll-2 (OC2), quantifies the chl-a concentration as a function of how much blue and green light is reflected from the sea surface [8]. The standard OCx algorithm has been subject to additional updates and has been implemented as a three-band OC3 algorithm form [9] on the Moderate Resolution Imaging Spectro-radiometer (MODIS) on board the Aqua satellite.
Although the empirical OCx algorithms have been developed to retrieve chl-a concentration in the open ocean for global scale studies, they exhibit poor accuracy at the basin/regional level [10,11]. For this reason, different regionally tuned OCx algorithms, such as NL (Non Linear)-DORMA, L (Linear)-DORMA, BRIC, and Med-OCx, have been designed for SeaWiFS/MODIS data, allowing a reduction in the overestimation of the standard OCx algorithms in the Mediterranean Sea [5,10,12,13]. However, in optically complex coastal waters (e.g., Case 2 waters), the OCx algorithms cannot discriminate chl-a from other in-water constituents, assuming that CDOM and Non-Algal Particles (NAP) absorb blue light deeply, as chl-a [14,15,16,17,18,19]. In these productive waters (e.g., inland, estuarine, and coastal waters), empirical algorithms based on red-Near Infrared (NIR) band ratios [20,21,22] were designed to discriminate the contribute of chl-a absorption from the other in-water constituents [23]. However, the exploitability of these algorithms depends on the trophic regime of the investigated area, given that their calibration data and root mean square errors (RMSEs) indicate a minimum applicability threshold at 10 mg/m3 of chl-a concentration [14].
In this scenario, the semi-analytical algorithms (SAA) aim at retrieving spectral Inherent Optical Properties (IOP, i.e., absorption and backscattering coefficients) from Rrs(λ), also enabling the separation of the total absorption and backscattering coefficients into different subcomponents (e.g., the absorption of algal, non-algal particles, and CDOM) [24,25,26,27,28]. The Garver–Siegel–Maritorena (GSM) algorithm [29] and the Generalized Inherent Optical Properties (GIOP) model [30] fall into this wide group of model-based approaches, in which semi-analytical reflectance models are used to describe the relationship between Rrs(λ) and IOP [31]. However, the main SAA limitations could derive from an unsuitable selection of IOP parameterizations or optimization approaches as well as uncertainties resulting from the assumptions used [32,33,34,35]. In consideration of both the advantages and disadvantages endemic to both the empirical and semi-analytical algorithms, several authors have compared their accuracy, with particular emphasis on critical areas or optically complex waters, such as the northern South China Sea [36] or Arabian Sea [37].
The Basilicata Ionian coastal waters (BICW, Southern Italy), located in the Gulf of Taranto (Northern-Ionian Sea, Mediterranean Sea), represent a test case of a complex-optical water environment (Figure 1). The proximity of pollution sources (i.e., the Taranto harbor) and river discharges can determine continuous fluctuations in the concentration of the bio-optical components along the water column [38] and/or changes in the biological response of the BICW marine ecosystem. Such an area has been poorly investigated thus far in terms of chl-a satellite estimates, with only several regional/basin scale studies [39], which aimed at monitoring the chl-a inter-annual variability [40] or at better characterizing the phytoplankton phenology in the Mediterranean Sea [41,42,43]. To fill such a research gap, BICW have been studied within the “IOnian Sea water quality MOnitoring by Satellite data” (IOSMOS) project, a European Transnational Cooperation action co-funded by the ERDF Operational Programme Basilicata 2007–2013. Within the three-year-long IOSMOS project, three different in situ measurement campaigns were performed to collect water sampling data (chl-a, SPM, and IOP) and radiometric sea surface (above-water) measurements useful to assess the most suitable chl-a algorithm for the area.
In this framework, the goal of this paper is to evaluate the performance of three MODIS-Aqua chl-a algorithms (empirical or semi-analytical), namely Med-OC3, GSM, and GIOP, diagnosing their potential sources of consistency or discrepancy due to the specific BICW bio-geochemical features. Afterward, using the in situ dataset (Rrs(λ), chl-a, and absorbing coefficients), a local scale assessment of the bio-optical properties allowed for the definition of an operational BICW-tuned version of MODIS chl-a algorithm.

2. Materials and Methods

2.1. Study Area

BICW represent a Gulf of Taranto sub-set related to the Ionian Sea continental shelf area within the administrative boundaries of the Basilicata Region, Italy (Figure 1b) [44].
Concerning the bathymetry of the area, the shallow coastal waters are characterized by 50 m mean depth and extend up to 8 km away from the shoreline in proximity of the Sinni River (Figure 1b). Notably, there is a sharp reduction of the continental shelf close to the Bradano River mouth, due to the presence of the Taranto Valley (a NW-SE submerged extension of the onshore Bradanic foredeep), which can reach a depth up to 500 m at just 4 km from the coastline [45].
With regard to water mass dynamics, the large-scale circulation in the Gulf of Taranto [46,47] is anticyclonically oriented and connected to the Ionian Surface Waters (ISW) flow, which enters from the central Ionian Sea. Furthermore, the circulation is also affected by the Western Adriatic Coastal Current (WACC) flowing around Apulia into the Gulf from the northern Adriatic Sea [48]. A complex interaction between large and coastal scales [49] characterizes the Gulf, generating cyclonic vortices in shelf areas [50]. Recent observational and modeling studies [51,52,53] found evidence of intense mesoscale and sub-mesoscale variability at the rim of large scale.
On the basis of scientific studies conducted both at basin (Mediterranean Sea) [41,43] and regional (Gulf of Taranto) scales [40], the investigated area largely has been characterized by a chl-a “non-blooming” regime, indicating the absence of a marked chl-a peak bloom and generally showing oligotrophic conditions. However, BICW chemical/physical properties are influenced by the seasonal outflows of the Basilicata major rivers, such as Bradano, Basento, Cavone, Agri, and Sinni (from NE to SW, Figure 1b), which can be considered as the main freshwater inputs of the Gulf of Taranto [38,54]. These rivers exhibit typical seasonal fluctuations, with a maximum hydrometric level between late fall and early spring, and a minimum fluctuation in the summer. The Bradano, Basento, and Cavone River basins are all characterized by low precipitation levels and a small number of springs [54]. Such factors suggest lower flow rates during summer when compared to the Agri and Sinni basins, which are characterized by a higher precipitation rate and a larger number of springs [55].
Within these hydrographic basins, the development of specific infrastructures for water storage and hydropower production has increased the industrial and socio-economic benefits of the Basilicata region. On the other hand, such infrastructures also have exposed the coastal marine environment to widespread retreating phenomena or changes in sediment budget and water quality [44].
Finally, the proximity to the Taranto harbor enhances the BICW relevance from an environmental point of view, given that the biological balance of this coastal marine environment has been altered by the presence of iron and steel factories, petroleum refineries and shipyards for many decades [56]. For such reasons, the area of interest has become the target of extensive scientific research since 2012, specifically within the framework of the already-mentioned IOSMOS project which investigates and monitors the bio-optical properties of the Ionian coastal region and its water quality [38].

2.2. In Situ Data Collection

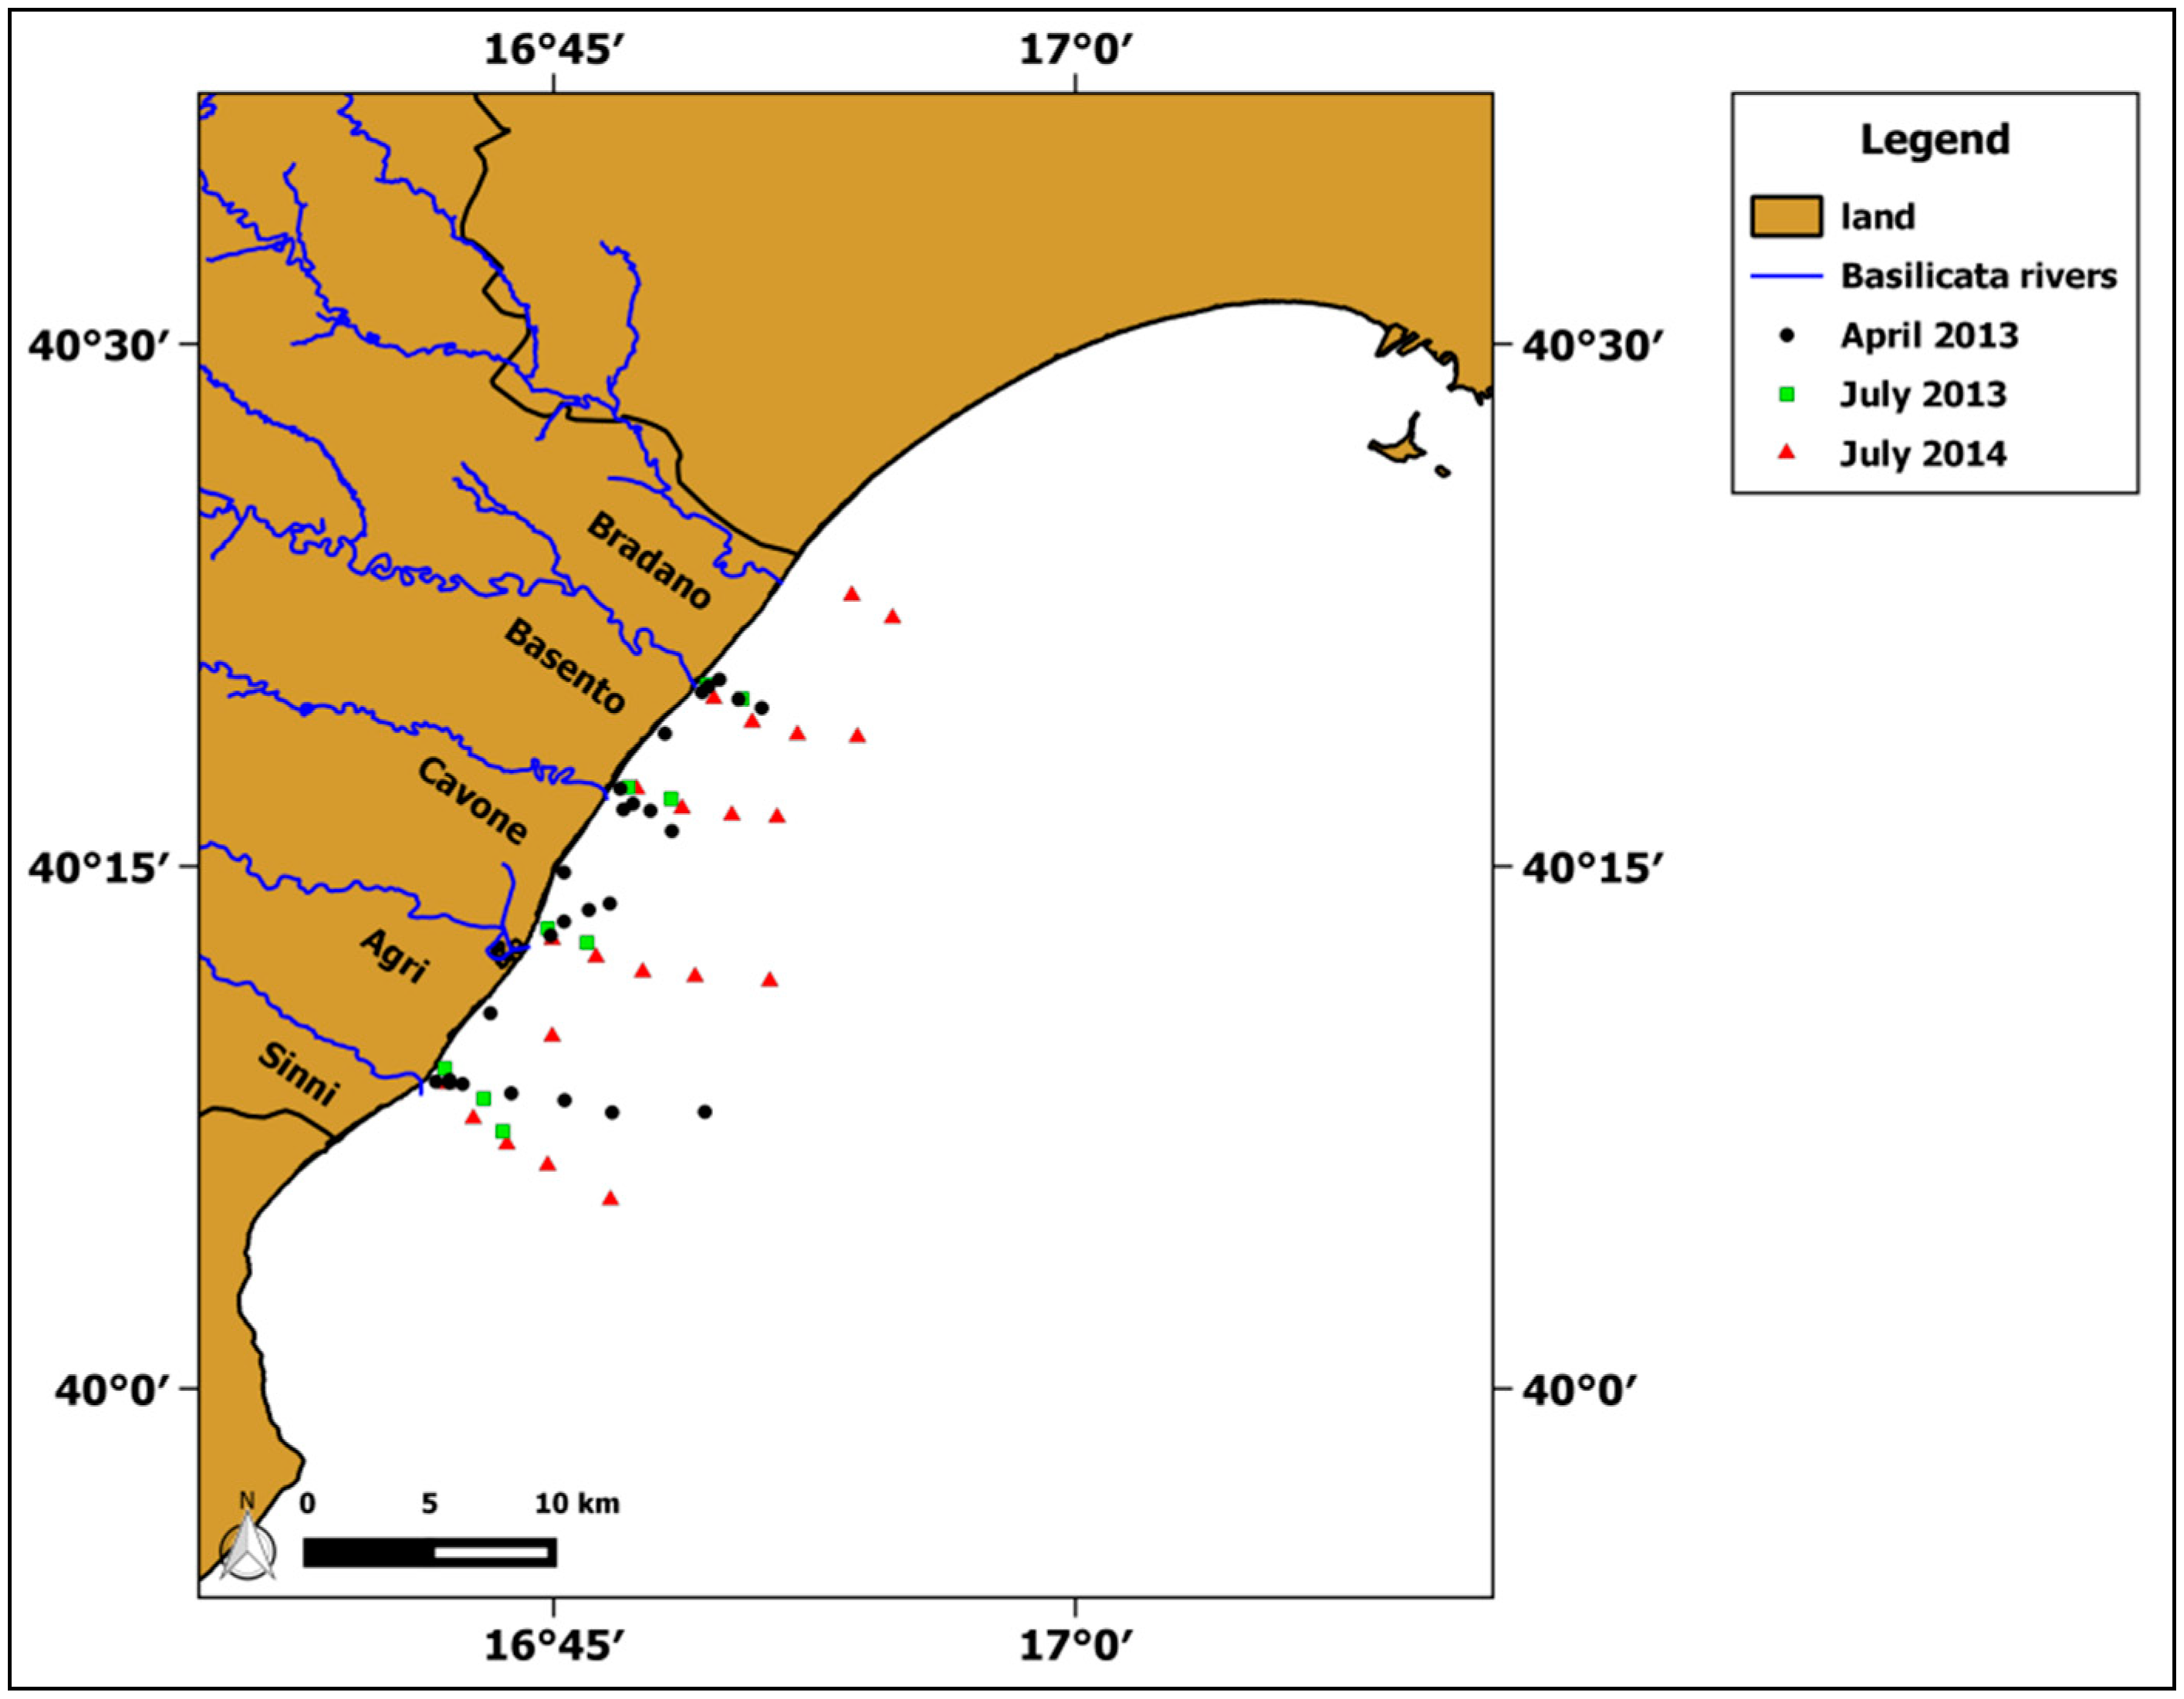
Within the three-year IOSMOS project, three measurement campaigns were performed in the area of interest in April 2013, July 2013, and July 2014 (Figure 2). The sampling scheme adopted for each measurement campaign aimed at better investigating the bio-physical properties of the area potentially most affected by river discharges. The measurement stations occupied an area ranging in distance from 300 m up to 10 km away from the coastline, allowing for improved assessment of the gradient of the main bio-optical components.
Sub-surface (i.e., 0–1 m depth) water samples were collected using Niskin bottles during these campaigns for subsequent laboratory measurements of chl-a concentrations and absorption spectra analysis (i.e., phytoplankton, NAP, and CDOM). A total of 55 stations were sampled: 25 collected in the first (18–19 April 2013), 9 in the second (16 July 2013), and 21 in the third (1–2 July 2014) campaigns, respectively. Furthermore, above-water radiometric measurements were collected with an ASD FieldSpec spectroradiometer (Analytical Spectral Devices, Inc., Boulder, CO, USA), as well as vertical profiles of several physical parameters (such as temperature, conductivity, salinity, density, PH, etc.) were acquired by a Idronaut 316 multi-parametric probe (IDRONAUT S.r.l., Brugherio (MB), Italy) for most of the selected sampling stations. In the following paragraphs, an in-depth description of the above-mentioned measurements is provided.

2.2.1. In Situ Chl-a and Absorption Spectra Analysis

For the analysis of chl-a concentration, 2 L of seawater per station were immediately pre-filtered with a 250 µm pore size mesh for the removal of mesozooplankton and larger-size particles; they were then filtered through 0.7 μm GF/F Whatman filters (25 mm ø) in a Gelman Science filtration system equipped with 300 mL funnels. The filters were stored at −20 °C in 100% acetone and successively analysed with a UVmini1240 Shimadzu spectrophotometer [57].
Regarding the CDOM absorption measurements, 2 L of seawater per station were filtered through pre-rinsed 0.2 μm Nuclepore filters and then stored in 200 mL amber borosilicate bottles preconditioned with ultrapure water and kept refrigerated for the analysis in accordance to the Ocean Optics Protocols [58]. The CDOM absorbance was measured using an UVmini1240 Shimadzu spectrophotometer with a 10 cm quartz cell in the 250–700 nm spectral range. The absorbance values obtained were converted into absorption coefficients following the methods of Twardowski et al. [59].
Phytoplankton (ph) and NAP absorption spectra (namely, aph(λ) and aNAP(λ), respectively) were obtained using the filter pad technique [60]. In particular, water sub-samples (2 L) were filtered using a 0.7 μm GF/F Whatman filters (25 mm ø), immediately stored in liquid nitrogen and then maintained in a laboratory freezer at −80 °C before analysis. Particulate absorption measurements were performed using a LI-COR 1800UW spectroradiometer equipped with integrating sphere LI-COR 1800-12S. After the first measurement, the particulates collected on filters were extracted with pure methanol at 4 °C for 4 h [60], pre-soaked with filtered seawater, and measured again to determine aNAP(λ) spectra. Table 1 summarizes the relevant statistics of chl-a and IOP obtained during the three performed measurement campaigns.

2.2.2. In Situ Rrs(λ)

In addition to seawater sampling, above-water radiance measurements were performed and then processed following the methods described in the ViewSpec Pro software manual [61] (for above-water measurements). The radiometric measurements were acquired during the three campaigns from the cruise deck by using an ASD Field Spec Pro spectroradiometer equipped with a 8 deg foreoptic. After normalizing radiance data through a standard Spectralon (Labsphere, NH, USA) grey (30% albedo) panel, multiple spectra were acquired and averaged for each measurement station and then processed by the ViewSpec Pro software 6.0 (ASD Inc., Boulder, CO, USA). Notably, these measurements were acquired in the absence of cloudy coverage and with a wind velocity not higher than 5 m/s. The reflected radiation field over the collected samples in the different stations was assumed to be Lambertian.
Additionally, such measurements aimed at retrieving the remote sensing reflectance Rrs(λ) (sr−1), defined as the ratio between the water-leaving radiance Lw(θ, ϕ, λ) and the downwelling spectral irradiance Es(λ) [35]. The Rrs(λ) was calculated as:
  R rs ( λ )   =   L w ( θ , ϕ , λ ) E s ( λ )
However, within above-water radiometric measurements, the total radiance measured should refer to the surface radiance Lsfc, defined as:
  L sfc ( θ , ϕ , λ )   =   L w ( θ , ϕ , λ )   +   ρ * L sky ( θ sky , ϕ sky , λ )
where Lsfc represents the radiance arising from the sea surface at zenith angle θ (usually chosen between 30 and 50 deg) and azimuth angle ϕ (usually measured relative to the sun’s azimuth); in contrast, Lsky is the sky radiance measured with the radiometer looking upward at angles θsky and ϕsky and ρ is the reflectance factor [62]. From Equation (2) the water-leaving radiance Lw(λ) is defined as:
  L w ( θ , ϕ , λ )   =   L sfc ( θ ,   ϕ ,   λ )     ρ * L sky ( θ sky ,   ϕ sky ,   λ )
A horizontal plaque (i.e., grey Spectralon panel with 30% albedo) was used to estimate the downwelling spectral irradiance Es(λ), which can be expressed as:
  E s ( λ )   =   π * S g ( θ g ,   ϕ g ,   λ ) R g ( θ g ,   ϕ g ,   λ )
where, Sgg, rg, λ) is the sensor signal when the plaque is viewed at angles (θg, ϕg) with the sun at (θ0, ϕ0), and Rgg, ng, λ) represents the plaque bi-directional reflectance function for that sun and viewing geometry [62]. Introducing the Equations (3) and (4) into the Equation (1), it is possible to compute the Rrs(λ) as:
  R rs ( θ , ϕ , λ )   =   L sfc ( θ , ϕ , λ )     ρ * L sky ( θ , ϕ , λ ) π * S g ( θ g , ϕ g , λ ) R g ( θ g , ϕ g , λ )

2.3. MODIS Satellite Data

Data recorded by the MODIS sensor on board the Aqua satellite were analysed in this work. MODIS Level 1A data, at 1 km spatial resolution, were acquired from NASA’s ocean color web site [63] for the corresponding days of in situ sampling. The downloaded MODIS Level 1A data were reprocessed using the SeaDAS software (version 7.3) to produce Level 1B and geo-location files. During the processing phase from L1B to L2 chl-a products, the standard NASA atmospheric correction [64] was not used due to its poor accuracy in optically complex waters [5,65]. Accordingly, we applied the MUMM method [66], properly designed for coastal waters and already successfully implemented by Di Polito et al. [38] for SPM monitoring in BICW. The derived chl-a product (L2 at 1-km spatial resolution) was then calculated for the selected empirical and semi-analytical algorithms (i.e., Med-OC3, GSM, and GIOP). In the following paragraphs, the above-mentioned chl-a algorithms are briefly described in consideration of their standard/default configurations.

MODIS Chl-a Algorithms: Med-OC3, GSM and GIOP

The empirical Med-OC3 algorithm is the MODIS version of the corresponding Med-OC4 (originally implemented on SeaWiFS) developed to improve the OC3 poor accuracy exhibited in the Mediterranean basin [5]. Similar to OC3M, Med-OC3 is based on a fourth-degree polynomial regression between log-transformed chl-a and log-transformed maximum band ratio (MBR) of Rrs(λ), as defined in Equation (6) [9]:
Chl - a   =   10 C 0 + C 1 R + C 2 R 2 + C 3 R 3 + C 4 R 4
where,
  R   =   log 10 ( max ( R rs 443 ;   R rs 488 ) R rs 547 )
This algorithm differs from the OC3M algorithm only in terms of the regression coefficients (Ci, i = 0, 4), which are obtained after the calibration on a representative bio-optical dataset collected in the Mediterranean area [5].
The GSM algorithm, initially developed by Garver and Siegel [25] and later updated by Maritorena et al. [29], aims at retrieving simultaneous estimates of chl-a, aCDM(λ) (namely the sum of aCDOM(λ) and aNAP(λ)) and particulate backscattering—bbp(λ)—from Rrs(λ). GSM is based on a quadratic relationship between the Rrs(λ) and the absorption and backscattering coefficients, namely a(λ) and bb(λ), respectively [67,68,69]. The unknown terms, chl-a, aCDM(λ), and bbp(λ), are retrieved by setting fixed parameters, namely aph*(λ), S and η, and applying a non-linear least-square technique to fit Rrs(λ) data (Equation (8)) for more than three wavelengths [29].
Within the GSM standard configuration, the above-mentioned parameters (aph*(λ), S, and η) are set on standard values through a global scale optimization, as summarized in Table 2.
Although the GSM algorithm was initially developed for the SeaWiFS wavebands (i.e., 412, 443, 490, 510, 555, 670 nm), the SeaDAS software allowed for the retrieval of the MODIS aph*(λ) by interpolating the aph* values derived from the SeaWiFS with the corresponding MODIS bands (i.e., 412, 443, 488, 531, 547, 667 nm).
The GIOP algorithm (developed by the NASA Ocean Biology Processing Group, OBPG) was designed as a satellite data processing framework where SAA can be developed at runtime by selecting input parameters from an assortment of published models/parameterizations [30,31]. Similar to the GSM algorithm, GIOP attempts to retrieve IOP from rrs(λ, 0), starting from the Equation (8):
  r rs ( λ , 0 )   =   G ( λ ) b b ( λ ) a ( λ ) + b b ( λ )
where, rrs(λ,0) is the remote sensing reflectance just beneath the sea surface and is determined from Rrs(λ) by adopting the method of Lee et al. [70] and G(λ) is a coefficient that varies with illumination conditions, sea surface properties, and the shape of the marine volume scattering function.
The GIOP is based on the assumption that each absorption and scattering sub-components can be characterized by a magnitude (i.e., M, eigenvalue) and a spectral shape. In this framework, the end user can freely choose different parameterizations or empirical relationships to determine the spectral shape functions of the non-water absorption and scattering components (identified by the asterisk in Table 3) [69]. An inversion process is then performed to find the eigenvalue optimum set that minimizes the difference between the modeled rrs(λ,0) from the MODIS-Aqua rrs(λ,0) over a range of sensor wavelengths by using the Levenburg-Marquardt optimization scheme [30].
Within the standard GIOP configuration, the empirical relationships adopted are summarized in Table 3.

2.4. Chl-a Match-Up Analysis

MODIS chl-a products were averaged on a 3 × 3-pixel box centered on the location of the in situ chl-a samples [5]. To provide the best quality data for comparison with in situ chl-a measurements, a quality control procedure was automatically implemented to discard MODIS data associated with some of the quality flags currently used for the OC level 3 processing (e.g., atmospheric correction warning, large viewing angle, large sun angle, clouds, stray light, low water-leaving radiance, chl algorithm failure) [36]. All the pixels associated with at least one of the considered quality flags were discarded, and only the boxes containing at least 50% of valid pixels were retained for match-up analysis [72]. With regard to the temporal buffer, only the satellite passes at ±3 h time window around the time of in situ measurements were considered, assuming that the atmospheric conditions were reasonably stable over this period [72].
To evaluate the chl-a algorithms performance, we adopted several regression indices and statistical indicators, such as the adjusted coefficient of determination (adjusted R2), the p-value, the average ratio of satellite-to-in situ data (r), the average absolute (unsigned) percent difference (APD), and the root mean square error (RMSE). The r, APD and RMSE definitions are given by the following equations, wherein xi is the ith satellite-derived value, yi is the ith in situ-derived value, and N is the number of samples selected.
r   =   1 N i = 1 N ( x i y i )
APD   =   100 1 N i = 1 N ( | x i y i | y i )
RMSE   = 1 N i = 1 N ( x i y i ) 2
All the statistical analyses were performed using the open source statistical software R ver. 3.3.1 [73].

3. Results

3.1. Accuracy Assessment of MODIS-Aqua Chl-a Algorithms

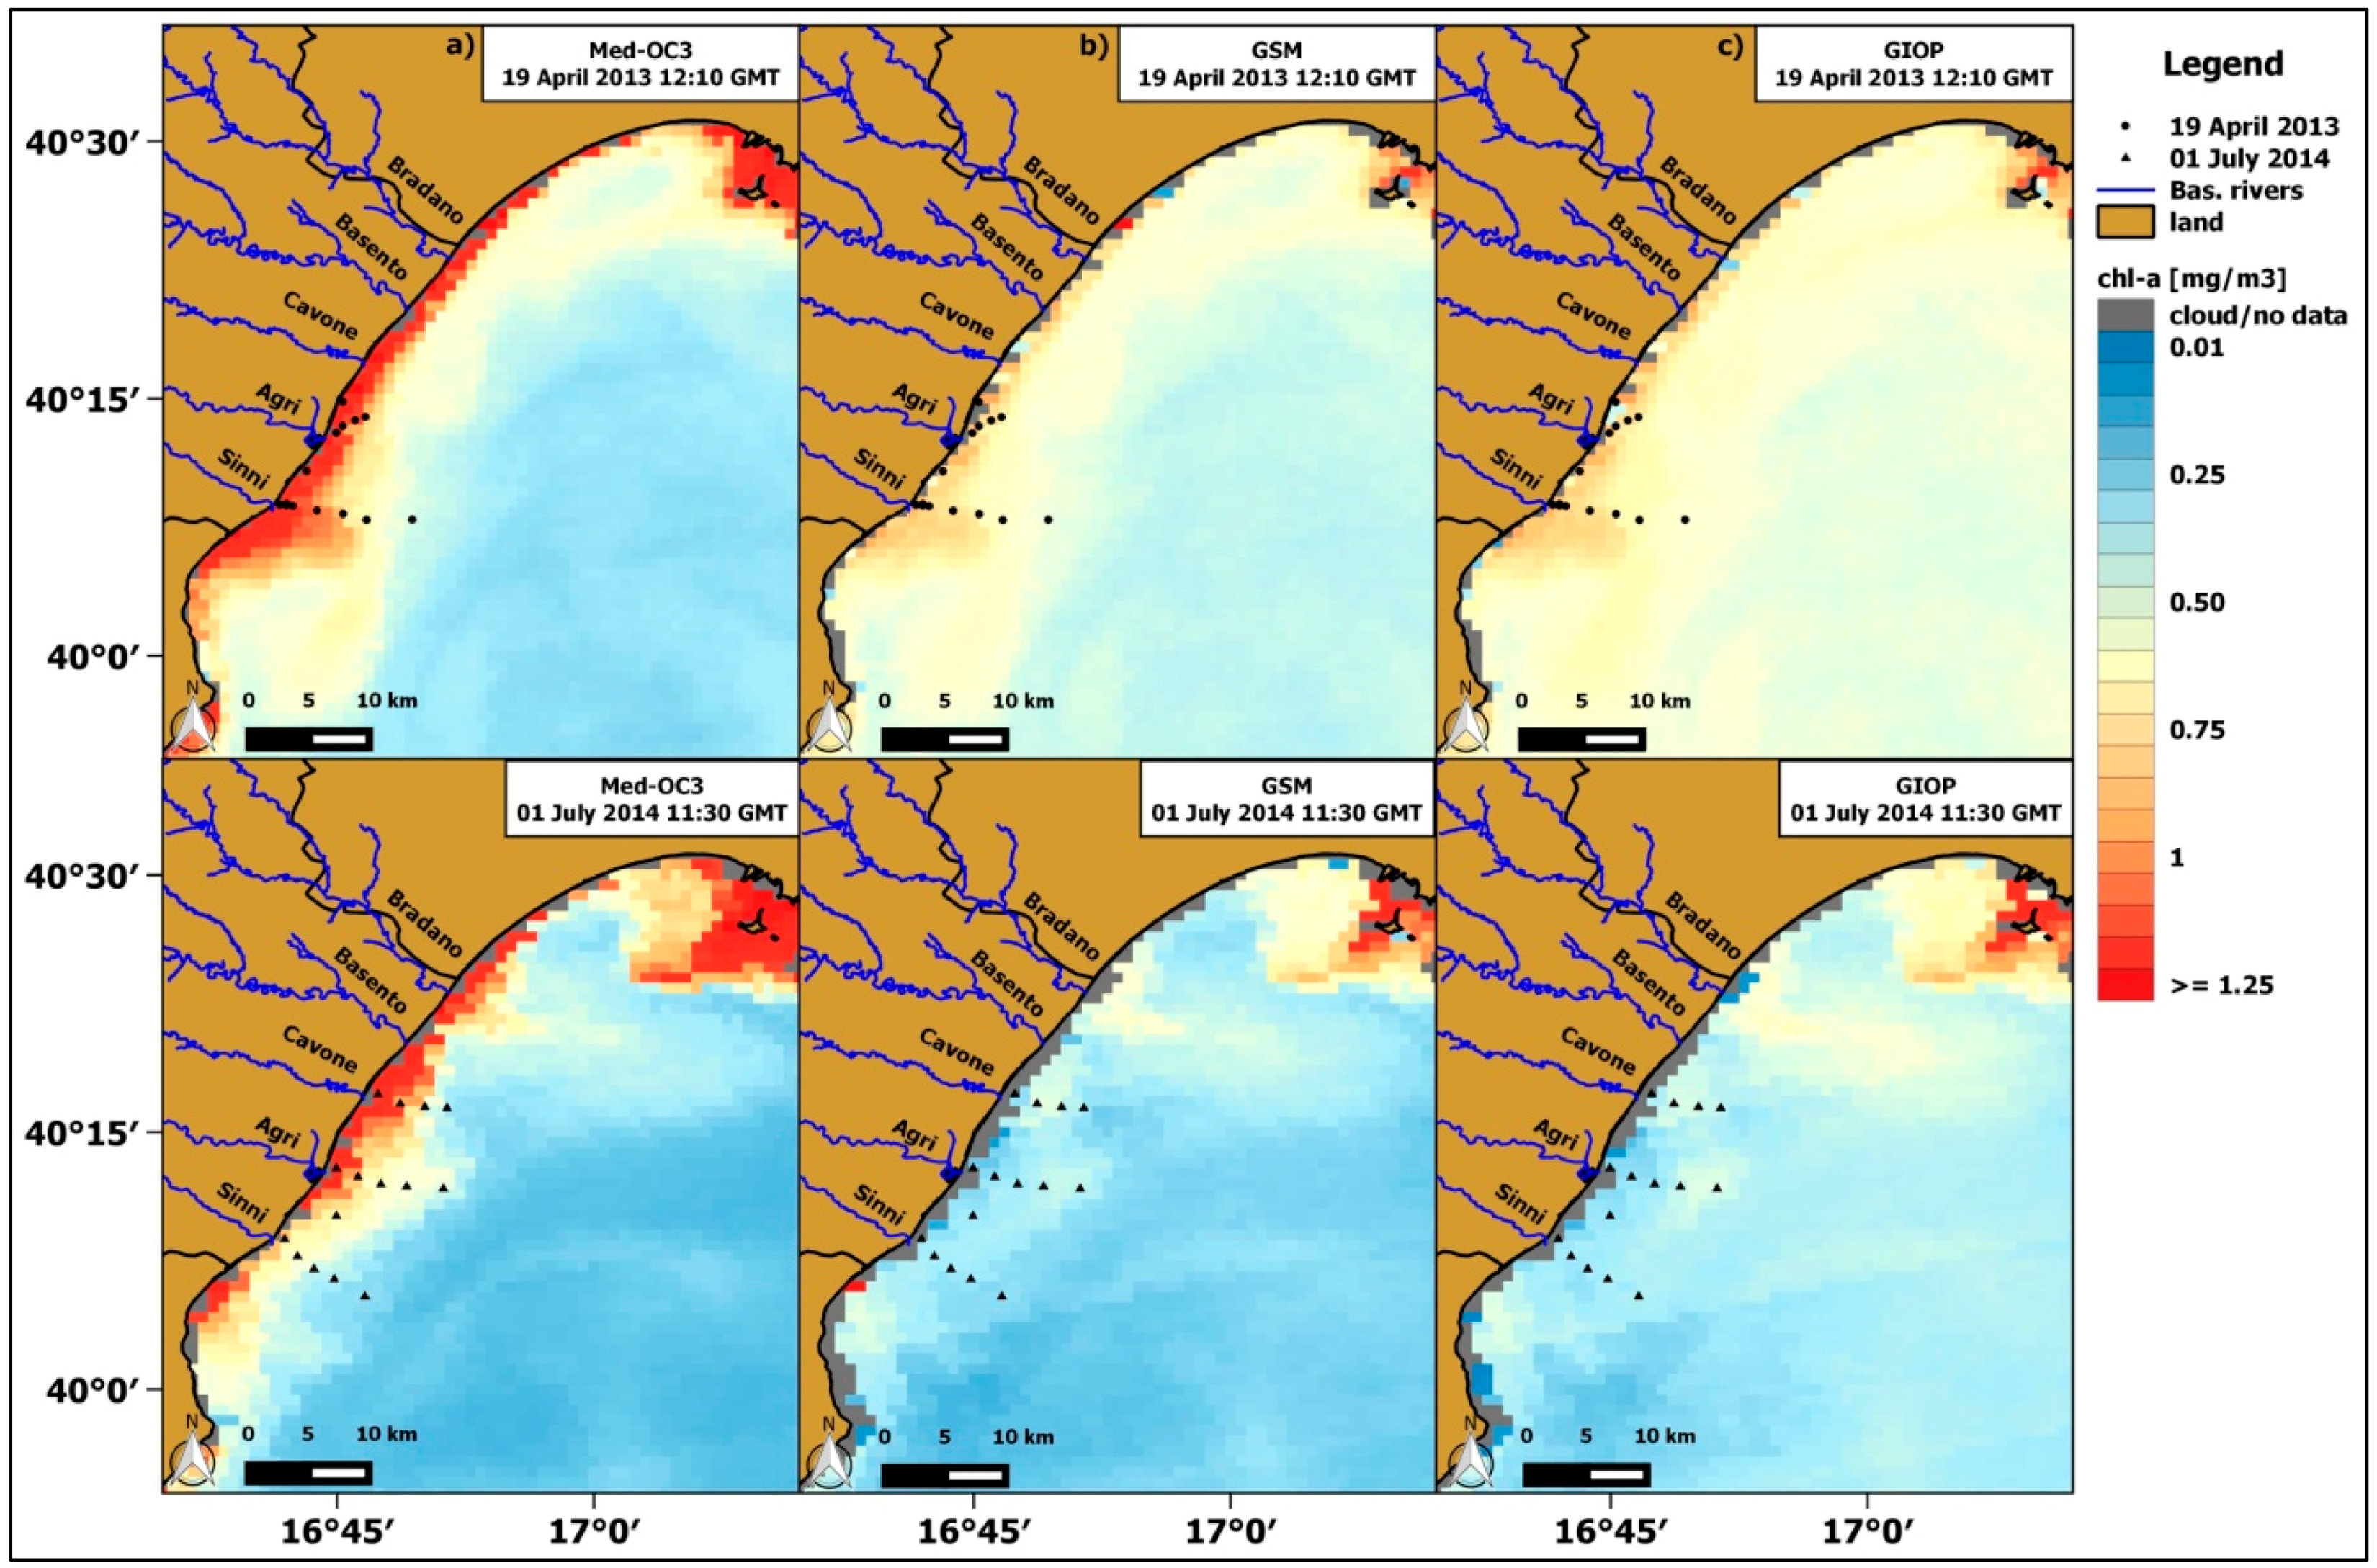
Following the steps described in the Section 2.3, chl-a maps were generated for the corresponding days of in situ measurements by implementing each of the analysed chl-a algorithms. Qualitative differences in chl-a spatial variability between Med-OC3, GSM, and GIOP algorithms could be evaluated through a comparison of chl-a maps of spring and summer days. In particular, chl-a maps, which refer to one sampling day of April 2013 and one of July 2014, are shown in Figure 3.
Within the spring chl-a maps in Figure 3 (top panels), the Med-OC3 algorithm shows a well-defined chl-a concentration gradient from coastal to open sea. The empirical algorithm exhibits chl-a values higher than 1 mg/m3 in shallow waters with a sharper decrease in chl-a values, with about 0.25 mg/m3 at just 10 km from the coastline. On the other hand, the GSM e GIOP algorithms generally exhibit a less pronounced chl-a spatial variability due to a slight decrease in chl-a concentration, with values between 0.8 and 0.5 mg/m3 representative of coastal and off-shore waters, respectively.
If one compares the spring chl-a maps with the summer ones (top vs. bottom panels), the Med-OC3 algorithm shows no substantial differences in chl-a values, especially in coastal waters (Figure 3a,b), highlighting a possible chl-a overestimation, at least in the summer season. On the other hand, both GSM and GIOP algorithms exhibited low chl-a values between 0.2–0.3 mg/m3 in the summer period in most of the study area, except for the region close to the Taranto harbor (North-East corner of the scene), characterized by chl-a values constantly higher than 1 mg/m3.
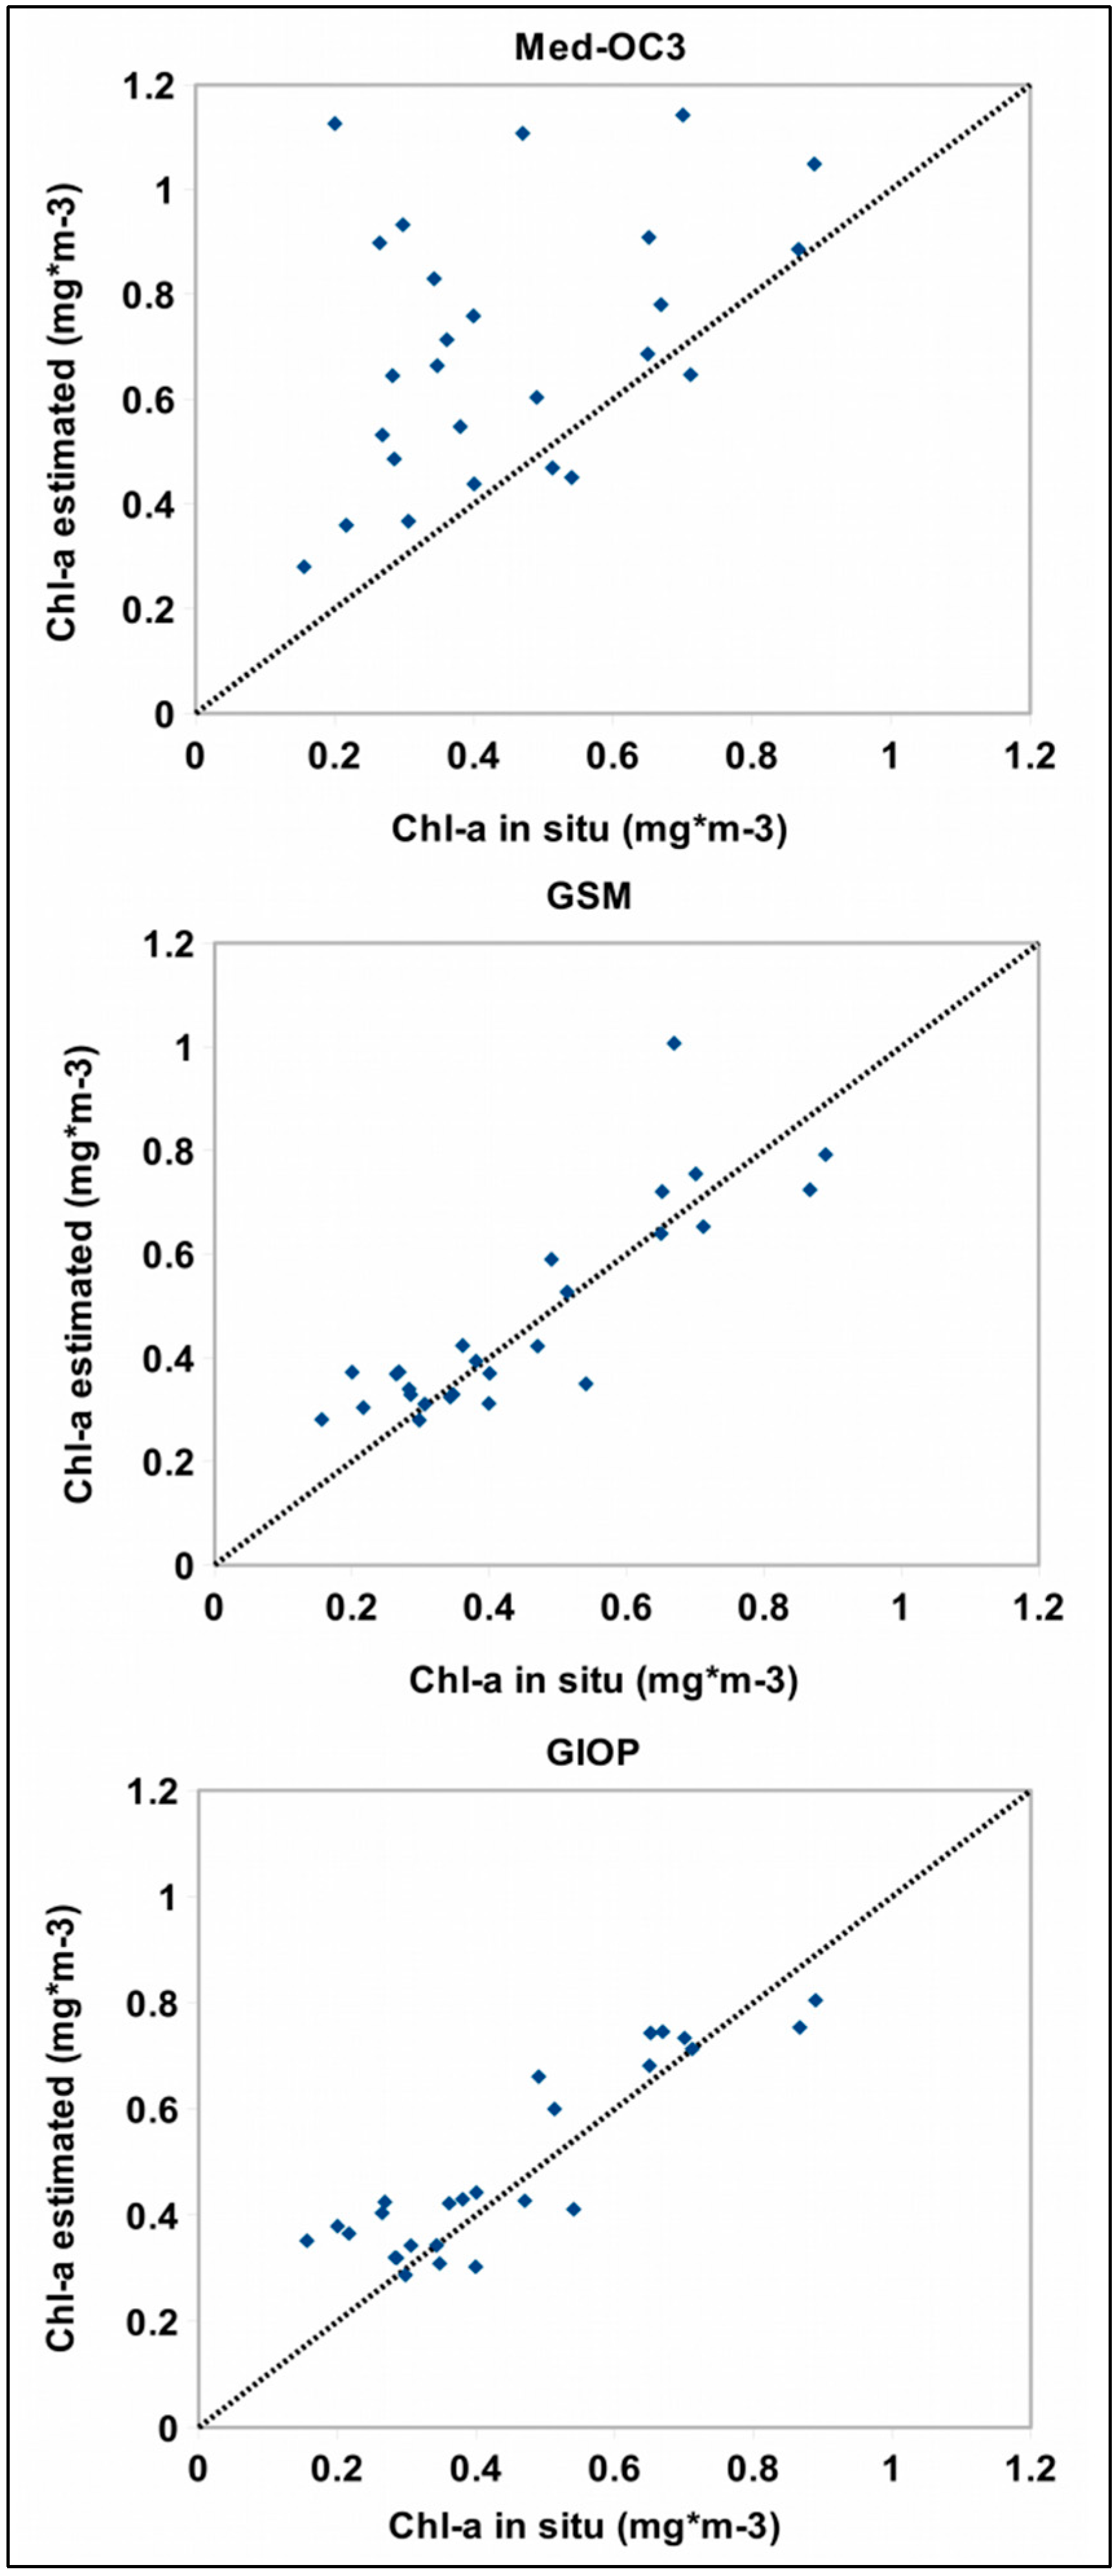
As mentioned above, to provide an accuracy assessment of these chl-a algorithms, a match-up analysis between in situ chl-a measurements and the corresponding MODIS-A chl-a data was performed. After applying the quality control procedure and the spatial and temporal criteria described above, a total of 26 samples among the three different campaigns were retained for the match-up analysis. Figure 4 shows the derived scatter plots for Med-OC3, GSM, and GIOP algorithms, respectively.
The accuracy of the three MODIS chl-a algorithms was evaluated by computing the regression indices and statistical indicators summarized in Table 4.
The Med-OC3 algorithm exhibited the worst performance, as evidenced firstly by the low adjusted R2 value (0.12) and the statistically non-significant p-value (0.04). Additionally, the average ratio of satellite-to-in situ data (r) suggested an almost twofold over-estimation (with r equal to 1.81), also confirmed by the highest APD (84.11%) and RMSE (0.35) values.
Focusing on SAA, the regression indices indicated a significant increase in the algorithm performance from Med-OC3 to GSM and GIOP models (with adjusted R2 ranging between 0.74 and 0.79); additionally, the r values close to 1 suggest an almost nil over-estimation. The RMSE and APD statistical errors significantly decreased, reaching the minimum values of 0.09 (for GIOP) and 21.61% (for GSM), respectively.
The scatter plots and the chl-a match-up statistics demonstrate the poor accuracy of the investigated empirical algorithm and, conversely, the good performance of the semi-analytical algorithms, thus highlighting the best suitability of the SAA for this specific study area.

3.2. In Situ Rrs(λ) Spectra and Water Types Characterization

To better understand whether in-water components might affect the performance of the analysed chl-a algorithms, we conducted a bio-optical BICW characterization by exploiting the in situ Rrs(λ) spectra available within IOSMOS project.
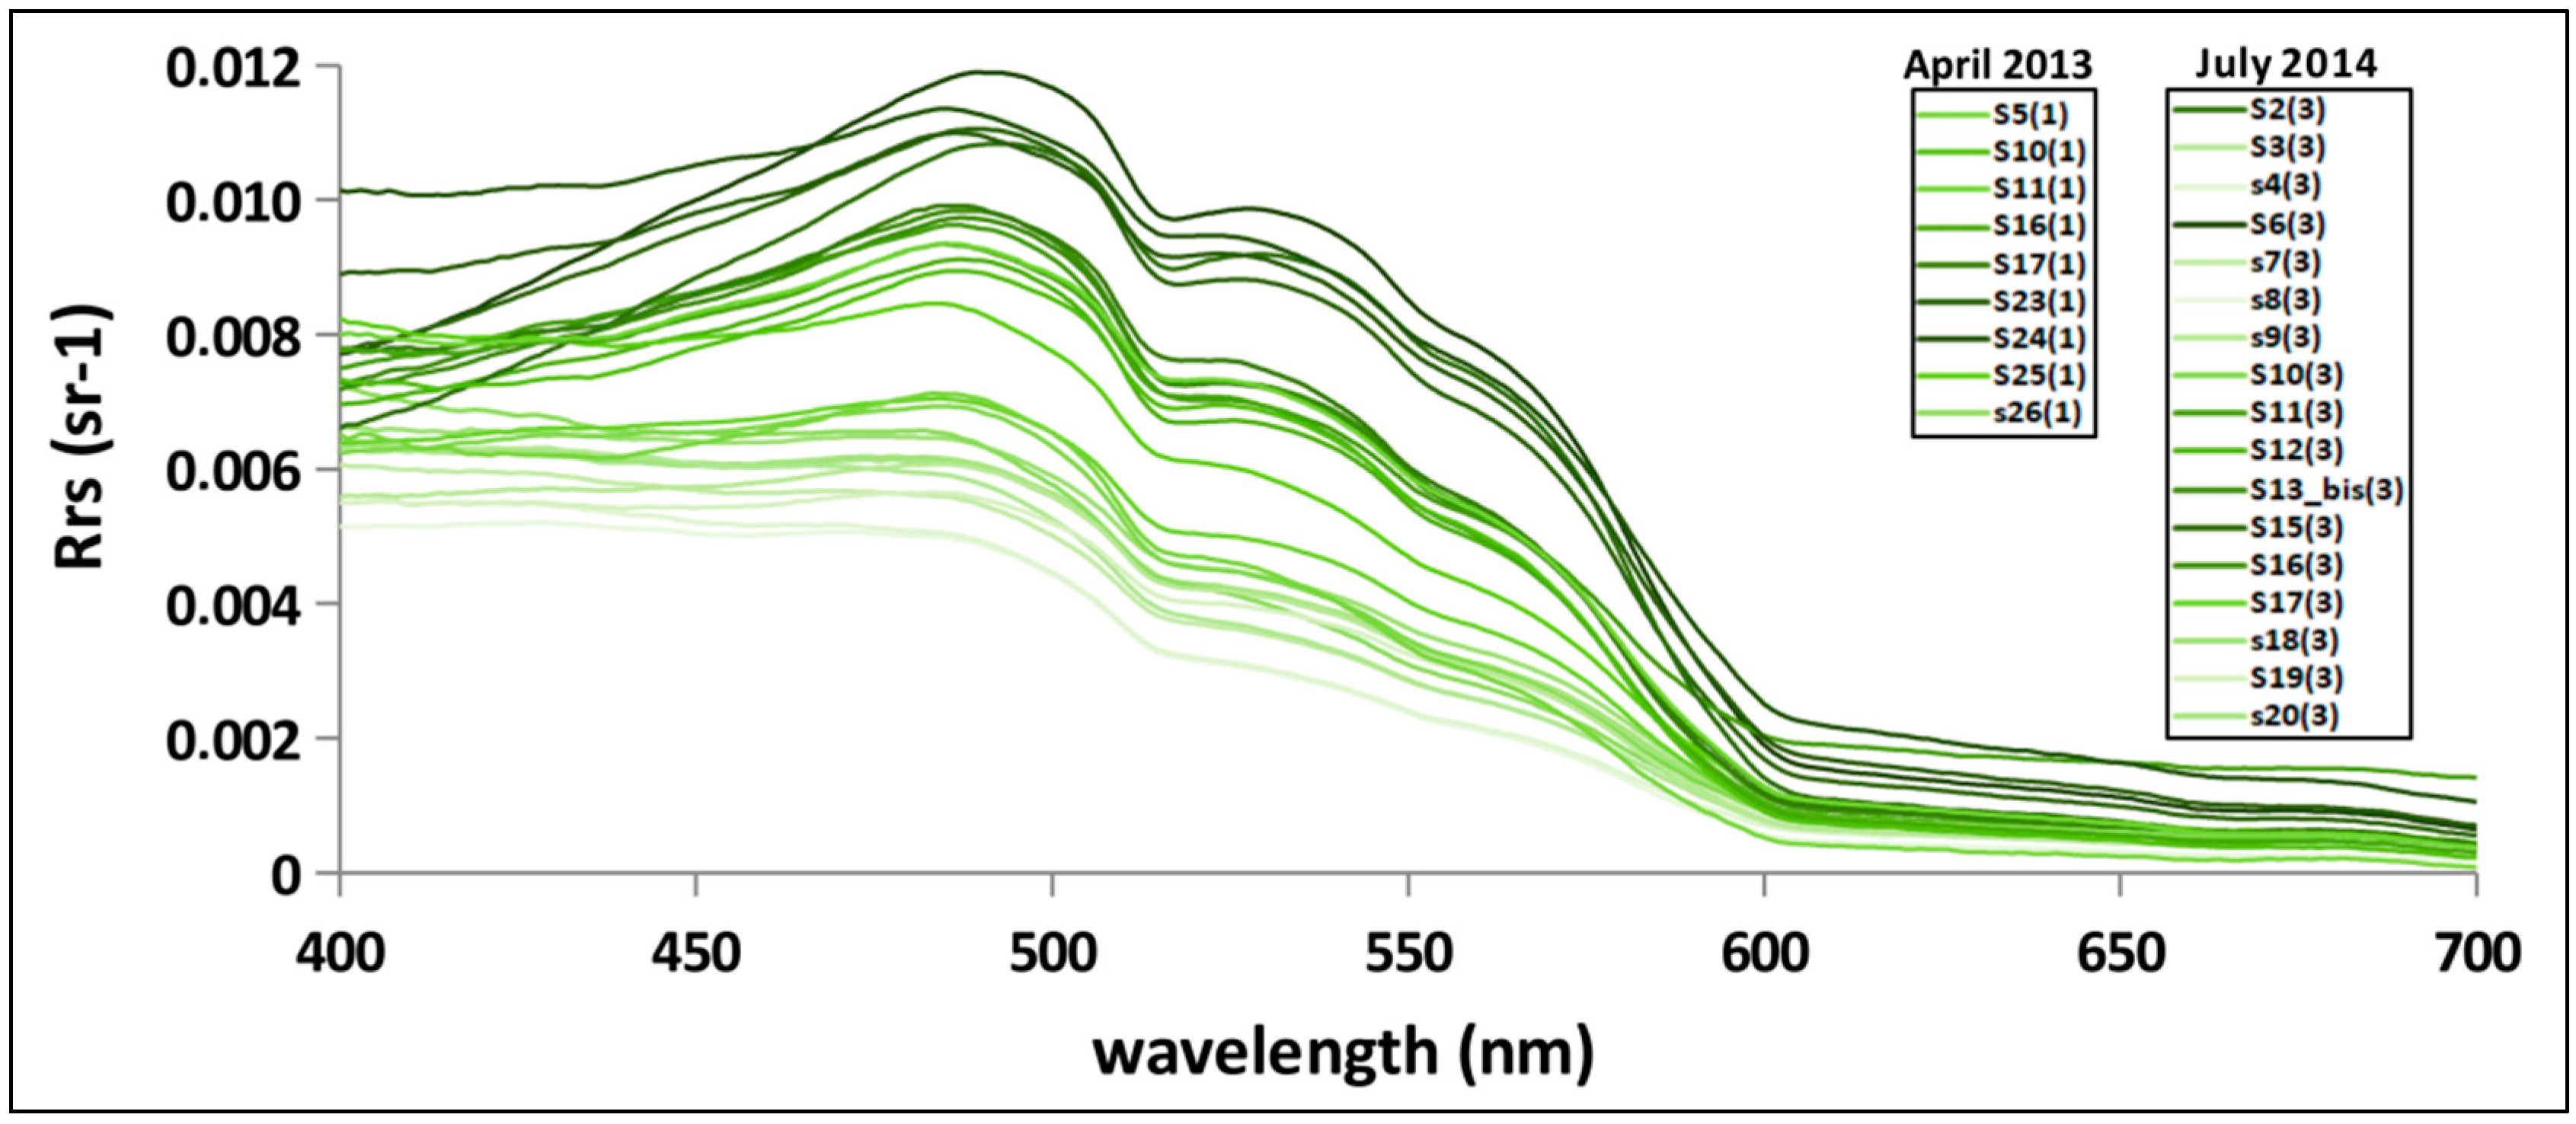
The in situ Rrs(λ) spectra (in the range 400–700 nm) of the 26 stations previously considered within the match-up analysis are represented in Figure 5.
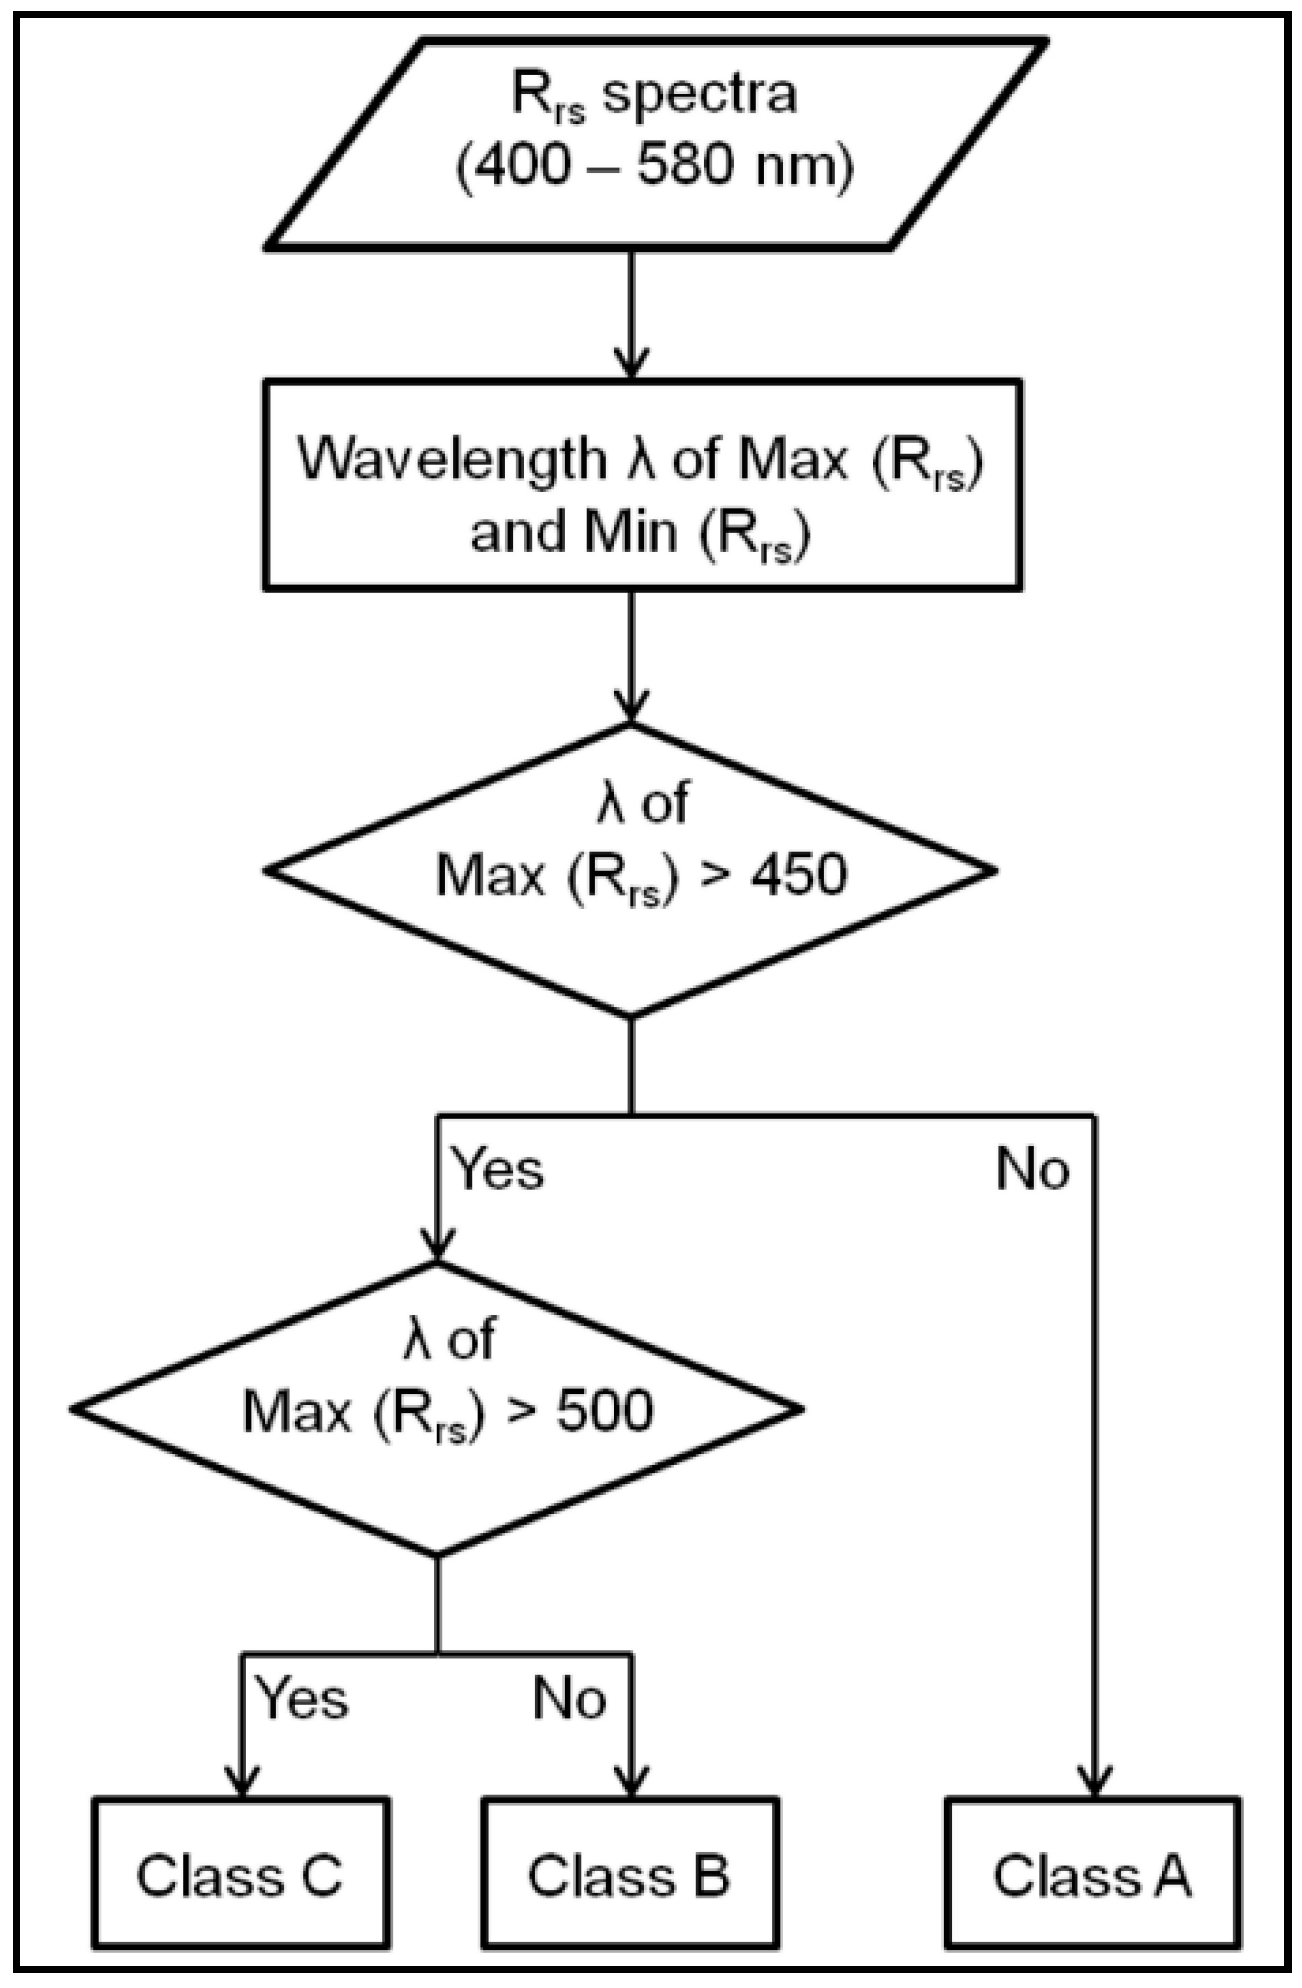
With respect to the 26 Rrs(λ) spectra in Figure 5, it is possible to identify some stations (depicted by the lightest green lines) characterized by the maximum Rrs(λ) in the blue region at about 400 nm. On the other hand, others (depicted by the darkest green lines) exhibited a peak at about 490 nm, while all the spectrum reached the minimum Rrs(λ) value in the red region of the visible domain, beyond 600 nm. To divide the measurements into homogenous optical groups, we implemented the supervised classification [74] (namely, max-classification) within a modified version that allowed the definition of three water types which correspond to classes A–C, as shown in the flowchart in Figure 6:
  • Class A: Phytoplankton dominant waters, characterized by the spectral peak at about 400 nm.
  • Class B: CDM dominant waters, with the maximum Rrs(λ) at approximately 490 nm.
  • Class C: Mixed waters with no dominant bio-optical components, with a flat Rrs(λ) peak between 500–550 nm.
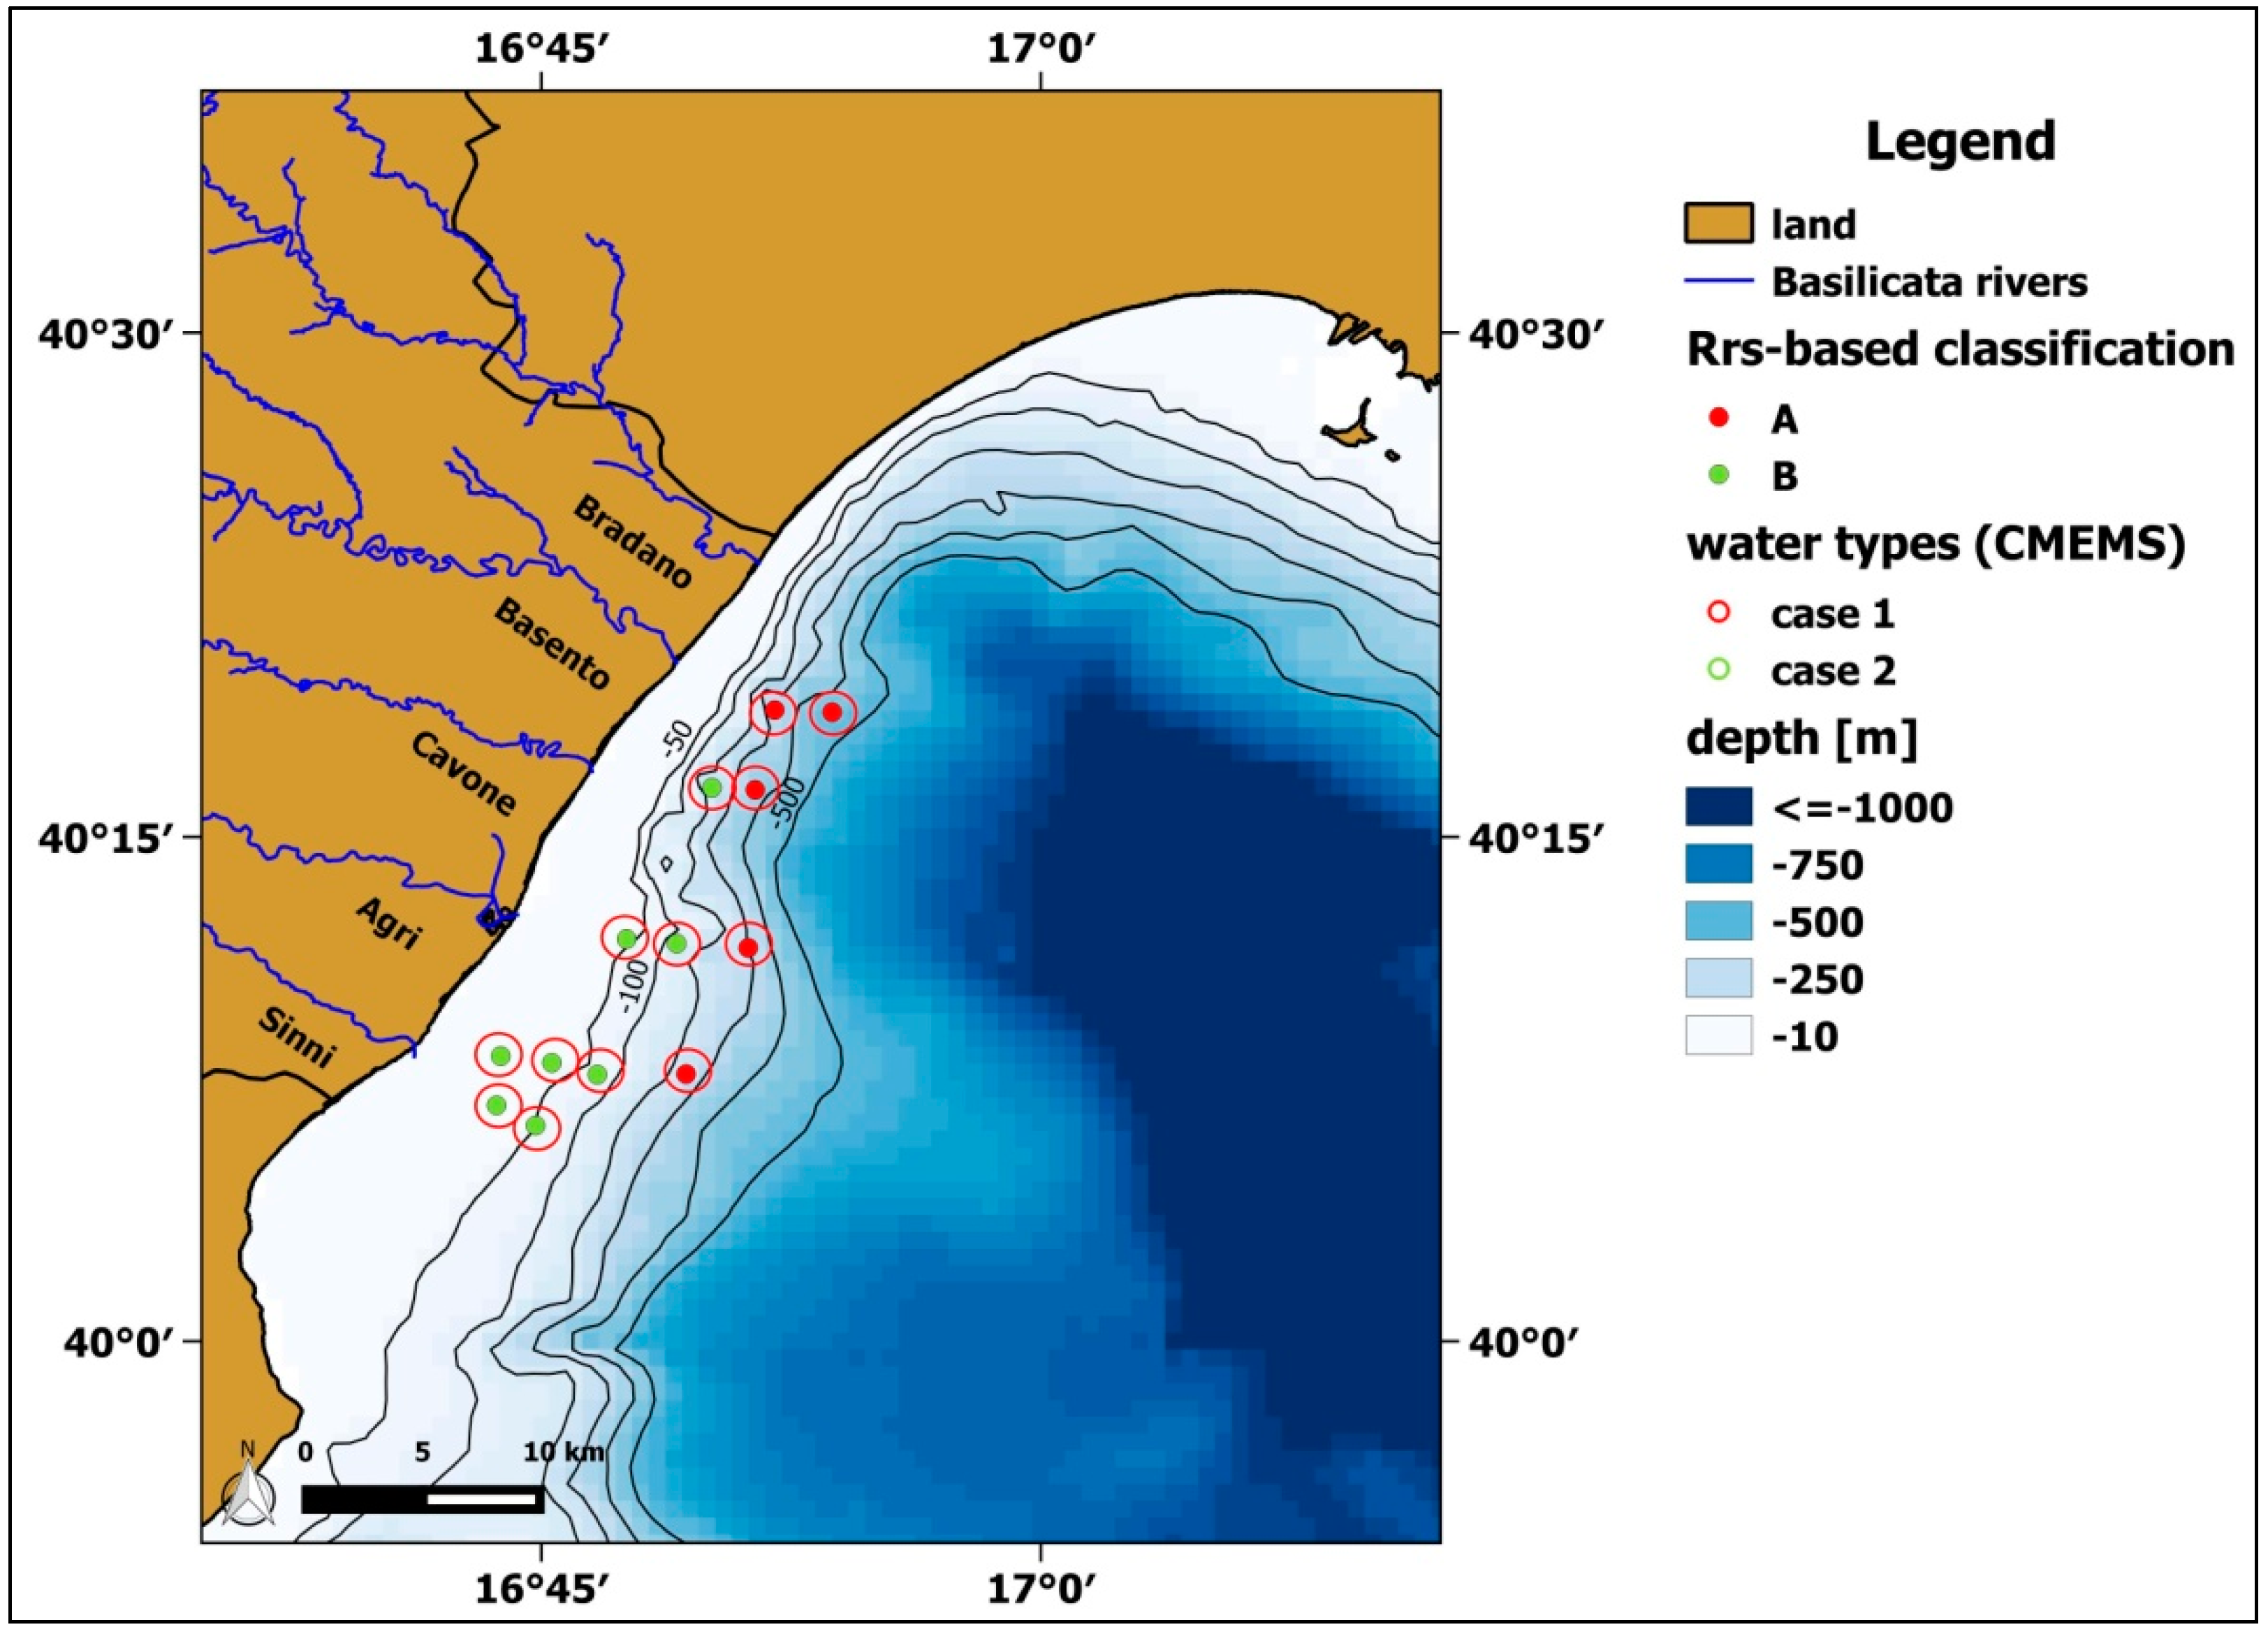
After implementing this classification method, seven sampling stations fall into class A, 19 into class B, and none into class C. To better analyze the spectral characteristics of each class, we plotted the normalized average spectral shapes (Rrs(λ)/max(Rrs(λ)) for the two identified classes, A and B (Figure 7a). Moreover, we also analysed the locations of the stations falling within the classes A and B (Figure 7b) to better investigate the strong/poor influence of the main river discharges on the Rrs(λ) spectra.
Class A showed a peak at 400 nm, a slight decrease up to about 500 nm, and a more marked fall up to longer wavelengths (beyond 600 nm). This class identifies oligotrophic waters in which the phytoplankton is the main constituent with consequent low concentrations of CDOM and NAP. This water type usually characterizes off-shore (open) waters which are a significant distance from river discharges and thus scarcely affected by coastal contribution.
Class B exhibited a peak at around 490 nm, with a progressive decrease in values as wavelengths increase. The typical spectral shape of CDM dominant waters is the blue region absorption peak (approximately at 443 nm), directly related to the presence of highly blue-absorbing materials, such as CDOM and NAP, both absorbing exponentially from longer to shorter wavelengths.
All seven stations belonging to class A were, as expected, those farthest from the coastline (with depths ranging between 200 and 500 m), where the influence of river discharges in terms of CDM amount should be attenuated or less relevant (Figure 7b). On the other hand, the other 19 stations which comprise class B are located in shallower waters (up to 100 m depth), where the NAP re-suspension is not negligible, and the land-originated CDOM concentration increases due to the proximity of river outflows (i.e., Cavone, Agri, and Sinni Rivers). Such results are in accordance with the strong coastal-offshore gradients of bio-optical variables observed by Marcelli et al. [75] in the same area through the use of in situ innovative technologies.
The performed Rrs-based classification highlights that BICW are mostly characterized by the co-existence of CDOM and NAP, thus indirectly justifying the poor capability of the empirical Med-OC3 algorithm in retrieving chl-a concentration.

3.3. Local Scale Tuning

The results achieved thus far clearly suggest that a local scale tuning of the chl-a algorithm should be focused on the analysed SAA. For this reason, we looked for the best locally tuned configuration of the absorption and scattering non-water components, a*ph(λ), aCDM(λ), and bbp(λ), adopting the most appropriate empirical relations and IOP parameterizations by exploiting a bio-optical dataset of the available in situ measurements (Rrs(λ), chl-a, aCDM).
To this aim, we considered a dataset of 46 stations (considering all the three measurement campaigns) for which simultaneous in situ measurements of Rrs(λ), chl-a, aCDM(λ) were available. Subsequently, we divided all the stations into two independent datasets, namely those of calibration and validation, characterized by 70% and 30% of stations, respectively, which were comparable also in terms of bio-optical characteristics and seasonal conditions with the same percentage of spring and summer stations.
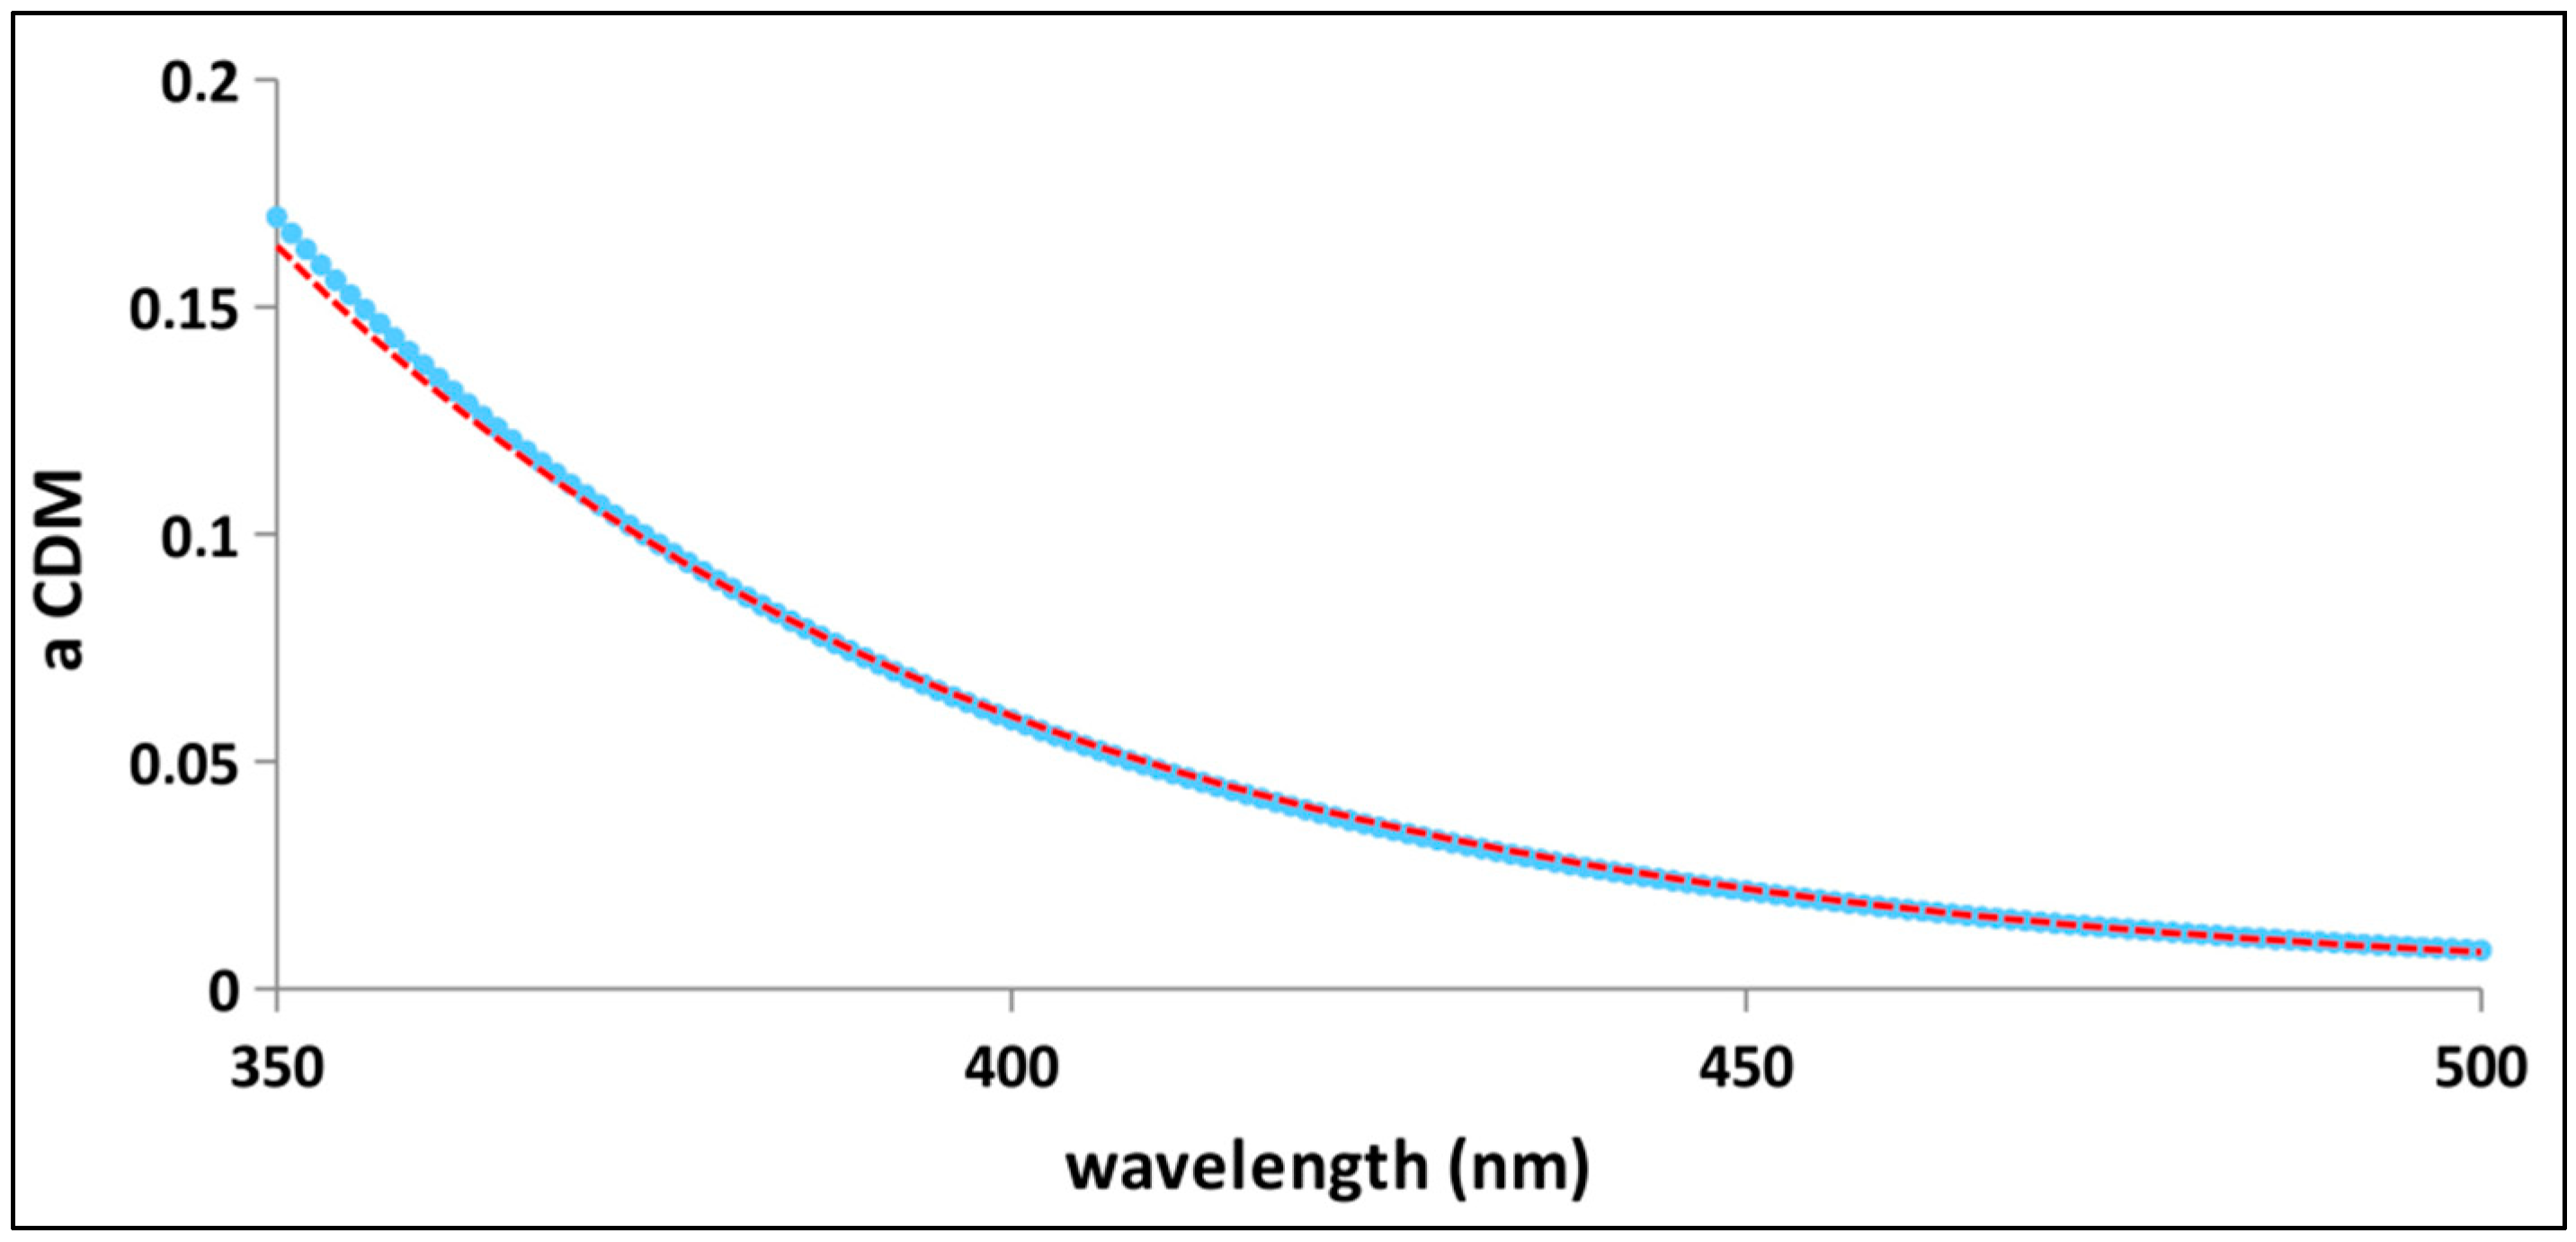
In consideration of the 32 stations within the calibration dataset, we analysed the average CDM absorption spectrum aCDM(λ) in the 350–500 nm spectral domain for its locale scale tuning (Figure 8).
Looking at Figure 8, the aCDM(λ) spectrum exhibits a common exponential decay with increasing wavelengths, defined as:
  a CDM ( λ )   =   e S ( λ λ 0 )
In addition, the dashed red line and the satisfactory derived coefficient of determination R2 (R2 > 0.99) confirms the reliability of this exponential best fit, which returned a S (coefficient of exponential decay) value of 0.0201.
Concerning the particulate back-scattering coefficient bbp(λ), we adopted a power-law relationship (as defined in Equation (13)):
  b bp ( λ )   = ( λ 0 λ ) η
where the exponent η has been derived from the in situ Rrs(λ) measurements (in situ bbp(λ) measurements were not available) via the Equations (14) and (15) [70]:
  η   =   2.2 × [ 1 1.2 × e 0.9 × r rs ( 443 ) r rs ( 555 ) ]
  r rs ( λ ) = R rs ( λ ) 0.52 + 1.7 R rs ( λ ) ,
Entering the averaged ratio rrs(443)/rrs(555) into Equation (15), we obtained the exponent η equal to 1.2031, as shown in Figure 9.
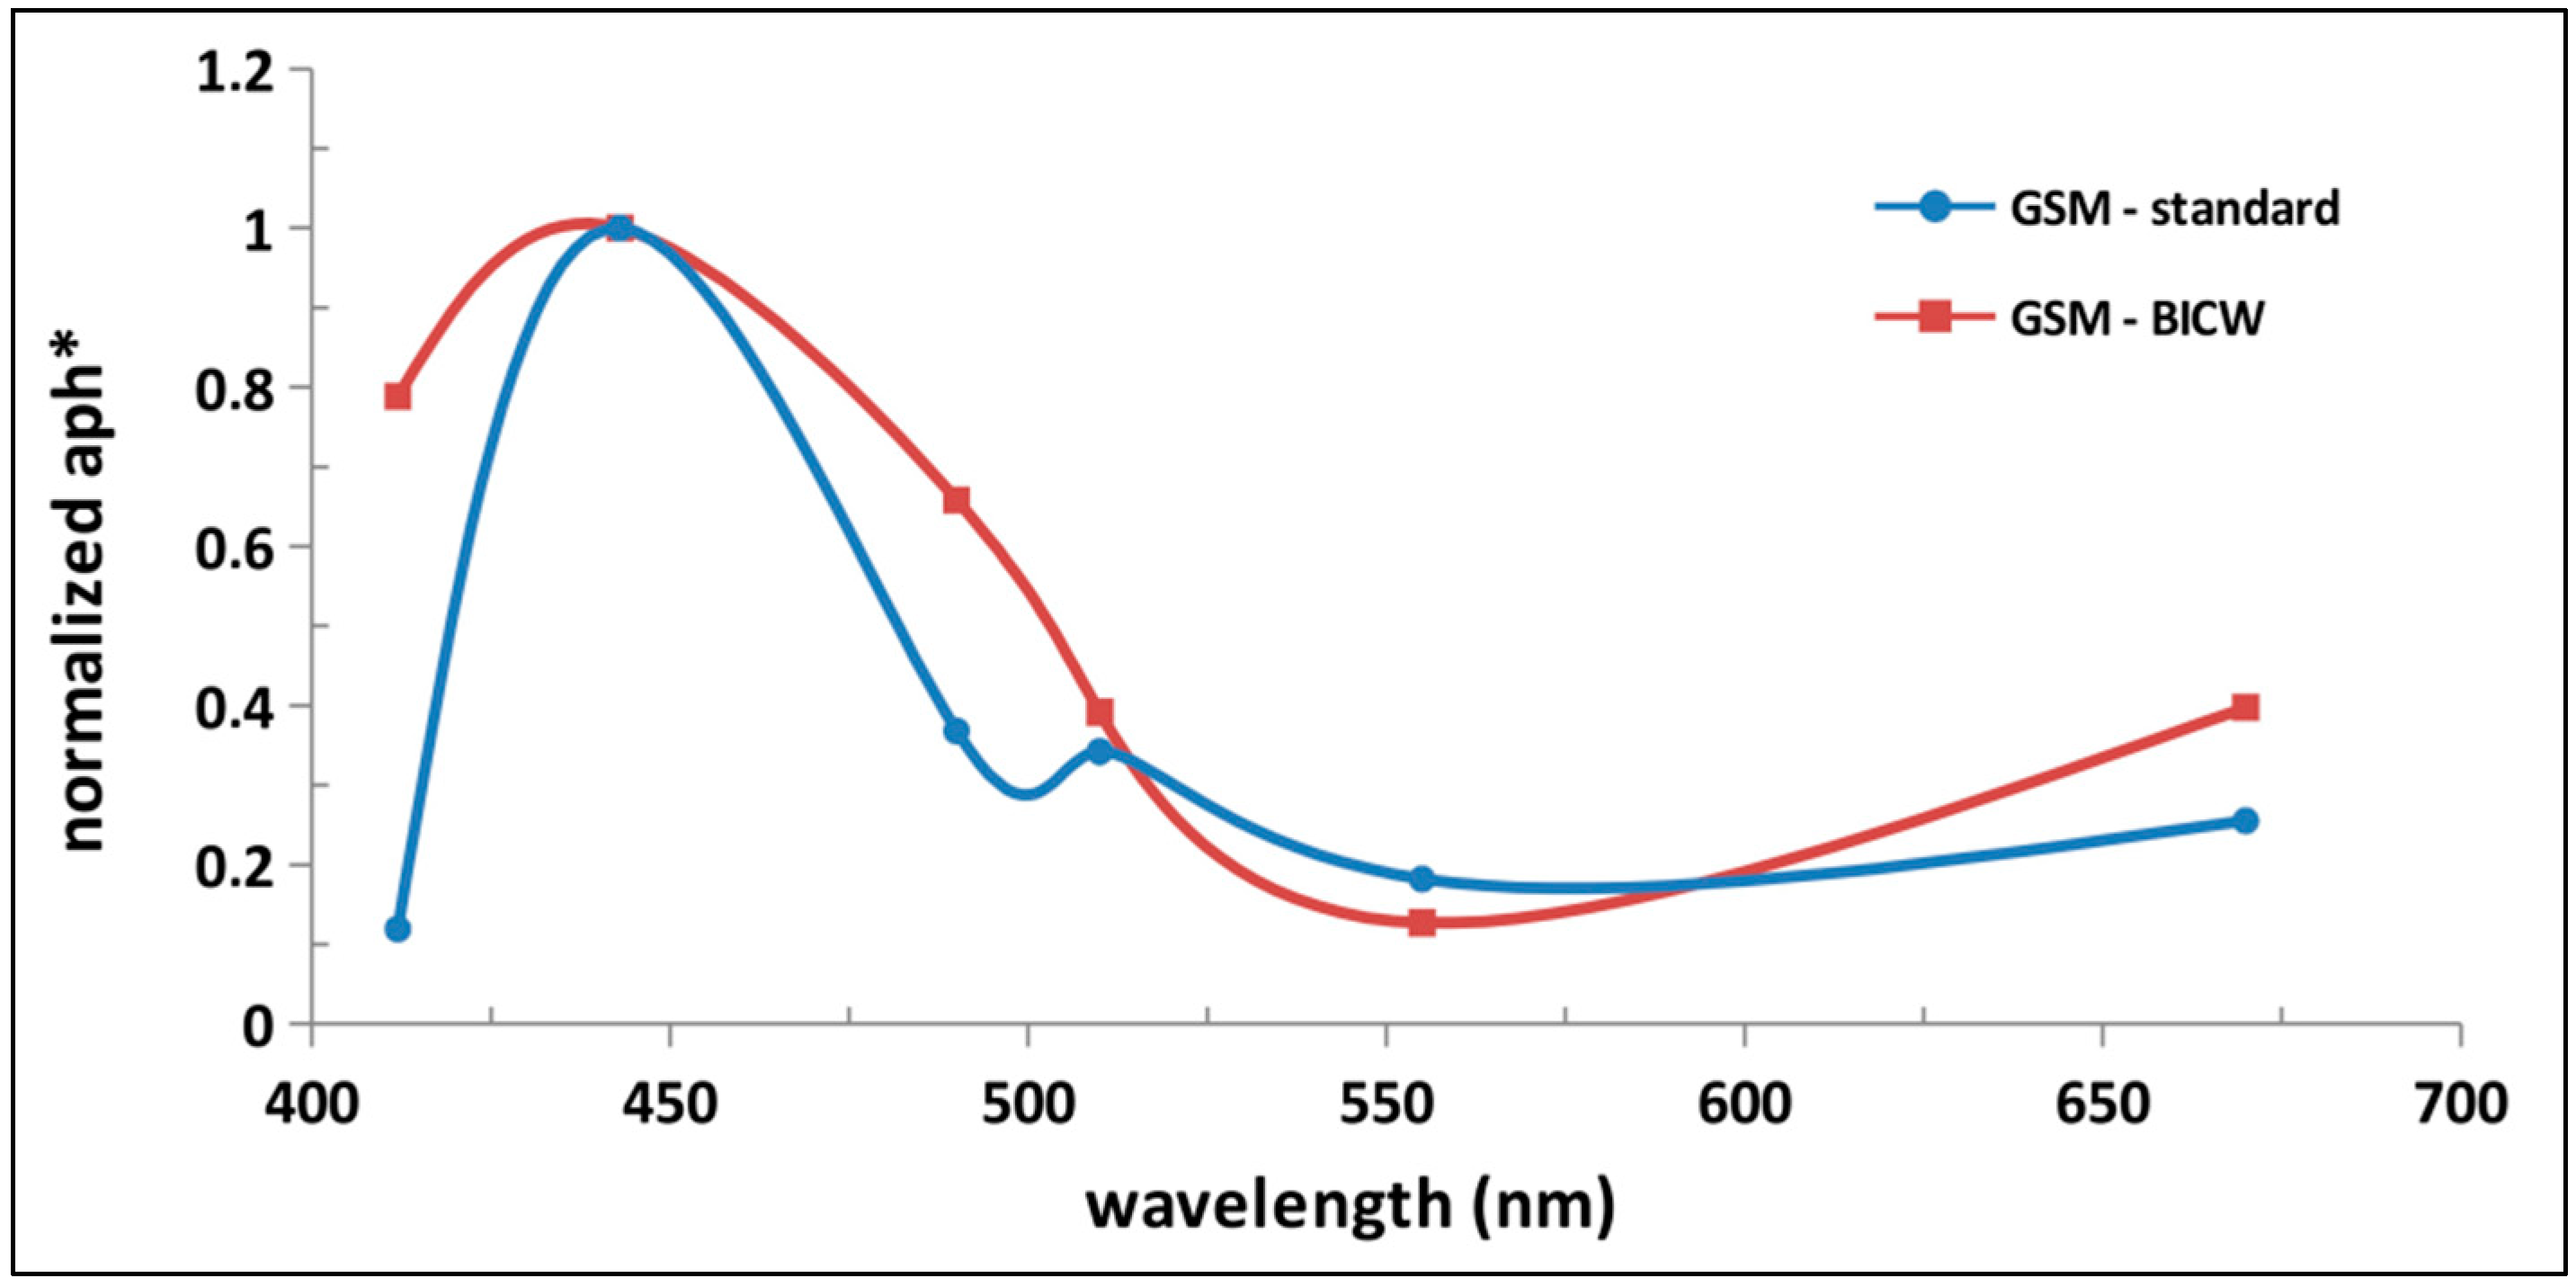
With regard to the local tuning of the chl-a specific absorption coefficient a*ph (λ), it was derived from the total chl-a concentration [Tchl-a] using the empirical power law relation originally developed by Bricaud et al. [71] (see Table 3) and adopting the coefficients A(λ) and B(λ) (tabulated in [76]), which have been recently updated for the Mediterranean basin:
  a ph * ( λ ) = A ( λ ) [ Tchl - a ] B ( λ )
Specifically, the averaged a*ph(λ) values computed for the six reference wavelengths are illustrated in Figure 10, where also the a*ph(λ) standard ones have been plotted for a comparison analysis.
The local scale tuning of the non-water absorption and scattering components is summarized in Table 5.
The adopted values of a*ph(λ), S and η shown in Table 5 are similar to those adopted within the GSM standard configuration (Table 2). Additionally, the S value is almost coincident with that of the GSM standard, the η value is slightly higher (1.2031 vs 1.0337), while the derived a*ph(λ) absolute values differ, especially at 412 nm (see Figure 10).
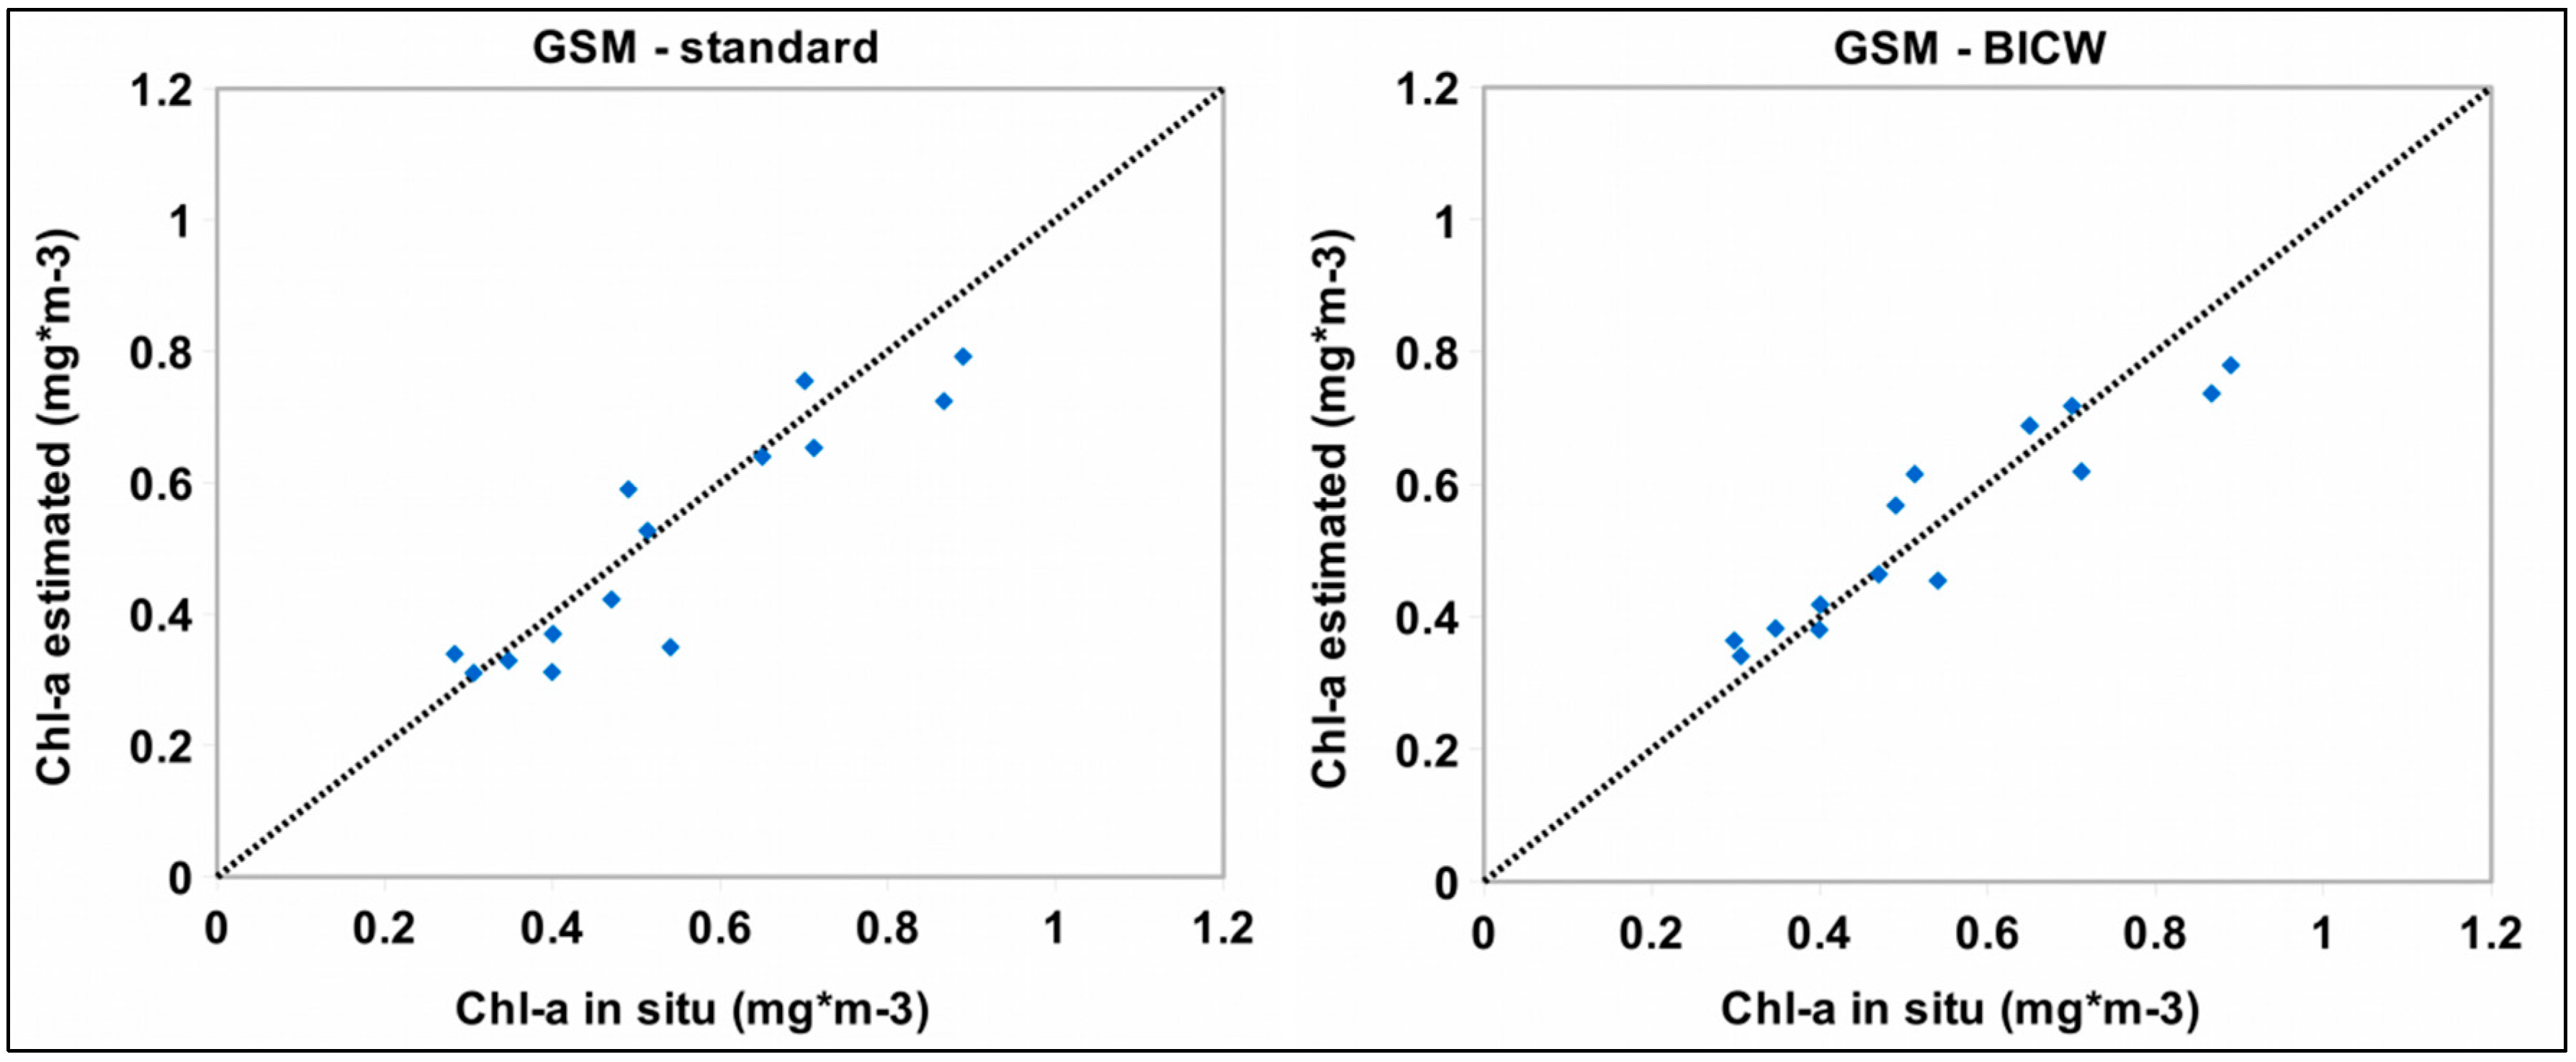
Finally, we performed the tuned-version of the GSM algorithm (GSM-BICW) by implementing this local scale configuration (Table 5). To investigate possible improvements in terms of algorithm accuracy, we carried out a chl-a match-up analysis on the 14 stations within the validation dataset (30% of the whole dataset) after applying the quality control procedure and the spatiotemporal criteria defined in the Section 2.4. Figure 11 shows the derived scatter plots for the GSM-standard (default configuration) and GSM-BICW algorithms.
The comparison between GSM-standard and GSM-BICW was performed by computing the same regression indices and statistical indicators adopted previously, as summarized in Table 6.
On the basis of the regression analyses (Figure 11) and the associated statistics (Table 6) performed, the GSM-DC and GSM-BICW algorithms exhibited only few appreciable differences, as expected, in consideration of the similar setting of the IOP parameterizations (Table 2 and Table 5). However, GSM-BICW showed a slightly better accuracy, thus recording the best regression index (adjusted R2 = 0.86) and the lowest APD and RMSE statistical errors (11.03% and 0.070%, respectively).

4. Discussion

The accuracy of MODIS standard chl-a algorithms can change depending on different marine waters because the global scale optimized regression coefficients are applied universally [10,77].
The validation of chl-a products plays a crucial role in establishing their accuracy or assessing their scientific relevance, especially in optically complex waters. Although in situ chl-a measurements are frequently referred to as the “ground truth”, chl-a satellite data might contain different error sources due to calibration, navigation, and data processing issues as well as atmospheric conditions [35]. These instrumental and environmental issues can introduce uncertainties in retrieval water leaving radiance Lw, which is the main radiometric parameter involved in the generation of derived products such as the chl-a concentration [2].
In this work, owing to the availability of an in situ measurement dataset acquired through three measurement campaigns performed within the IOSMOS project, the chl-a match-up analyses and the associated statistics have highlighted the extent to which SAA (GSM and GIOP) are more suitable than the Med-OC3 algorithm in retrieving chl-a concentration in BICW. The large gap in performance between the empirical and semi-analytical algorithms could be related to the specific bio-optical conditions of the investigated area. The bio-optical BICW characterization through the Rrs(λ) supervised classification allowed us to better understand the effect the presence of other in-water components (i.e., NAP and CDOM) has on chl-a algorithm performance. The percentage of stations falling into CDM dominant waters is significant enough to indirectly justify the poor capability of the empirical algorithm in retrieving chl-a concentration in such coastal waters, where variations in Rrs(λ) spectra are not primarily driven by the abundance of phytoplankton. The co-existence of these bio-optical constituents has likely introduced large errors in the reflectance ratios used in the OCx form algorithms, which were developed to retrieve chl-a concentration in phytoplankton dominant waters. Conversely, SAA, for their inherent design, tend to overcome this limitation, also allowing for the discrimination of the relative contributions of other bio-optical constituents (i.e., NAP and CDOM) [6]. GSM is designed to assign fixed values to the setting parameters (i.e., aph*(λ), S, and η) [29], whereas the GIOP configuration allows for the determination of the constituent absorption and scattering properties by choosing from a wide assortment of IOP parameterizations or empirical relationships [30].
In this framework, GSM and GIOP accuracy depends on how well the IOP setting configurations fit the bio-optical properties of the study area. For this reason, it is worth selecting the most appropriate empirical relationships and shape functions of the IOP components for BICW by using a bio-optical dataset of in situ measurements (Rrs(λ), chl-a, aCDOM, aNAP).
With regard to the local setting of CDM absorption spectra, the key parameter for aCDM(λ) setting was the average spectral slope S, which accounted for the contribution of each component, namely aCDOM(λ) and aNAP(λ). However, the S value could vary, depending on the different fitting technique (linear vs. non-linear) and wavelength reference range (starting at 300 nm or 400 nm) adopted [78,79]. In this work, the 350–500 nm wavelength range allowed for the maintenance of a sufficiently high signal to noise ratio, considering the CDOM and NAP high absorption properties at these wavelengths. At the same time, the choice of an exponential fitting approach (R2 > 0.99) ensured a more appropriate weighting of the absorption spectrum in comparison to the linear fit, which relies more on the low absorption/high wavelength region of the spectrum [78,80].
With regard to the particulate back-scattering coefficient bbp(λ), the lack of in situ bbp(λ) measurements could have determined a less accurate local scale setting of η value and the derived bbp(λ). The Rrs(λ)-based η value may contain uncertainties arising from in situ radiometric measurements due to non-ideal sea and sky conditions or calibration issues [72]. However, the η estimation from a Rrs(443)-to-Rrs(555) ratio [70] enabled the minimization of uncertainties due to atmospheric conditions, which are usually comparable for the green and blue bands when aerosols are not absorbing [81]. Among the different methods available in literature [26,29,82] to estimate η, the model proposed by Lee et al. [70] (QAA-v5) is mathematically simple and physically transparent; it is also easily adaptable to various multi-spectral/hyperspectral sensors, such as the ASD Field Spec Pro spectroradiometer used in this work [35].
Within the local tuning of the chl-a specific absorption coefficient a*ph(λ), it is worth considering that phytoplankton light absorption properties can change according to the algal community size structure, pigment composition [83,84], or their physiological state [76,85,86]. Although it is difficult to account for all these phenological variables, the constant/fixed a*ph(λ) values are less realistic than those derived from an empirical relation in which the a*ph(λ) coefficients can vary as a function of [Tchl-a] as in Bricaud et al. [71].
Accordingly, it was possible to identify the best configuration for the BICW in terms of IOP parameterizations. The BICW-tuned version of MODIS-A chl-a algorithm was performed on the GSM-based configuration, taking into account the slightly better performance of the GSM algorithm in comparison to GIOP (Table 4). Furthermore, the IOP dataset available for the GSM-BICW implementation was not so bio-optically comprehensive as to suggest the adoption of a GIOP-based algorithm, that was more inherently complex than GSM [30].
For this reason, the bio-optical characterization at the local scale should be improved, providing a BICW sufficiently more representative in situ dataset through additional IOP estimates, such as in situ bbp(λ) measurements. Additionally, the acquisition of sampling data in all the seasonal conditions could make both the IOP local setting and the validation phase more statistically significant.
Finally, the implications of these results should be investigated within the broader framework of the European MSFD directives aimed at maintaining GES. The Copernicus Marine Environment Monitoring Service (CMEMS) lends support to both European and regional decision makers implied in European policies linked to MSFD [87] by delivering several products (both based on in situ and satellite data) related to the state of oceans and regional seas [87]. Among these, the CMEMS chl-a product (OCEANCOLOUR_MED_CHL_L3_REP_OBSERVATIONS_009_073, hereafter abbreviated as CMEMS-L3) [88] is a multi-sensor merged output (reprocessed at daily scale and 1 km spatial resolution) that identifies the surface chl-a concentration via two switchable algorithms, namely Med-OC4 [5] for Case 1 waters and AD4 [89] for Case 2 waters type.
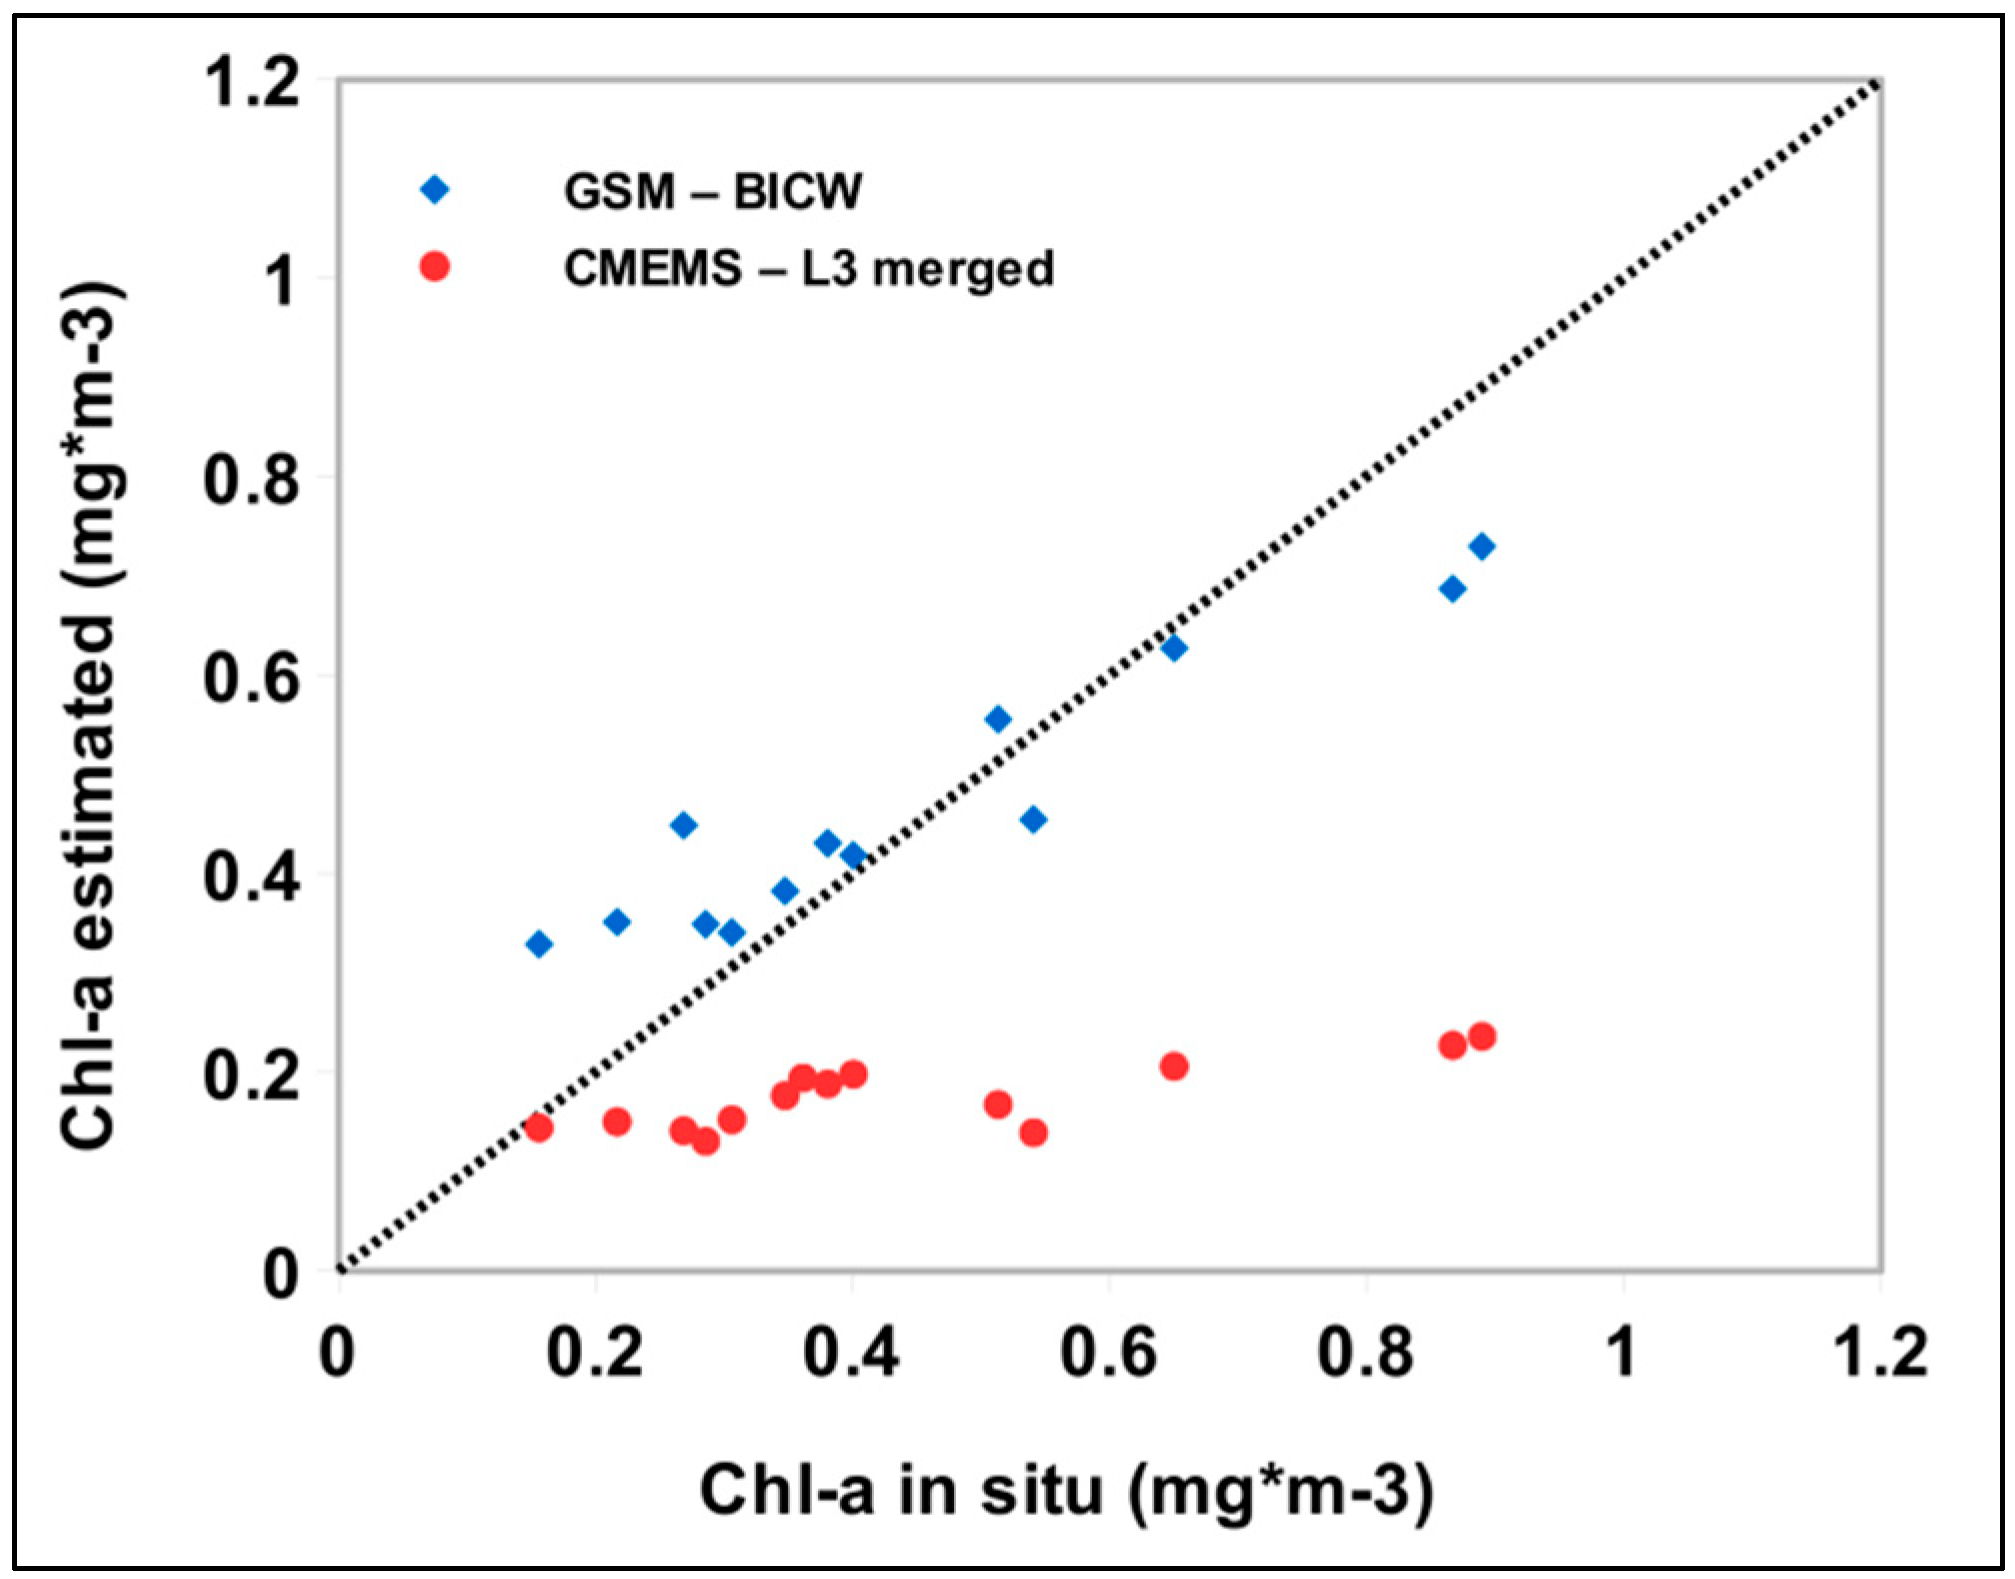
Beginning with the in situ measurements already used for the match-up analysis (see Figure 4), a comparison between GSM-BICW and CMEMS-L3 outputs was performed but which only considered 13 among the 26 stations available (taking into account the standard CMEMS-L3 quality check) (Figure 12).
Between the two products, CMEMS-L3 exhibited the lowest adjusted R2 value (0.59 vs. 0.88 of GSM-BICW) and an average ratio of satellite-to-in situ data (r) not higher than 0.43, thus suggesting a clear underestimation.
Considering that CMEMS-L3 is a merged Case 1–Case 2 product, this result could have been affected by uncertainties in discrimination between the two water types at pixel level. The identification of the two water types was performed by comparing the satellite spectrum at pixel level, with the average water type spectral signature from two distinct in situ Rrs(λ) datasets, namely Med-OC4 [5] for Case 1 and CoASTS [90] for Case 2 waters.
The availability of the in situ Rrs(λ) measurements allowed for a better assessment of the nature of such uncertainties. On the basis of the results of the Rrs(λ) supervised classification (see Section 3.2), 70% of the chl-a samples (i.e., nine stations) considered in this last analysis fell into CDM dominant waters (class B) or Case 2 waters, but all of them were marked by Case 1-water type within the CMEMS-L3 product, as shown in Figure 13.
For most of the considered stations, the wrong water type characterization could have determined the implementation of an unsuitable algorithm, Med-OC4 in this case, which generally shows poor accuracy in case waters 2 [8].
The inclusion of in situ Rrs(λ) measurements related to this poorly investigated area (i.e., BICW) in the Rrs(λ) development datasets might have improved the CMEMS-L3 product performance. Furthermore, the recent availability of new chl-a products in the CMEMS catalogue probably allowed these limitations to be overcome. The new Near-Real-Time (NRT) L3 chl-a products (i.e., OCEANCOLOUR_MED_CHL_L3_NRT_OBSERVATIONS_009_040) [88], available since April 2016, have been updated through a reliance on more recent OC sensors, such as Ocean and Land Colour Instrument (OLCI) on board Sentinel-3A (S3A). The better spatial resolution and spectral configuration of S3A-OLCI should guarantee an accuracy improvement of the chl-a satellite estimates [91]. The 300 m spatial resolution of these data can, at least, improve the accuracy in detecting the chl-a spatial variability on the 3 × 3-pixel box used for chl-a match-up analysis. In addition, the OLCI spectral configuration, properly designed for optically complex waters, is more suitable to retrieve information about different in-water components by including, for instance, different red and near-infrared (NIR) spectral bands (e.g., at 665, 673.75, and 681.25 nm) associated with chl-a absorption and fluorescence features [92].
The findings achieved in this work highlight the need to regionalize the standard satellite-based chl-a algorithms, which have not been properly developed for coastal or optically complex waters. Several studies [32,33,93,94] have already highlighted the usefulness to define locally tuned chl-a algorithms for monitoring poorly investigated area or crucial marine environments. In different regions, such as the northern South China Sea [32], Arabian Sea [33], the Alboran Sea [93], or the Patagonian Continental Shelf [94], the empirical and semi-analytical algorithms have showed dissimilar performances in chl-a retrievals, thus confirming that each marine environment deserves a local scale tuning based on its specific bio-optical properties.
Finally, accurate chl-a satellite estimates can play an important role in providing ongoing information useful for the end-user involved in all the activities linked to the exploitation of marine resources, such as water quality status, fishing, or aquaculture. The chl-a concentration, considered a good predictor for phytoplankton growth or primary production, can indeed be regarded as a fish stock index or a biological indicator of water quality status. Furthermore, the derived estimation of primary production is a quick way to measure roughly the phytoplankton biomass involved in aquaculture systems [95].

5. Conclusions

In this study, we evaluated the most suitable chl-a algorithm for the Basilicata Ionian Coastal Waters (BICW), a sub-set of the Gulf of Taranto, by comparing the performance of three empirical and semi-analytical MODIS-Aqua chl-a algorithms, namely Med-OC3, GSM, and GIOP. Representative chl-a maps of spring and summer days related to the above-mentioned chl-a algorithms showed a predictable chl-a overestimation of the empirical Med-OC3 algorithm, specifically in the summer season, when constantly high chl-a values occurred especially in coastal waters. The chl-a match-up analyses and the associated statistics further confirmed the poor performance of the Med-OC3 algorithm that showed a statistically not significant regression index (adjusted R2 equal to 0.12) and an almost twofold over-estimation (with 1.81 r value), also confirmed by the highest APD (84.11%) value. Otherwise, the SAA, GSM, and GIOP exhibited good performance and a nil over-estimation, as proved by an adjusted R2, ranging between 0.74 and 0.79, and r values close to 1, respectively. Furthermore, RMSE and APD statistical errors significantly decreased, recording the minimum values of 0.09 (for GIOP) and 21.61% (for GSM), respectively.
The subsequent Rrs(λ) spectra analysis and the proposed supervised classification allowed for a better characterization of the specific bio-optical conditions and an understanding of the large gap in performance between the empirical and semi-analytical algorithms. Most of the analysed stations (70%) fall into CDM dominant waters, where NAP re-suspension and land-originated CDOM probably affected the Rrs(λ) spectra of the stations closest to the shoreline.
Finally, a local scale assessment of the IOP components was performed by exploiting a bio-optical dataset of in situ measurements (Rrs(λ), chl-a, aCDM, aNAP). Subsequently, the most appropriate empirical relationships and shape functions of the IOP components were selected and implemented to define a BICW-tuned version of GSM algorithm, namely GSM-BICW. The regression analysis of this algorithm showed the best regression index (adjusted R2 = 0.86) and the lowest APD and RMSE statistical errors (11.03% and 0.070 respectively), thus recording a slight improvement in accuracy compared to the GSM-standard algorithm.
The results achieved in this work further confirm the need to regionalize the standard MODIS chl-a algorithms, especially in optically-complex or poorly investigated area (i.e., BICW) to ensure their adequate exploitation within coastal management systems.

Author Contributions

E.C. and T.L. wrote the majority of the paper. E.C., C.D.P., T.L., A.M., S.P., and V.P. collected and processed the in situ measurements. C.D.P., E.C., and V.S. collected and analysed MODIS data. E.C. performed the match-up analysis and the local scale tuning. N.P. and V.T. contributed in interpreting results and writing the paper.

Funding

The research leading to these results has received funding from the Ionian Sea water quality Monitoring by Satellite (IOSMOS) project co-funded in the framework of the OP European Regional Development Fund (ERDF) Basilicata Region 2007–2013 (Project code: 71/2012/20).

Acknowledgments

We would like to thank the anonymous reviewers for their valuable comments, which helped to improve the quality of this paper.

Conflicts of Interest

The authors declare no conflict of interest.

References

  1. European Commission. Directive2008/56/EC of the European Parliament and of the Council of 17 June 2008, establishing a framework for community action in the field of marine environmental policy (Marine Strategy Framework Di-rective). Off. J. Eur. Union 2008, L164, 19–40. [Google Scholar]
  2. Zheng, G.; Di Giacomo, P.M. Uncertainties and applications of satellite-derived coastal water quality products. Progr. Oceanogr. 2017, 159, 45–72. [Google Scholar] [CrossRef]
  3. Cristina, S.; Icely, J.; Goela, P.C.; Del Valls, T.A.; Newton, A. Using remote sensing as a support to the implementation of the European Marine Strategy Framework Directive in SW Portugal. Cont. Shelf Res. 2015, 108, 169–177. [Google Scholar] [CrossRef] [Green Version]
  4. Schiller, A.; Brassington, G.B. Operational Oceanography in the 21st Century; Springer Science & Business Media: Berlin, Germany, 2011. [Google Scholar]
  5. Volpe, G.; Santoleri, R.; Vellucci, V.; d’Alcalà, M.R.; Marullo, S.; d’Ortenzio, F. The colour of the Mediterranean Sea: Global versus regional bio-optical algorithms evaluation and implication for satellite chlorophyll estimates. Remote Sens. Environ. 2007, 107, 625–638. [Google Scholar] [CrossRef]
  6. Brewin, R.J.; Sathyendranath, S.; Müller, D.; Brockmann, C.; Deschamps, P.Y.; Devred, E.; Doerffer, R.; Fomferra, N.; Franz, B.; Grant, M.; et al. The Ocean Colour Climate Change Initiative: III. A round-robin comparison on in-water bio-optical algorithms. Remote Sens. Environ. 2015, 162, 271–294. [Google Scholar] [CrossRef] [Green Version]
  7. O’Reilly, J.E.; Maritorena, S.; Mitchell, B.G.; Siegel, D.A.; Carder, K.L.; Garver, S.A.; Garver, M.K.; McClain, C. Ocean color chlorophyll algorithms for SeaWiFS. J. Geophys. Res. Oceans 1998, 103, 24937–24953. [Google Scholar] [CrossRef] [Green Version]
  8. Dierssen, H.M. Perspectives on empirical approaches for ocean color remote sensing of chlorophyll in a changing climate. Proc. Natl. Acad. Sci. USA 2010, 107, 17073–17078. [Google Scholar] [CrossRef] [PubMed] [Green Version]
  9. O’Reilly, J.E.; Maritorena, S.; O’brien, M.C.; Siegel, D.A.; Toole, D.; Menzies, D.; Smith, R.C.; Muller, J.L.; Mitchell, B.G.; Kahru, M.; et al. SeaWiFS postlaunch calibration and validation analyses, part 3. NASA Tech. Memo. 2000, 206892, 3–8. [Google Scholar]
  10. Gregg, W.W.; Casey, N.W. Global and regional evaluation of the SeaWiFS chlorophyll data set. Remote Sens. Environ. 2004, 93, 463–479. [Google Scholar] [CrossRef]
  11. Santoleri, R.; Volpe, G.; Marullo, S.; Nardelli, B.B. Open waters optical remote sensing of the Mediterranean Sea. In Remote Sensing of the European Seas; Springer: Dordrecht, The Netherlands, 2008; pp. 103–116. [Google Scholar]
  12. D’Ortenzio, F.; Marullo, S.; Ragni, M.; d’Alcalà, M.R.; Santoleri, R. Validation of empirical SeaWiFS algorithms for chlorophyll-a retrieval in the Mediterranean Sea: A case study for oligotrophic seas. Remote Sens. Environ. 2002, 82, 79–94. [Google Scholar] [CrossRef]
  13. Bricaud, A.; Bosc, E.; Antoine, D. Algal biomass and sea surface temperature in the Mediterranean basin: Intercomparison of data from various satellite sensors, and implications for primary production estimates. Remote Sens. Environ. 2002, 81, 163–178. [Google Scholar] [CrossRef]
  14. Odermatt, D.; Gitelson, A.; Brando, V.E.; Schaepman, M. Review of constituent retrieval in optically deep and complex waters from satellite imagery. Remote Sens. Environ. 2012, 118, 116–126. [Google Scholar] [CrossRef] [Green Version]
  15. Darecki, M.; Stramski, D. An evaluation of MODIS and SeaWiFS bio-optical algorithms in the Baltic Sea. Remote Sens. Environ. 2004, 89, 326–350. [Google Scholar] [CrossRef]
  16. Schofield, O.; Arnone, R.A.; Bissett, W.P.; Dickey, T.D.; Davis, C.O.; Finkel, Z.; Oliver, M.; Moline, M.A. Watercolors in the coastal zone: what can we see? Biol. Sci. 2004, 144, 32–37. [Google Scholar] [CrossRef]
  17. Cannizzaro, J.P.; Carder, K.L. Estimating chlorophyll a concentrations from remote-sensing reflectance in optically shallow waters. Remote Sens. Environ. 2006, 101, 13–24. [Google Scholar] [CrossRef]
  18. Campanelli, A.; Pascucci, S.; Betti, M.; Grilli, F.; Marini, M.; Pignatti, S.; Guicciardi, S. An Empirical Ocean Colour Algorithm for Estimating the Contribution of Coloured Dissolved Organic Matter in North-Central Western Adriatic Sea. Remote Sens. 2017, 9, 180. [Google Scholar] [CrossRef]
  19. Werdell, J. Global Bio-optical Algorithms for Ocean Color Satellite Applications: Inherent Optical Properties Algorithm Workshop at Ocean Optics XIX; Barga, Italy, 3–4 October 2008. Eos Trans. Am. Geophys. Union 2009, 90, 4. [Google Scholar] [CrossRef]
  20. Gitelson, A.A.; Gurlin, D.; Moses, W.J.; Barrow, T. A bio-optical algorithm for the remote estimation of the chlorophyll-a concentration in case 2 waters. Environ. Res. Lett. 2009, 4, 045003. [Google Scholar] [CrossRef]
  21. Moses, W.J.; Gitelson, A.A.; Berdnikov, S.; Povazhnyy, V. Satellite estimation of chlorophyll-a concentration using the red and NIR bands of MERIS—The Azov sea case study. IEEE Geosci. Remote Sens. Lett. 2009, 6, 845–849. [Google Scholar] [CrossRef]
  22. Mishra, S.; Mishra, D.R. Normalized difference chlorophyll index: A novel model for remote estimation of chlorophyll-a concentration in turbid productive waters. Remote Sens. Environ. 2012, 117, 394–406. [Google Scholar] [CrossRef]
  23. Dall’Olmo, G.; Gitelson, A.A.; Rundquist, D.C. Towards a unified approach for remote estimation of chlorophyll-a in both terrestrial vegetation and turbid productive waters. Geophys. Res. Lett. 2003, 30. [Google Scholar] [CrossRef] [Green Version]
  24. Hoge, F.E.; Lyon, P.E. Satellite retrieval of inherent optical properties by linear matrix inversion of oceanic radiance models: An analysis of model and radiance measurement errors. J. Geophys. Res. 1996, 101, 16631–16648. [Google Scholar] [CrossRef]
  25. Garver, S.A.; Siegel, D.A. Inherent optical property inversion of ocean color spectra and its biogeochemical interpretation 1. Time series from the Sargasso Sea. J. Geophys. Res. 1997, 102, 18607–18625. [Google Scholar] [CrossRef]
  26. Loisel, H.; Stramski, D. Estimation of the inherent optical properties of natural waters from the irradiance attenuation coefficient and reflectance in the presence of Raman scattering. Appl. Opt. 2000, 39, 3001–3011. [Google Scholar] [CrossRef] [PubMed]
  27. Wang, P.; Boss, E.S.; Roesler, C. Uncertainties of inherent optical properties obtained from semianalytical inversions of ocean color. Appl. Opt. 2005, 44, 4074–4085. [Google Scholar] [CrossRef] [PubMed]
  28. Smyth, T.J.; Moore, G.F.; Hirata, T.; Aiken, J. Semianalytical model for the derivation of ocean color inherent optical properties: Description, implementation, and performance assessment. Appl. Opt. 2006, 45, 8116–8131. [Google Scholar] [CrossRef] [PubMed]
  29. Maritorena, S.; Siegel, D.A.; Peterson, A.R. Optimization of a semianalytical ocean color model for global-scale applications. Appl. Opt. 2002, 41, 2705–2714. [Google Scholar] [CrossRef] [PubMed]
  30. Franz, B.A.; Werdell, P.J. A generalized framework for modeling of inherent optical properties in ocean remote sensing applications. Proc. Ocean Opt. 2010, 27, 1–13. [Google Scholar]
  31. Werdell, P.J.; Franz, B.A.; Bailey, S.W.; Feldman, G.C.; Boss, E.; Brando, V.E.; Dowell, M.; Hirata, T.; Lavender, S.J.; Lee, Z.; et al. Generalized ocean color inversion model for retrieving marine inherent optical properties. Appl. Opt. 2013, 52, 2019–2037. [Google Scholar] [CrossRef] [PubMed] [Green Version]
  32. Carder, K.L.; Chen, F.R.; Lee, Z.P.; Hawes, S.K.; Kamykowski, D. Semianalytic Moderate-Resolution Imaging Spectrometer algorithms for chlorophyll a and absorption with bio-optical domains based on nitrate-depletion temperatures. J. Geophys. Res. Oceans 1999, 104, 5403–5421. [Google Scholar] [CrossRef]
  33. Lee, Z.P.; Carder, K.L.; Peacock, T.G.; Davis, C.O.; Mueller, J.L. Method to derive ocean absorption coefficients from remote-sensing reflectance. Appl. Opt. 1996, 35, 453–462. [Google Scholar] [CrossRef] [PubMed]
  34. Lee, Z.; Carder, K.L.; Mobley, C.D.; Steward, R.G.; Patch, J.S. Hyperspectral remote sensing for shallow waters: 2. Deriving bottom depths and water properties by optimization. Appl. Opt. 1999, 38, 3831–3843. [Google Scholar] [CrossRef] [PubMed]
  35. Lee, Z. Remote Sensing of Inherent Optical Properties: Fundamentals, Tests of Algorithms, and Applications; International Ocean-Colour Coordinating Group: Monterey, CA, USA, 2006; Volume 5. [Google Scholar]
  36. Shang, S.L.; Dong, Q.; Hu, C.M.; Lin, G.; Li, Y.H.; Shang, S.P. On the consistency of MODIS chlorophyll—A products in the northern South China Sea. Biogeosciences 2014, 11, 269–280. [Google Scholar] [CrossRef]
  37. Tilstone, G.H.; Lotliker, A.A.; Miller, P.I.; Ashraf, P.M.; Kumar, T.S.; Suresh, T.; Ragavan, B.R.; Menon, H.B. Assessment of MODIS-Aqua chlorophyll-a algorithms in coastal and shelf waters of the eastern Arabian Sea. Cont. Shelf Res. 2013, 65, 14–26. [Google Scholar] [CrossRef]
  38. Di Polito, C.; Ciancia, E.; Coviello, I.; Doxaran, D.; Lacava, T.; Pergola, N.; Satriano, V.; Tramutoli, V. On the Potential of Robust Satellite Techniques Approach for SPM Monitoring in Coastal Waters: Implementation and Application over the Basilicata Ionian Coastal Waters Using MODIS-Aqua. Remote Sens. 2016, 8, 922. [Google Scholar] [CrossRef]
  39. Matarrese, R.; Chiaradia, M.T.; Tijani, K.; Morea, A.; Carlucci, R. ‘Chlorophyll a’ multi-temporal analysis in coastal waters with MODIS data. Rivista Italiana di Telerilevamento 2011, 43, 39–48. [Google Scholar]
  40. Ciancia, E.; Coviello, I.; Di Polito, C.; Lacava, T.; Pergola, N.; Satriano, V.; Tramutoli, V. Investigating the chlorophyll-a variability in the Gulf of Taranto (North-western Ionian Sea) by a multi-temporal analysis of MODIS-Aqua Level 3/Level 2 data. Cont. Shelf Res. 2018, 155, 34–44. [Google Scholar] [CrossRef]
  41. D’Ortenzio, F.; Ribera d’Alcalà, M. On the trophic regimes of the Mediterranean Sea: A satellite analysis. Biogeosciences 2009, 6, 139–148. [Google Scholar] [CrossRef]
  42. Volpe, G.; Nardelli, B.B.; Cipollini, P.; Santoleri, R.; Robinson, I.S. Seasonal to interannual phytoplankton response to physical processes in the Mediterranean Sea from satellite observations. Remote Sens. Environ. 2012, 117, 223–235. [Google Scholar] [CrossRef]
  43. Mayot, N.; D’Ortenzio, F.; d’Alcala, M.R.; Lavigne, H.; Claustre, H. Interannual variability of the Mediterranean trophic regimes from ocean color satellites. Biogeosciences 2016, 13, 1901–1917. [Google Scholar] [CrossRef] [Green Version]
  44. Aiello, A.; Canora, F.; Pasquariello, G.; Spilotro, G. Shoreline variations and coastal dynamics: A space–time data analysis of the Jonian littoral, Italy. Estuar. Coast. Shelf Sci. 2013, 129, 124–135. [Google Scholar] [CrossRef]
  45. Rossi, S.; Auroux, C.; Mascle, J. The Gulf of Taranto (Southern Italy): Seismic stratigraphy and shallow structure. Mar. Geol. 1983, 51, 327–346. [Google Scholar] [CrossRef]
  46. Bignami, F.; Sciarra, R.; Carniel, S.; Santoleri, R. Variability of Adriatic Sea coastal turbid waters from SeaWiFS imagery. J. Geophys. Res. Oceans 2007, 112. [Google Scholar] [CrossRef] [Green Version]
  47. Turchetto, M.; Boldrin, A.; Langone, L.; Miserocchi, S.; Tesi, T.; Foglini, F. Particle transport in the Bari canyon (southern Adriatic Sea). Mar. Geol. 2007, 246, 231–247. [Google Scholar] [CrossRef]
  48. Oddo, P.; Guarnieri, A. A study of the hydrographic conditions in the Adriatic Sea from numerical modelling and direct observations (2000–2008). Ocean Sci. 2011, 7, 549–567. [Google Scholar] [CrossRef] [Green Version]
  49. Samaras, A.G. A coupled wave-3-D hydrodynamics model of the Taranto Sea (Italy): A multiple-nesting approach. Nat. Hazards Earth Syst. Sci. 2016, 16, 2071–2083. [Google Scholar]
  50. Federico, I.; Pinardi, N.; Coppini, G.; Oddo, P.; Lecci, R.; Mossa, M. Coastal ocean forecasting with an unstructured grid model in the southern Adriatic and northern Ionian seas. Nat. Hazards Earth Syst. Sci. 2017, 17, 45–59. [Google Scholar] [CrossRef] [Green Version]
  51. Pinardi, N.; Lyubartsev, V.; Cardellicchio, N.; Caporale, C.; Ciliberti, S.; Coppini, G.; de Pascalis, F.; Dialti, L.; Federico, I.; Filippone, M. Marine Rapid Environmental Assessment in the Gulf of Taranto: A multiscale approach. Nat. Hazards Earth Syst. Sci. 2016, 16, 2623–2639. [Google Scholar] [CrossRef]
  52. Trotta, F.; Fenu, E.; Pinardi, N.; Bruciaferri, D.; Giacomelli, L.; Federico, I.; Coppini, G. A Structured and Unstructured grid Relocatable ocean platform for Forecasting (SURF). Deep Sea Res. Part II: Top. Stud. Oceanogr. 2016, 133, 54–75. [Google Scholar] [CrossRef]
  53. Trotta, F.; Pinardi, N.; Fenu, E.; Grandi, A.; Lyubartsev, V. Multi-nest high-resolution model of submesoscale circulation features in the Gulf of Taranto. Ocean Dyn. 2017, 67, 1609–1625. [Google Scholar] [CrossRef] [Green Version]
  54. Verri, G.; Pinardi, N.; Oddo, P.; Ciliberti, S.A.; Coppini, G. River runoff influences on the Central Mediterranean overturning circulation. Clim. Dyn. 2018, 50, 1675–1703. [Google Scholar] [CrossRef]
  55. Autorità di Bacino della Basilicata. Available online: http://www.autoritadibacino.basilicata.it/adb/Pstralcio/pianoacque/Relazione_ottobre_2014.pdf (accessed on 19 June 2018).
  56. Cavalli, R.M. Retrieval of Sea Surface Temperature from MODIS Data in Coastal Waters. Sustainability 2017, 9, 2032. [Google Scholar] [CrossRef]
  57. ISO 10260. Water Quality Measurement of Biochemical Parameters Spectrometric Determination of the Chlorophyll a Concentration; International Organization for Standardization: Geneva, Switzerland, 1992. [Google Scholar]
  58. Mitchell, B.G.; Kahru, M.; Wieland, J.; Stramska, M.; Mueller, J.L. Determination of spectral absorption coefficients of particles, dissolved material and phytoplankton for discrete water samples. Ocean Opt. Protoc. Satell. Ocean Color Sens. Valid. Rev. 2002, 3, 231. [Google Scholar]
  59. Twardowski, M.S.; Boss, E.; Sullivan, J.M.; Donaghay, P.L. Modeling the spectral shape of absorption by chromophoric dissolved organic matter. Mar. Chem. 2004, 89, 69–88. [Google Scholar] [CrossRef]
  60. Kishino, M.; Okami, N.; Takahashi, M.; Ichimura, S. Light utilization efficiency and quantum yield of phytoplankton in a thermally stratified sea. Limnol. Oceanogr. 1986, 31, 557–566. [Google Scholar] [CrossRef]
  61. ViewSpec Pro Software Manual, ASD Inc. 2008. Available online: http://www.grss-ieee.org/lep4/project_materials_for_web/viewspecpro_manual.pdf (accessed on 19 June 2018).
  62. Mueller, J.L.; Fargion, G.S.; McClain, C.R.; Mueller, J.; Brown, S.; Clark, D.; Johnson, B.; Yoon, H.; Lykke, K.; Flora, S. Ocean Optics Protocols for Satellite Ocean Color Sensor Validation Volume VI. In Special Topics in Ocean Optics Protocols; NASA: Washington, DC, USA, 2004. [Google Scholar]
  63. NASA’s Ocean Color Web. Available online: http://oceancolor.gsfc.nasa.gov/ (accessed on 19 June 2018).
  64. Gordon, H.R.; Wang, M. Retrieval of water-leaving radiance and aerosol optical thickness over the oceans with SeaWiFS: A preliminary algorithm. Appl. Opt. 1994, 33, 443–452. [Google Scholar] [CrossRef] [PubMed]
  65. Lapucci, C.; Rella, M.A.; Brandini, C.; Ganzin, N.; Gozzini, B.; Maselli, F.; Luca, M.; Caterina, N.; Alberto, O.; Charles, T. Evaluation of empirical and semi-analytical chlorophyll algorithms in the Ligurian and North Tyrrhenian Seas. J. Appl. Remote Sens. 2012, 6, 063565. [Google Scholar] [CrossRef] [Green Version]
  66. Ruddick, K.; Ovidio, F.; Rijkeboer, M. Atmospheric correction of SeaWiFS imagery for turbid coastal and inland waters. Appl. Opt. 2000, 39, 897–912. [Google Scholar] [CrossRef] [PubMed]
  67. Gordon, H.R.; Brown, O.B.; Evans, R.H.; Brown, J.; Smith, R.C.; Baker, K.S.; Clark, D.K. A semianalytic radiance model of ocean color. J. Geophys. Res. 1988, 93, 10909–10924. [Google Scholar] [CrossRef]
  68. Morel, A.; Gentili, B. Diffuse reflectance of oceanic waters: Its dependence on Sun angle as influenced by the molecular scattering contribution. Appl. Opt. 1991, 30, 4427–4438. [Google Scholar] [CrossRef] [PubMed]
  69. Morel, A.; Gentili, B. Diffuse reflectance of oceanic water. II. Bidirectional aspects. Appl. Opt. 1993, 32, 6864–6879. [Google Scholar] [CrossRef] [PubMed]
  70. Lee, Z.P.; Carder, K.L.; Arnone, R. Deriving inherent optical properties from water color: A multi-band quasi-analytical algorithm for optically deep waters. Appl. Opt. 2002, 41, 5755–5772. [Google Scholar] [CrossRef] [PubMed]
  71. Bricaud, A.; Babin, M.; Morel, A.; Claustre, H. Variability in the chlorophyll-specific absorption coefficients of natural phytoplankton: Analysis and parameterization. J. Geophys. Res. 1995, 100, 13321–13332. [Google Scholar] [CrossRef]
  72. Bailey, S.W.; Werdell, P.J. A multi-sensor approach for the on-orbit validation of ocean color satellite data products. Remote Sens. Environ. 2006, 102, 12–23. [Google Scholar] [CrossRef]
  73. R package FDA. Available online: https://cran.r-project.org/web/packages/fda/fda.pdf (accessed on 19 June 2018).
  74. Ye, H.; Li, J.; Li, T.; Shen, Q.; Zhu, J.; Wang, X.; Zhang, F.; Zhang, J.; Zhang, B. Spectral classification of the Yellow Sea and implications for coastal ocean color remote sensing. Remote Sens. 2016, 8, 321. [Google Scholar] [CrossRef]
  75. Marcelli, M.; Piermattei, V.; Madonia, A.; Lacava, T.; Mainardi, U. T-FLaP advances: Instrumental and operative implementation. J. Oper. Oceanogr. 2016, 9 (Suppl. 1), s185–s192. [Google Scholar] [CrossRef]
  76. Organelli, E.; Bricaud, A.; Gentili, B.; Antoine, D.; Vellucci, V. Retrieval of Colored Detrital Matter (CDM) light absorption coefficients in the Mediterranean Sea using field and satellite ocean color radiometry: Evaluation of bio-optical inversion models. Remote Sens. Environ. 2016, 186, 297–310. [Google Scholar] [CrossRef]
  77. Hu, C.; Lee, Z.; Franz, B. Chlorophyll-a algorithms for oligotrophic oceans: A novel approach based on three-band reflectance difference. J. Geophys. Res. Oceans. 2012, 117. [Google Scholar] [CrossRef]
  78. Magnuson, A.; Harding, L.W., Jr.; Mallonee, M.E.; Adolf, J.E. Bio-optical model for Chesapeake Bay and the middle Atlantic bight. Estuar. Coast. Shelf Sci. 2004, 61, 403–424. [Google Scholar] [CrossRef]
  79. Grunert, B.K.; Mouw, C.B.; Ciochetto, A.B. Characterizing CDOM Spectral Variability Across Diverse Regions and Spectral Ranges. Glob. Biogeochem. Cycle 2018, 32, 57–77. [Google Scholar] [CrossRef] [Green Version]
  80. Del Vecchio, R.; Blough, N.V. Photobleaching of chromophoric dissolved organic matter in natural waters: Kinetics and modeling. Mar. Chem. 2002, 78, 231–253. [Google Scholar] [CrossRef]
  81. Antoine, D.; d’Ortenzio, F.; Hooker, S.B.; Bécu, G.; Gentili, B.; Tailliez, D.; Scott, A.J. Assessment of uncertainty in the ocean reflectance determined by three satellite ocean color sensors (MERIS, SeaWiFS and MODIS-A) at an offshore site in the Mediterranean Sea (BOUSSOLE project). J. Geophys. Res. Oceans 2008, 113. [Google Scholar] [CrossRef] [Green Version]
  82. Ciotti, A.M.; Lewis, M.R.; Cullen, J.J. Assessment of the relationships between domininant cell size in natural phytoplankton communities and spectral shape of the absorption coefficient. Limnol. Oceanogr. 2002, 47, 404–417. [Google Scholar] [CrossRef]
  83. Bricaud, A.; Claustre, H.; Ras, J.; Oubelkheir, K. Natural variability of phytoplanktonic absorption in oceanic waters: Influence of the size structure of algal populations. J. Geophys. Res. 2004, 109, C11010. [Google Scholar] [CrossRef]
  84. Organelli, E.; Nuccio, C.; Melillo, C.; Massi, L. Relationships between phytoplankton light absorption, pigment composition and size structure in offshore areas of the Mediterranean Sea. Adv. Oceanogr. Limnol. 2011, 2, 107–123. [Google Scholar] [CrossRef]
  85. Kiefer, D.A.; Olson, R.J.; Wilson, W.H. Reflectance spectroscopy of marine phytoplankton. Part 1. Optical properties as related to age and growth rate. Limnol. Oceanogr. 1979, 24, 664–672. [Google Scholar] [CrossRef] [Green Version]
  86. Stramski, D.; Morel, A. Optical properties of photosynthetic picoplankton in different physiological states as affected by growth irradiance. Deep-Sea Res. 1990, 37, 245–266. [Google Scholar] [CrossRef]
  87. Von Schuckmann, K.; Le Traon, P.Y.; Alvarez-Fanjul, E.; Axell, L.; Balmaseda, M.; Breivik, L.; Brewin, A.R.J.W.; Bricaud, C.; Drevillon, M.; Drillet, Y.; et al. The Copernicus marine environment monitoring service ocean state report. J. Oper. Oceanogr. 2016, 9 (Suppl. 2), s235–s320. [Google Scholar] [CrossRef]
  88. Product User Manual. Available online: http://marine.copernicus.eu/documents/PUM/CMEMS-OC-PUM-009-ALL.pdf (accessed on 19 June 2018).
  89. D’Alimonte, D.; Mélin, F.; Zibordi, G.; Berthon, J.F. Use of the novelty detection technique to identify the range of applicability of empirical ocean color algorithms. IEEE Trans. Geosci. Remote Sens. 2003, 41, 2833–2843. [Google Scholar] [CrossRef]
  90. Zibordi, G.; Berthon, J.F.; Doyle, J.P.; Grossi, S.; van der Linde, D.; Targa, C.; Alberotanza, L. Coastal Atmosphere and Sea Time Series (CoASTS), Part 1: A Tower-Based Long-Term Measurement Program. NASA Tech. Memo. 2002, 19, 1–29. [Google Scholar]
  91. Toming, K.; Kutser, T.; Uiboupin, R.; Arikas, A.; Vahter, K.; Paavel, B. Mapping Water Quality Parameters with Sentinel-3 Ocean and Land Colour Instrument magery in the Baltic Sea. Remote Sens. 2017, 9, 1070. [Google Scholar] [CrossRef]
  92. Watanabe, F.; Alcântara, E.; Imai, N.; Rodrigues, T.; Bernardo, N. Estimation of chlorophyll-a concentration from optimizing a semi-analytical algorithm in productive inland waters. Remote Sens. 2018, 10, 227. [Google Scholar] [CrossRef]
  93. Gómez-Jakobsen, F.; Mercado, J.M.; Cortés, D.; Ramírez, T.; Salles, S.; Yebra, L. A new regional algorithm for estimating chlorophyll-a in the Alboran Sea (Mediterranean Sea) from MODIS-Aqua satellite imagery. Int. J. Remote Sens. 2016, 37, 1431–1444. [Google Scholar] [CrossRef]
  94. Dogliotti, A.I.; Schloss, I.R.; Almandoz, G.O.; Gagliardini, D.A. Evaluation of SeaWiFS and MODIS chlorophyll-a products in the Argentinean Patagonian continental shelf (38 S–55 S). Int. J. Remote Sens. 2009, 30, 251–273. [Google Scholar] [CrossRef]
  95. El-Otify, A.M. Evaluation of the physicochemical and chlorophyll-a conditions of a subtropical aquaculture in Lake Nasser area, Egypt. Beni-Suef Univ. J. Basic Appl. Sci. 2015, 4, 327–337. [Google Scholar] [CrossRef]
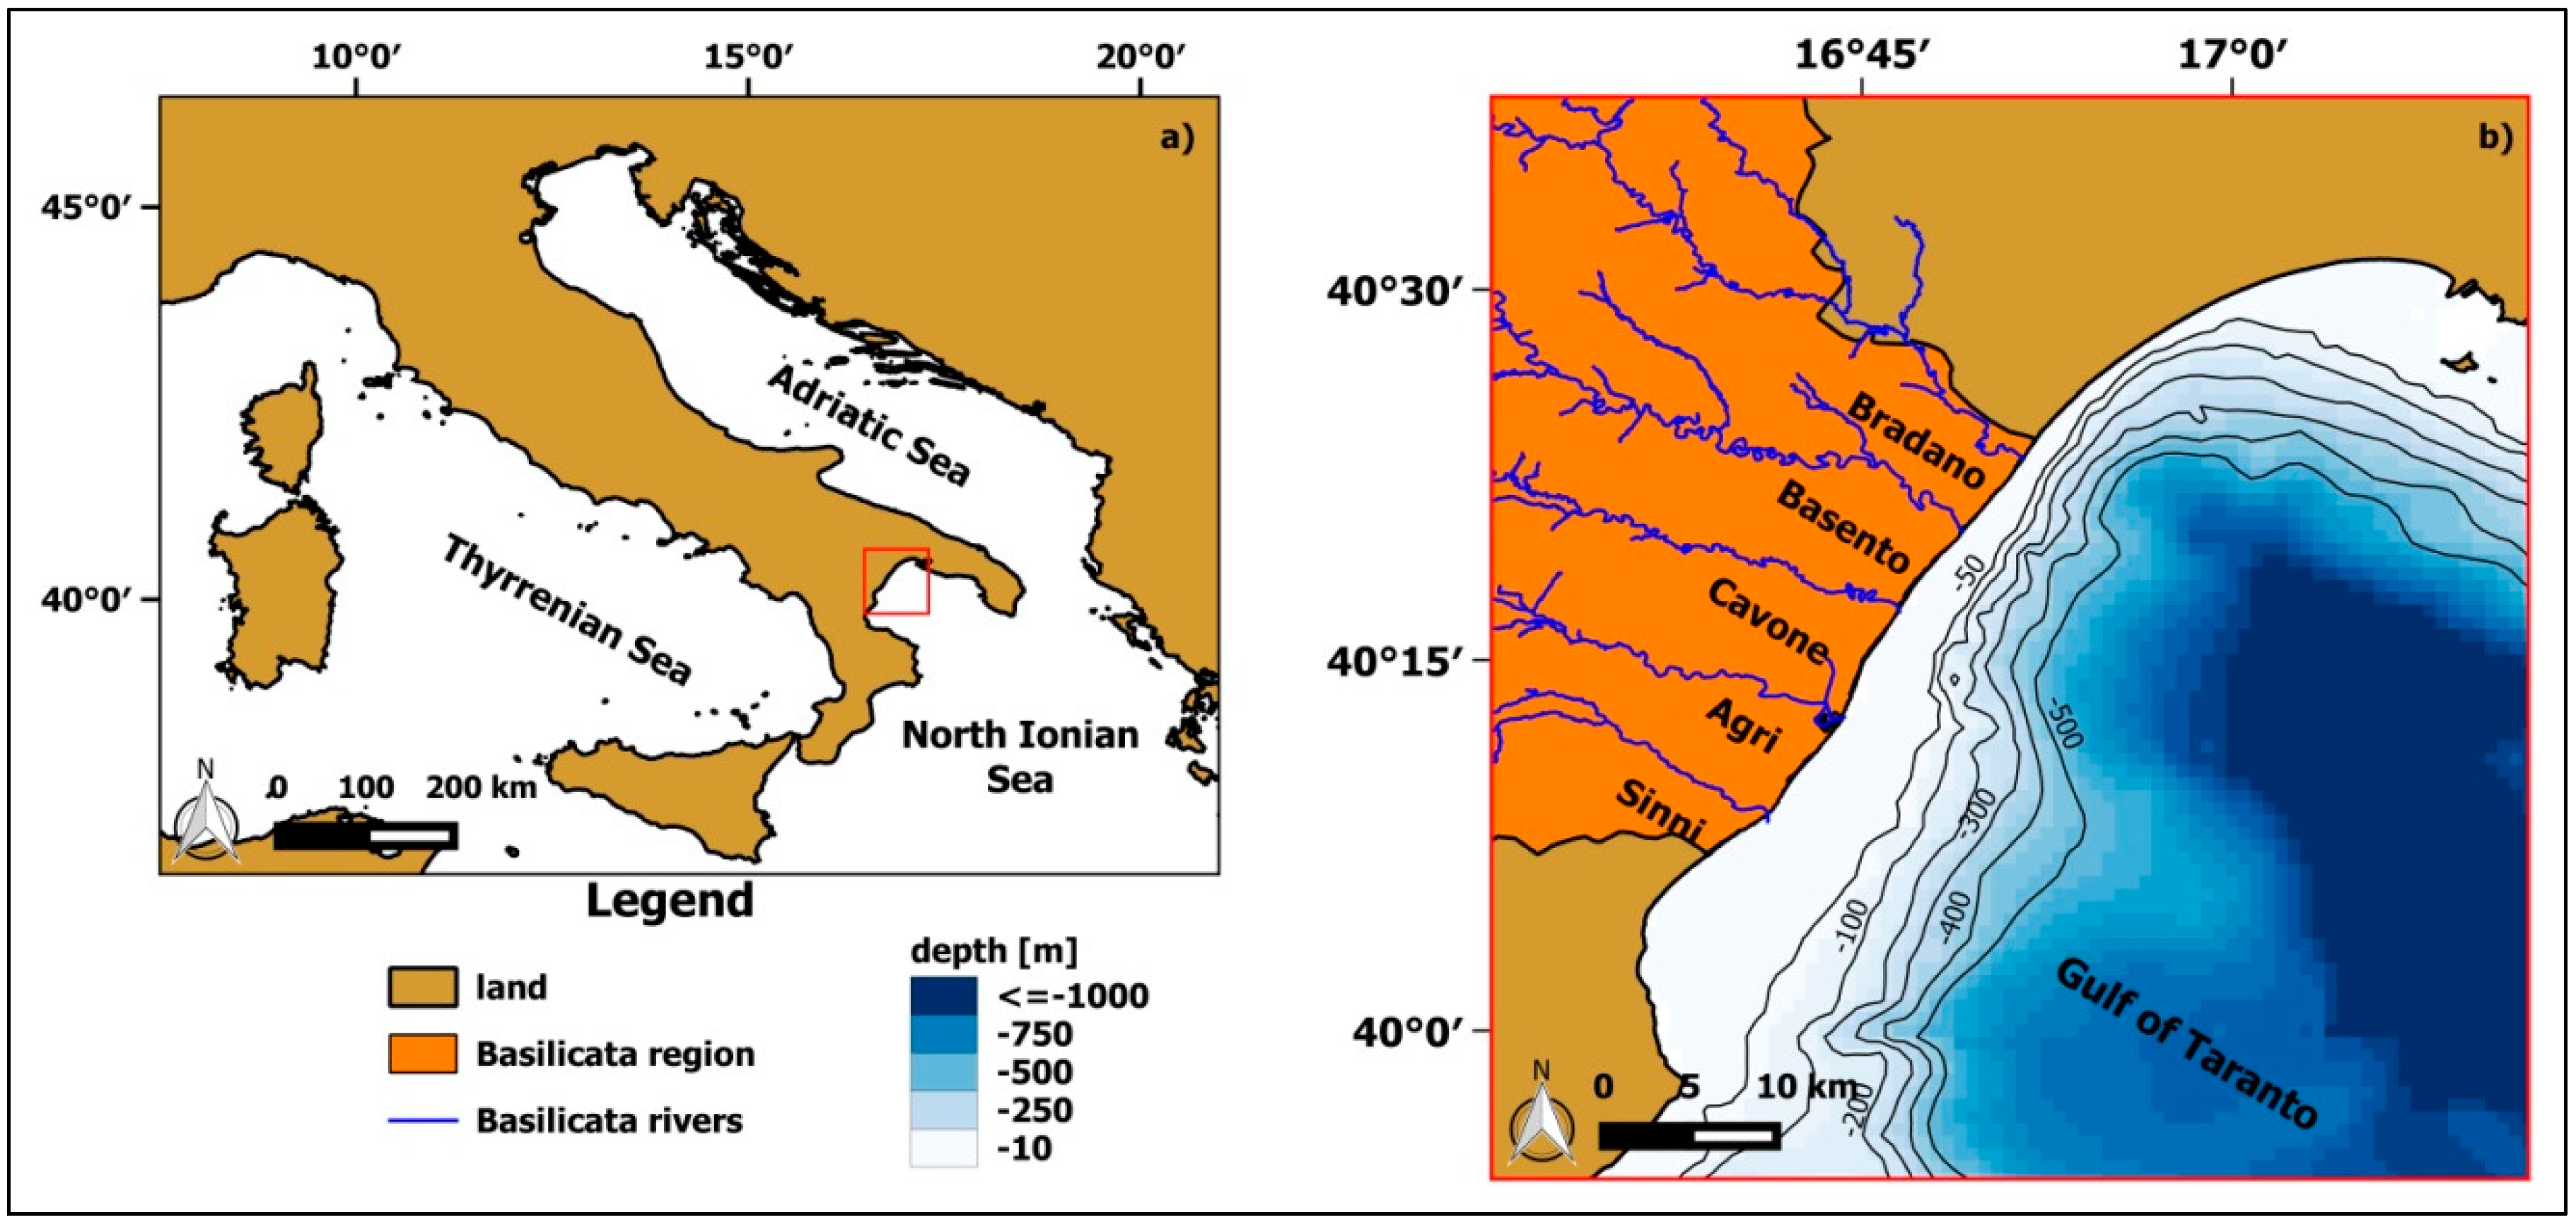
Figure 1. (a) BICW localization (red box) in the Mediterranean Sea; (b) magnification of the study area within the red box of (a) where the Basilicata region is depicted in orange. The main rivers of the region (blue lines) and the bathymetry from 50 to 500 m (in blue tones and with the black contour lines) are also reported.
Remotesensing 10 00987 g001
Figure 2. Sampling locations for each of the IOSMOS measurement campaigns.
Remotesensing 10 00987 g002
Figure 3. Daily chl-a maps derived from MODIS-Aqua using (a) Med-OC3, (b) GSM, (c) GIOP for 19 April 2013 (top panel) and 1 July 2014 (bottom panel).
Remotesensing 10 00987 g003
Figure 4. Scatter plots of in situ versus MODIS-A chl-a values for Med-OC3, GSM, and GIOP algorithms. In each plot, the dashed line is the 1:1 line.
Remotesensing 10 00987 g004
Figure 5. In situ Rrs(λ) spectra acquired on 26 IOSMOS stations. Within the legend, two numbers characterize each spectrum: the first is the identification of the stations and the second (in parentheses) relates to the measurement campaigns (from 1 to 3).
Remotesensing 10 00987 g005
Figure 6. The flowchart of the revised max-classification performed over 26 Rrs(λ) spectra.
Remotesensing 10 00987 g006
Figure 7. (a) The normalized average spectral shapes (Rrs(λ)/max(Rrs(λ)) for the classes A and B. (b) Locations of the analysed stations falling within the classes A (red dots) and B (green dots). The continuous lines are bathymetry depths ranging from 50 to 500 m depth.
Remotesensing 10 00987 g007
Figure 8. Plot of the averaged aCDM(λ) spectrum in the 350–500 nm domain. The dotted red line is the exponential best fit.
Remotesensing 10 00987 g008
Figure 9. Plot of the power-law relationship between η and the averaged ratio rrs(443)/rrs(555). The red square indicates the selected η value.
Remotesensing 10 00987 g009
Figure 10. Plot of comparison between the averaged a*ph(λ) values computed within the locale scale configuration (hereafter GSM-BICW, red line) and the standard ones related to the default configuration (GSM—standard, blue line). All the a*ph(λ) values were normalized at 443 nm to facilitate the comparison.
Remotesensing 10 00987 g010
Figure 11. Scatter plots of in situ versus MODIS-A chl-a values for GSM-standard and GSM-BICW algorithms. In each plot, the dashed line is the 1:1 line.
Remotesensing 10 00987 g011
Figure 12. Scatter plot between in situ and satellite chl-a data. The blue rhombus are chl-a values obtained by GSM-BICW algorithm, while the red circles are related to the CMEMS-L3 product. The dashed line is the 1:1 line.
Remotesensing 10 00987 g012
Figure 13. Comparison between the water type masks (averaged value on a 3 × 3-pixel box centered on the location of the in situ chl-a samples) included in the CMEMS-L3 product and the classes derived by the Rrs(λ) supervised classification implemented on the chl-a samples selected for the match-up analysis (Figure 12). The full circles represent the classes (red and green for classes A and B), while the empty circles the water types (red and green for Case 1 and Case 2 waters). The continuous lines are bathymetry depths ranging from 50 to 500 m depth.
Remotesensing 10 00987 g013
Table 1. Descriptive statistics of chl-a and IOP derived during the three measurement campaigns.
ParameterValues18–19 April 201316 July 20131–2 July 2014
Chl-a (mg·m−3)Min0.49050.12000.1559
Max1.20091.07000.5407
Mean0.80000.39000.3306
Stdv0.16630.27270.0893
aph (440) (m−1)Min0.00320.00250.0021
Max0.00910.01140.0248
Mean0.00600.00530.0157
Stdv0.00130.00250.0055
aNAP (440) (m−1)Min0.00320.00320.0032
Max0.00910.00910.0091
Mean0.00600.00600.0060
Stdv0.00130.00130.0013
aCDOM (440) (m−1)Min0.00610.01200.0100
Max0.03060.06260.0700
Mean0.01650.02750.0233
Stdv0.00690.01590.0156
Table 2. The set of fixed parameters at various wavelengths used by GSM as updated by Maritorena et al. [29]. From left to right: the chl-a specific phytoplankton absorption coefficients (aph*(λ)), the Colored Detrital Matter (CDM) light absorption values (S) and the spectral slopes of particle backscattering (η).
λ (nm) a p h * [m2mg−1]S [nm−1]η
4120.006650.02061.0337
4430.05582
4900.02055
5100.01910
5550.01015
6700.01424
Table 3. Empirical relationship of the non-water components of absorption and scattering selected for the default GIOP configuration.
ParameterEmpirical RelationshipSelected Values
  a ph ( λ )   a ph * ( λ )   =   A ( λ ) [ Tchl - a ] B ( λ ) A(λ) and B(λ)
tabulated in [71]
  a CDM ( λ )   a CDM * ( λ )   =   e S ( λ λ 0 ) S = 0.018
  b bp ( λ )   b bp   * ( λ )   = ( λ 0 λ ) η η derived by
Quasi Analytical Algorithm (QAA-v5) [70]
Table 4. Regression indices and statistical indicators for the chl-a match-up analyses (see Section 2.4 for definitions).
AlgorithmAdjusted R2p-ValuerAPDRMSE
Med-OC30.120.041.8184.11 %0.35
GSM0.74<0.0011.1221.61 %0.10
GIOP0.79<0.0011.1425.12 %0.09
Table 5. Empirical relationship of the non-water components of absorption and scattering selected for the locale scale configuration (GSM-BICW).
ParameterEmpirical RelationshipAdopted Values
a ph * ( λ ) a ph * ( λ ) = A ( λ ) [ Tchl - a ] B ( λ ) λ
4120.04973
4430.06336
4900.04155
5100.02471
5550.00799
6700.02507
S a CDM ( λ ) = e S ( λ λ 0 ) S = 0.0201
η b bp ( λ ) = ( λ 0 λ ) η η = 1.2031
Table 6. Regression indices and statistical indicators computed based on the previous chl-a match-up analyses (Figure 11).
AlgorithmAdjusted R2p-ValuerAPDRMSE
GSM-standard0.82<0.0010.9512.12 %0.083
GSM-BICW0.86<0.0011.0211.03 %0.070