Article

Characteristic and Driving Factors of Aerosol Optical Depth over Mainland China during 1980–2017

1
Laboratory of Critical Zone Evolution, School of Earth Sciences, China University of Geosciences, Wuhan 430074, China
2
School of Resource and Environmental Science, Wuhan University, Wuhan 430079, China
3
Key Laboratory of Middle Atmosphere and Global Environment Observation (LAGEO), Institute of Atmospheric Physics, Chinese Academy of Sciences, Beijing 100029, China
4
Collaborative Innovation Center on Forecast and Evaluation of Meteorological Disasters, Nanjing University of Information Science & Technology, Nanjing 210044, China
5
Key Laboratory for Atmospheric Chemistry (LAC), Institute of Atmospheric Composition, Chinese Academy of Meteorological Sciences (CAMS), China Meteorological Administration (CMA), Beijing 100081, China
6
School of Marine Science, Nanjing University of Information Science & Technology, Nanjing 2100444, China
*
Author to whom correspondence should be addressed.
Remote Sens. 2018, 10(7), 1064; https://doi.org/10.3390/rs10071064
Submission received: 18 May 2018 / Revised: 29 June 2018 / Accepted: 4 July 2018 / Published: 5 July 2018
(This article belongs to the Special Issue Aerosol Remote Sensing)

Abstract

:
Since the reform and opening up of China, the increasing aerosol emissions have posted great challenges to the country’s climate change and human health. The aerosol optical depth (AOD) is one of the main physical indicators quantifying the atmospheric turbidity and air pollution. In this study, 38-years (1980–2017) of spatial and temporal variations of AOD in China were analyzed using AOD records derived from MODIS atmosphere products and the MERRA-2 dataset. The results showed that the annual mean AOD values throughout China have gone through an increasing, but fluctuating, trend, especially in 1982 and in 1992 due to two volcano eruptions; the AOD values experienced a dramatically increasing period during 2000–2007 with the rapid economic development and “population explosions” in China/after 2008, the AOD values gradually decreased from 0.297 (2008) to 0.257 (2017). The AOD values in China were generally higher in spring than that in other seasons. The Sichuan Basin has always been an area with high AOD values owing to the strong human activity and the basin topography (hindering aerosol diffusions in the air). In contrast, the Qinghai Tibet Plateau has always been an area with low AOD values due to low aerosol emissions and clear sky conditions there. The trend analysis of AOD values during 1980–2017 in China indicated that the significant increasing trend was mainly observed in Southeastern China. By contrast, the AOD values in the northernmost of China showed a significant decreasing trend. Then, the contributions (AODP) of the AOD for black carbon aerosol (BCAOD), dust aerosol (DUAOD), organic carbon aerosol (OCAOD), sea salt aerosol (SSAOD), and SO4 aerosol (SO4AOD) to the total AOD values were calculated. The results showed that DUAOD (25.43%) and SO4AOD (49.51%) were found to be the main driving factors for the spatial and temporal variations of AOD values. Finally, the effects of anthropogenic aerosol emissions, socioeconomic factors, and land-use and land coverage changes on AOD were analyzed. The GDP, population density, and passenger traffic volume were found to be the main socioeconomic drivers for AOD distributions. Relatively larger AOD values were mainly found in urban land and land covered by water, while lower AOD values were found in grassland and permanent glacier areas.

1. Introduction

The aerosol optical depth (AOD) is a key aerosol property, and is the main physical quantity characterizing the atmospheric turbidity [1,2,3,4]. Accurate observation of AOD values is of vital importance to aerosol research and applications [5]. Many ground-based remote sensing aerosol networks have been established around the world. For example, the Aerosol Robotic Network (AERONET) can provide continuous cloud-screened observations of spectral AOD values around the world [6,7]. In China, AOD values are routinely measured at about 50 sites within the China Aerosol Remote Sensing Network (CARSNET) [8,9,10]. However, the sites of AERONET and CARSNET are relatively sparse for AOD applications with high spatial resolutions [11]. Remote sensing provides an efficient way to retrieve spatiotemporally continuous AOD values at regional and global scales. The Total Ozone Mapping Spectrometer (TOMS) aboard Nimbus-7 (1976–1992) and the Earth Probe Satellite (1996 to present) can provide long-term AOD records around the world [12,13,14]. Torres et al. [12] found that AOD values for UV-absorbing conditions derived from TOMS are within 30% of the AERONET observations, while the AOD values for non-absorbing conditions are within 20% of the AERONET observations. Nevertheless, the nadir spatial resolutions (about 50 km × 50 km) of TOMS are relatively coarse for AOD applications. The Advanced Along Track Scanning Radiometer (AATSR) aboard Envisat can also provide AOD products with high nadir spatial resolution (1 km × 1 km) [14,15,16,17]. Meanwhile, the Seaviewing Wide Field-of-view Sensor (SEAWIFS) aboard GeoEye’s OrbView-2 can provide AOD data over the globally ocean with a spatial resolution of 9 km × 9 km [18,19,20]. Long-term daily and monthly AOD records (1981–2017) can also be obtained from the Advanced Very High Resolution Radiometer (AVHRR) aboard on TIROS-N and NOAA series with nadir spatial resolution of 1.1 km × 1.1 km [21,22,23,24]. Among all AOD products, the standard AOD products from the Moderate Resolution Imaging Spectroradiometer (MODIS) on board Terra and Aqua are the most widely used AOD products for the estimation of AOD, with spatial resolutions of 3 km and 10 km [3,25,26,27].
In recent decades, with the rapid economic development and growing population in China, the amount of anthropogenic aerosol particles such as black carbon, organic carbon and sulfate emitted to the atmosphere have dramatically increased over mainland China, which makes China one of the major regions that causes the global aerosol radiative forcing effect and global climate change. Therefore, it is important to analyze the spatial and temporal variations of the aerosol optical depth and detect its drivers in different climate zones and terrain features over mainland China. Zhang et al. [28] analyzed the spatial and temporal variations of AOD values over mainland China during 1973–2014 using the KM-Elterman method. The results showed that the estimated AOD values were in good agreement with AOD values derived from MODIS products (R = 0.942). The North China Plain, Yangtze River Delta, Central China, Sichuan Basin, and Pearl River Delta were the areas with trends of rapidly increasing trend of AOD values; Southwest China was found to be an area with a significant decreasing trend of AOD values. Tang et al. [29] revisited the decadal variation of AOD in China. The result indicated two decreasing periods (pre-1980s and post-2006) and one increasing period (1980–2006) of AOD values throughout China. He et al. [30] revealed the annual and seasonal characteristics of AOD values throughout China using satellite-derived aerosol optical depth data. The result indicated that there was one upward trend pre-2008 (0.0003) and one downward trend post-2008 (−0.0005) for AOD in China during 2000–2015. The AOD values were higher in spring (0.410) than that in summer (0.370), autumn (0.260), and winter (0.340). Wu et al. [31] analyzed the spatial and temporal variations of AOD values during 1960–2009 using the Multiangle Imaging Spectroradiometer (MISR) AOD records and meteorological measurements. The results showed that the AOD values over mainland China exhibited an increasing trend (0.004 year−1) during 1960–2009; the AOD values were generally higher in summer than that in other seasons. Xu et al. [32] reconstructed the AOD values during 1993–2012 throughout China using a broadband extinction model, which showed good agreements with AERONET AOD values with RRMSE, MAE, and R of 0.101, 0.029, and 0.848, respectively. Guo et al. [33] revealed the spatial and temporal characteristics of AOD values during 1980–2008 over mainland China using the TOMS AOD (1980–2001) and MODIS AOD products (2000–2008). Meanwhile, many studies on the spatial and temporal variations of AOD values in regional scale in Chinawere conducted using meteorological measurement and satellite signals [10,26,34,35,36,37,38,39,40]. However, few studies have been made for analyzing the characteristics and driving factors of AOD values in different climate zones and terrain features over mainland China, due to the relative sparse AOD and meteorological measurements. Further studies should be made on the spatial and temporal variations of AOD and the effects of economic development, anthropogenic aerosol emissions and land-use and land-cover change (LUCC) on AOD over mainland China.
This study attempted to (1) analyze the spatial and temporal variations of the aerosol optical depth over mainland China using MODIS atmosphere products and MERRA-2 (The Modern Era Retrospective-Analysis for Research and Applications) [41,42] dataset; (2) reveal the characteristics of the aerosol optical depth for sea salt aerosol, black carbon aerosol, organic carbon aerosol, dust aerosol, and SO2 aerosol, respectively; and (3) reveal the effects of anthropogenic aerosol emissions, socioeconomic factors and the land-use and land-cover change (LUCC)on the spatial and temporal variations of AOD in different climate zones and terrains over mainland China.

2. Materials and Methods

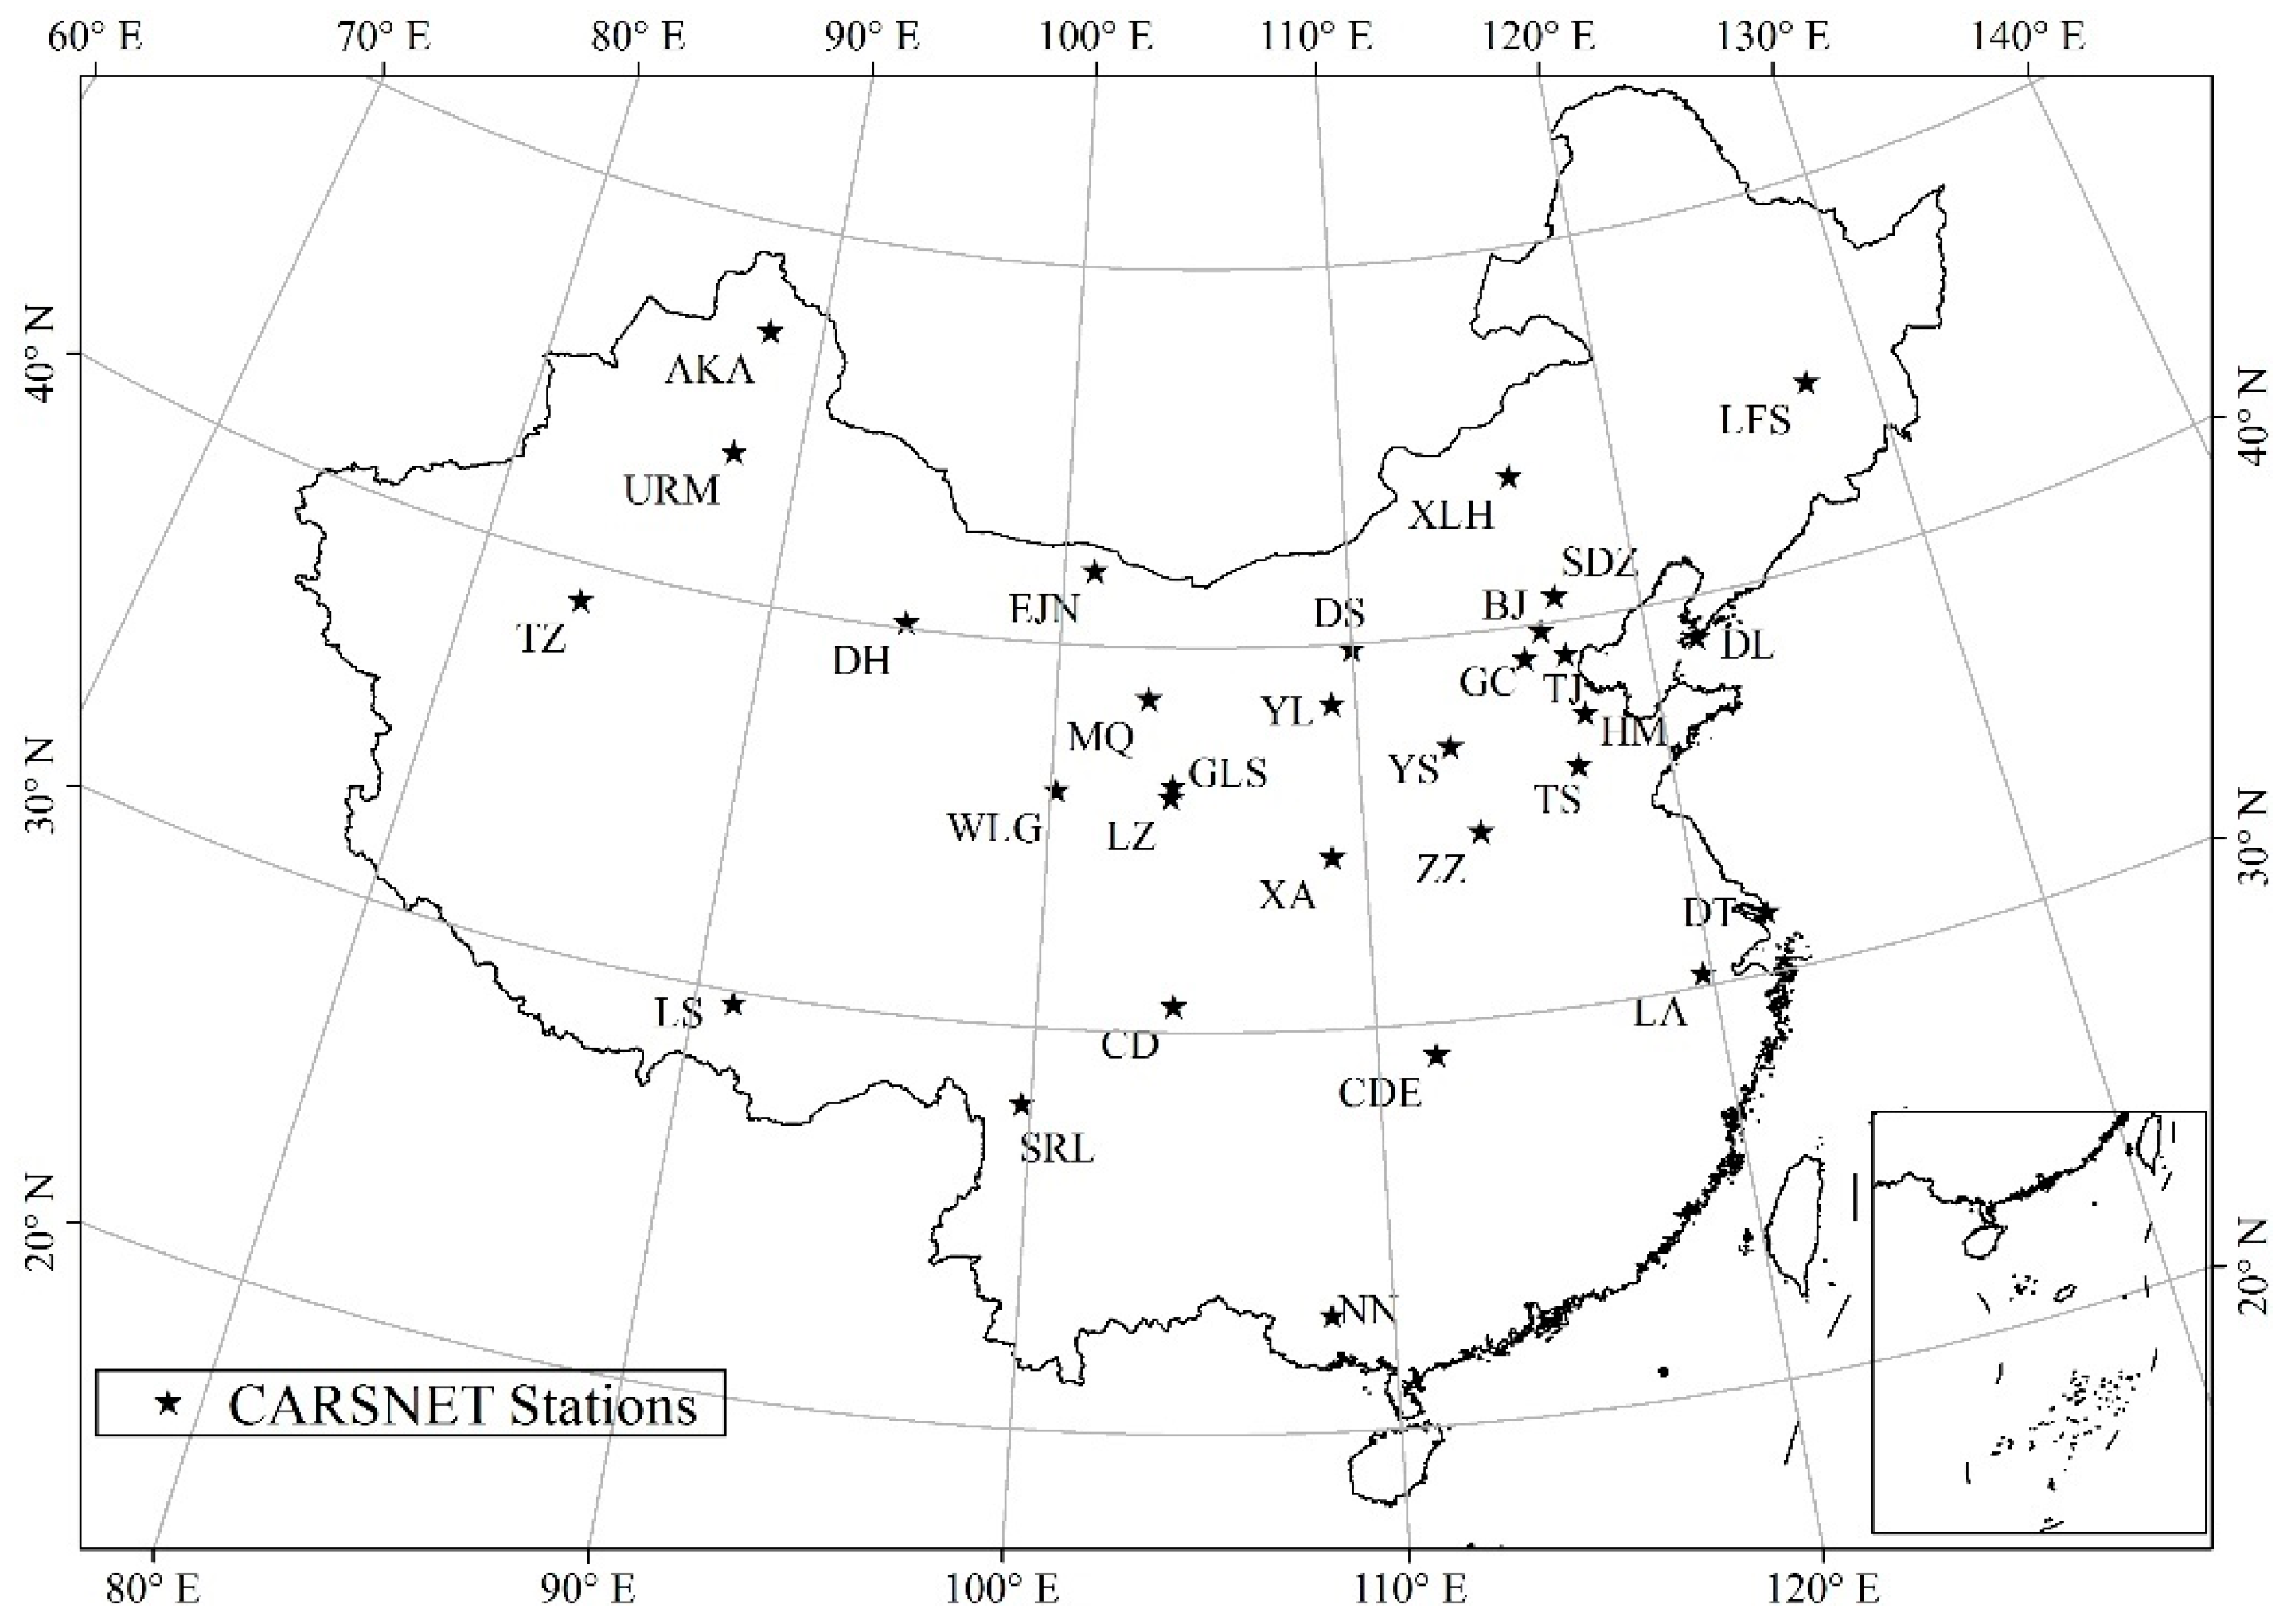
2.1. Study Area and Data

2.1.1. Observation Data

Daily AOD records (550 nm) during 2002–2014 at CARSNET stations throughout China were used for the validation of AOD values. Figure 1 shows the spatial distributions of these CARSNET stations. Table 1 shows the statistical indicators representing the geographical and climate patterns of these CARSNET stations. It is clear that these stations cover most areas of China with various and complicated geomorphology and terrain features.

2.1.2. MODIS and MERRA-2 Products

The AOD values derived from MODIS level-2 products (MOD04/MYD04) and level-3 products (MOD08/MYD08) were validated by CARSNET stations in this study. Both AOD values derived from Terra observations (10:30 LT) and Aqua observations (13:30 LT) were used in this study. The MERRA-2 dataset was provided by the Global Modeling and Assimilation Office (GMAO) in NASA. The MERRA-2 dataset showed better spatial and temporal continuity with longer temporal range (1980–present) than MODIS products. The daily mean AOD values derived from MERRA-2 dataset were also evaluated using AOD measurements at CARNET stations. Detailed information about the MODIS and MERRA-2 dataset that were used in this study are shown in Table 2.

2.1.3. Socioeconomic Data

Social and economic development indicators during 1988–2015 such as gross domestic product (GDP), population density (PD), industrial output value (ID), the proportion of the first industry to GDP (R1), the proportion of the second industry to GDP (R2), the proportion of the third industry to GDP (R3), the output value of the first industry (G1), the second industry output value (G2), the third industry output value (G3), the built-up area greening rate (GR) and the total passenger volume (PT) and the total freight volume (FT) were mainly derived from the “China City Statistical Yearbook” and the “China Statistical Yearbook” provided by National Bureau of Statistics of the People’s Republic of China [43]. It should be stated that the socioeconomic indicators are incomplete in the “China City Statistical Yearbook for 1992–1993”, thus we excluded the data in 1992–1993.

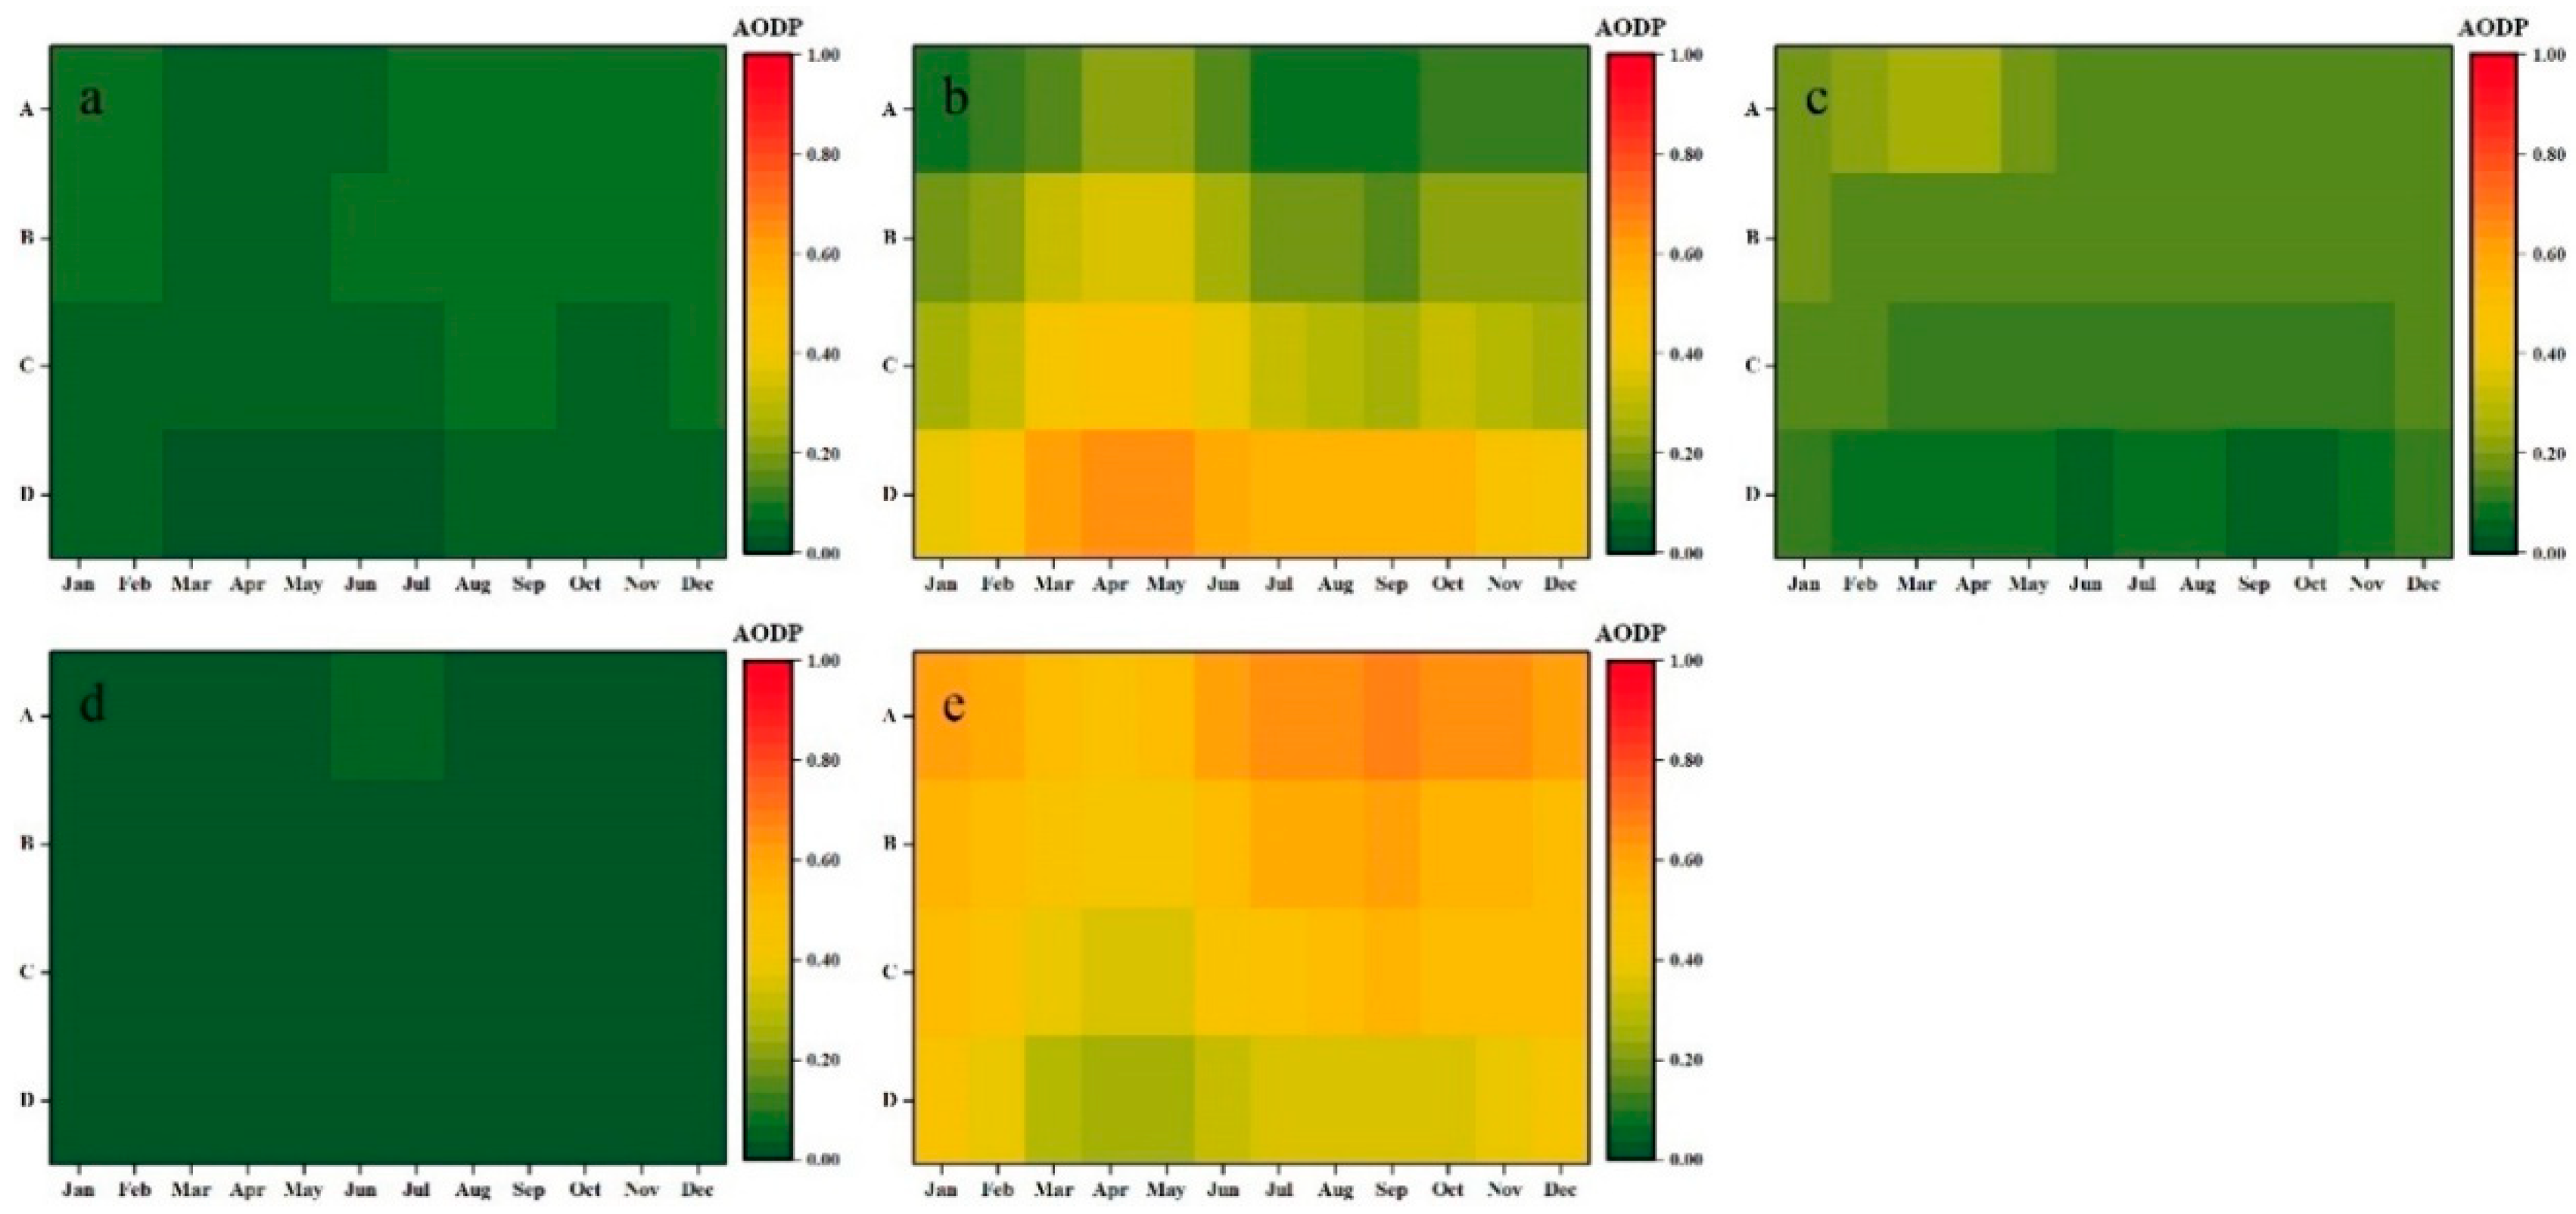
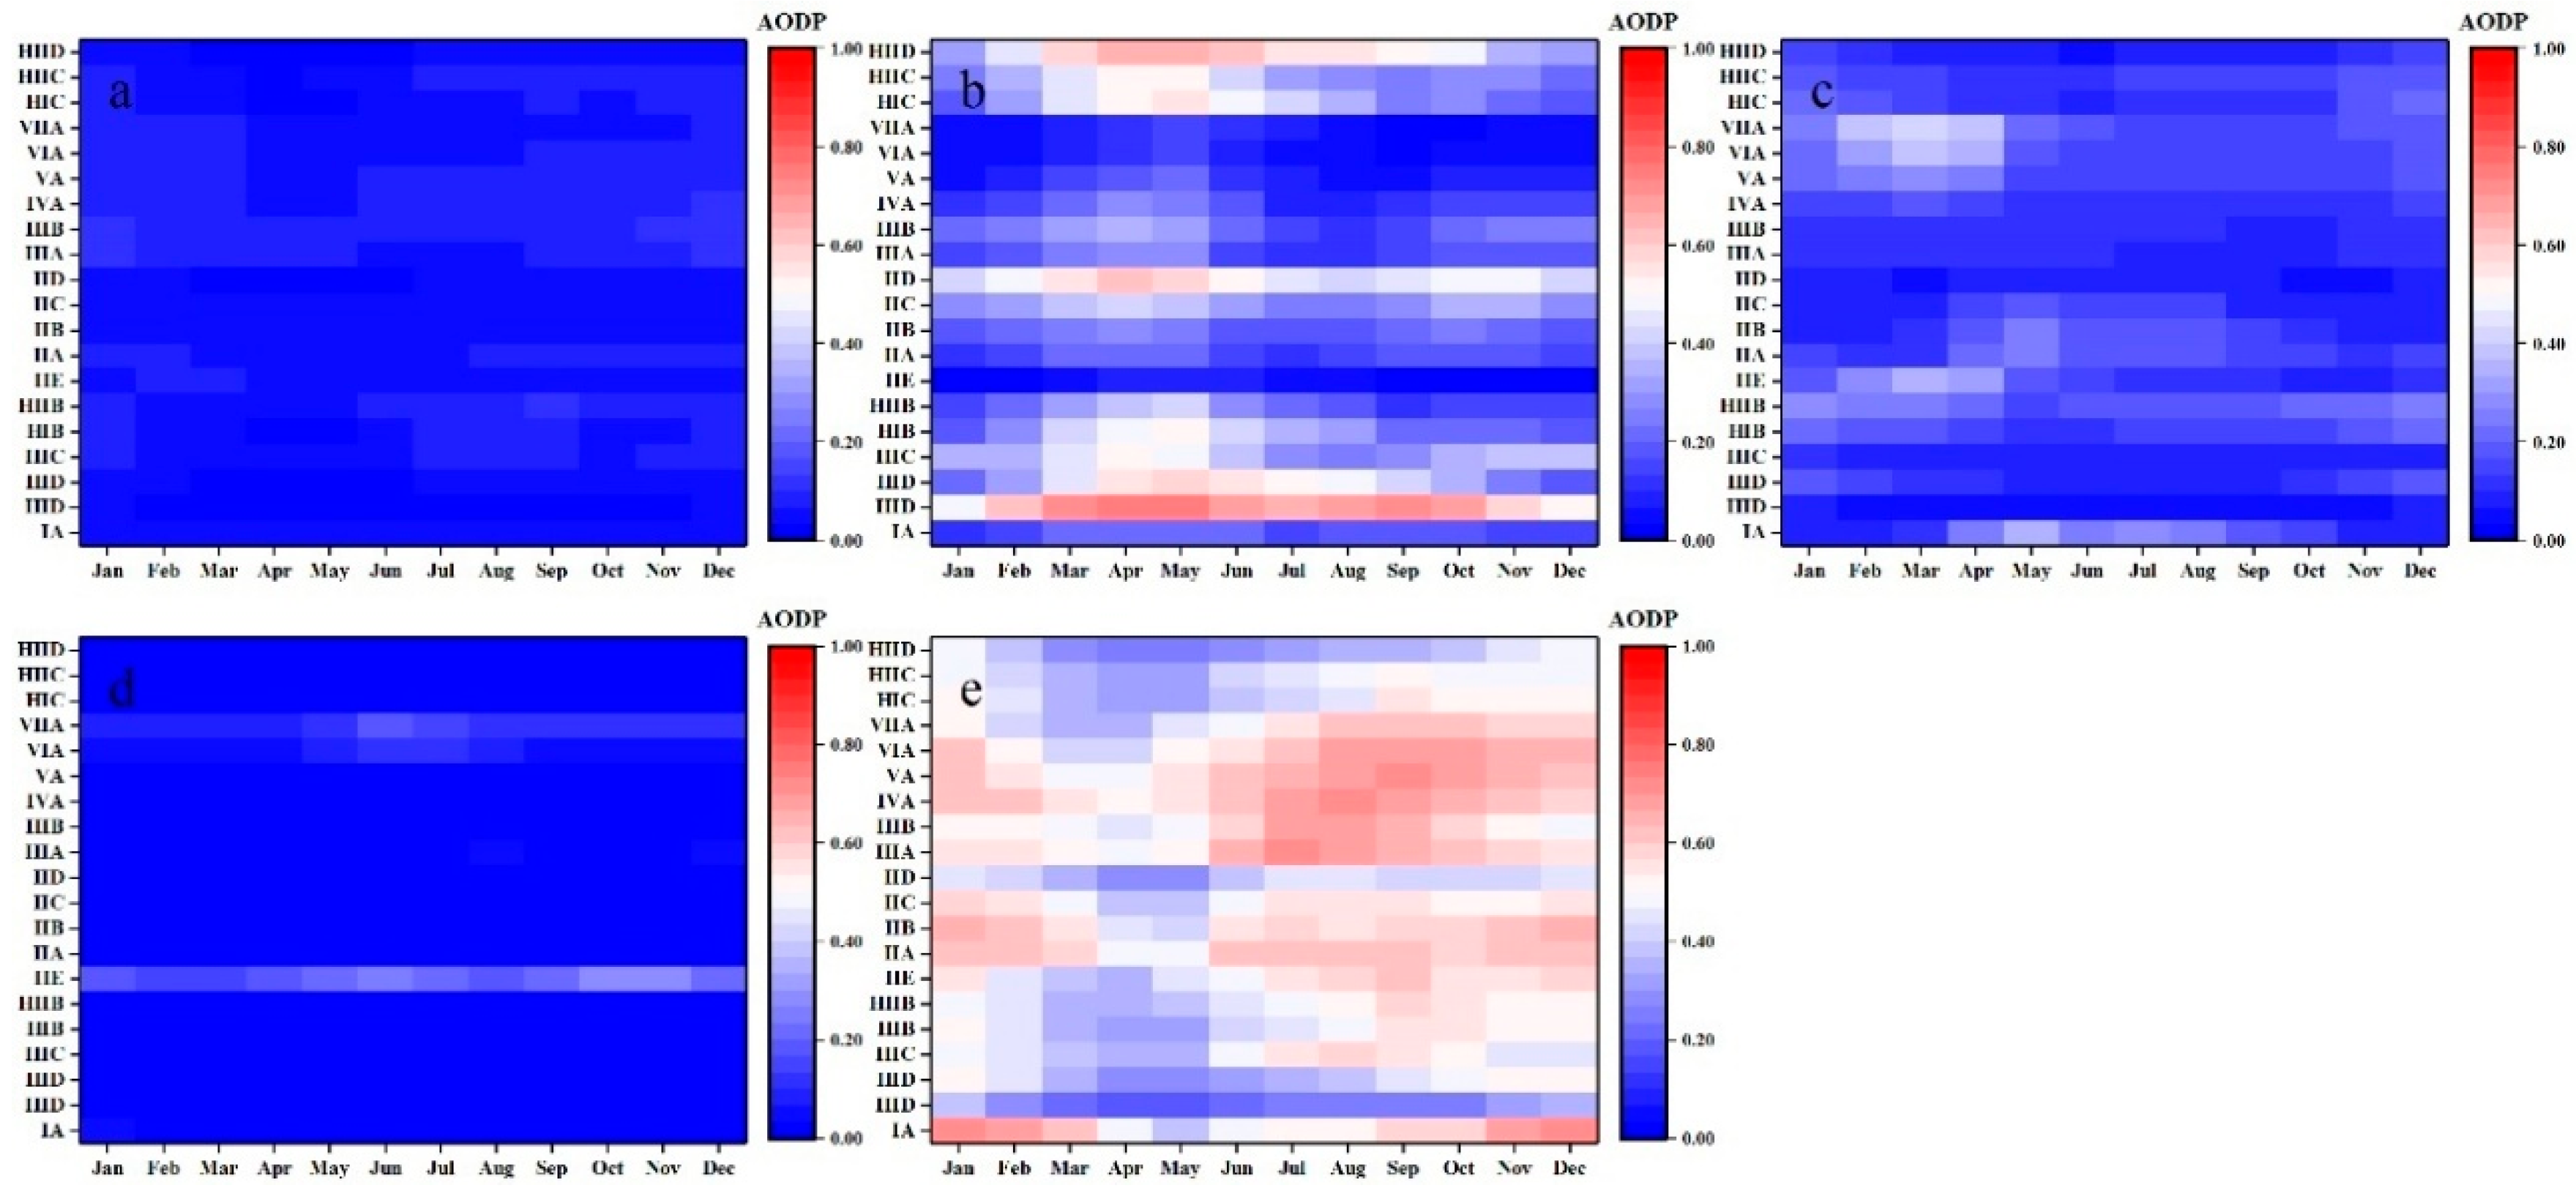
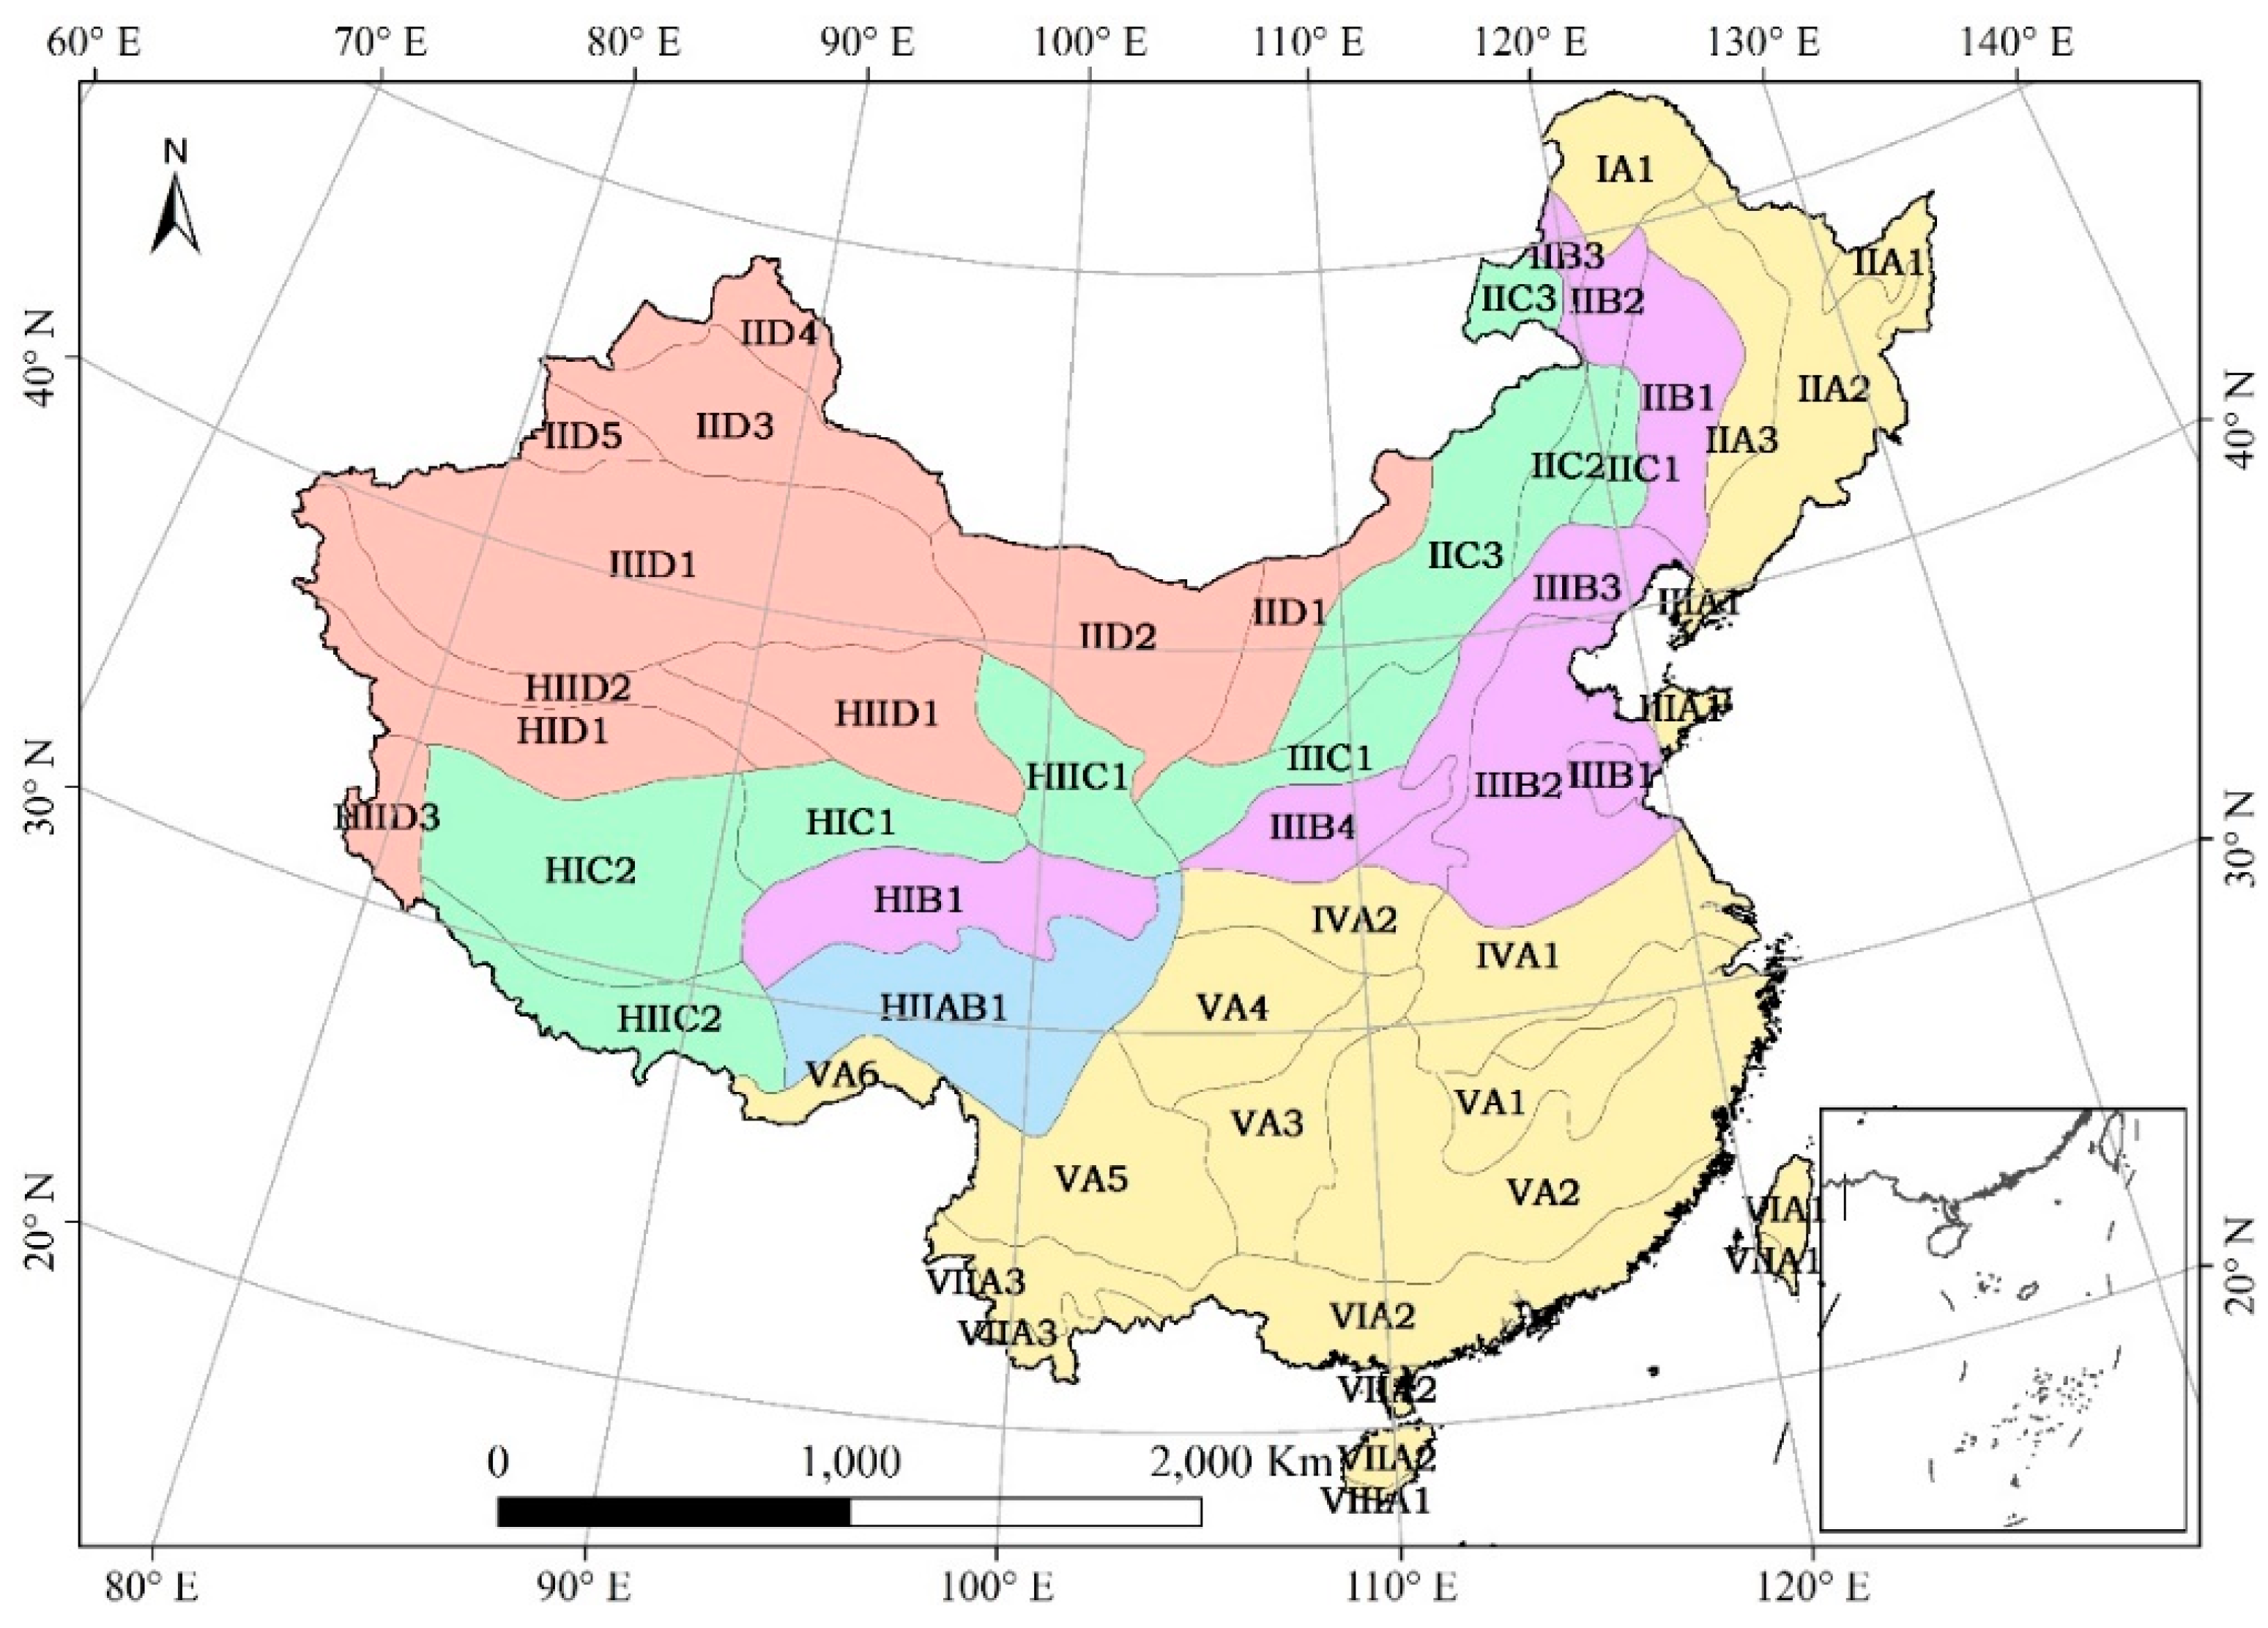
2.1.4. Climate Zones and Terrain Features

The climate and terrain regionalization data was provided by the Resource and Environment Science Data Center of Chinese Academy of Sciences [44]. Figure 2 and Figure A1 showed the humidity zones, the temperate zones and terrain features in China (A for humid, B for semi-humid, C for semi-arid, D for arid; I for cold temperate, II for mid temperate, III for warm temperate, IV for north subtropical zone, V for the mid-subtropics, VI for the south subtropics, VII for the edge of tropical zone, HI for sub-frigid zone in plateau, HII for temperature zone in plateau, IIE for mid tropical zone with humid weather).

2.2. Trend Analysis Method

In order to characterize the spatial and temporal variations of AOD values, the Mann-Kendall trend (MK) test method employed and the Sen’s Slope trend analysis method were introduced to analyze the significance and the degree of the change of AOD values, respectively.

2.2.1. Mann-Kendall Index

The Mann-Kendall trend test method [45] is a widely used non-parametric statistical test method to test the trend of time series data. The original hypothesis H0 of the Mann-Kendall trend test method is that the time series data is a sample of n random variables with the same distribution. The alternative hypothesis is that the time series data has a monotonically increasing or decreasing trend. The test method judges the significance of the change trend by counting the total number of positive biases and alternative hypotheses. First, we define the test statistical S:
S = i = 2 n j = 1 i 1 s i g n ( x j x i )
where s i g n ( x j x i ) is a symbolic function, which is −1, 0 or 1 when x j x i is less than, equal to or greater than 0, respectively; the S represents the temporal trend of the time series data (S > 0 for upward trend, S < 0 for downward trend, S = 0 for no trend). Then, the variance of S was calculated using the following formula:
V A R ( S ) = [ n ( n 1 ) ( 2 n + 5 ) p = 1 q t p ( t p 1 ) ( 2 t p + 5 ) ] / 18
Finally, the Z representing the trend and the significance of the trend of the time series data were calculated using following formula:
Z = { ( S + 1 ) / V A R ( S ) S > 0 0 S = 0 ( S 1 ) / V A R ( S ) S < 0
where positive and negative values of Z indicate increasing trend and decreasing trend, respectively. When the absolute value of Z is greater than, or equal to, 1.96 and 2.58, this indicated that the trend analysis passed the significant test under the level of 95% and 99%, respectively.

2.2.2. Sen’s Slope Index

Sen’s Slope was firstly proposed by Sen [46] to analyze the temporal trend of time series data, which could be conducted using the following equations:
Q m e d = { Q [ ( N + 1 ) / 2 ] if   N   is   an   odd   number Q [ N / 2 ] + Q [ ( N + 2 ) / 2 ] 2 if   N   is   an   even   number
Q i = x j x k j k   for   i = 1 , , N
where x j and x k represent the value of time series data at jth and kth time (j > k). When there is only one time series, N = n (n − 1)/2; when there are many time series, N < n(n − 1)/2.

2.3. Statistical Indicators

The following statistical indicators including the correlation coefficient (R), the determination coefficient for linear regression (R2), the relative mean absolute error (RMAE, %), the relative root mean square error (RRMSE, %), and the root mean square error value (RMSE) were used to evaluate the accuracy of AOD values derived from MODIS and MERRA-2 AOD products. The R was also used to reveal the relationship between AOD and influencing factors.
R = i = 1 n ( G e s t , i G e s t , i ¯ ) ( G o b s , i G o b s , i ¯ ) i = 1 n ( G e s t , i G e s t , i ¯ ) 2 i = 1 n ( G o b s , i G o b s , i ¯ ) 2   for   i = 1 , , N
R 2 = ( i = 1 n ( G e s t , i G e s t , i ¯ ) ( G o b s , i G o b s , i ¯ ) i = 1 n ( G e s t , i G e s t , i ¯ ) 2 i = 1 n ( G o b s , i G o b s , i ¯ ) 2 ) 2   for   i = 1 , , N
RRMSE = 100 / M ¯ × ( i = 1 n ( G o b s , i G e s t , i ) 2 ) / n   for   i = 1 , , N
  RMAE = 100 / M ¯ × ( i = 1 n | G o b s , i G e s t , i | ) / n   for   i = 1 , , N
RMSE = × ( i = 1 n ( G o b s , i G e s t , i ) 2 ) / n   for   i = 1 , , N
where n means the number of the samples; G e s t , i and G o b s , i are the estimated and observed AOD, respectively; G e s t , i and G o b s , i represent the mean of the estimated and observed AOD, respectively; M ¯ means the mean of the observed AOD values.

3. Results

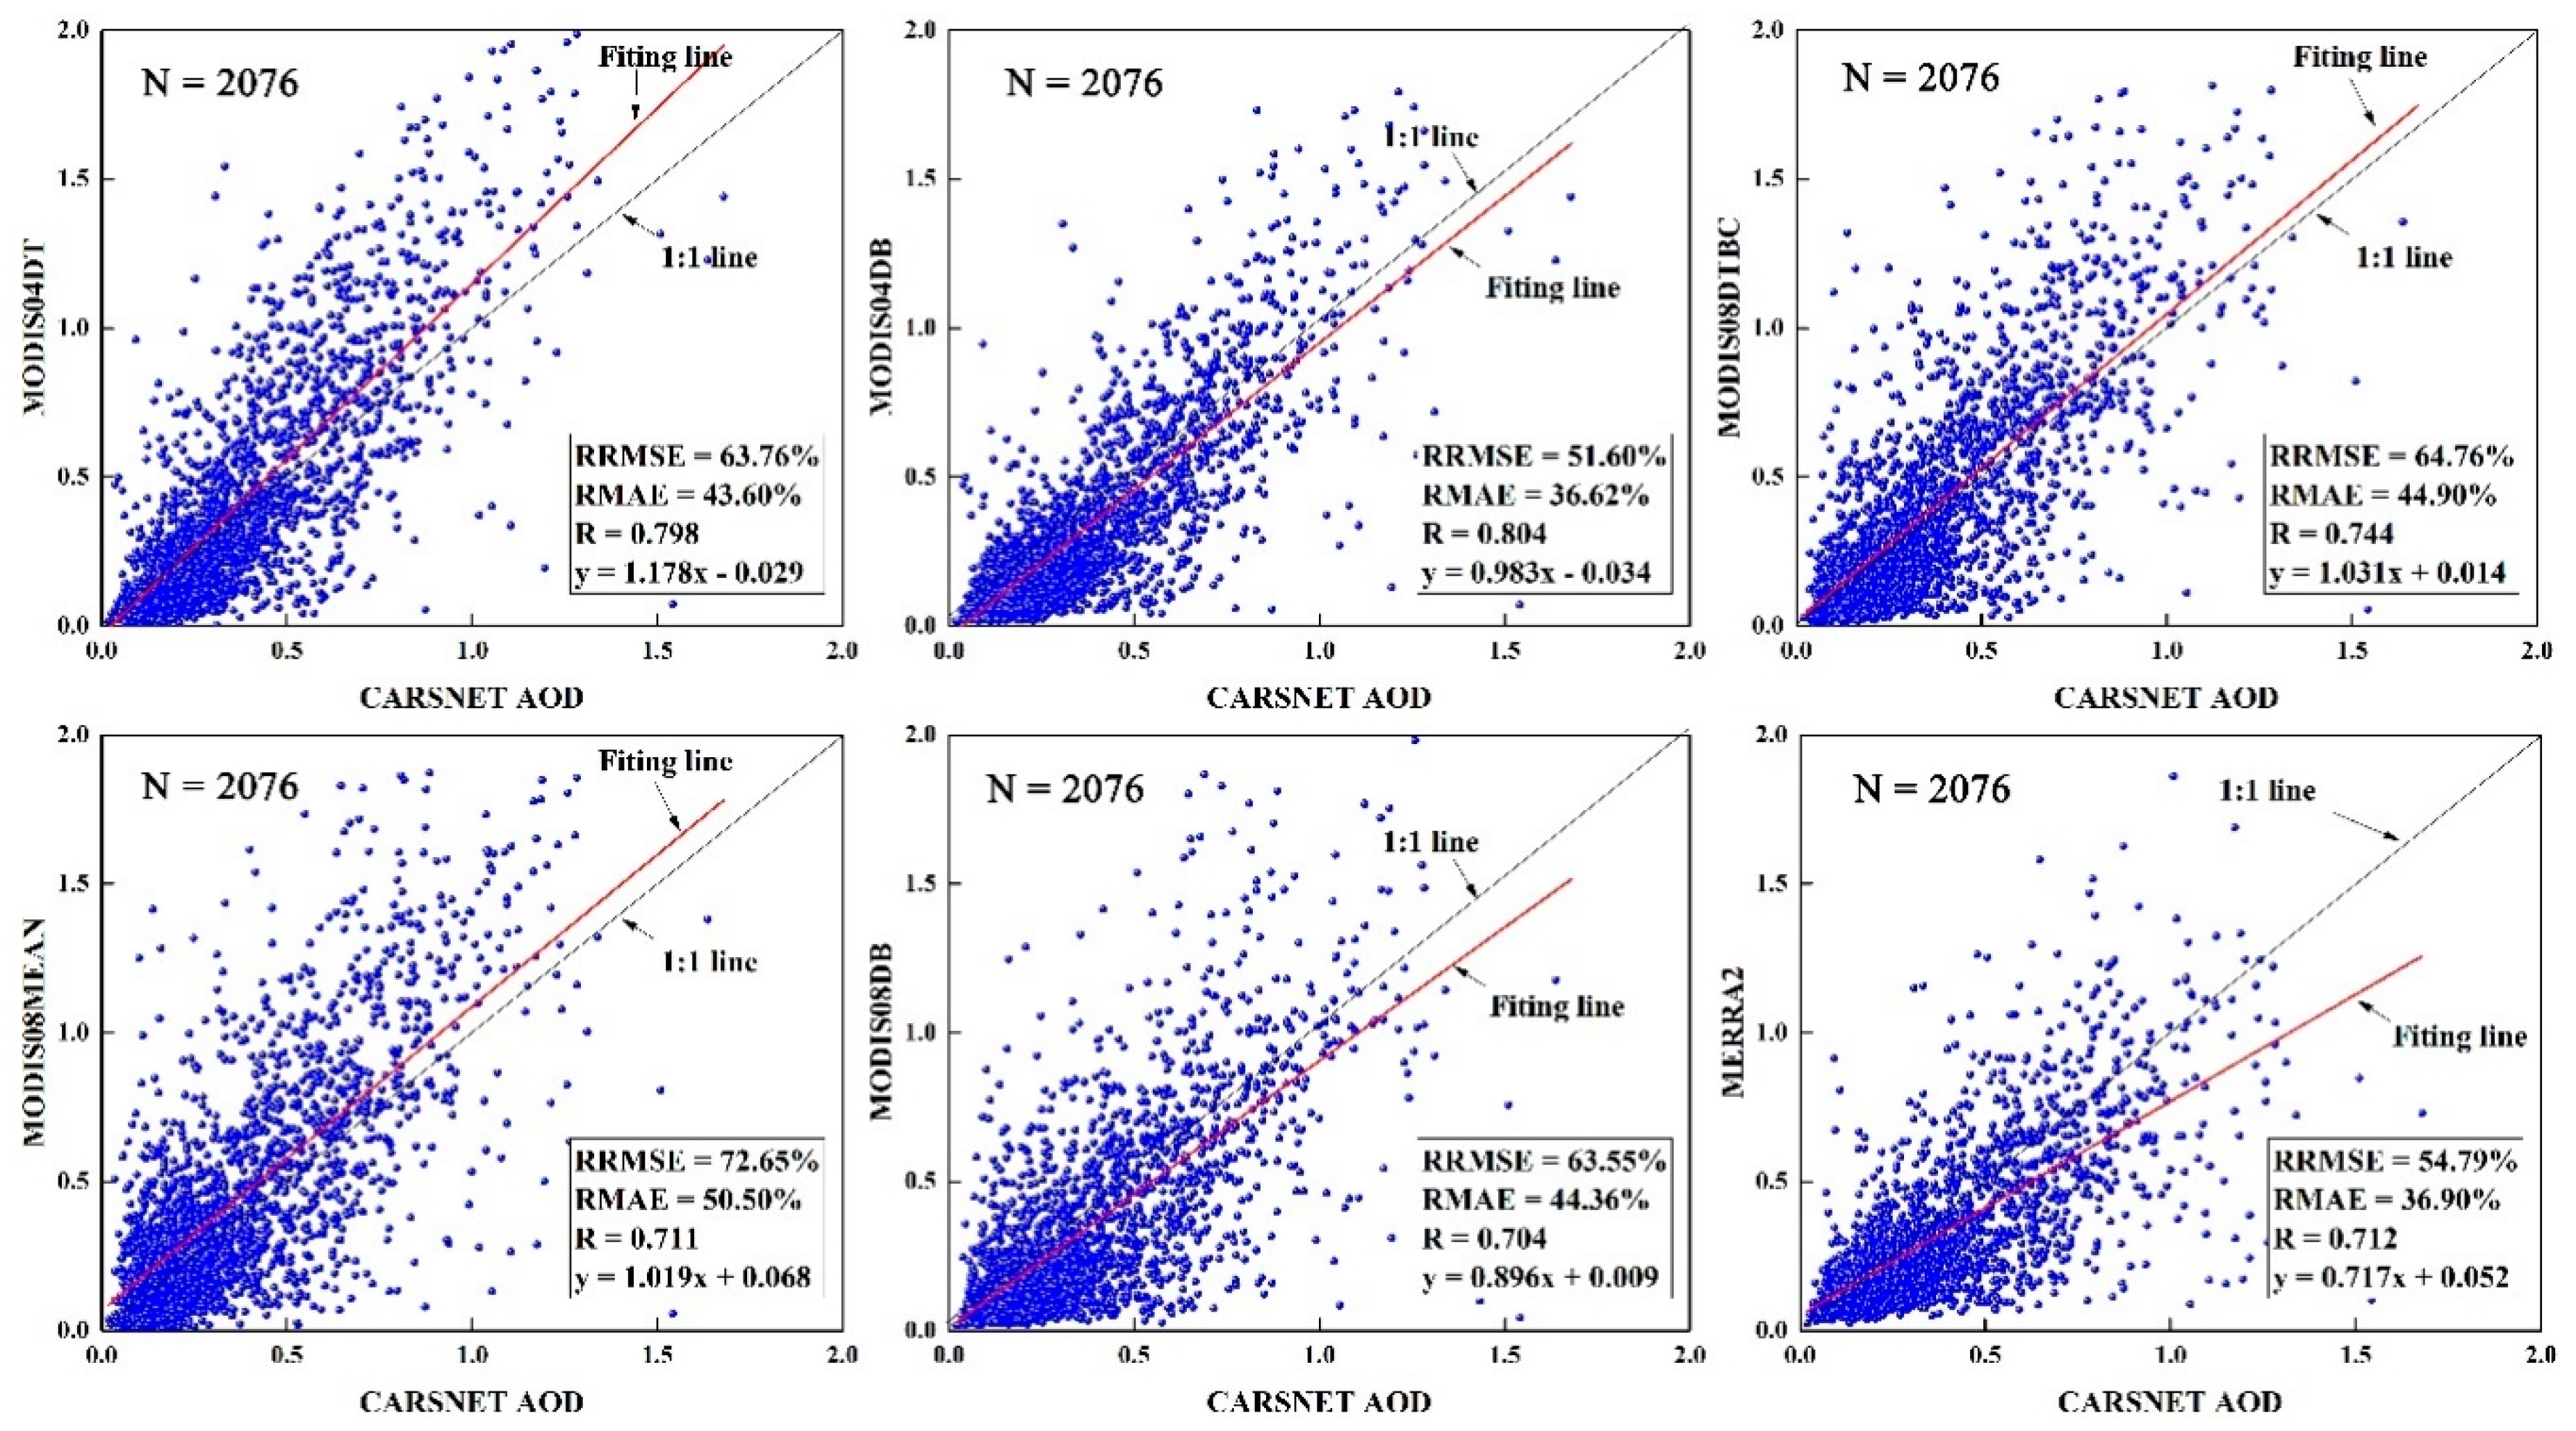
3.1. Validation of AODProducts

The AOD records (550 nm) derived from MODIS and MERRA-2 were validated and compared to 29 CARSNET stations (2076 samples). The mean values of AOD records derived from Terra and Aqua observations were approximately set as the daily mean AOD values from MODIS products. Figure 3 shows the scatter plots illustrating the accuracy of AOD values derived from five MODIS AOD products, including MOD08/MYD08 Deep Blue algorithm (MODIS08DB), MOD08/MYD08 Combined Deep Blue and Dark Target algorithm (MODIS08DTBC), MOD08/MYD08 Mean values (MODIS08MEAN), MOD04/MYD04 Deep Blue algorithm (MODIS04DB), and MOD04/MYD04 Dark Target algorithm (MODISDT), respectively. Figure 3 also shows the scatter plot between the AOD values derived from MERRA-2 AOD dataset and CARSNET AOD observations. The results indicate that AOD values derived from the MODIS04 using the Dark Blue algorithm (MODIS04DB) and the Dark Target algorithm (MODIS04DT) show better performances than other products, due to their higher spatial resolutions than other AOD products.
In spite of the relatively poor accuracy of the MERRA AOD dataset, the spatial and temporal continuity of the MERRA-2 AOD products were better than that of MODIS AOD products. Figure 4 illustrates the number of daily AOD records in each grid during 2015 over mainland China. There are many missing values in the MODIS AOD products since the aerosol retrieval algorithm could not work well under cloudy sky conditions or over bright targets. In contrast, all AOD records with a spatial resolution of 0.50° (lat) × 0.625° (lon) throughout China during 1980–2017 could be derived from the MERRA-2 dataset. Meanwhile, the AOD values for black carbon (BCAOD), dust (DUAOD), organic carbon (OCAOD), sea salt (SSAOD), and SO4 (SUAOD) could also be derived from MERRA-2 products. Thus, AOD values derived from MERRA-2 AOD values were used for analyzing the spatial and temporal variations of AOD values throughout China.

3.2. Spatial and Temporal Variations of AODin China

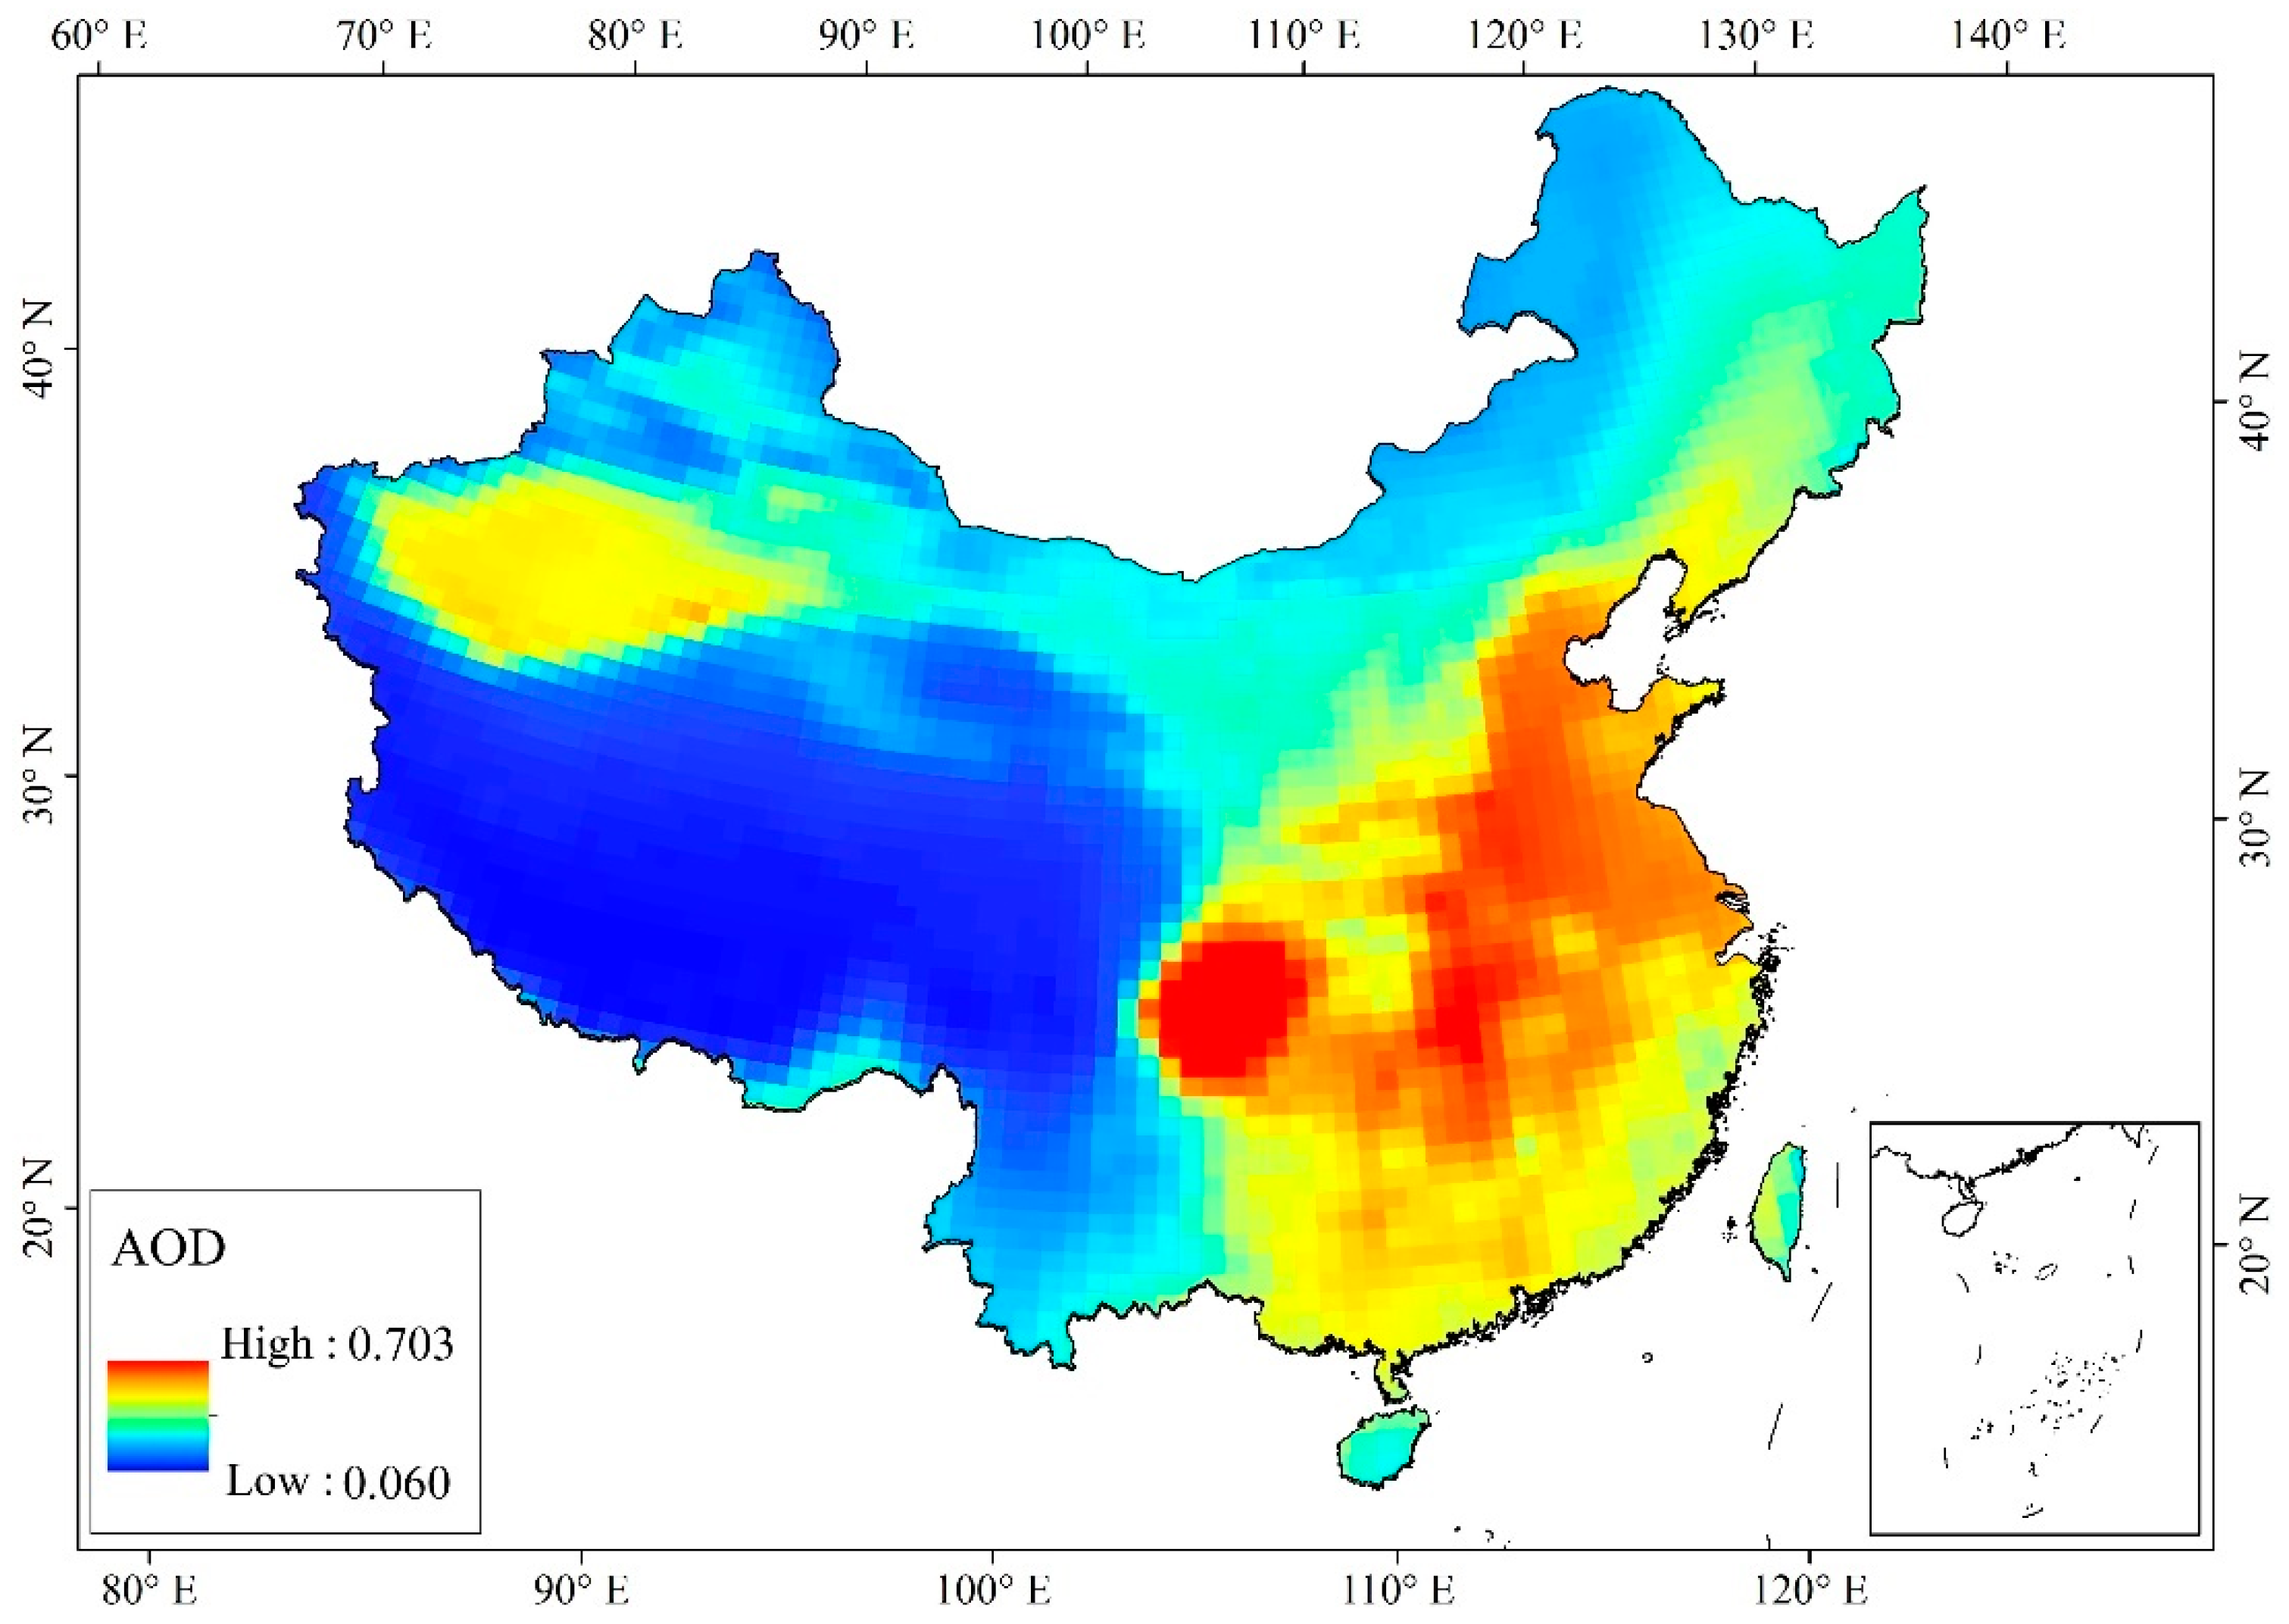
3.2.1. Annual Variations of AOD in China

Figure 5 shows the annual variations of AOD values during 1980–2017 over mainland China. For the entire study period (1980–2017), there is a slight upward trend (0.002 year−1). In the beginning of the 1980s, when the annual mean AOD values over mainland China were relatively lower than that in any other period of time measured, due to low anthropogenic aerosol emissions. Notably, the annual AOD values dramatically fluctuated during 1982–1995, owing to two giant volcano eruptions in 1982 (ALCH Joan volcanic eruption, 0.276) [47] and 1992 (Pinatubo volcanic eruption) [48,49]. The annual mean AOD value reached the highest ever level (0.342) in 1992 over mainland China. After 1992, the annual mean AOD values gradually decreased. The annual mean AOD values during 1993–2000 were all under the level of 0.250. In the beginning of 21st century, the AOD values had gradually increased (0.007 year−1) in response to the rapid economic development, dramatically rising anthropogenic aerosol emissions and growing population in China. The annual mean AOD values rose from 0.232 (in 2001) to 0.288 (in 2007). However, the period of 2008–2009 appears to be a pivot point in AOD. Since 2008, the anthropogenic aerosol emissions were contained and decreased, as a result of various environmental protection policies for reducing carbon and aerosol emissions in China [50]. Therefore, the annual mean AOD values in China have gradually decreased since 2008 (−0.004 year−1). The ranges of the annual mean AOD during 2008–2017 was 0.257–0.297. It was clear that AOD fluctuations are the result of multiple natural geographic elements and socioeconomic factors.

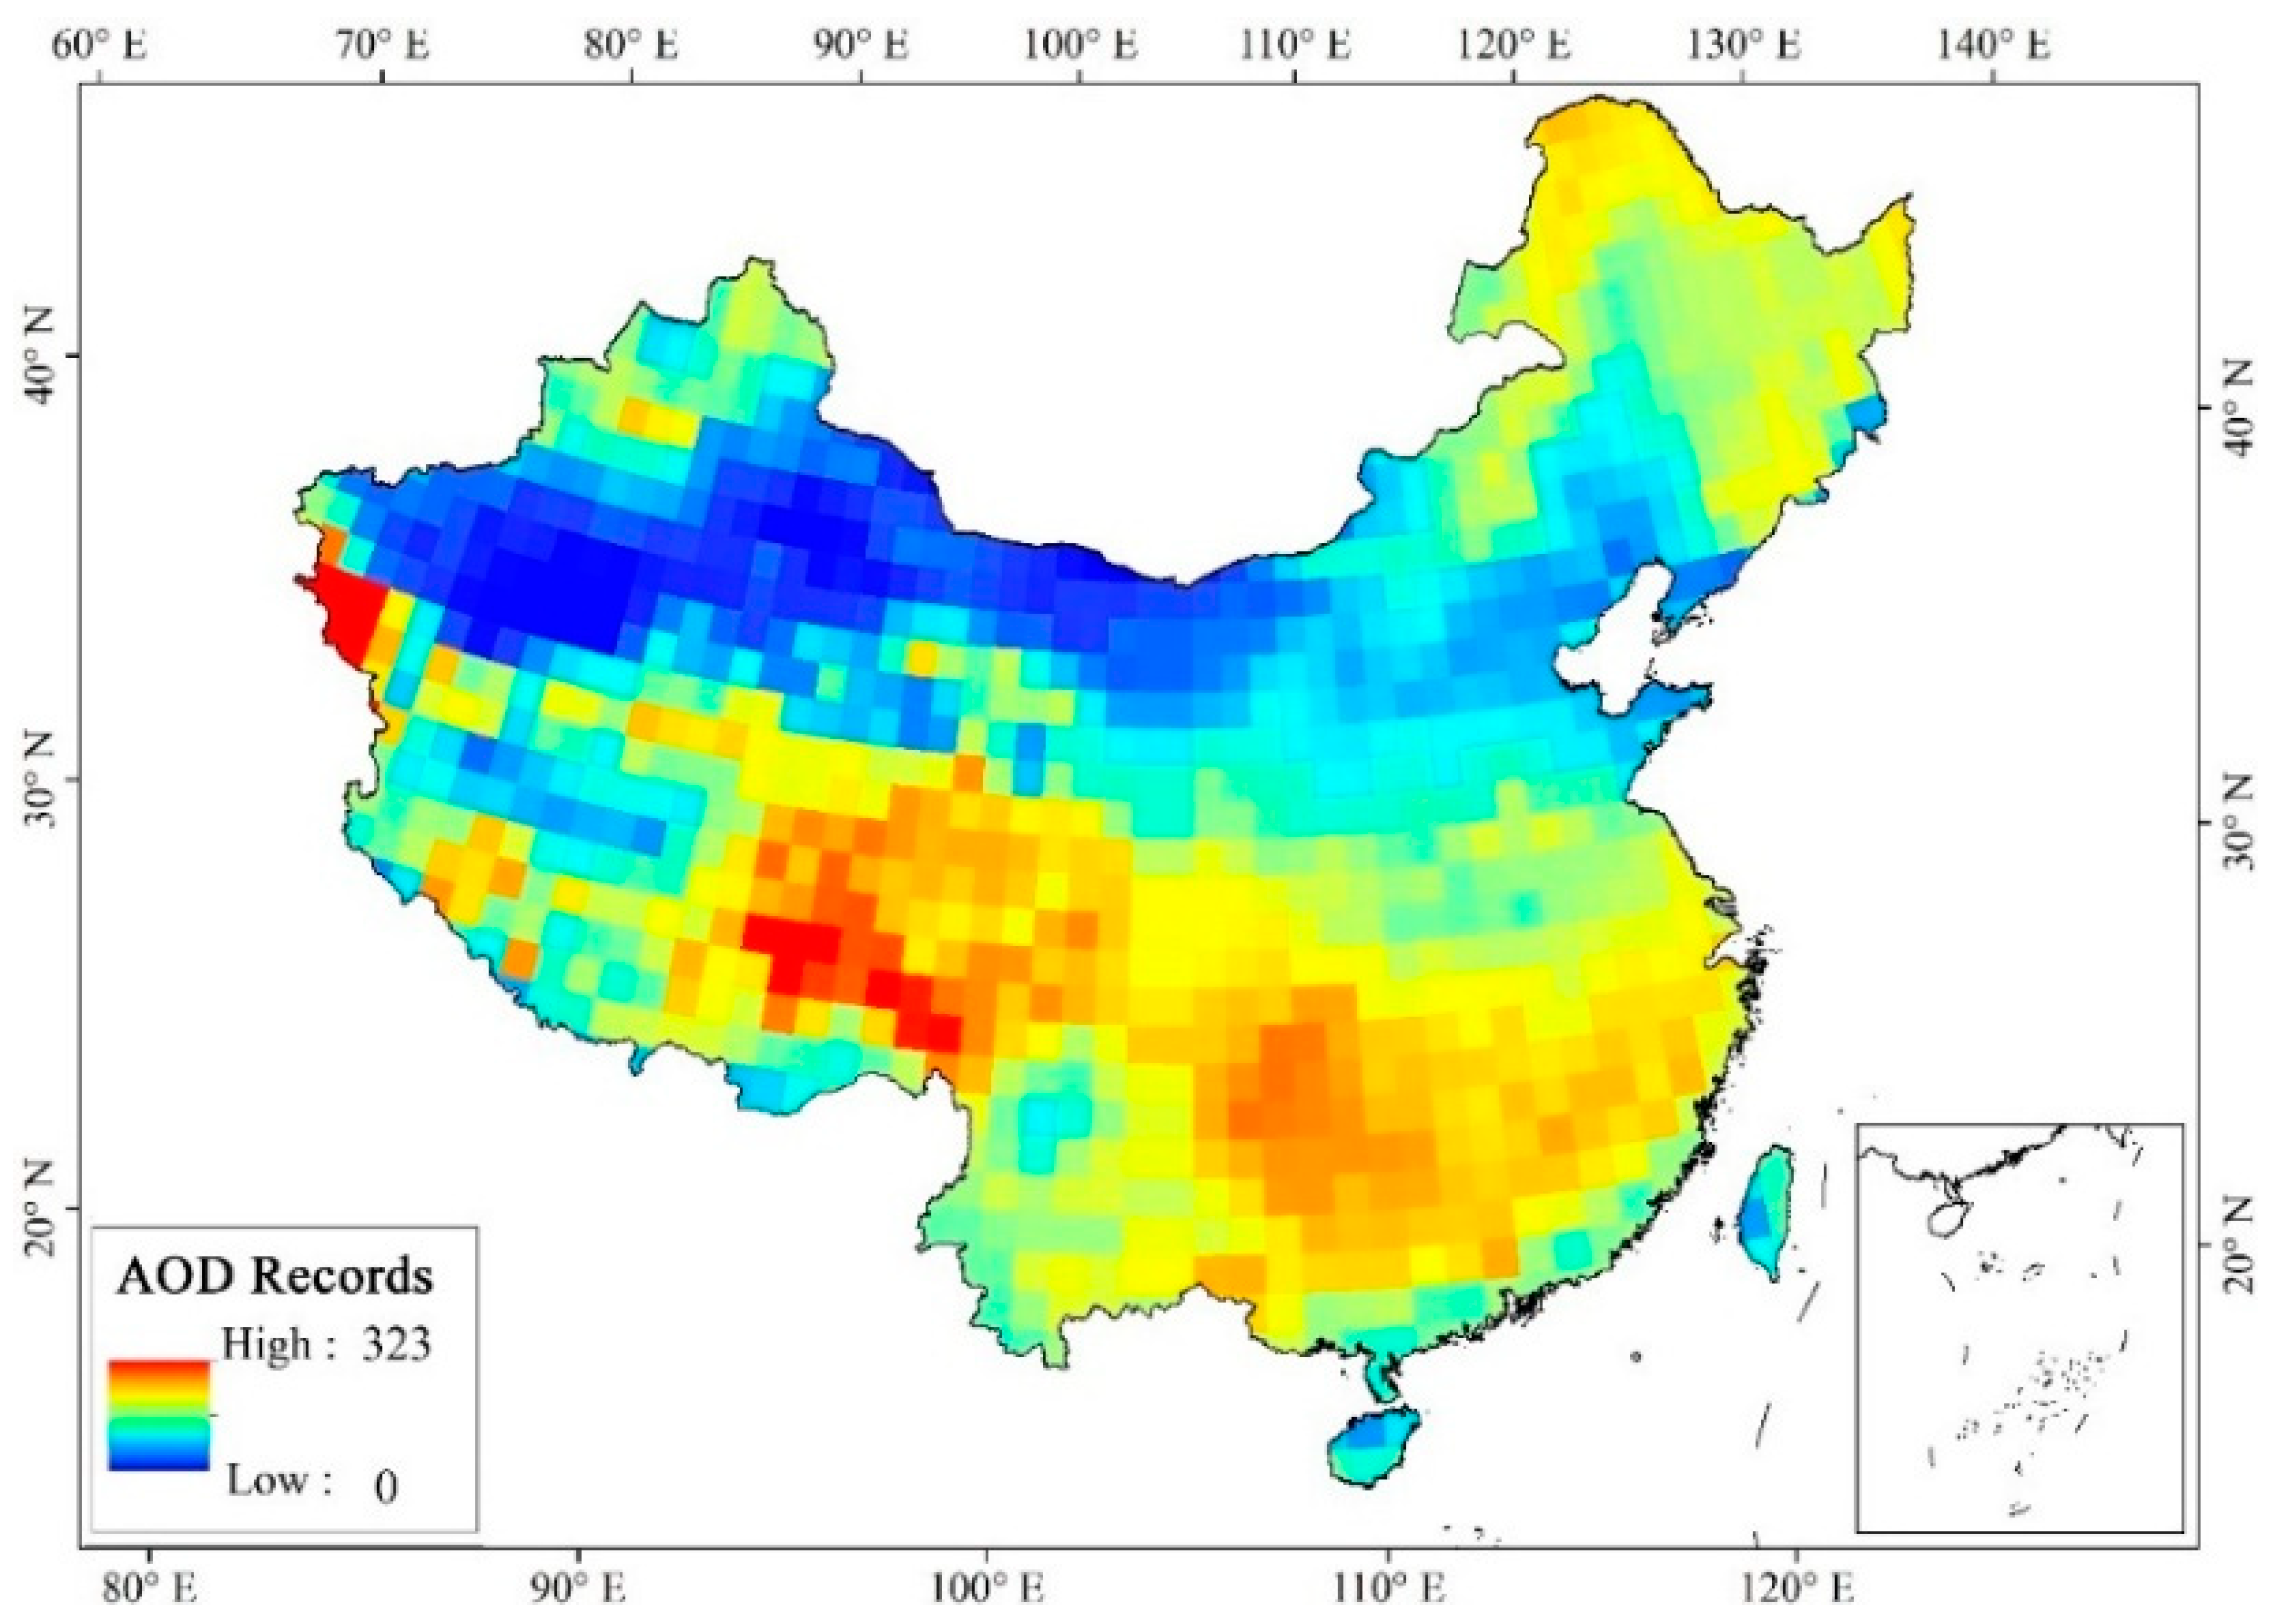
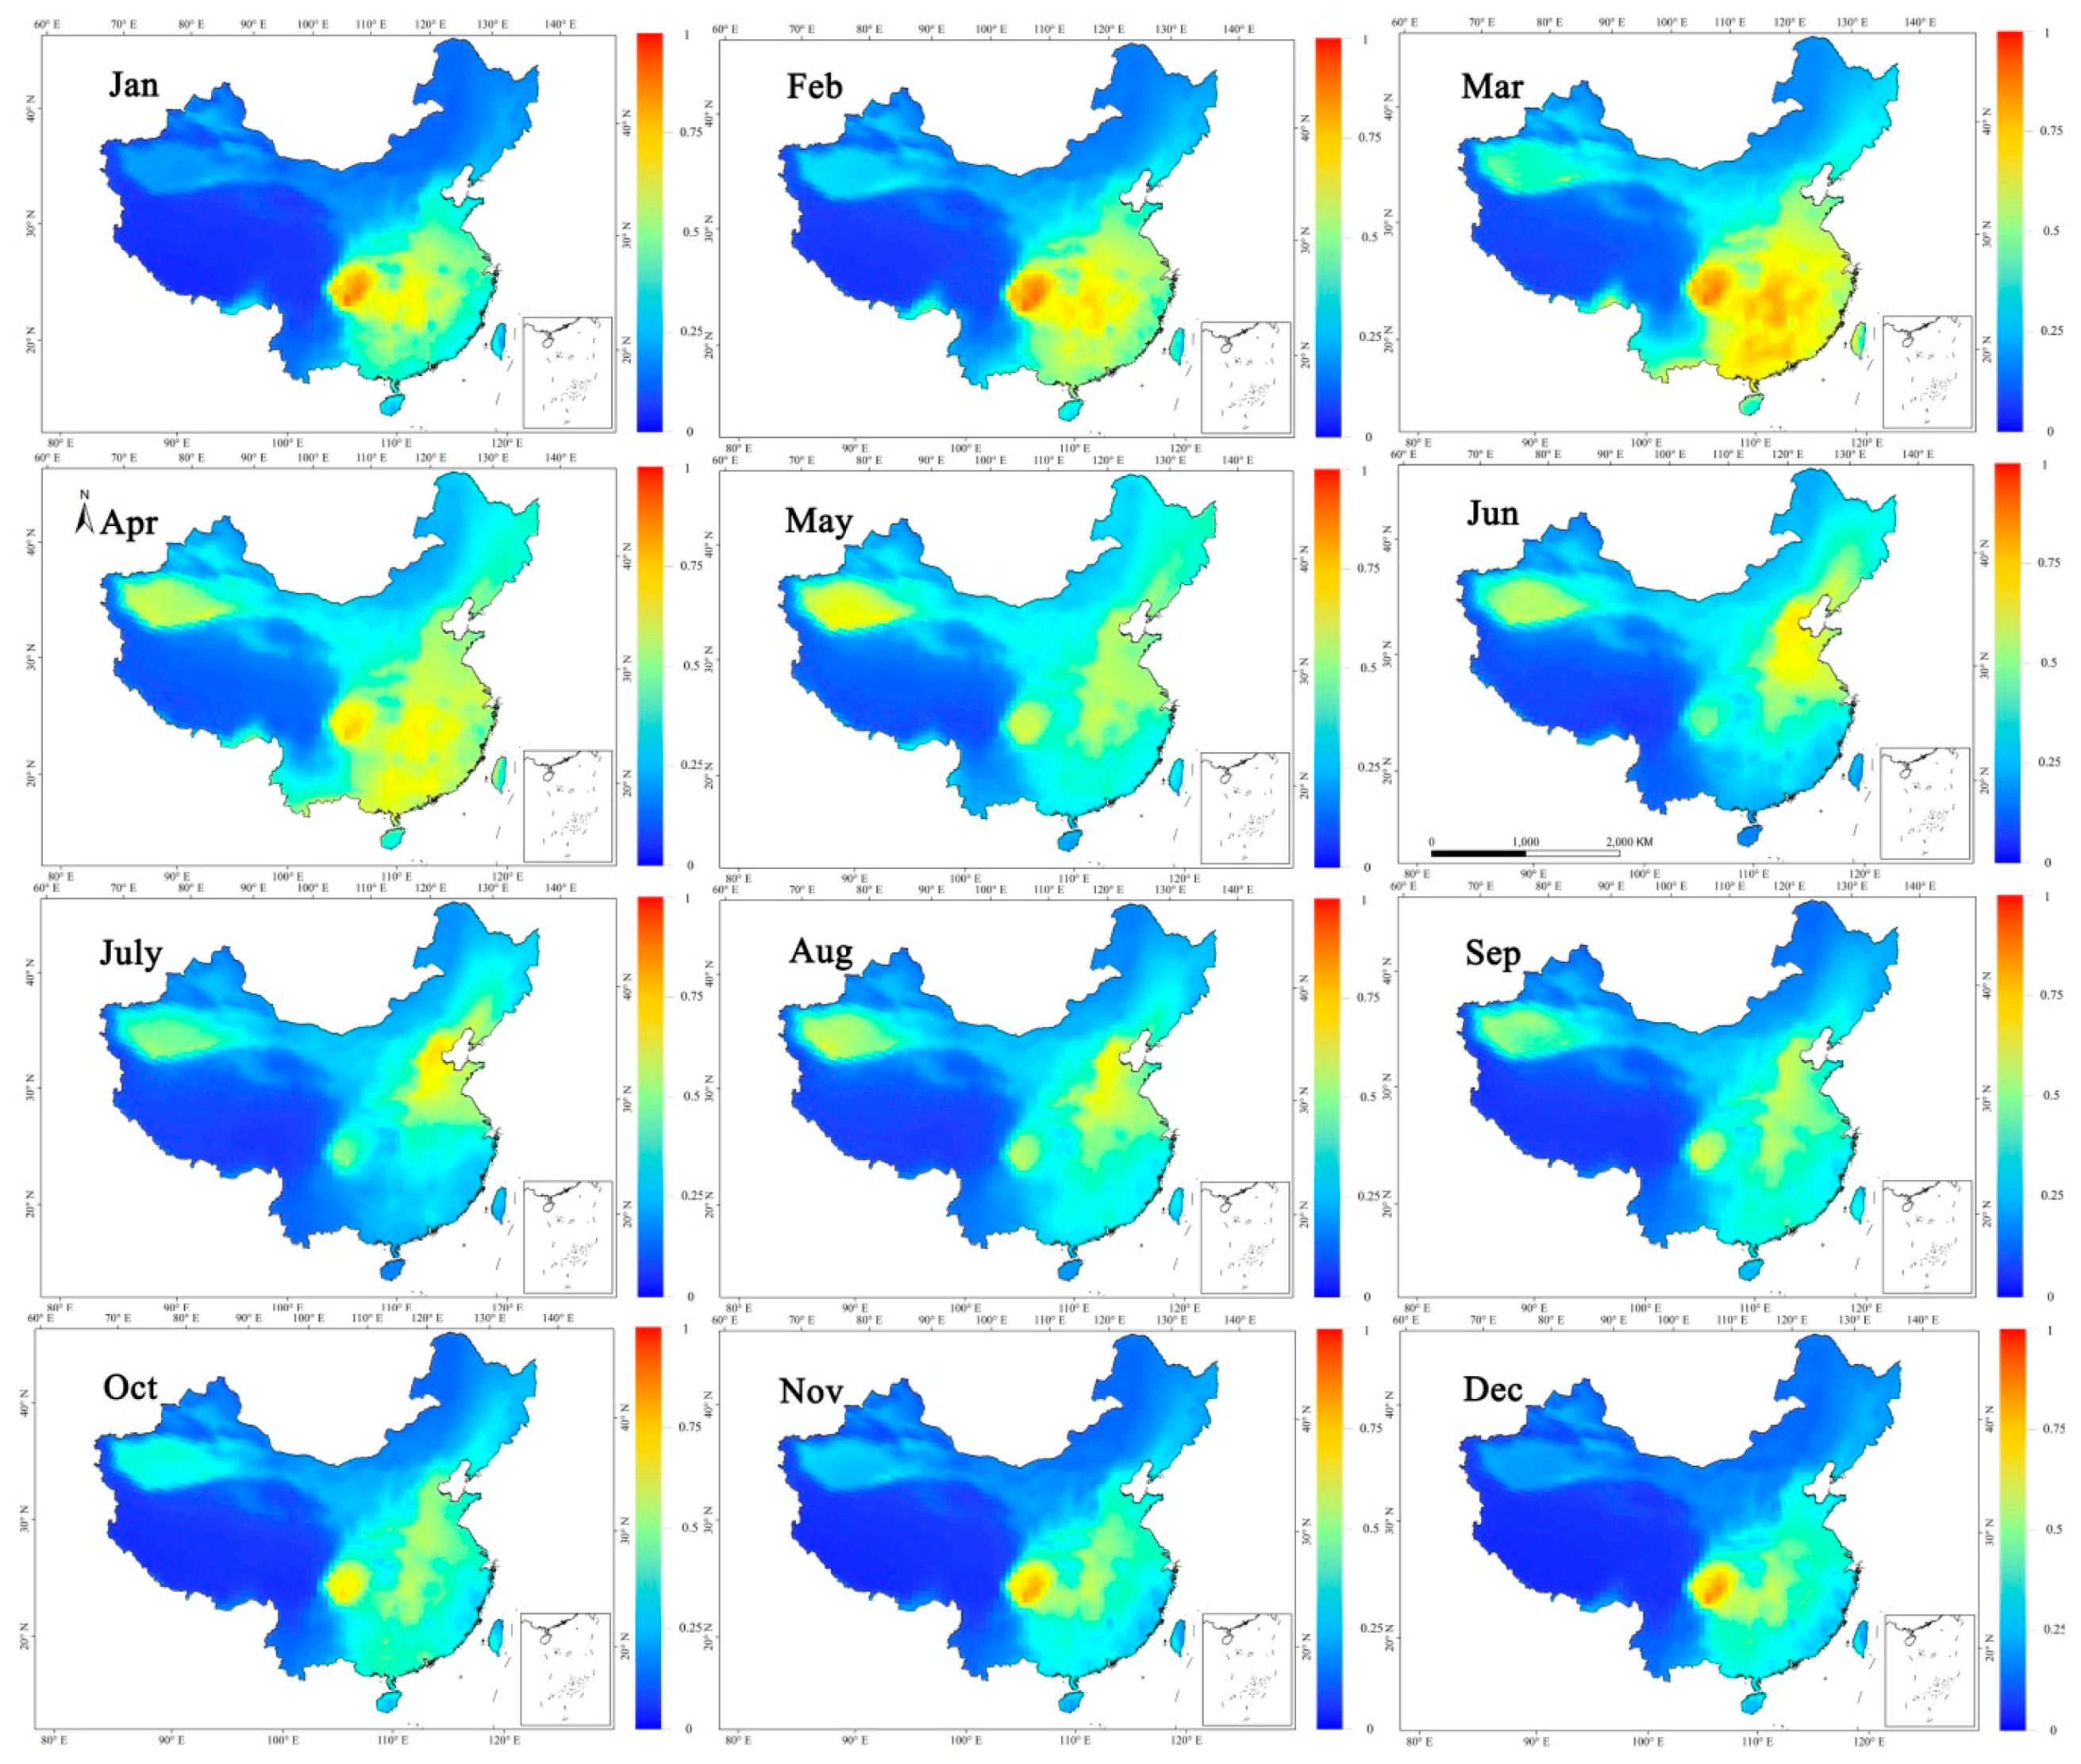
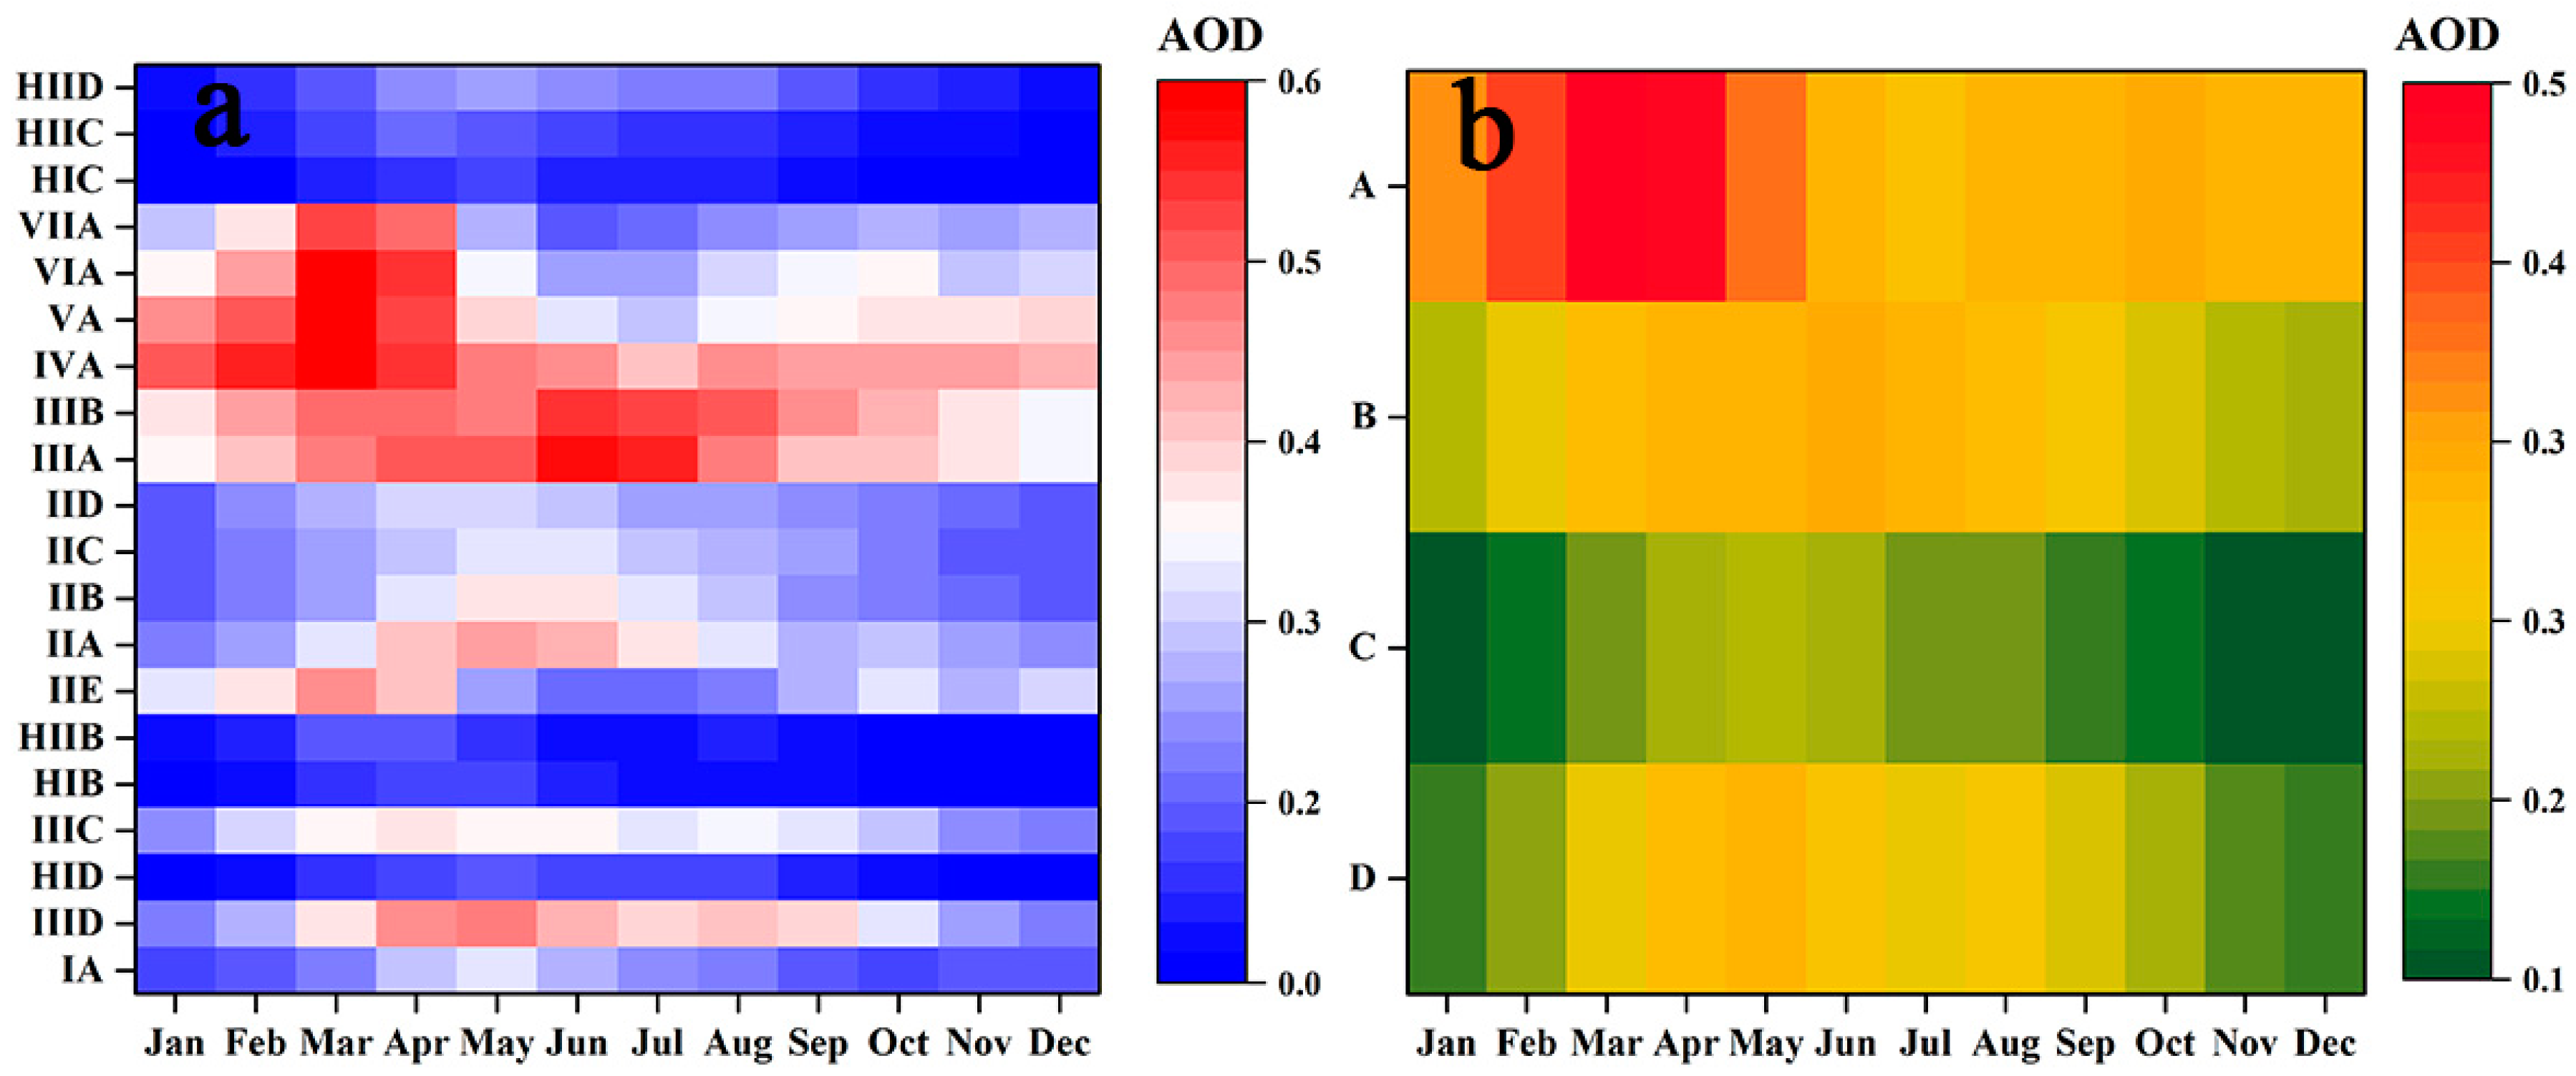
3.2.2. Spatial and Temporal Variations of AOD in China

Figure 6 and Figure 7 illustrate the spatial and temporal variations of AOD values over mainland China. The result illustrated that AOD values were generally higher in spring (0.309) than that in summer (0.271), autumn (0.222), and winter (0.202), due to the dense aerosol generated by the frequent sandstorms in Northern China and the straw combustion in Southern China. The Sichuan Basin (0.703) has always been an area with high AOD values with monthly mean AOD range of 0.355–0.709, due to the strong human activity intensity and the basin topography (hindering aerosol diffusion in the air) there. The AOD values in North China plain and the South Yangtze River were also large, because of intense human activity and favorable humid weather conditions for the formation of haze in the atmosphere. For example the annual mean AOD values in the Huainan and the plain of the middle and lower reaches of the Yangtze River, the North China Plain, the hilly areas of the south of the Yangtze River, the hilly areas in the middle of Shandong Province were 0.513, 0.509, 0.479, 0.481, and 0.438, respectively. The Tarim and Turpan Basin was also an area with high AOD values, especially in summer (0.391), owing to the frequent dusty weather in summer there. In contrast, Northwestern China has always been an area with low AOD values, due to relatively low human activity intensity and clear sky conditions there. For example the ranges of the monthly mean AOD values in Alashan and Hexi Corridor, the Western Inner Mongolia high plain, the Eastern Inner Mongolia high plains were 0.150–0.307, 0.151–0.297, and 0.134–0.293, respectively. The Qinghai Tibet Plateau has always been an area with the lowest AOD values, due to the clear sky conditions there. For example, the ranges of the monthly mean AOD values in the NagquPlateau and the Ali Mountains were 0.015–0.080 and 0.047–0.116, respectively.
Figure 8 illustrates the monthly mean AOD values in different climate zones. AOD values were generally higher in humid zones with warm temperate than that in arid zones, due to frequent cloud occurrences there. For example the AOD ranges for VA, IVA, IIIB, and IIIA were 0.259–0.570, 0.374–0.588, 0.303–0.527, and 0.303–0.569, respectively. AOD values in humid zones in China were higher in spring than that in winter, owing to the frequent sandstorms in Northern China and the straw combustion in Southern China. For example the AOD ranges for VIIA, VIA, VA, IVA, IIIB, and IIIA in spring were 0.236–0.508, 0.303–0.582, 0.361–0.570, 0.459–0.588, 0.458–0.461, and 0.448–0.493, respectively. The AOD values were also large in arid areas, owing to the dusty air conditions there. For example the AOD ranges for IIID (warm temperate zones with arid air condition) were 0.173–0.457, respectively. Relatively large AOD values in the arid areas were mainly observed in spring and summer because of the strong heating atmosphere and surface convection there. For example, the AOD value for IIID in spring, summer, autumn, and winter were 0.410, 0.381, 0.288, and 0.196, respectively. In all, it appears that air temperature and humidity have significant effects on the characteristics of AOD values.

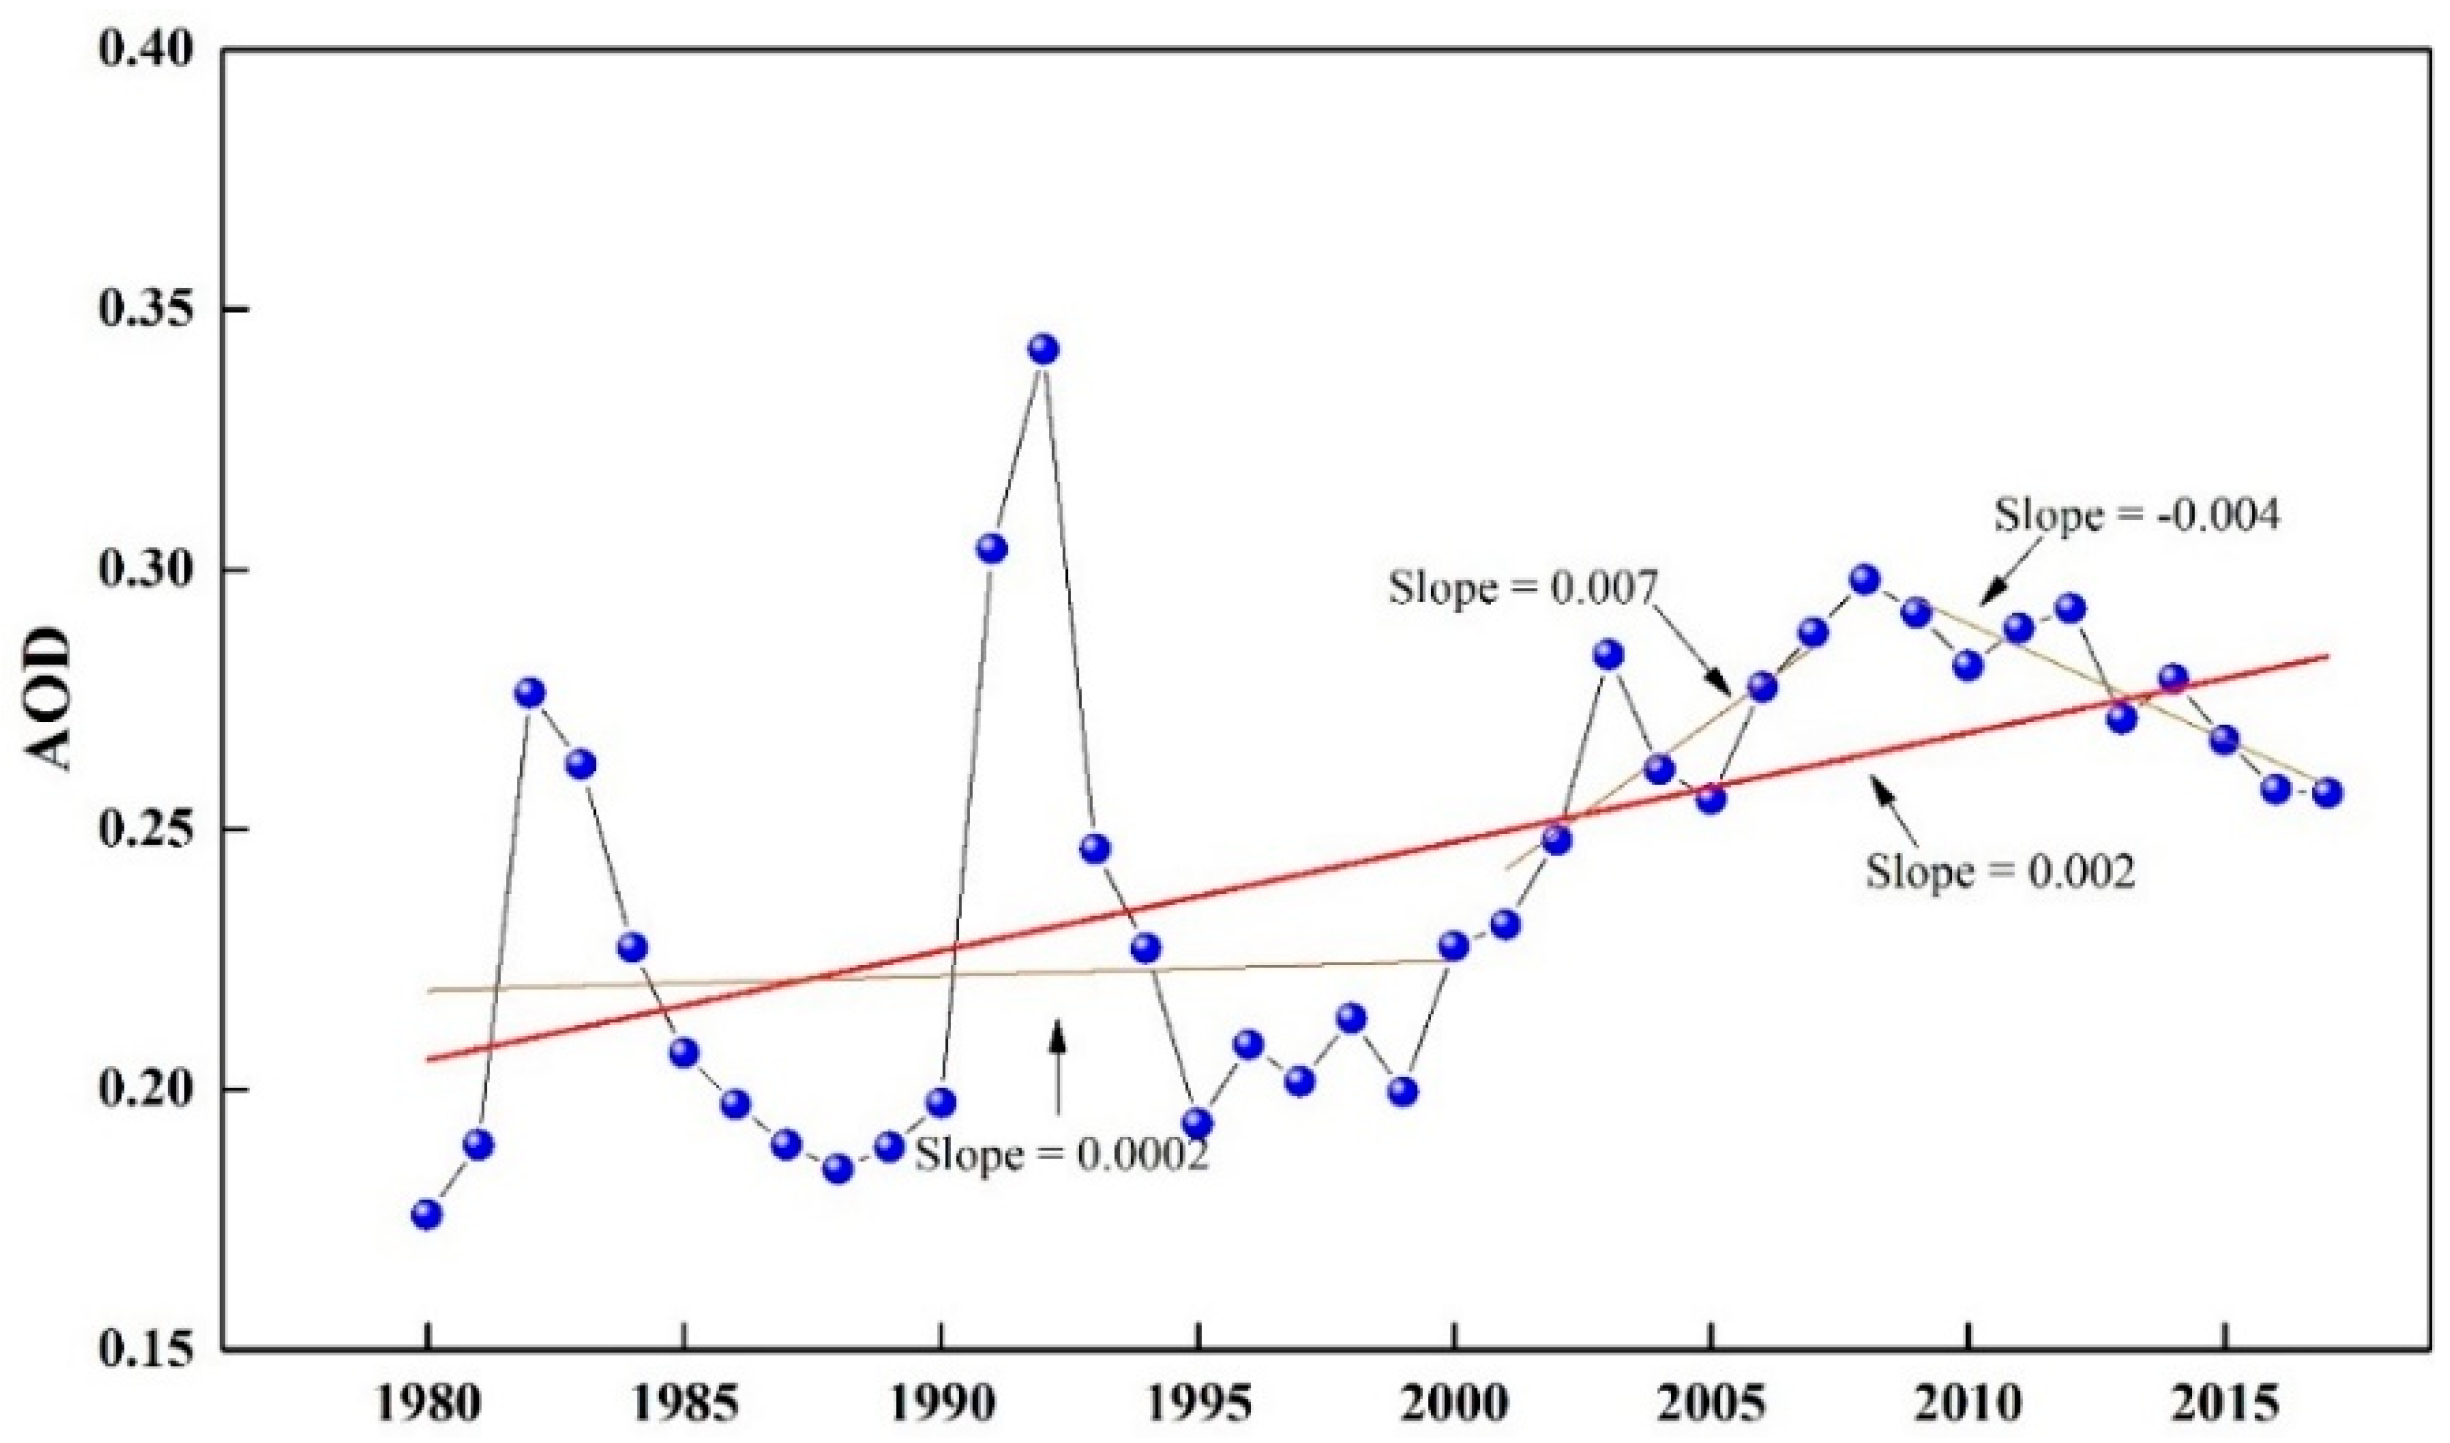
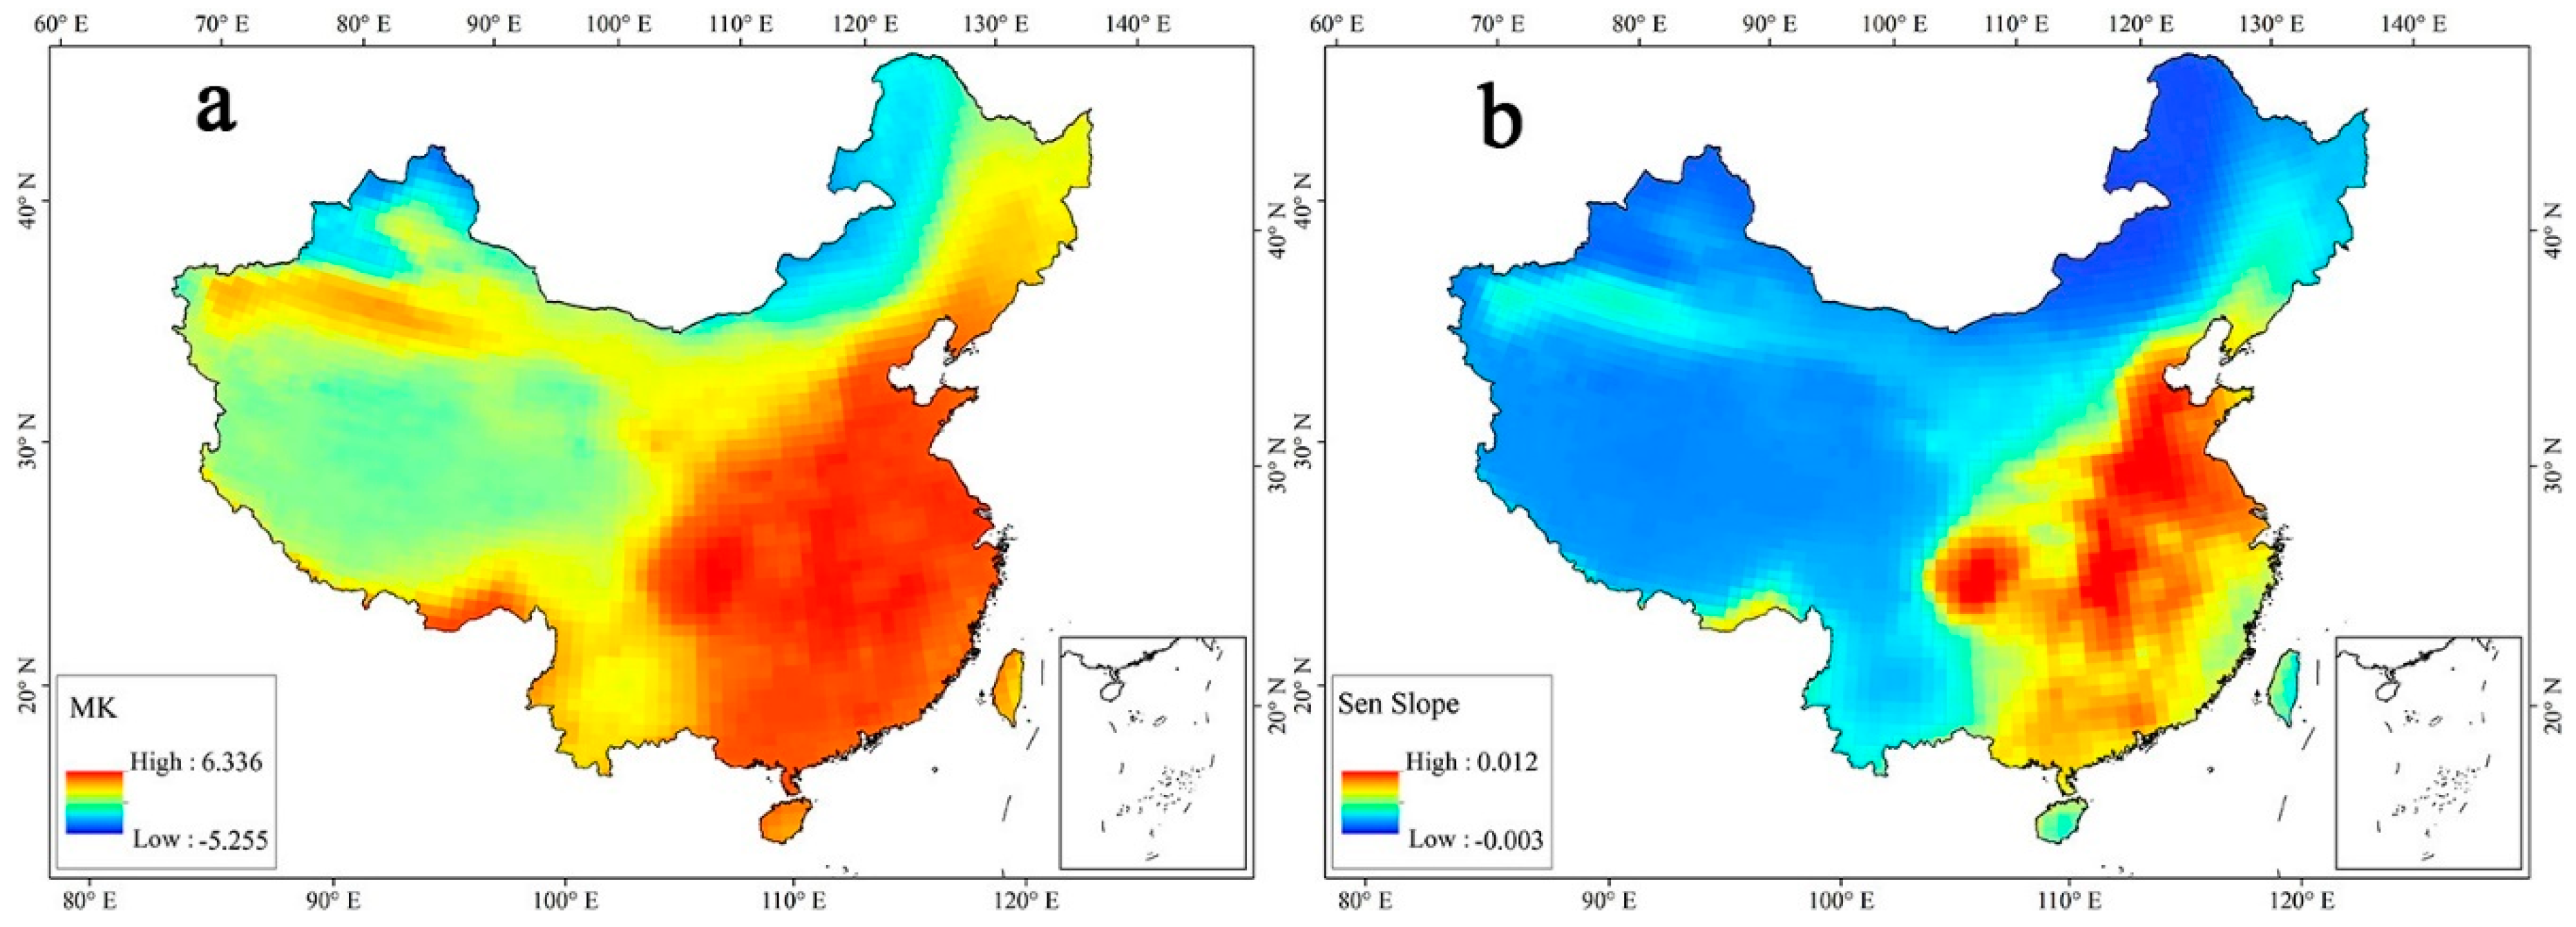
3.2.3. Temporal Trends of AOD in China

In this study, the MK index and the Sen Slope index were calculated to characterize the temporal trend of the aerosol optical depth during1980–2017 in China. Figure 9 shows the spatial distributions of the MK and Sen Slope values for AOD in China. The AOD values in Southeastern China showed a significant (high MK values) increasing trend (positive Sen Slope values), owing to the growing populations and anthropogenic aerosol emissions there. The growing trend of AOD values in Southwestern China was not obvious. By contrast, the AOD values in the Altai Mountains, Greater Khingan Range and the northeast of Inner Mongolia showed a significant decreasing trend of AOD values, because of low anthropogenic aerosol emissions and clear sky conditions there.
The plain and hilly areas of Northern China, Eastern China, and Central China were the areas with the most significant rising trend of aerosol optical depth over mainland China, which is mainly related to the rapid industrial development and growing population since 1980s there. For example, the MK and Sen Slope values for Huainan and the middle and lower reaches of the Yangtze River are 5.816 and 0.0095, respectively. The intensity of human activities in the Tibetan Plateau is weak, so the temporal change of aerosol optical depth in this area is not obvious. For example, the MK and Sen Slope values for Zangnan Mountains were 1.408 and 0.526, respectively. The northeasternmost and the northwesternmost of China were the areas with low aerosol emissions and low intensity of human activity, thus, the aerosol optical depth there even appeared a decline trend. For example, the MK and Sen Slope values for the south of the Five Ridges were −0.722 and−0.0009, respectively.

4. Discussions

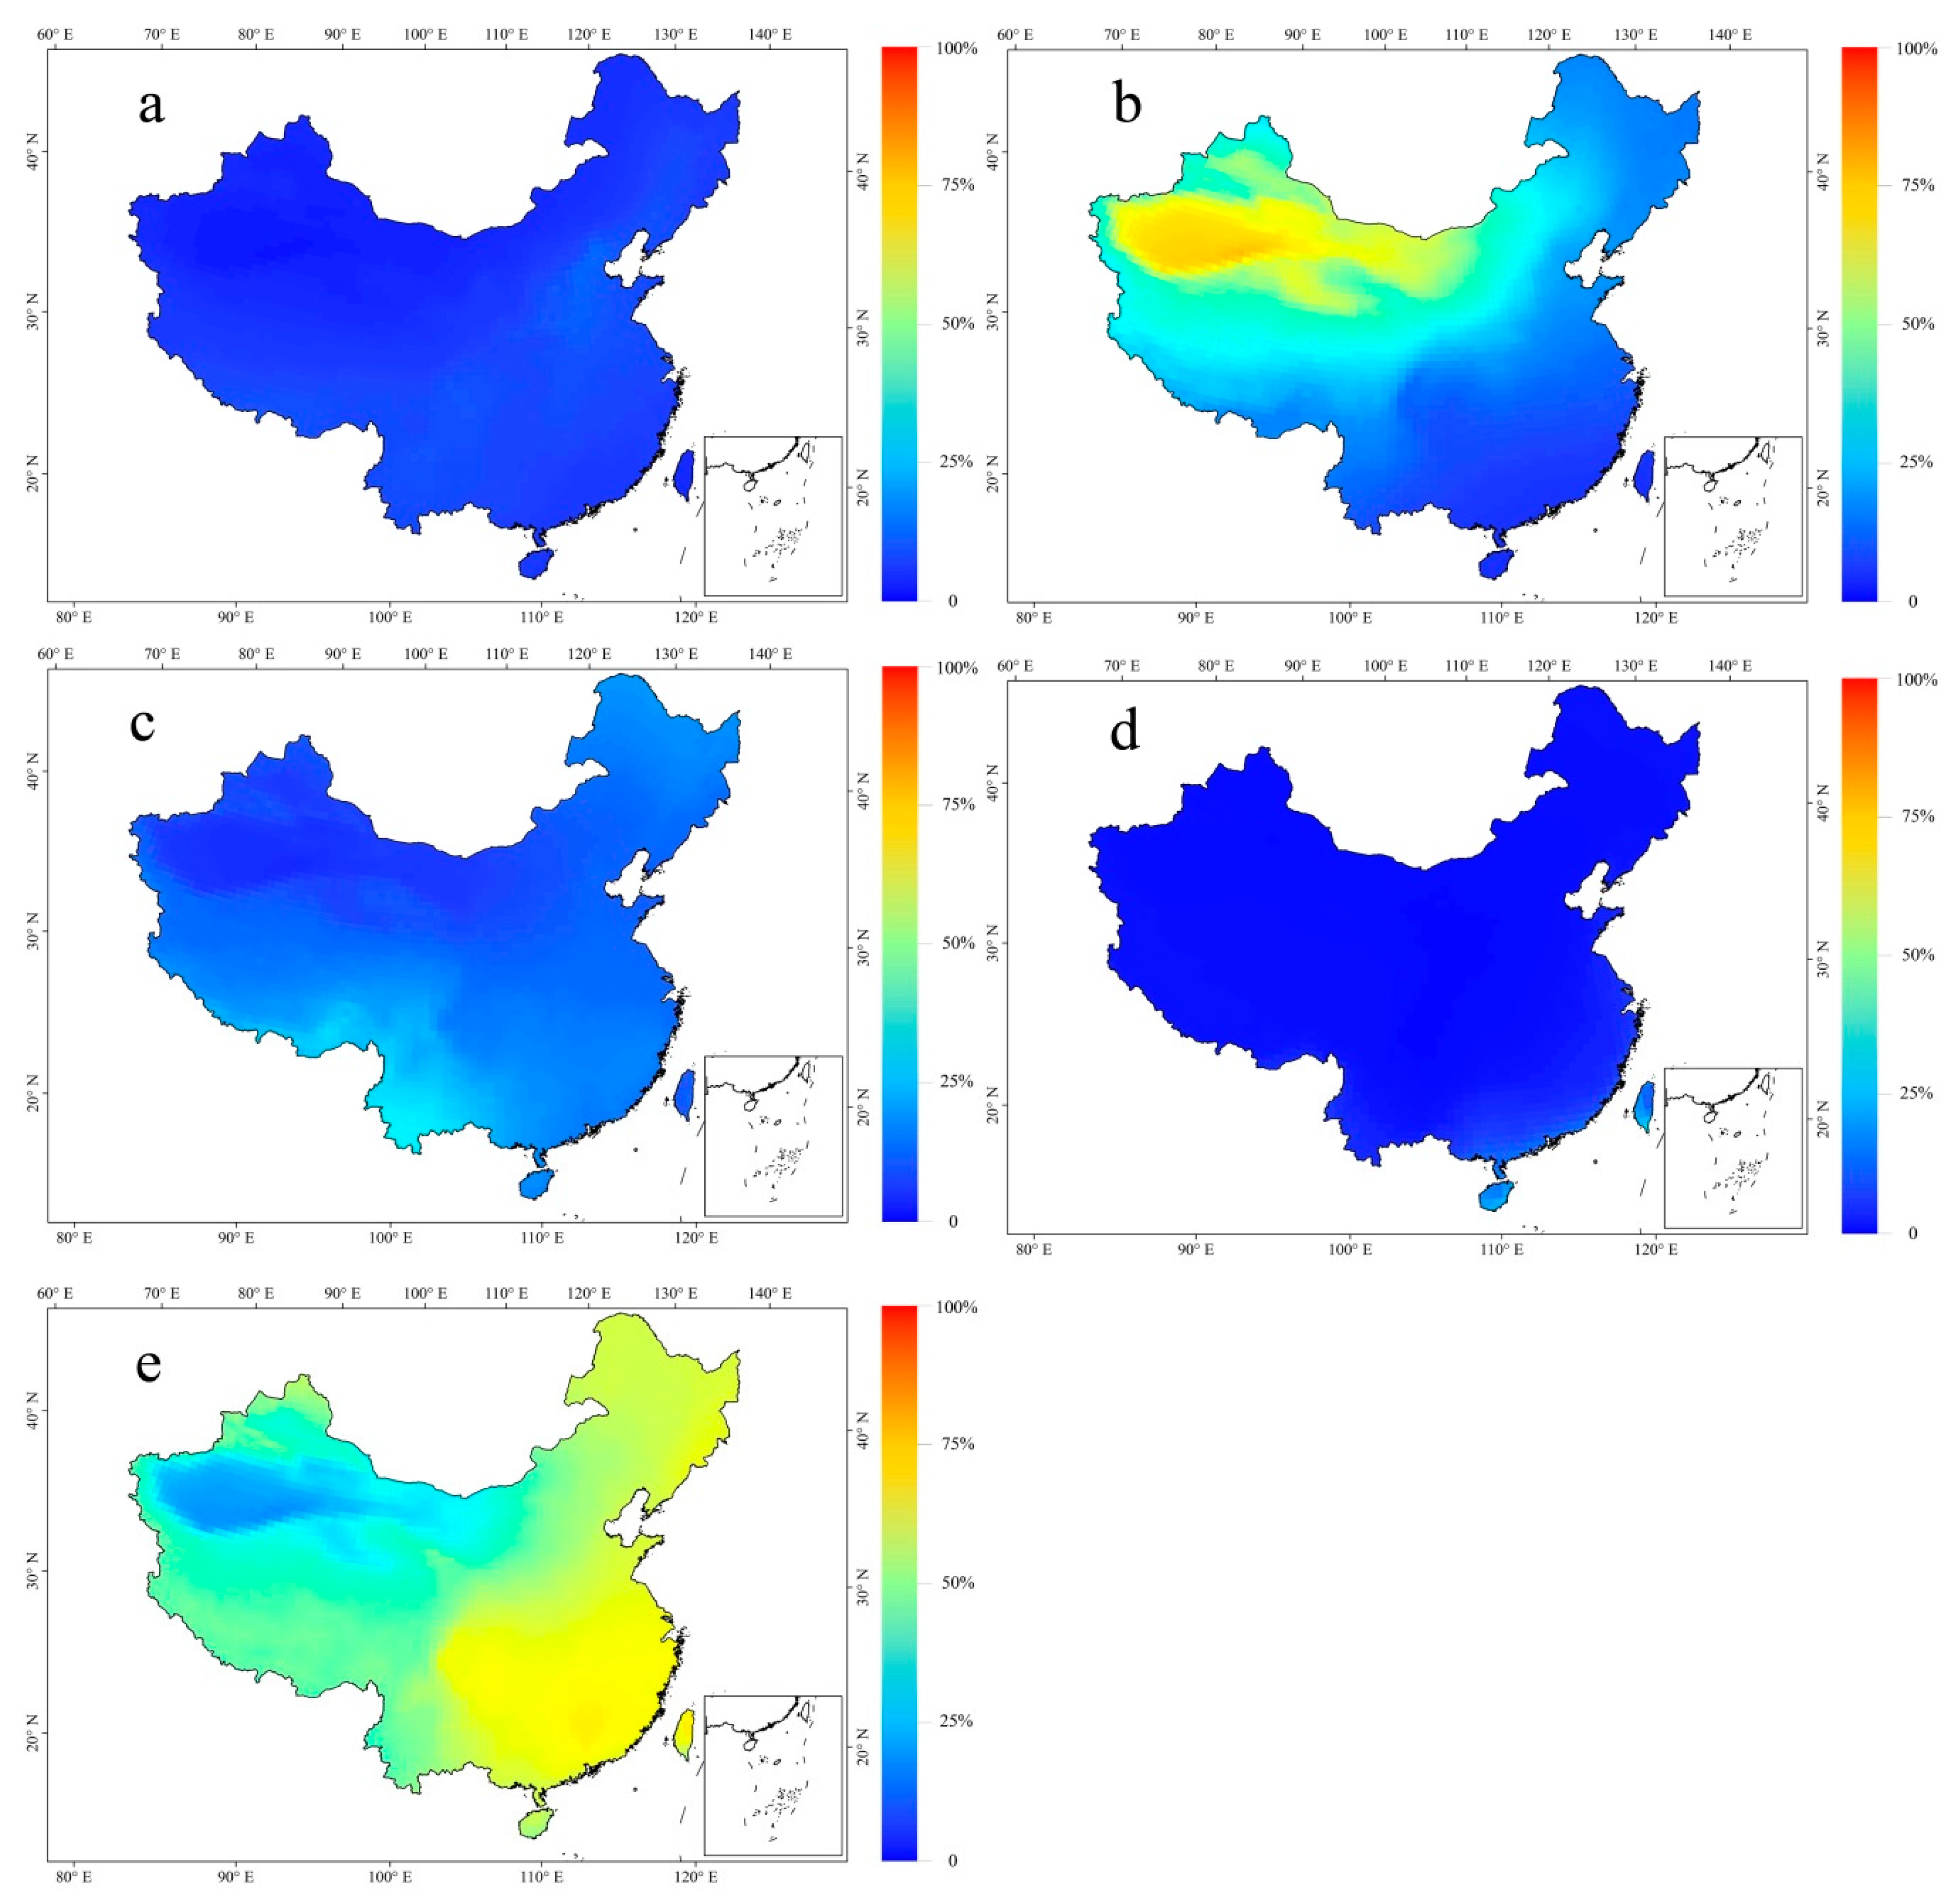
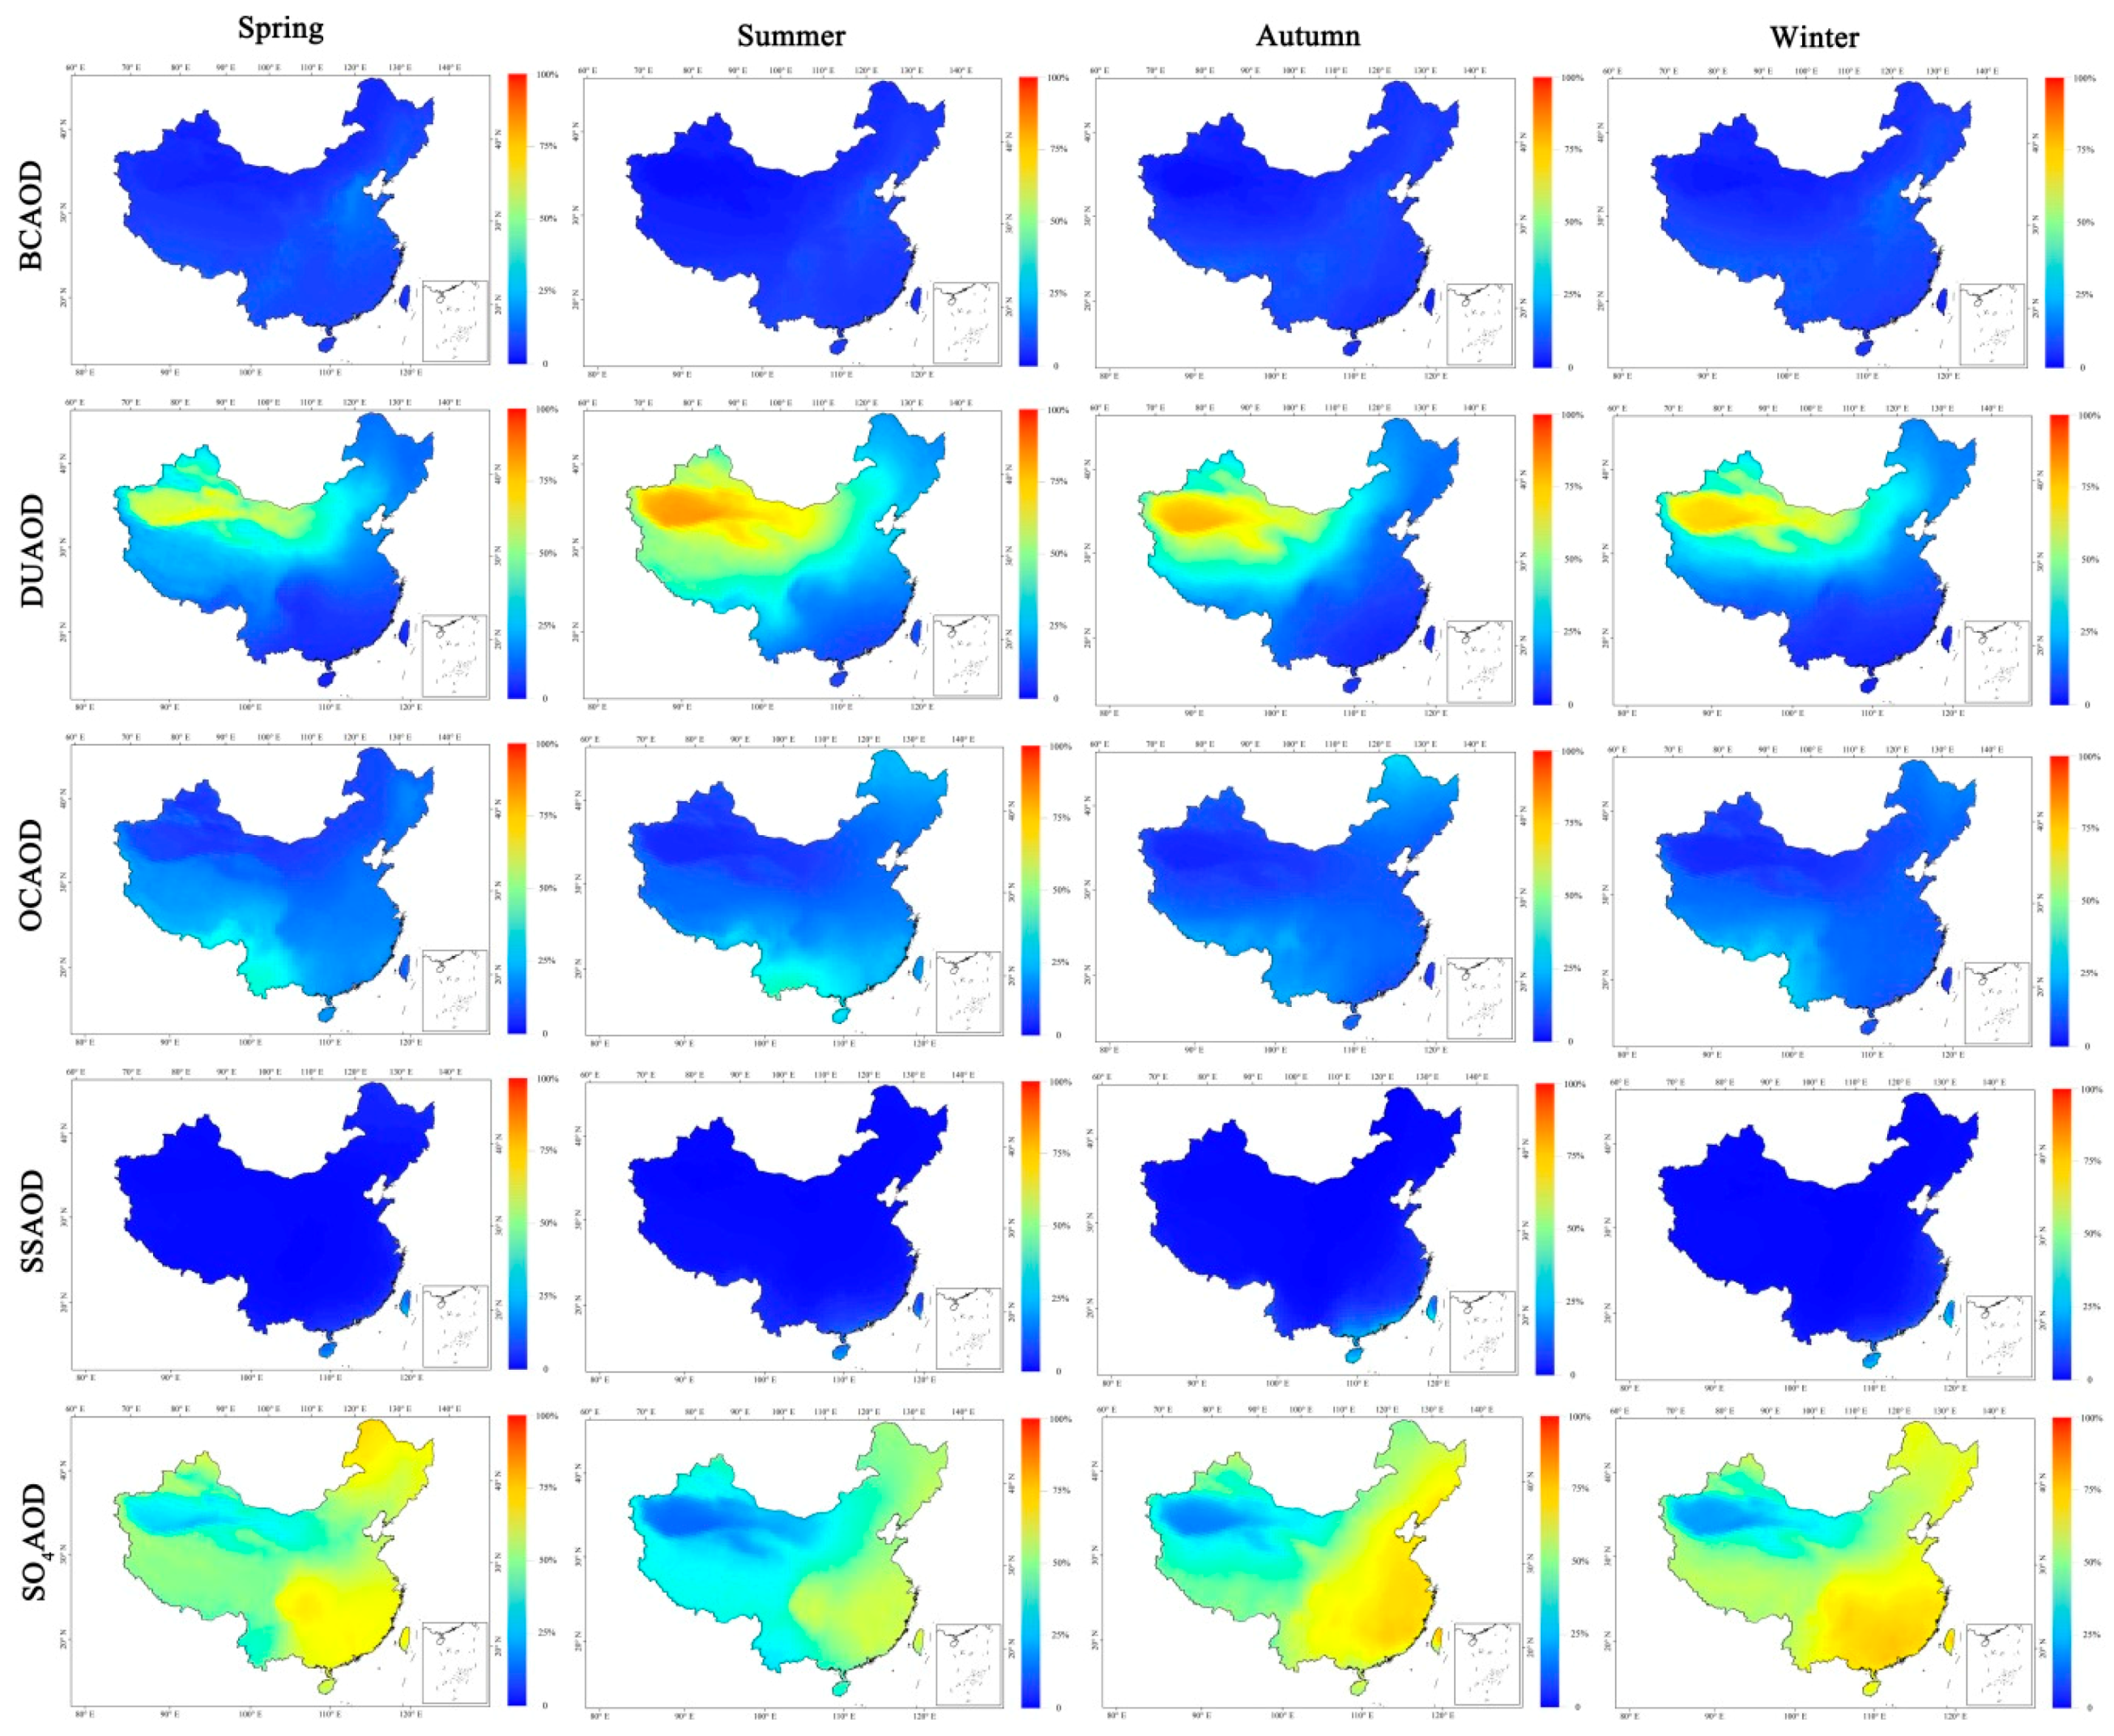
4.1. The Composition of AOD over Mainland China

Daily AOD values for dust aerosol (DUAOD), black carbon aerosol (BCAOD), organic carbon aerosol (OCAOD), sea salt aerosol (SSAOD), and SO4 aerosol (SO4AOD) were derived from the MERRA-2 dataset to analyze the main aerosol resources for the total AOD over mainland China. The AOD values were found to be roughly fitted using DUAOD, BCAOD, OCAOD, SSAOD and SO4AOD values following this equation:
AOD T o t a l = DUAOD + BCAOD + OCAOD + SSAOD + SO 4 AOD + C
where C is a very small constant that could be ignored. Therefore, the contributions of DUAOD, BCAOD, OCAOD, SSAOD, and SO4AOD to AOD T o t a l could be calculated using following equation:
AODP = AODS / AOD T o t a l
where AODP is the contribution rate (%) of each aerosol to AOD T o t a l .
Figure 10 illustrates the annual mean contributions of DUAOD, BCAOD, OCAOD, SSAOD, and SO4AOD to the total AOD values. The AODP for SO4AOD (49.51%) were generally higher than that of DUAOD, BCAOD, OCAOD, and SSAOD. It was clear that SO4AOD is the main driving factor for the spatial distribution of total AOD values over mainland China, especially in Eastern China owing to the huge anthropogenic SO4 aerosol emissions there. The DUAOD (25.43%) had a significant effect on the total AOD values in China, especially in NorthWestern China, since the Taklimakan Desert is the largest desert with vast dusty aerosol emissions in the air. The BCAOD (5.45%) and OCAOD (13.62%) showed certain but not obvious effect on the distribution of the total AOD values throughout China, due to relatively lower aerosol emissions of black carbon aerosols and organic carbon aerosols than that of dust aerosols and SO4 aerosols. The SSAOD (6.03%) only have a weak effect on the coastal areas of China.
Figure 11 indicates the spatial and seasonal variations of AODP for BCAOD, DUAOD, OCAOD, SSAOD, and SO4AOD over mainland China. SO4AOD has always shown a great effect on the total AOD values in each season. The AODP for SO4AOD were generally higher in winter (53.49%) than that in spring (53.41%), summer (40.84%), and autumn (50.37%) due to the strong human activity. DUAOD occupied a large proportion of the total AOD values in NorthWestern China owing to the perennial dusty air conditions there, especially in the summer due to the strong surface convection during the summer. The mean AODP for DUAOD in spring, summer, autumn, and winter were 20.34%, 34.59%, 24.59%, and 22.04%, respectively. The BCAOD, OCAOD, and SSAOD had small contributions to the total AOD values, since the black carbon aerosols, organic carbon aerosols, and sea salt aerosol emissions were generally lower than that of dust aerosols and SO4 aerosols. The mean AODP values in spring for BCAOD, OCAOD, and SSAOD were 6.40%, 14.15%, and 5.69%, respectively; the mean AODP values in summer for BCAOD, OCAOD and SSAOD were 4.59%, 15.69%, and 4.26%, respectively; the mean AODP values in autumn for BCAOD, OCAOD, and SSAOD were 4.90%, 12.65%, and 7.48%, respectively; the mean AODP values in winter for BCAOD, OCAOD, and SSAOD were 5.88%, 11.92%, and 6.65%, respectively.
The AODP for BCAOD, DUAOD, OCAOD, SSAOD, and SO4AOD were closely correlated with the climate features. Figure 12 illustrates the AODP values over mainland China in different climate zones. The SO4AOD showed a great effect on the total AOD values in all humidity zones, especially in the humid zones, because of the severe industrial air pollutants and humid air conditions there. The AODP for SO4AOD in different climates were higher in autumn and winter than that in other seasons because of high anthropogenic SO4 emissions in autumn and winter. The largest AODP for SO4AOD in the humid zones were found in September (67.40%), while the smallest AODP were found in April (47.50%). The largest AODP for SO4AOD in arid zones were found in January (44.10%), while the smallest AODP were found in April (24.30%). The AODP for DUAOD were negatively correlated with the humidity since there are more dust aerosol emissions in arid areas than in other humidity zones. The AODP for DUAOD was higher in summer than in other seasons owing to the strong surface convection in summer there. The largest AODP for DUAOD in humid zones were found in May (20.60%), while the smallest AODP were found in January (8.80%). The largest AODP for DUAOD in arid zones were found in May (66.00%), while the smallest AODP were found in January (39.60%).
Figure 13 illustrates the synergy effect of air temperature and humidity on AODP for different type of aerosols. It was obvious that DUAOD and SO4AOD were the main drivers for the total AOD values in all climate zones with high AODP values. Relatively large AODP values for SO4AOD were mainly found in humid areas with warm temperate, owing to the strong SO4 aerosol emissions caused by dense industry and human intensity there. For example the AODP ranges for SO4AOD in IIIA, IIIB, IVA, VA, and VIA were 49.51–71.83%, 44.29–68.30%, 50.15–70.39%, 47.62–70.28%, and 40.56–69.77%, respectively. Small AODP values for SO4AOD were in arid areas, due to low anthropogenic SO4 aerosol emissions there. The AODP values for DUAOD were generally higher in arid area than that in humid area with warm temperate, because of the dense dust aerosol in the air. For example the AODP for DUAOD in IID and IIID were 49.51–76.66% and 40.75–60.78%, respectively. The OCAOD also had a certain effect on the total AOD values, especially in spring. The SSAOD showed certain but obvious effect on the total AOD values in IIE (14.49–28.36%). It could be concluded that DUAOD and SO4AOD were the main driving factors for the distributions of the total AOD values.

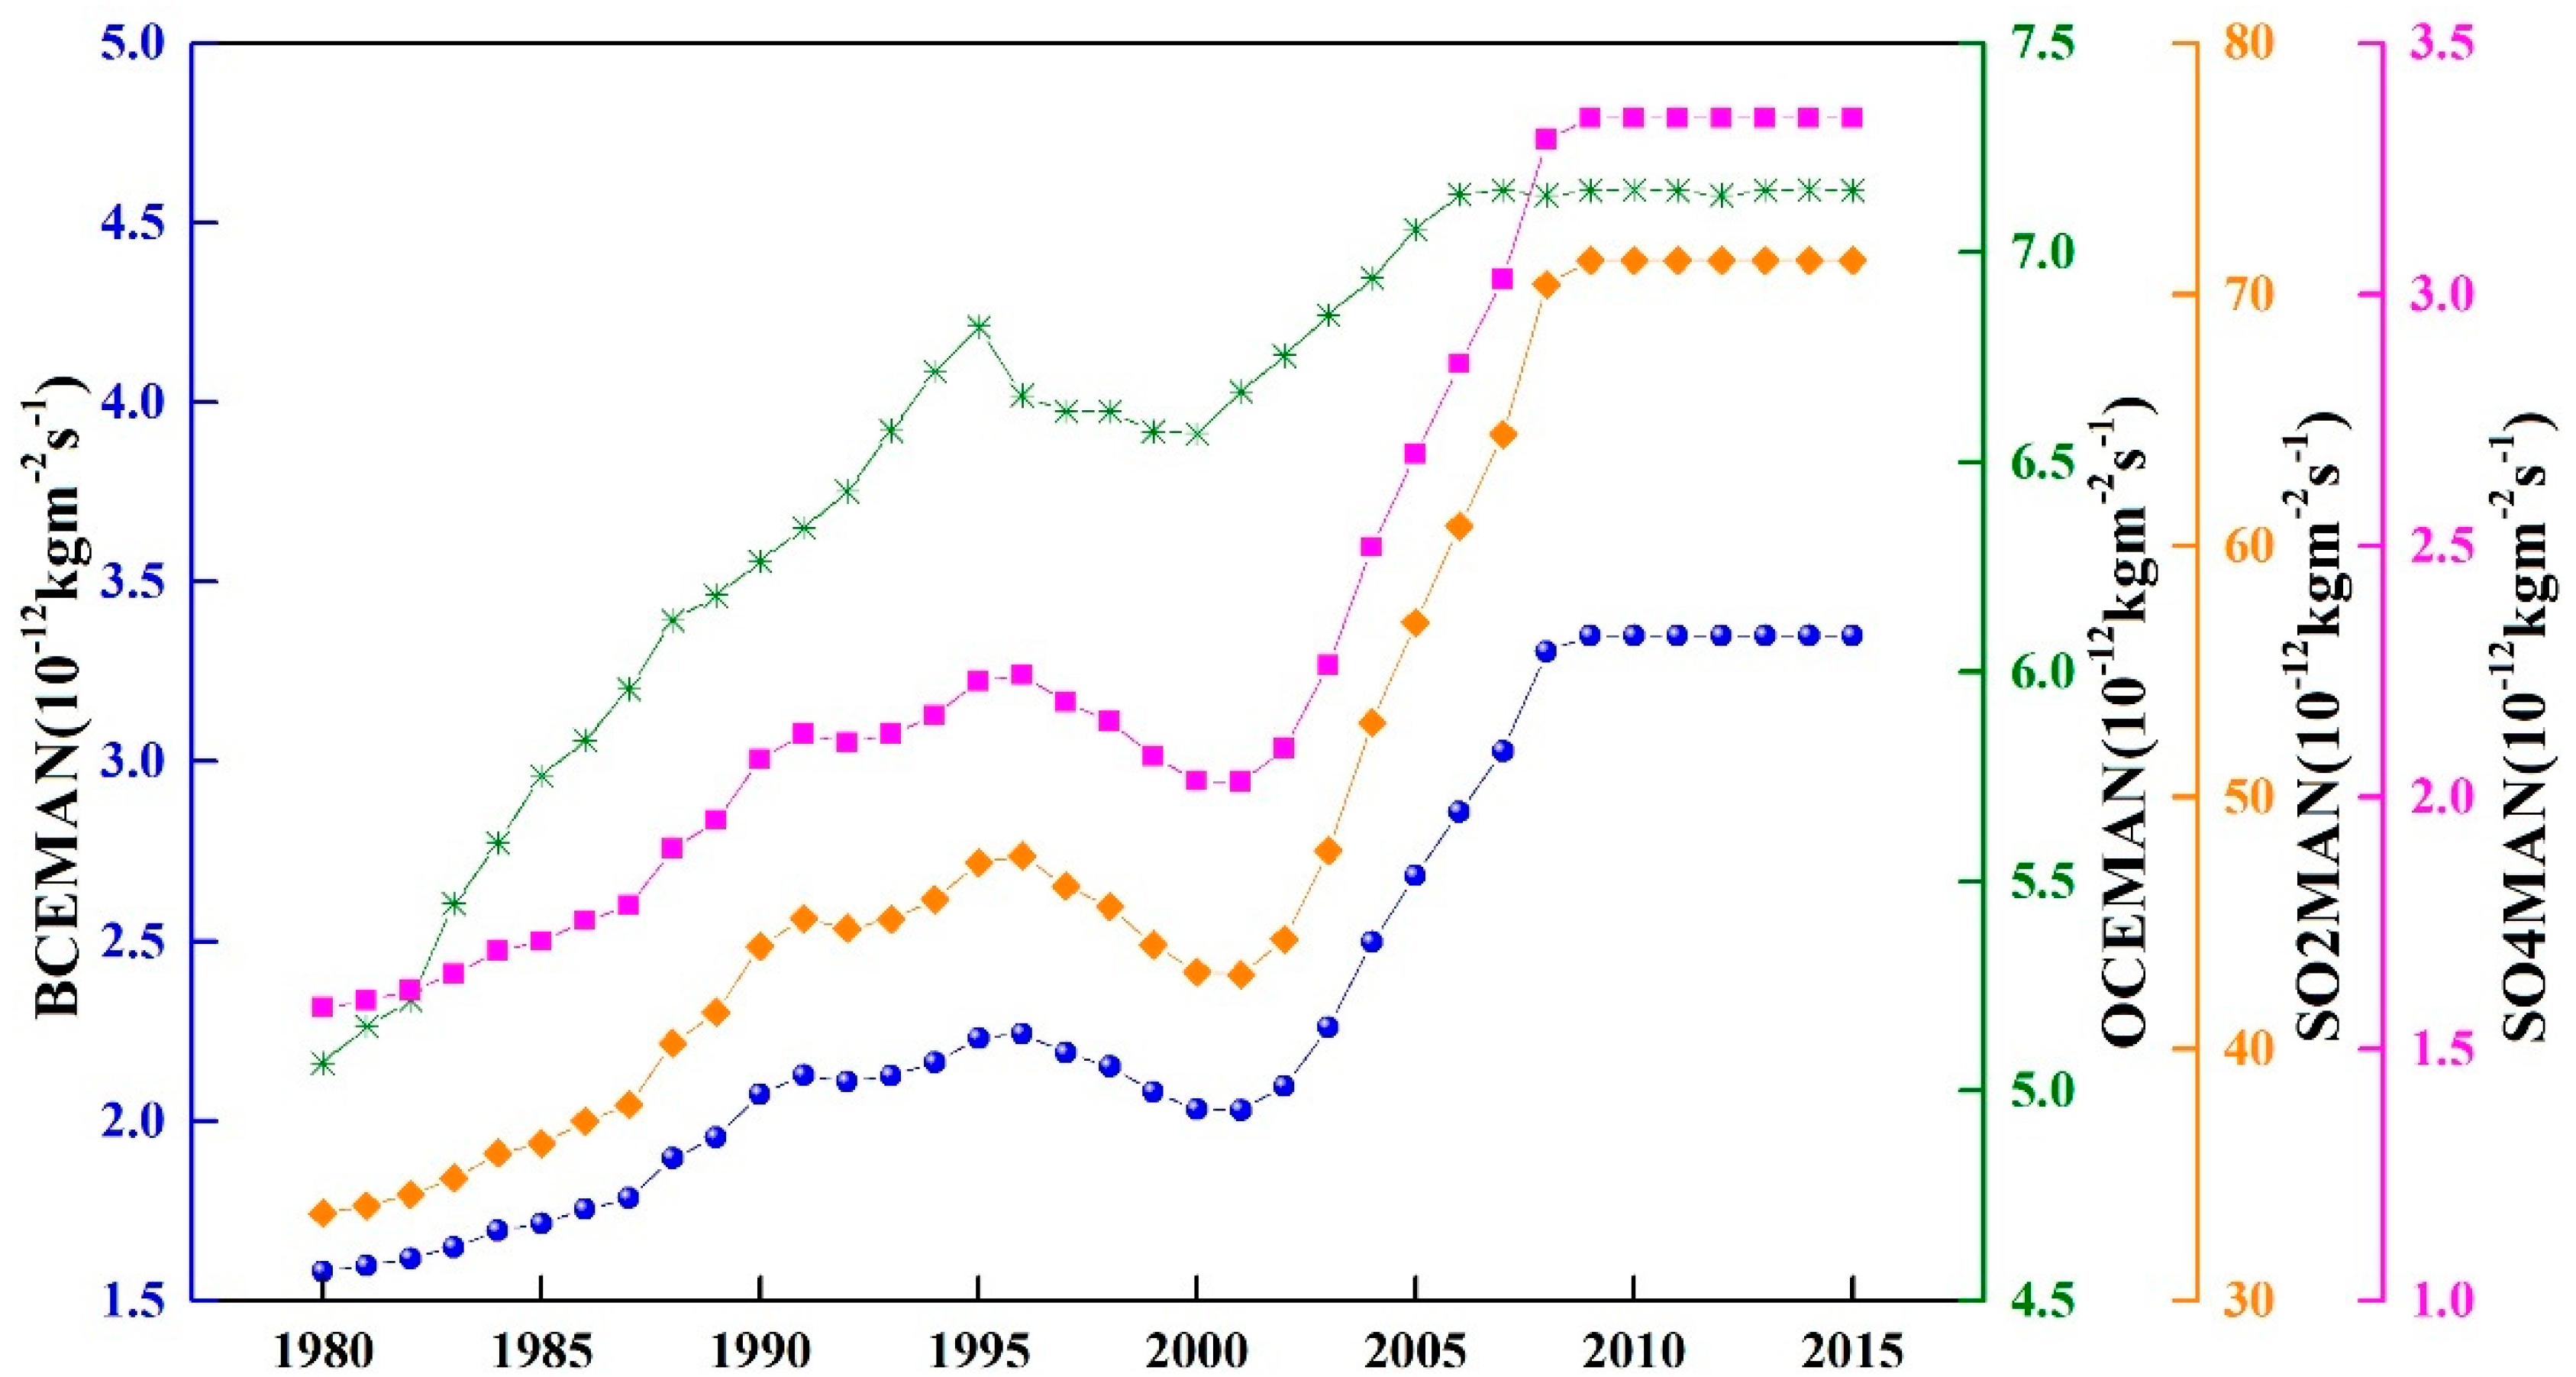
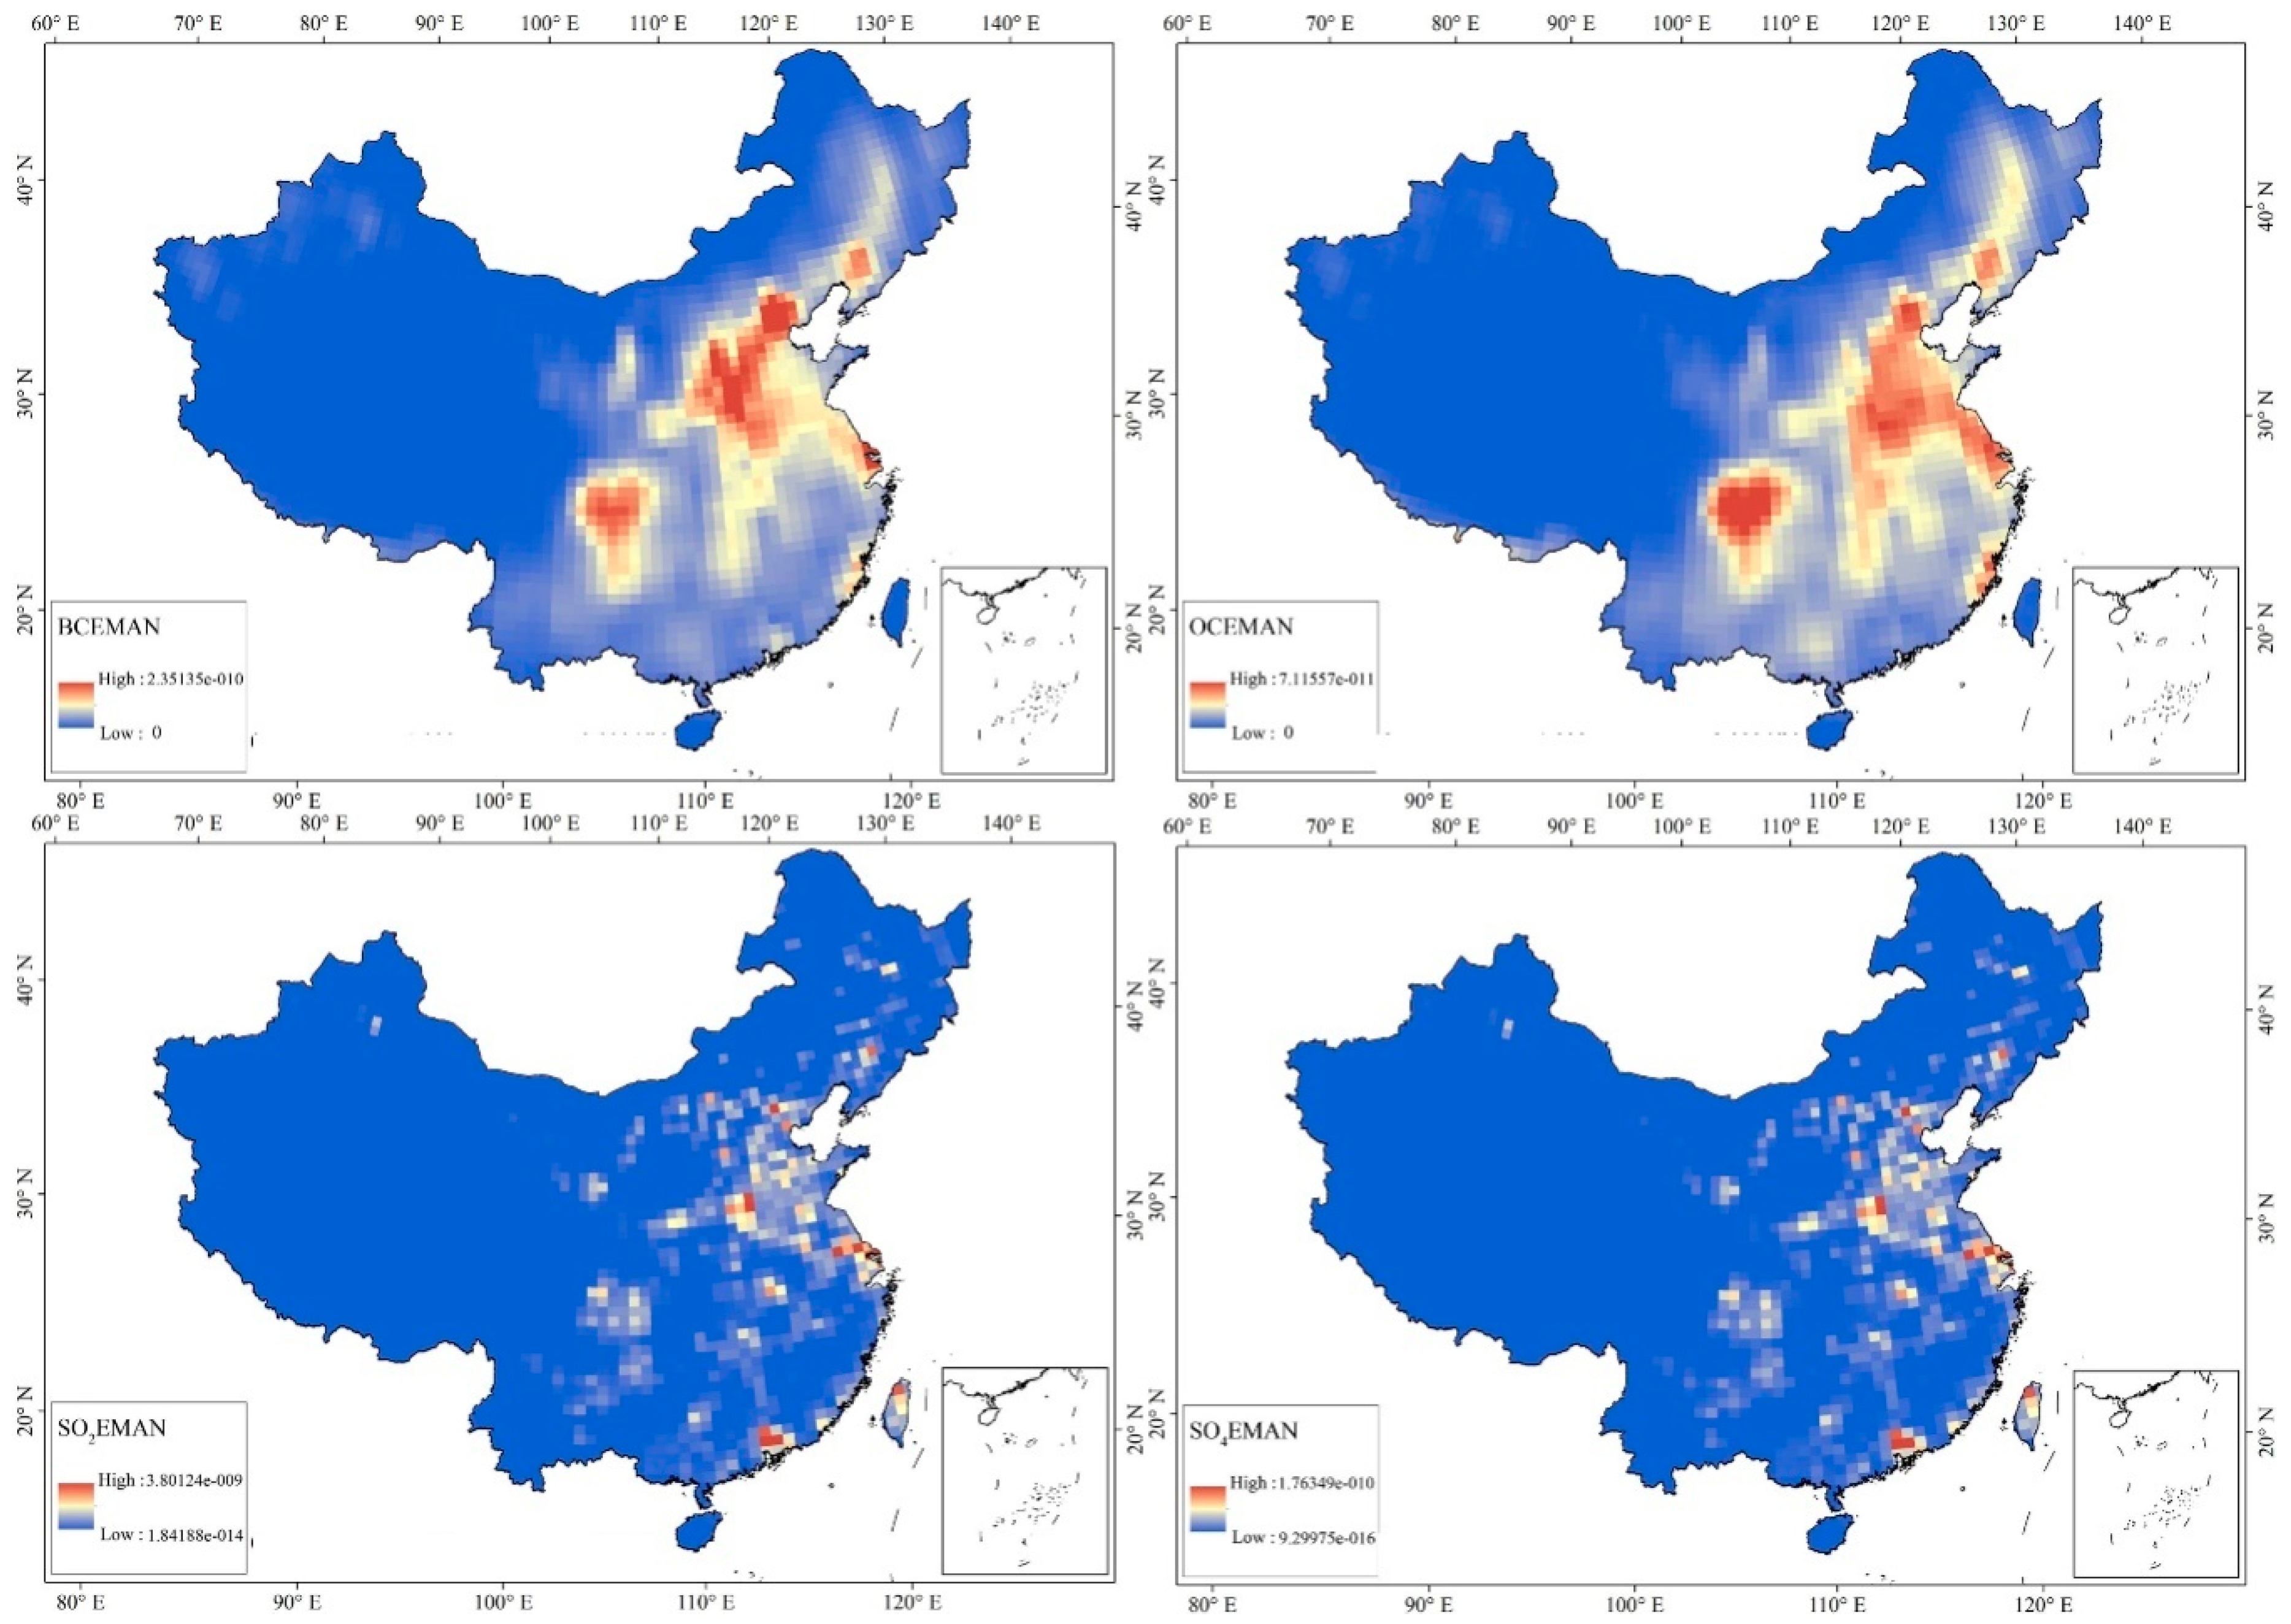
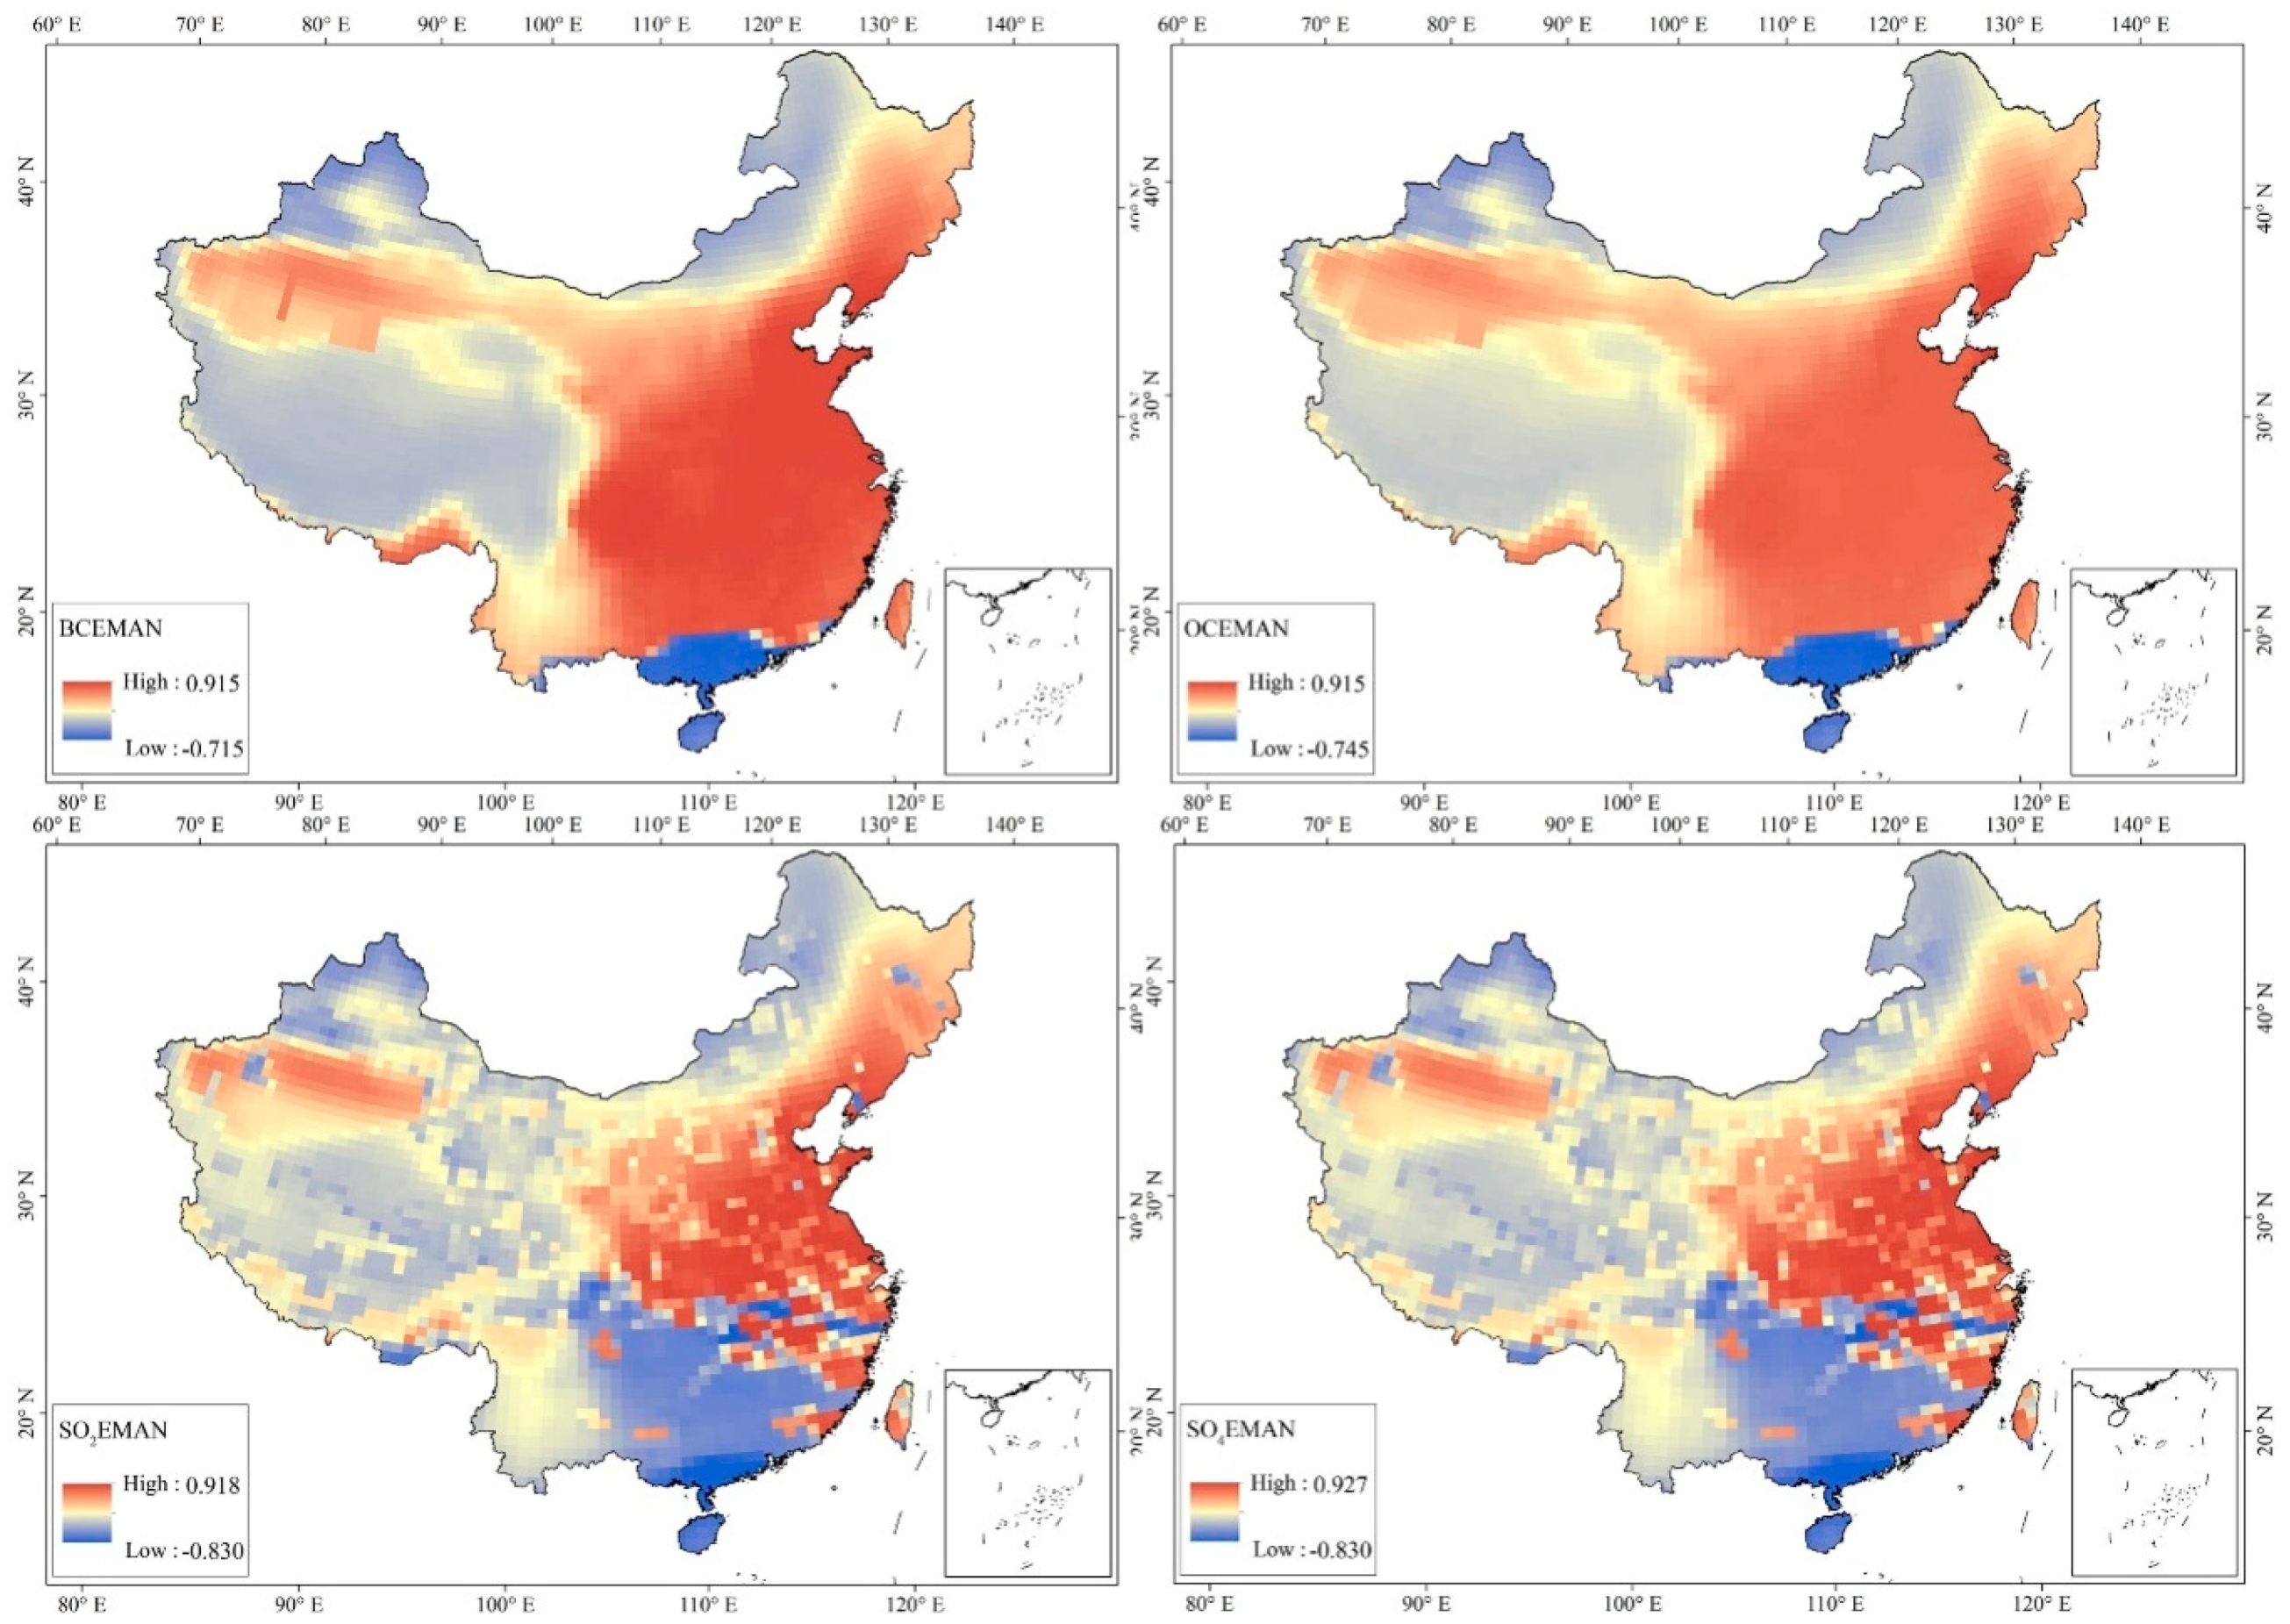
4.2. The Effect of Anthropogenic Aerosol Emissionson AOD

Since the 1980s, anthropogenic aerosols in the atmosphere have dramatically increased over mainland China with the industrial development, which posed great disturbances on the regional climate [51]. The anthropogenic aerosols emitted into the atmosphere mainly include four types of aerosols: black carbon aerosols, organic carbon aerosols, SO2 (sulfur dioxide) aerosols, and SO4 (sulfate) aerosols. This study attempted to reveal the characteristics and effect of the anthropogenic aerosol emissions on AOD, using anthropogenic aerosol emission data derived from MERRA-2 products. Four types of anthropogenic aerosol emissions, including black carbon aerosol (BCEMAN), organic carbon aerosol (OCEMAN), SO2 aerosol (SO2MAN), and SO4 (SO4MAN) aerosol from the MERRA-2 dataset were used in this study.
Figure 14 shows the annual variations of anthropogenic aerosol emissions in China during 1980–2017. The results showed that there was a rapid growing trend of anthropogenic black carbon aerosol (2.135–2.794 × 10⁻¹² kg m−2 s−1), organic carbon aerosol (5.006–6.573 × 10⁻¹² kg m−2 s−1), SO2 aerosol (33.471–44.134 × 10⁻¹² kg m−2 s−1), and SO4 aerosol (1.582–2.082 × 10⁻¹² kg m−2 s−1) in China during 1980–1999, which may be related to the economic development and the growing populations in China during 1980–1999. In 2000–2008, the anthropogenic aerosol emissions in China showed an explosive growing trend because of the rapidly developed industry in China. At that stage, BCEMAN increased from 2.780 × 10⁻¹² kg m−2 s−1 (in 2000) to 3.350 × 10⁻¹² kg m−2 s−1 (in 2008); OCEMAN increased from 6.568 × 10⁻¹² kg m−2 s−1 (in 2000) to 7.135 × 10⁻¹² kg m−2 s−1 (in 2008); the SO2MAN rose from 43.063 × 10⁻¹² kg m−2 s−1 (in 2000) to 70.398 × 10⁻¹² kg m−2 s−1 (in 2008); SO4MAN increased from 2.033 × 10⁻¹² kg m−2 s−1 (in 2000) to 3.306 × 10⁻¹² kg m−2 s−1 (in 2008). After 2008, the Chinese government set up a series of laws and regulations to restrict the emissions of air pollutants. At that stage, the BCEMAN, OCEMAN, SO2MAN, and SO4MAN were maintained at the same level of 2008.
Figure 15 showed the spatial distributions of the anthropogenic aerosol emissions in China during 1980–2017. In China, the economy was relatively more developed in Eastern China that that in Western China. Meanwhile, the burning of fossil fuels and the industrial gas and dust emissions are also larger in Eastern China than that in Western China. The North China Plain was the most densely populated area in China, with high anthropogenic emissions of aerosols. The annual mean BCEMAN, OCEMAN, SO2MAN, and SO4MAN in the North China Plain were 1.168 × 10⁻¹⁰, 4.252 × 10⁻¹¹, 4.035 × 10⁻¹⁰, and 1.872 × 10⁻¹¹ kg m−2 s−1, respectively. The Sichuan Basin was also an area with high anthropogenic aerosol emissions, since the aerosol diffusion is hindered by the basin topographic features. The annual mean BCEMAN, OCEMAN, SO2 MAN, and SO4MANin the Sichuan Basin were 9.241 × 10⁻¹¹, 4.078 × 10⁻¹¹, 2.056 × 10⁻¹⁰, and 9.539 × 10⁻¹² kg m−2 s−1, respectively. In contrast, the NorthWestern China and the Qinghai Tibet Plateau were always areas with low anthropogenic aerosol emissions. For example, the annual mean BCEMAN, OCEMAN, SO2MAN, and SO4MAN were 6.444 × 10⁻¹³, 2.916 × 10⁻¹³, 2.022 × 10⁻¹², and 9.336 × 10⁻¹⁴ kg m−2 s−1, respectively.
Figure 16 illustrates the spatial distributions of the correlation coefficient (R) between the annual mean BCEMAN, OCEMAN, SO2MAN, SO4MAN, and AOD values, respectively. It was clear that the anthropogenic aerosol emissions have great effects on AOD values over mainland China. The highest R for BCEMAN (0.925), OCEMAN (0.915), SO2MAN (0.918), and SO4MAN (0.927) were mainly observed in Eastern China, owing to the higher human intensity and anthropogenic aerosol emissions there than that in Western China. As the most distributed and densely populated areas in Northern China, the North China Plain has always been an area with high anthropogenic aerosol emissions and AOD values. Therefore, there is a significant positive correlation between anthropogenic aerosol emissions and AOD values in the North China Plain. The mean R for BCEMAN, OCEMAN, SO2MAN, and SO4MAN in the North China Plain were 0.863, 0.816, 0.363, and 0.376 respectively. The lower reaches of the Yangtze River is also an area with high R values between anthropogenic aerosol emission and AOD values. For example, the mean R for BCEMAN, OCEMAN, SO2MAN, and SO4MANin the middle and lower reaches of the Yangtze River were 0.854, 0.739, 0.487 and 0.486, respectively. Both the anthropogenic aerosol emissions and AOD values in the Tibetan Plateau were relatively low, thus, the mean R for BCEMAN, OCEMAN, SO2MAN, and SO4MAN were −0.157, −0.073, 0.046, and 0.045 respectively.

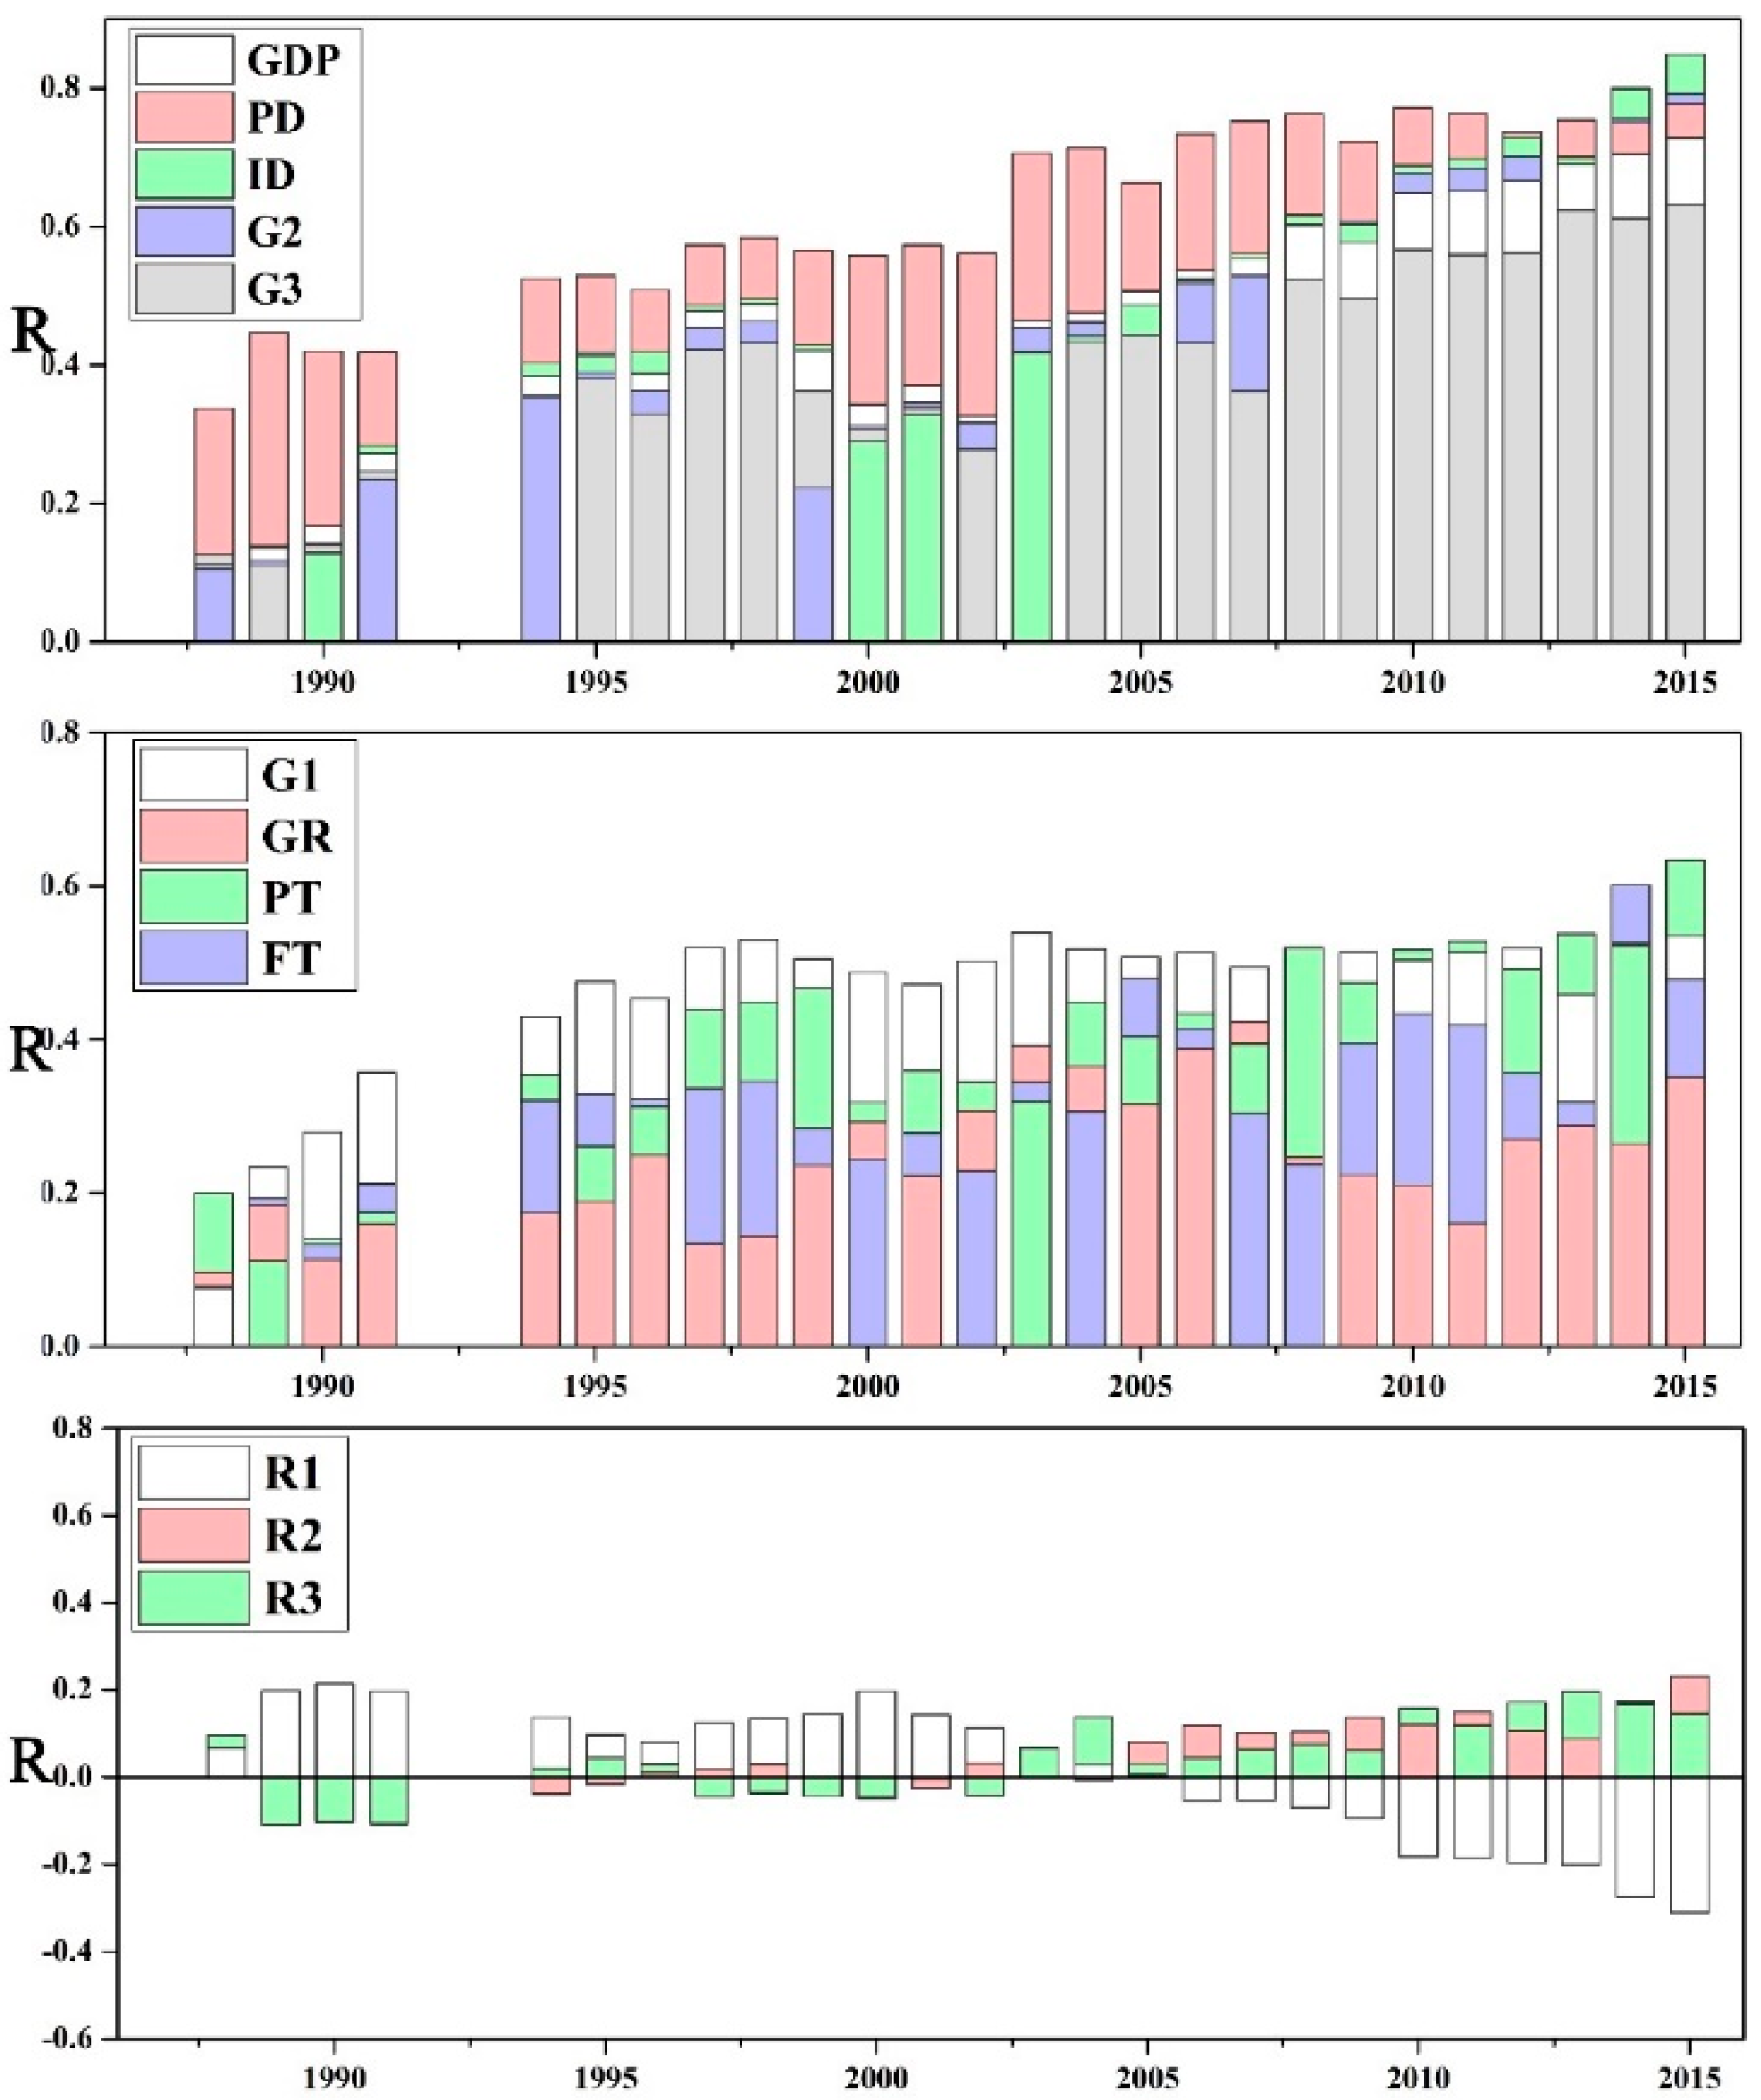
4.3. The Socioeconomic Factors for AOD

Since the 1980s, the aerosol particle concentration in China has increased dramatically with the developing economy and growing population, resulting in significant aerosol radiative forcing effects [28]. The relationship between AOD (average AOD values in each city over mainland China) and various social and economic development indicators such as gross domestic product (GDP), population density (PD), industrial output value (ID), the proportion of the first industry to GDP (R1), the proportion of the second industry to GDP (R2), the proportion of the third industry to GDP (R3), the output value of the first industry (G1), the second industry output value (G2), the third industry output value (G3), the built-up area greening rate and the total passenger volume (PT), and the total freight volume (FT) were analyzed to reveal the socioeconomic effects on AOD over mainland China. It should be stated that the R could be used to reveal the quantitative relationship between AOD and socioeconomic factors, but could not reveal the causality between AOD and socioeconomic factors.
Figure 17 illustrates the temporal variations of the correlation coefficients between AOD and socioeconomic factors. The results show that the correlation coefficients between social economic factors and AOD were not high in the1980s–1990s since China’s economy was still in the initial stage of the “Reform and Opening Up”, and its energy consumption and aerosol emissions were kept at a low level at that stage. In that period of time, the range of R for GDP, PD, ID, R1, R2, R3, G1, G2, G3, GR, PT, and FT were 0.122–0.342, 0.275–0.502, 0.120–0.398, −0.118 to 0.089, 0.024 to 0.265, −0.209 to 0.107, 0.021–0.355, 0.063–0.354, 0.098–0.286, −0.207 to 0.152, −0.027 to 0.201, and 0.017–0.278, respectively. Entering the 21st century, the amount of aerosol emissions increased sharply in China. Therefore, the R between social economic factors and AOD was relatively high at that stage. The range of R for GDP, PD, ID, R1, R2, R3, G1, G2, G3, GR, PT, and FT were 0.232–0.633, 0.535–0.765, 0.271–0.782, −0.409 to −0.053, 0.137–0.306, −0.186 to 0.145, 0.302–0.351, 0.248–0.695, −0.144 to 0.548, −0.141 to 0.369, 0.017–0.412, and −0.053 to 0.561, respectively.
The denser the population is, the higher the emissions of anthropogenic aerosol particles are, and the higher the AOD value is. Therefore, there is a high correlation between PD and AOD, and the R between AOD and PD has maintained a rising trend with the growing population in China in the past decades. The R for PD increased from 0.295 (in 1980) to 0.743 (in 2015). GDP is the main indicator representing the level of economic development. The economic development is in direct proportion to the energy consumption and aerosol emissions. Thus, the GDP was also highly correlated to AOD. The correlation coefficient between GDP and AOD rose from 0.123 (in 1980) to 0.631 (in 2015). Industrial waste gas pollution is the main resource of anthropogenic aerosols in China. Therefore, the correlation coefficient between ID/G2 and AOD were also high. The R for ID rose from 0.164 (in 1980) to 0.783 (in 2015); the R for G2 rose from 0.155 (in 1980) to 0.693 (in 2015). R1, R2, and R3 are the main indicators reflecting the industrial structure, which had a certain, but not obvious, impact on AOD. In recent years, the increasing passenger traffic volume has led to the increase of vehicle emissions, which caused great pollutants to the atmosphere. Therefore, the correlation coefficient between passenger volume and AOD was also large. The correlation coefficient between PT and AOD ranges from 0.052 to 0.582.

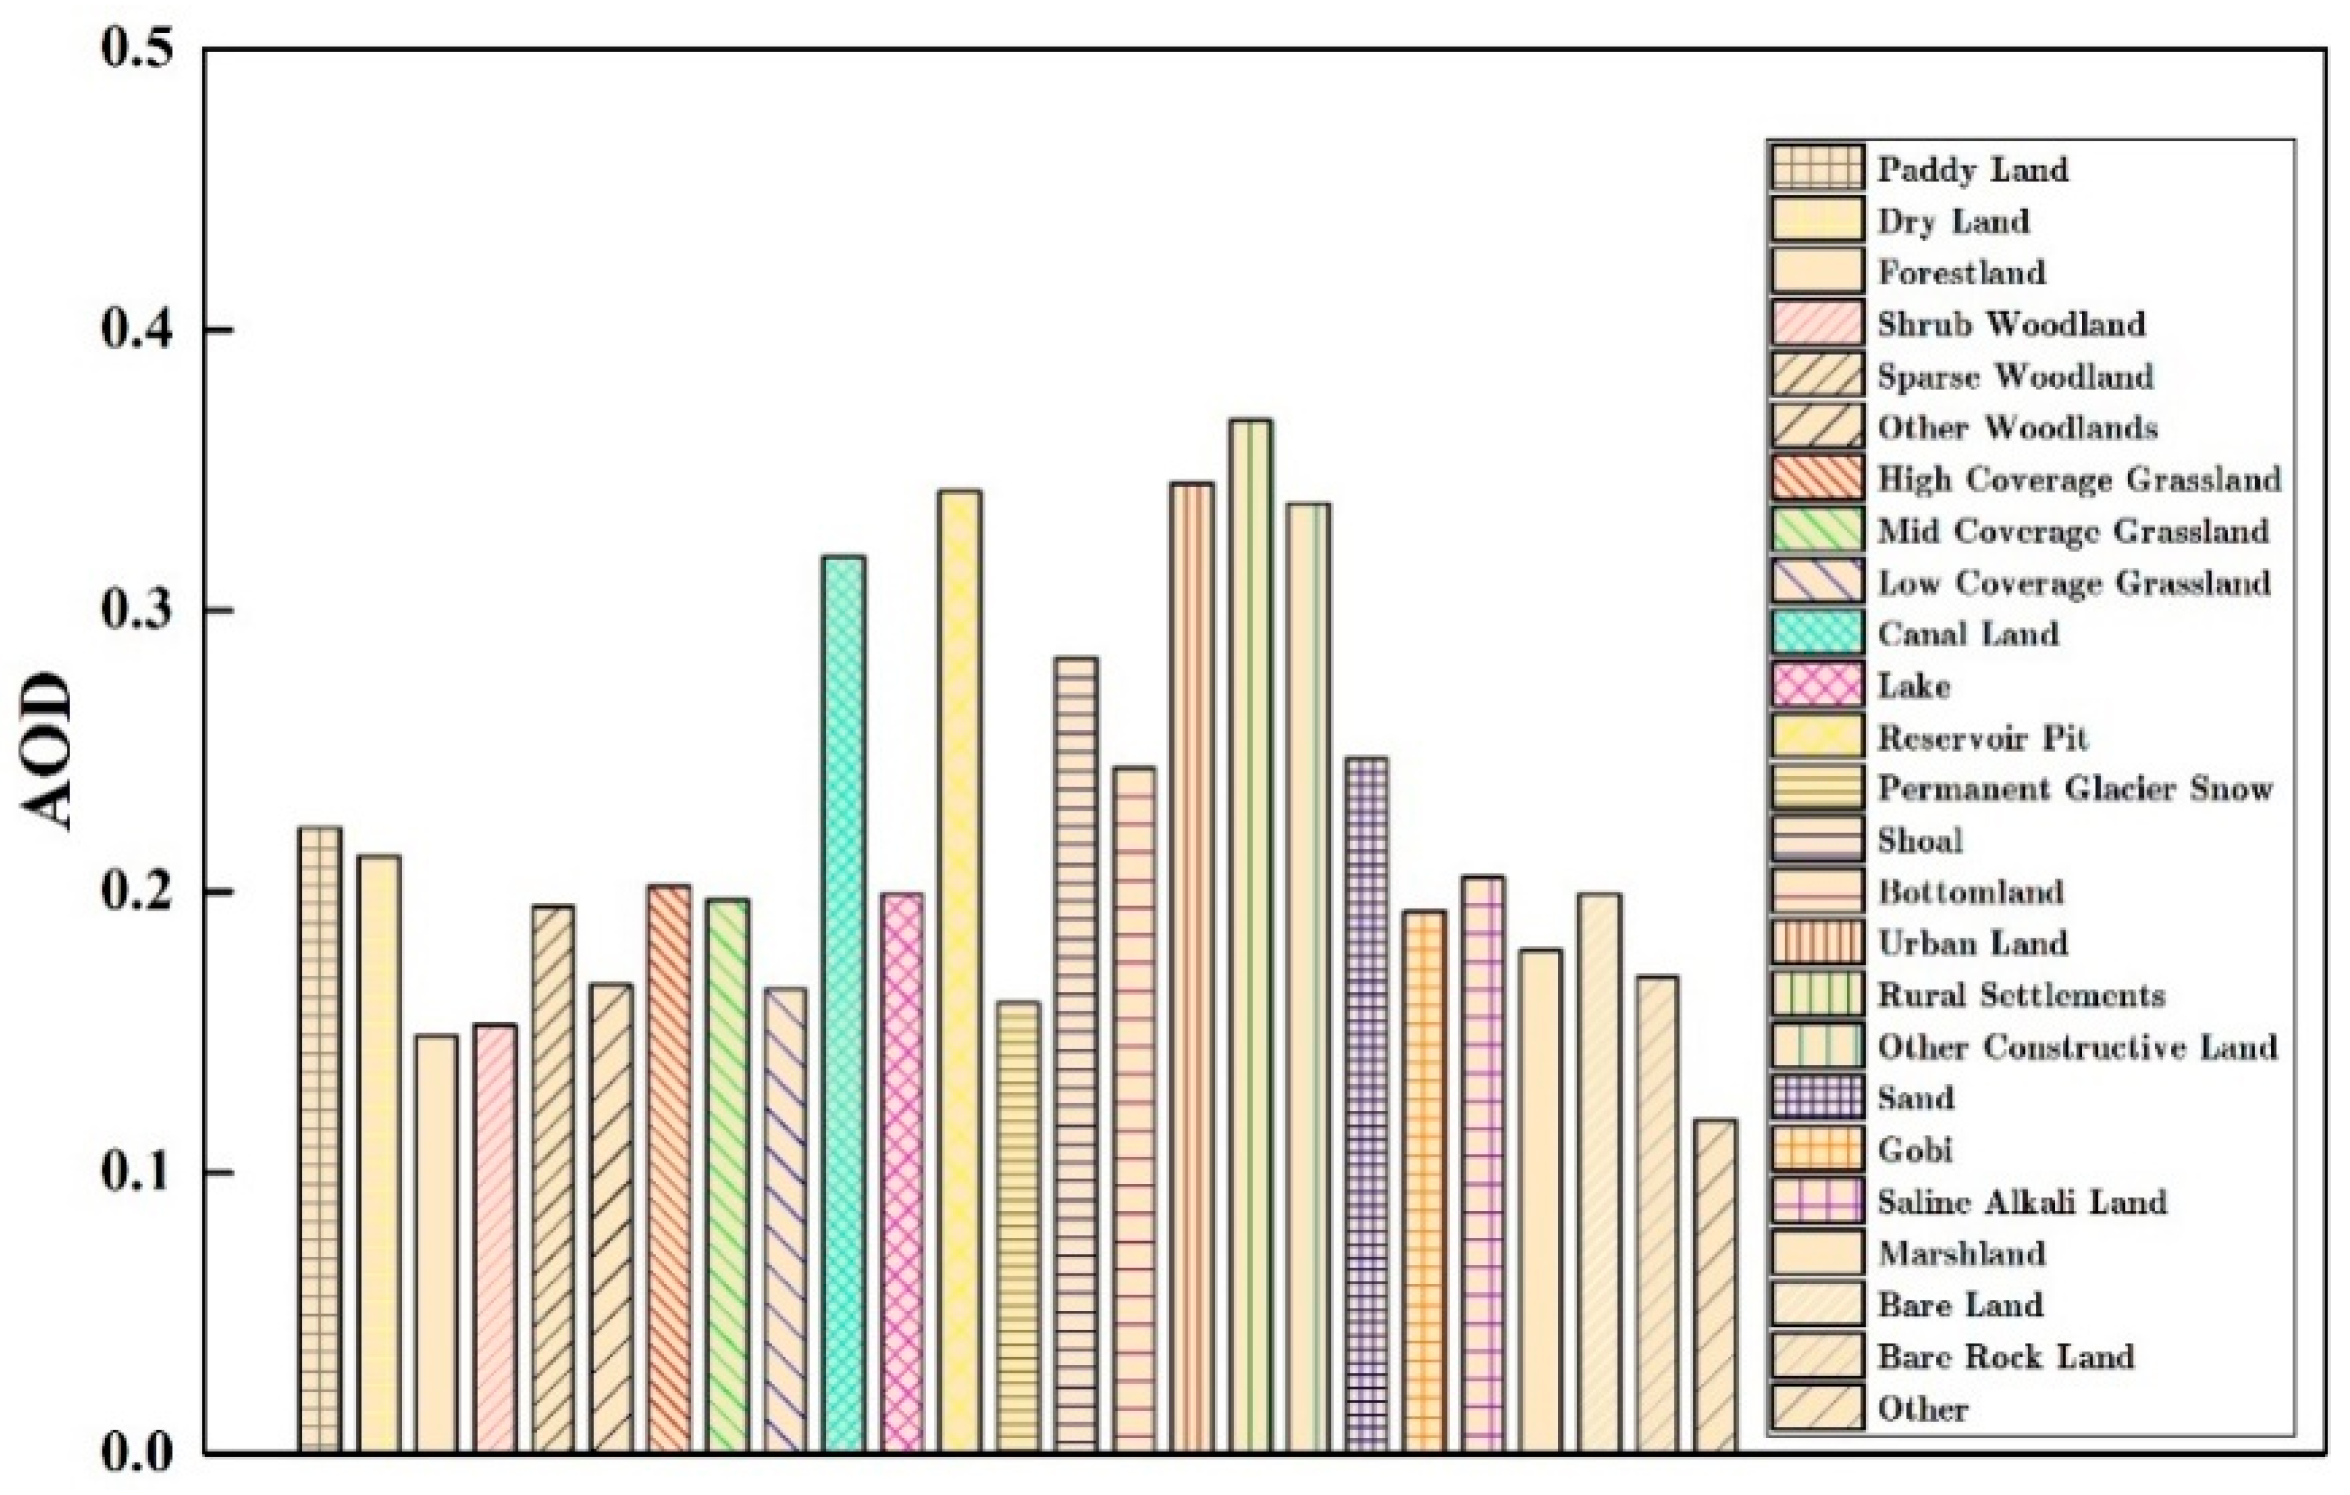
4.4. The Effect of Land-Use and Land-Cover Change on AOD

The land-use and land-cover change (LUCC) could directly or indirectly affect the surface reflectance, atmospheric vapor content, and aerosol particle concentration, which have great influences on aerosol optical properties. The land use data with 1 km × 1 km spatial resolution, provided by the Resources and Environmental Science Data Center of the Chinese Academy of Sciences, were used to analyze the characteristics of LUCC in china during 1980, 1990, 1995, 2000, 2005, 2010, and 2015, and the quantitative effects of LUCC on AOD.
Figure 18 shows the mean aerosol optical depth under different land-use coverage in China. Table A1 (Appendix A) shows the aerosol optical depth under different land use coverage in China during 1980–2017. Urban and rural areas, industrial and mining, and residential land are densely populated with heavy solid waste, domestic waste, and industrial waste; thus, the concentrations of artificial aerosol particles in the air there is higher than that in other areas. Therefore, urban and rural areas, industrial and mining, and residential land have always been areas with high AOD values. For example, the AOD values for urban land, rural settlements, and other constructive land were 0.345, 0.368, and 0.338, respectively, and the range of mean AOD values were 0.234–0.469, 0.244–0.500, and 0.233–0.450, respectively. High water vapor content above the land covered by water is beneficial to the formations and agglomerations of aerosol particles, so the land covered by water is also a land-use coverage area with high AOD values. For example, the annual mean AOD in canal land, lake, reservoir pit, shoal, and bottomland were 0.319, 0.199, 0.160, 0.283, and 0.244, respectively; the AOD under these land-use coverage ranged from 0.219 to 0.430, 0.145 to 0.256, 0.232 to 0.470, 0.148 to 0.394, and 0.180 to 0.315, respectively. The sandy land is also a land-use coverage with high AOD values due to the dense concentrations of dust aerosol in the air there. The annual mean AOD for sandy land is 0.247 with a range of 0.200–0.302.
Table A2 shows the R between the ratio of different land use types to the total land area (LUCCP) and AOD. The urban and rural area, industrial and mining and residential land are areas with strong intensity of human activity and huge anthropogenic aerosol emissions. Therefore, LUCCP is positively correlated with AOD. Among them, the R (0.336–0.436) for LUCCP and AOD is higher than that for other land-use, which is mainly related to the dense populations and strong intensity of human activities. The R for rural settlements (0.149–0.232) and other construction land (0.254–0.352) were also high. The anthropogenic aerosol emissions of forest land is lower than that in other type of land, thus the LUCCP is significantly negatively correlated with AOD values. For example the R for forestland, shrub woodland, sparse woodland, and other woodlands were −0.169 to −0.004, −0.108 to −0.025, −0.279 to −0.202, and −0.241 to −0.124, respectively. The higher the coverage of grassland, the better the air quality, and the lower the concentration of aerosol particles in the air. Therefore, the AOD values were significantly negatively correlated with AOD values. For example, the R for high coverage grassland, middle coverage grassland, and low coverage grassland was −0.418 to −0.281, −0.435 to −0.365 and −0.366 to −0.278, respectively. The permanent glacier area is also an area with low aerosol emissions, thus, the ratio of LUCCP for the permanent glacier area is negatively correlated with the AOD, with an R of −0.213 to −0.150.

5. Conclusions

Using daily MODIS atmosphere products and the MERRA-2 aerosol reanalysis dataset, we analyzed the spatial and temporal characteristics of the aerosol optical depth over mainland China over the past 38 years. Then the temporal trend analysis of the AOD values in different climate zones throughout China were conducted using the Mann-Kendall index and Sen’s Slope index. Finally, the effects of different aerosol resources, anthropogenic aerosol emissions, socioeconomic factors and the land-use and land-cover change (LUCC) on the spatial and temporal variations of AOD in different climate zones and terrains over mainland China were investigated.
The results showed that the MERRA-2 AOD products could provide AOD records with higher spatial and temporal continuity than that of MODIS AOD products. The AOD values fluctuated greatly in the 1980s–1990s over mainland China, due to two giant volcano eruptions, including the ALCH Joan volcanic eruption (1982) and the Pinatubo volcanic eruption (1992). The highest annual mean AOD during1980–2017 was observed to be 0.342 in 1992. After 1992, the annual mean AOD values gradually decreased. The annual mean AOD values during 1993–2000 were under 0.250. In the beginning of the 21st century, AOD values gradually increased because of the increasing anthropogenic aerosol emissions in China in that period of time. The annual mean AOD values had increased from 0.232 (in 2001) to 0.288 (in 2007). Since 2008, the anthropogenic aerosol emissions were reduced due to stricter environmental protection policies for reducing carbon and aerosol emissions have been formulated and implemented in China. Thus, the annual mean AOD values in China gradually decreased. The range of the annual mean AOD values during 2008–2017 was 0.257–0.297. The AOD values were generally higher in spring than that in other seasons. The largest monthly mean AOD value (0.323) during 1980–2017 was found in April, while the smallest monthly mean AOD value (0.187) during 1980–2017 was found in December. Relatively larger AOD values were mainly observed in the Sichuan Basin, while smaller AOD values were mainly in the Qinghai Tibet Plateau. The Tarim and Turpan Basin was also an area with high AOD values, owing to the dusty air conditions there. In terms of the AOD trends, the AOD values in Southeastern China showed a significant (high MK values) increasing trend (high Sen Slope values). By contrast, the AOD values in the Altai Mountains, Greater Khingan Range, and the northeast of Inner Mongolia showed a significant decreasing trend (negative Sen Slope values).
The contributions of DUAOD, BCAOD, OCAOD, SSAOD, and SO4AOD to DUAOD, BCAOD, OCAOD, SSAOD, and SO4AOD to AOD T o t a l were calculated using Equations (11) and (12). The result showed that DUAOD and SO4AOD were the main driving factors for the distributions of the total AOD values in different climate zones over mainland China with high contributions. The annual mean AODP for BCAOD, DUAOD, OCAOD, SSAOD, and SO4AOD were 5.45%, 25.43%, 13.62%, 6.03%, and 49.51%, respectively. Then, the effects of the anthropogenic aerosol emissions and socioeconomic factors on the spatial and temporal variations of AOD values throughout China were analyzed using the MERRA-2 dataset and economic statistics. The anthropogenic aerosol emissions showed great effects on AOD values, especially in Eastern China. The highest R values for BCEMAN (0.925), OCEMAN (0.915), SO2MAN (0.918), and SO4MAN (0.927) were mainly observed in Eastern China. The GDP, population density, and passenger traffic volume were found to be the main socioeconomic factors for AOD distributions. Finally, the correlation between AOD values and land-use and land-cover change (LUCC) were analyzed. The result showed that relatively higher AOD values were mainly observed in urban and rural areas, industrial and mining, and residential areas. For example, the annual mean AOD values for urban land, rural settlements, and other constructive land were 0.345, 0.368, and 0.338, respectively. The R (0.336–0.436) for the ratio of urban land to total land area and AOD was higher than that for other land-use coverage, which is mainly related to the dense populations and strong intensity of human activities there. The land covered by water and sandy land were also areas with high AOD values. For example, the higher the coverage of grassland, the better the air quality and the lower the concentration of aerosol particles in the air. Therefore, the AOD values for grassland were negatively correlated with AOD values. For example, the R for high coverage grassland, middle coverage grassland, and low coverage grassland was −0.418 to −0.281, −0.435 to −0.365, and −0.366 to −0.278, respectively.
Certainly, the accuracy and spatial resolutions of AOD values derived from the MERRA-2 products should be improved to reveal the spatial and temporal variations of AOD values in more precise spatial and temporal scales over mainland China. An improved aerosol algorithm should be developed for the estimation of the total AOD, BCAOD, DUAOD, OCAOD, SSAOD, and SO4AOD values. More AOD products with high accuracy and high spatial resolutions, such as TOMS, MODIS, and MISR AOD products, could be compared to reveal the spatial and temporal variations of AOD in China in further studies. Meanwhile, the driving mechanisms of the effects of the anthropogenic aerosol emissions, socioeconomic factors, and land-use should be further investigated using system dynamics.

Author Contributions

L.W., W.Q., and A.L. designed the research. W.Q. and Y.L. performed the experiments and analyzed the data. H.C. provided parts of the CARSNET observations, W.Q. and Y.L. wrote the manuscript. L.W., X.X., M.B., and M.Z. revised the manuscript.

Funding

This work was financially supported by the National Natural Science Foundation of China (No. 41601044), the Special Fund for Basic Scientific Research of Central Colleges, China University of Geosciences, Wuhan (No. CUG15063, CUGL170401 and CUFCJ1704), and the Opening Foundation of Key Laboratory of Middle Atmosphere and Global Environment Observation (LAGEO), Institute of Atmospheric Physics, Chinese Academy of Sciences.

Conflicts of Interest

The authors declare no conflicts of interest.

Appendix A

Table A1. The annual mean AOD in different land-use coverage during 1980–2015.
Land-Use Type1980199019952000200520102015
Paddy Land0.1070.1580.1640.1990.3140.3520.291
Dry Land0.1060.1590.1560.2060.2760.3280.286
Forestland0.0710.1030.1020.1400.2060.2360.211
Shrub Woodland0.0610.1060.1060.1380.2130.2600.211
Sparse Woodland0.0870.1360.1400.1740.2760.3160.260
Other Woodlands0.0740.1020.1300.1520.2420.2650.231
High Coverage Grassland0.1520.1740.1820.2120.2240.2540.243
Mid Coverage Grassland0.1450.1690.1880.2090.2200.2470.229
Low Coverage Grassland0.1330.1490.1400.1850.1820.2050.190
Canal Land0.2190.2630.2660.3070.3900.4300.387
Lake0.1450.1680.1740.2080.2340.2560.236
Reservoir Pit0.2320.2770.2830.3200.4330.4700.410
Permanent Glacier Snow0.1240.1400.1390.1790.1780.1980.192
Shoal0.2210.2540.1480.2780.3670.3940.349
Bottomland0.1800.2090.2200.2450.2760.3150.291
Urban Land0.2340.2790.2830.3330.4240.4690.423
Rural Settlements0.2440.2990.2980.3580.4480.5000.456
Other Constructive Land0.2330.2800.2830.3300.4200.4500.400
Sand0.2000.2190.2490.2620.2530.3020.275
Gobi0.1680.1800.1900.2100.1980.2290.202
Saline Alkali Land0.1730.1820.1990.2190.2120.2500.228
Marshland0.1640.1720.1530.1910.1780.2110.211
Bare Land0.1740.1900.1840.2160.2060.2380.214
Bare Rock Land0.1370.1470.1580.1880.1830.2080.194
Other0.0990.1090.0940.1420.1350.1470.132
Table A2. The correlation coefficients between the annual mean AOD and proportions of land-use area to the total land area during 1980–2015.
Land-Use Type1980199019952000200520102015
Paddy Land0.0370.0360.0410.0230.077 **0.101 **0.142 **
Dry Land0.111 **0.107 **0.121 **0.109 **0.138 **0.149 **0.163 **
Forestland−0.004−0.062 **−0.071 **−0.126 **−0.169 **−0.152 **−0.110 **
Shrub Woodland−0.101 **−0.047 *−0.025−0.059 **−0.041 *−0.062 **−0.108 **
Sparse Woodland−0.205 **−0.260 **−0.225 **−0.279 **−0.270 **−0.246 **−0.202 **
Other Woodlands−0.155 **−0.155 **−0.124 **−0.146 **−0.213 **−0.241 **−0.216 **
High Coverage Grassland−0.418 **−0.392 **−0.281 **−0.380 **−0.360 **−0.364 **−0.380 **
Mid Coverage Grassland−0.365 **−0.388 **−0.386 **−0.388 **−0.393 **−0.404 **−0.435 **
Low Coverage Grassland−0.278 **−0.321 **−0.333 **−0.332 **−0.346 **−0.352 **−0.366 **
Canal Land0.178 **0.200 **0.178 **0.216 **0.210 **0.213 **0.227 **
Lake0.058 **0.062 **0.056 *0.080 **0.080 **0.079 **0.100 **
Reservoir Pit0.227 **0.250 **0.223 **0.262 **0.291 **0.296 **0.299 **
Permanent Glacier Snow−0.213 **−0.159 **−0.164 **−0.157 **−0.150 **−0.152 **−0.155 **
Shoal0.092 **0.089 **0.096 **0.088 **0.125 **0.125 **0.106 **
Bottomland0.017−0.02−0.024−0.014−0.054 **−0.0150.012
Urban Land0.336 **0.379 **0.375 **0.421 **0.434 **0.425 **0.436 **
Rural Settlements0.218 **0.192 **0.162 **0.149 **0.153 **0.184 **0.232 **
Other Constructive Land0.254 **0.283 **0.289 **0.331 **0.352 **0.347 **0.329 **
Sand−0.095 **−0.129 **−0.124 **−0.139 **−0.158 **−0.150 **−0.152 **
Gobi−0.121 **−0.135 **−0.151 **−0.150 **−0.158 **−0.161 **−0.163 **
Saline Alkali Land−0.080 **−0.123 **−0.110 **−0.146 **−0.158 **−0.155 **−0.144 **
Marshland−0.065 **−0.101 **−0.125 **−0.118 **−0.155 **−0.142 **−0.114 **
Bare Land−0.091 **−0.089 **−0.108 **−0.109 **−0.118 **−0.120 **−0.126 **
Bare Rock Land−0.298 **−0.292 **−0.294 **−0.287 **−0.278 **−0.280 **−0.289 **
Other−0.107 **−0.116 **−0.075 **−0.116 **−0.119 **−0.123 **−0.129 **
* means R is significant at 0.005 confidence level; ** means R is significant at 0.001 confidence level.
Figure A1. The topographic zones over mainland China (IA1 for the Greater Khingan Range; IIA2 for the mountainous area in the eastern part of Northeast China; IIB3 for the foothills of the piedmont of SanheMountain; IIA3 for the piedmont plain in the eastern part of Northeast China; IIA1 for the SanjiangPlain; IIB2 for south of the Greater Khingan Range; IIB1 for the Central Songliao Plain; IIC3 for the Eastern Inner Mongolia high plain; IID4 for the Altai Mountains and the Tacheng Basin; IID3 for the Junggar Basin; IIC3 for the Eastern Inner Mongolia high plain; IIC2 for south of the Greater Khingan Range; IIC1 for the Southwestern Songliao Plain; IID5 for Ili Basin; IID1 for the Inner Mongolia High Plain; IIID1 for Tarim and Turpan Basins; IID2 for the Alashan and Hexi Corridor; HIID2 for the north wing of the Kunlun Mountains; IIIB3 for the mountains and hills in Northern China; IIIA1 for the hills in Jiaodong and Liaodong; IIIB2 for the North China Plain; HID1 for the Alpine Plateau in Kunlun; HIID1 for the Qaidam Basin; IIIC1 for the Jinzhong-Shaanxi-Gandong Plateau; HIIC1 for the Qilian Mountain Area; IIIA1 for the hills in Jiaodong and Liaodong; IIIB1 for the Shandong hilly area; IIIB4 for the Shanxi-Guanzhong Basin; HIID3 for Alishan Mountain; HIC1 for the Southern Qinghai Plateau Gully; HIC2 for the Qiangtang Plateau Lake Basin; IVA1 for Huainan and the middle and lower reaches of the Yangtze River; HIB1 for the GologNagquHilly Plateau; IVA2 for the Hanzhoung Basin; HIIAB1 for the deep alpine valley in Tibet, Sichuan Province; VA4 for the Sichuan Basin; VA2 for theJiangnan and Nanling Mountains; VA3 for the Guizhou Plateau; VA1 for the Chiang-nan Hilly Region; VA5 for the Yunnan Plateau; VA6 for the Southeast Himalayas;VIA2 for the Fujian and Guangdong Guangxi Hilly Plain;VIA1 for the mountains and plains in North-Central Taiwan; VIIA1 for the lowlands in Southern Taiwan; VIIA3 for the Hilly Valley in Southern Yunnan; VIIA2 for the hilly area in Qiong Lei; VIIIA1 for theQiong Lei Lowlands and Dongsha-Xisha-Nansha;and HIIC2 for the Zangnan mountain area).
Remotesensing 10 01064 g0a1

References

  1. Bellouin, N.; Boucher, O.; Haywood, J.; Reddy, M.S. Global estimate of aerosol direct radiative forcing from satellite measurements. Nature 2005, 438, 1138–1141. [Google Scholar] [CrossRef] [PubMed]
  2. Kirkevag, A.; Iversen, T. Global direct radiative forcing by process-parameterized aerosol optical properties. J. Geophys. Res.-Atmos. 2002, 107. [Google Scholar] [CrossRef] [Green Version]
  3. He, L.J.; Wang, L.C.; Lin, A.W.; Zhang, M.; Bilal, M.; Wei, J. Performance of the NPP-VIIRS and Aqua-MODIS aerosol optical depth products over the yangtze river basin. Remote Sens. 2018, 10, 117. [Google Scholar] [CrossRef]
  4. Zhang, W.H.; Xu, H.; Zheng, F.J. Aerosol optical depth retrieval over East Asia using Himawari-8/AHI data. Remote Sens. 2018, 10, 137. [Google Scholar] [CrossRef]
  5. Ma, X.; Yu, F.; Luo, G. Aerosol direct radiative forcing based on GEOS-Chem-APM and uncertainties. Atmos. Chem. Phys. 2012, 12, 5563–5581. [Google Scholar] [CrossRef] [Green Version]
  6. Hauser, A.; Oesch, D.; Foppa, N. Aerosol optical depth over land: Comparing AERONET, AVHRR and MODIS. Geophys. Res. Lett. 2005, 32. [Google Scholar] [CrossRef] [Green Version]
  7. Soni, K.; Parmar, K.S.; Kapoor, S.; Kumar, N. Statistical variability comparison in MODIS and AERONET derived aerosol optical depth over Indo-Gangetic Plains using time series modeling. Sci. Total Environ. 2016, 553, 258–265. [Google Scholar] [CrossRef] [PubMed]
  8. He, L.; Wang, L.; Lin, A.; Zhang, M.; Bilal, M.; Tao, M. Aerosol Optical Properties and Associated Direct Radiative Forcing over the Yangtze River Basin during 2001–2015. Remote Sens. 2017, 9, 746. [Google Scholar] [CrossRef]
  9. Che, H.Z.; Qi, B.; Zhao, H.J.; Xia, X.G.; Eck, T.F.; Goloub, P.; Dubovik, O.; Estelles, V.; Cuevas-Agullo, E.; Blarel, L.; et al. Aerosol optical properties and direct radiative forcing based on measurements from the China Aerosol Remote Sensing Network (CARSNET) in eastern China. Atmos. Chem. Phys. 2018, 18, 405–425. [Google Scholar] [CrossRef] [Green Version]
  10. Liu, X.Y.; Chen, Q.L.; Che, H.Z.; Zhang, R.J.; Gui, K.; Zhang, H.; Zhao, T.L. Spatial distribution and temporal variation of aerosol optical depth in the Sichuan basin, China, the recent ten years. Atmos. Environ. 2016, 147, 434–445. [Google Scholar] [CrossRef]
  11. Xie, Y.; Zhang, Y.; Xiong, X.X.; Qu, J.J.; Che, H.Z. Validation of MODIS aerosol optical depth product over China using CARSNET measurements. Atmos. Environ. 2011, 45, 5970–5978. [Google Scholar] [CrossRef]
  12. Torres, O.; Bhartia, P.K.; Herman, J.R.; Sinyuk, A.; Ginoux, P.; Holben, B. A Long-Term record of aerosol optical depth from TOMS observations and comparison to AERONET measurements. J. Atmos. Sci. 2002, 59, 398–413. [Google Scholar] [CrossRef]
  13. Esposito, F.; Pavese, G.; Serio, C. A preliminary study on the correlation between TOMS aerosol index and ground-based measured aerosol optical depth. Atmos. Environ. 2001, 35, 5093–5098. [Google Scholar] [CrossRef]
  14. Blackmore, T.; O’Carroll, A.; Fennig, K.; Saunders, R. Correction of AVHRR Pathfinder SST data for volcanic aerosol effects using ATSR SSTs and TOMS aerosol optical depth. Remote Sens. Environ. 2012, 116, 107–117. [Google Scholar] [CrossRef]
  15. Che, Y.; Xue, Y.; Mei, L.; Guang, J.; She, L.; Guo, J.; Hu, Y.; Xu, H.; He, X.; Di, A. Intercomparison of three AATSR Level 2 (L2) AOD products over China. Atmos. Chem. Phys. 2016, 16, 9655–9674. [Google Scholar] [CrossRef]
  16. Grey, W.; North, P.; Los, S.O.; Mitchell, R.M. Aerosol optical depth and land surface reflectance from Multiangle AATSR measurements: Global validation and intersensor comparisons. IEEE Trans. Geosci. Remote Sens. 2006, 44, 2184–2197. [Google Scholar] [CrossRef]
  17. Bevan, S.L.; North, P.; Los, S.O.; Grey, W. A global data set of atmospheric aerosol optical depth and surface reflectance from AATSR. Remote Sens. Environ. 2012, 116, 199–210. [Google Scholar] [CrossRef]
  18. Sayer, A.M.; Hsu, N.C.; Bettenhausen, C.; Jeong, M.J.; Holben, B.N.; Zhang, J. Global and regional evaluation of over-land spectral aerosol optical depth retrievals from SeaWiFS. Atmos. Meas. Tech. 2012, 5, 1761–1778. [Google Scholar] [CrossRef] [Green Version]
  19. Hsu, N.C.; Gautam, R.; Sayer, A.M.; Bettenhausen, C.; Li, C.; Jeong, M.J.; Tsay, S.C.; Holben, B.N. Global and regional trends of aerosol optical depth over land and ocean using SeaWiFS measurements from 1997 to 2010. Atmos. Chem. Phys. 2012, 12, 8037–8053. [Google Scholar] [CrossRef] [Green Version]
  20. Melin, F.; Zibordi, G.; Djavidnia, S. Development and validation of a technique for merging satellite derived aerosol optical depth from SeaWiFS and MODIS. Remote Sens. Environ. 2007, 108, 436–450. [Google Scholar] [CrossRef]
  21. Hauser, A.; Oesch, D.; Foppa, N.; Wunderle, S. NOAA AVHRR derived aerosol optical depth over land. J. Geophys. Res. Atmos. 2005, 110. [Google Scholar] [CrossRef] [Green Version]
  22. Li, Y.; Xue, Y.; de Leeuw, G.; Li, C.; Yang, L.; Hou, T.; Marir, F. Retrieval of aerosol optical depth and surface reflectance over land from NOAA AVHRR data. Remote. Sens. Environ. 2013, 133, 1–20. [Google Scholar] [CrossRef]
  23. Gao, L.; Li, J.; Chen, L.; Zhang, L.Y.; Heidinger, A.K. Retrieval and validation of atmospheric aerosol optical depth from AVHRR over china. IEEE Trans. Geosci. Remote Sens. 2016, 54, 6280–6291. [Google Scholar] [CrossRef]
  24. Liu, G.R.; Lin, T.H.; Kuo, T.H. Estimation of aerosol optical depth by applying the optimal distance number to NOAA AVHRR data. Remote Sens. Environ. 2002, 81, 247–252. [Google Scholar] [CrossRef]
  25. Nichol, J.E.; Bilal, M. Validation of MODIS 3 km Resolution Aerosol Optical Depth Retrievals over Asia. Remote Sens. 2016, 8, 328. [Google Scholar] [CrossRef]
  26. Ma, Y.; Li, Z.Q.; Li, Z.Z.; Xie, Y.S.; Fu, Q.Y.; Li, D.H.; Zhang, Y.; Xu, H.; Li, K.T. Validation of MODIS aerosol optical depth retrieval over mountains in central China based on a Sun-Sky radiometer site of SONET. Remote Sens. 2016, 8, 111. [Google Scholar] [CrossRef]
  27. He, Q.S.; Li, C.C.; Tang, X.; Li, H.L.; Geng, F.H.; Wu, Y.L. Validation of MODIS derived aerosol optical depth over the Yangtze River Delta in China. Remote Sens. Environ. 2010, 114, 1649–1661. [Google Scholar] [CrossRef]
  28. Zhang, Z.Y.; Wu, W.L.; Wei, J.; Song, Y.; Yan, X.T.; Zhu, L.D.; Wang, Q. Aerosol optical depth retrieval from visibility in China during 1973–2014. Atmos. Environ. 2017, 171, 38–48. [Google Scholar] [CrossRef]
  29. Tang, W.J.; Yang, K.; Qin, J.; Niu, X.L.; Lin, C.G.; Jing, X.W. A revisit to decadal change of aerosol optical depth and its impact on global radiation over China. Atmos. Environ. 2017, 150, 106–115. [Google Scholar] [CrossRef]
  30. He, Q.Q.; Zhang, M.; Huang, B. Spatio-temporal variation and impact factors analysis of satellite-based aerosol optical depth over China from 2002 to 2015. Atmos. Environ. 2016, 129, 79–90. [Google Scholar] [CrossRef]
  31. Wu, J.; Luo, J.G.; Zhang, L.Y.; Xia, L.; Zhao, D.M.; Tang, J.P. Improvement of aerosol optical depth retrieval using visibility data in China during the past 50years. J. Geophys. Res.-Atmos. 2014, 119, 13370–13387. [Google Scholar] [CrossRef]
  32. Xu, X.F.; Qiu, J.H.; Xia, X.G.; Sun, L.; Min, M. Characteristics of atmospheric aerosol optical depth variation in China during 1993–2012. Atmos. Environ. 2015, 119, 82–94. [Google Scholar] [CrossRef]
  33. Guo, J.P.; Zhang, X.Y.; Wu, Y.R.; Zhaxi, Y.Z.; Che, H.Z.; La, B.; Wang, W.; Li, X.W. Spatio-temporal variation trends of satellite-based aerosol optical depth in China during 1980–2008. Atmos. Environ. 2011, 45, 6802–6811. [Google Scholar] [CrossRef]
  34. Li, S.; Wang, T.J.; Xie, M.; Han, Y.; Zhuang, B.L. Observed aerosol optical depth and angstrom exponent in urban area of Nanjing, China. Atmos. Environ. 2015, 123, 350–356. [Google Scholar] [CrossRef]
  35. Wang, H.; Yang, L.K.; Deng, A.J.; Du, W.B.; Liu, P.; Sun, X.B. Remote sensing of aerosol optical depth using an airborne polarimeter over North China. Remote Sens. 2017, 9, 979. [Google Scholar] [CrossRef]
  36. Xie, J.X.; Xia, X.G. Long-term trend in aerosol optical depth from 1980 to 2001 in north China. Particuology 2008, 6, 106–111. [Google Scholar] [CrossRef]
  37. Li, S.S.; Chen, L.F.; Tao, J.H.; Han, D.; Wang, Z.T.; Su, L.; Fan, M.; Yu, C. Retrieval of aerosol optical depth over bright targets in the urban areas of North China during winter. Sci. China Earth Sci. 2012, 55, 1545–1553. [Google Scholar] [CrossRef]
  38. Zhang, Y.; Li, Z.Q.; Qie, L.L.; Hou, W.Z.; Liu, Z.H.; Zhang, Y.; Xie, Y.S.; Chen, X.F.; Xu, H. Retrieval of aerosol optical depth using the empirical orthogonal functions (EOFs) based on PARASOL Multi-Angle intensity data. Remote Sens. 2017, 9, 578. [Google Scholar] [CrossRef]
  39. Zhu, J.; Xia, X.G.; Wang, J.; Che, H.Z.; Chen, H.B.; Zhang, J.Q.; Xu, X.G.; Levy, R.C.; Oo, M.; Holz, R.; et al. Evaluation of Aerosol Optical Depth and Aerosol Models from VIIRS Retrieval Algorithms over North China Plain. Remote Sens. 2017, 9, 432. [Google Scholar] [CrossRef] [PubMed]
  40. Qie, L.L.; Li, Z.Q.; Sun, X.B.; Sun, B.; Li, D.H.; Liu, Z.; Huang, W.; Wang, H.; Chen, X.F.; Hou, W.Z.; et al. Improving Remote Sensing of Aerosol Optical Depth over Land by Polarimetric Measurements at 1640 nm: Airborne Test in North China. Remote Sens. 2015, 7, 6240–6256. [Google Scholar] [CrossRef] [Green Version]
  41. Gelaro, R.; Mccarty, W.; Suárez, M.J.; Todling, R.; Molod, A.; Takacs, L.; Randles, C.A.; Darmenov, A.; Bosilovich, M.G.; Reichle, R. The Modern-Era retrospective analysis for research and applications, version 2 (MERRA-2). J. Clim. 2017, 30, 5419–5454. [Google Scholar] [CrossRef]
  42. Rienecker, M.M.; Suarez, M.J.; Gelaro, R.; Todling, R.; Bacmeister, J.; Liu, E.; Bosilovich, M.G.; Schubert, S.D.; Takacs, L.; Kim, G.K. MERRA: NASA’s Modern-Era retrospective analysis for research and applications. J. Clim. 2011, 24, 3624–3648. [Google Scholar] [CrossRef]
  43. National Bureau of Statistics of the People’s Republic of China. China City Statistical Yearbook. Available online: http://www.stats.gov.cn/tjsj/tjcbw/201706/t20170613_1502795.html (accessed on 4 July 2018).
  44. The Resource and Environment Science Data Center of Chinese Academy of Sciences. The climate and terrain regionalization in China. Available online: http://www.resdc.cn (accessed on 4 July 2018).
  45. Kendall, M.G. A new measure of rank correlation. Biometrika 1938, 30, 81–93. [Google Scholar] [CrossRef]
  46. Sen, P.K. Estimates of the Regression Coefficient Based on Kendall’s Tau. Publ. Am. Stat. Assoc. 1968, 63, 1379–1389. [Google Scholar] [CrossRef]
  47. Hay, J.; Darby, R. El Chichón—Influence on aerosol optical depth and direct, diffuse and total solar irradiances at Vancouver, B.C. Atmos.-Ocean. 1984, 22, 354–368. [Google Scholar] [CrossRef]
  48. Skouratov, S. Influence of the Pinatubo eruption on the aerosol optical depth in the Arctic in the summer of 1993. Atmos. Res. 1997, 44, 125–132. [Google Scholar] [CrossRef]
  49. Nagel, D.; Herber, A.; Thomason, L.W.; Leiterer, U. Vertical distribution of the spectral aerosol optical depth in the Arctic from 1993 to 1996. J.Geophys. Res.-Atmos. 1998, 103, 1857–1870. [Google Scholar] [CrossRef] [Green Version]
  50. Wang, R.; Tao, S.; Wang, W.; Liu, J.; Shen, H.; Shen, G.; Wang, B.; Liu, X.; Li, W.; Huang, Y. Black carbon emissions in China from 1949 to 2050. Environ. Sci. Technol. 2012, 46, 7595–7603. [Google Scholar] [CrossRef] [PubMed]
  51. Huang, X.; Song, Y.; Zhao, C.; Cai, X.H.; Zhang, H.S.; Zhu, T. Direct Radiative Effect by Multicomponent Aerosol over China. J. Clim. 2015, 28, 3472–3495. [Google Scholar] [CrossRef]
Figure 1. Spatial distributions of CARSNET stations that were used in China.
Remotesensing 10 01064 g001
Figure 2. The humidity zones and temperate zones in China (a) for humidity zones, (b) for temperate zones).
Remotesensing 10 01064 g002
Figure 3. Validations of AOD products from MODIS and MERRA-2.
Remotesensing 10 01064 g003
Figure 4. The number of AOD records from MODIS during 2015 over mainland China.
Remotesensing 10 01064 g004
Figure 5. The annual mean values of the MERRA AOD during 1980–2017 over mainland China.
Remotesensing 10 01064 g005
Figure 6. The annual mean AOD values over mainland China.
Remotesensing 10 01064 g006
Figure 7. The monthly mean AOD values throughout China.
Remotesensing 10 01064 g007
Figure 8. The monthly mean AOD values in different climate zones (a) for climate zones, (b) for humidity zones).
Remotesensing 10 01064 g008
Figure 9. The MK and Sen Slope values for AOD throughout China during 1980–2017 (a) for MK values, (b) for Sen Slope values.
Remotesensing 10 01064 g009
Figure 10. The annual mean AODP over mainland China (ae for BCAOD, DUAOD, OCAOD, SSAOD, and SO4AOD, respectively).
Remotesensing 10 01064 g010
Figure 11. The seasonal mean AODP values over mainland China during 1980–2017.
Remotesensing 10 01064 g011
Figure 12. The monthly mean AODP in different humid zones (ae for BCAOD, DUAOD, OCAOD, SSAOD, and SO4AOD, respectively; A for humid; B for semi-humid; C for semi-arid; D for arid).
Remotesensing 10 01064 g012
Figure 13. The monthly mean AODP in different climate zones (ae for BCAOD, DUAOD, OCAOD, SSAOD, and SO4AOD, respectively; I for cold-temperate; II for mid-temperate; III for warm-temperate; IV for the north subtropical zone; V for the mid-subtropics; VI for the south subtropics; VII for the edge of the tropical zone; HI for the sub-frigid zone in the plateau; HII for the temperature zone in the plateau; A for humid; B for semi-humid; C for semi-arid; D for arid. IIE for the mid-tropical zone with humid weather).
Remotesensing 10 01064 g013
Figure 14. The annual variations of the anthropogenic aerosol emissions in China during 1980–2017.
Remotesensing 10 01064 g014
Figure 15. Spatial variations of the anthropogenic aerosol emissions over mainland China (these data were derived from the MERRA-2 dataset).
Remotesensing 10 01064 g015
Figure 16. The spatial distributions of correlation coefficients between AOD and the anthropogenic aerosol emissions over mainland China.
Remotesensing 10 01064 g016
Figure 17. The correlation coefficient between the annual mean AOD and socioeconomic factors during 1988–2015.
Remotesensing 10 01064 g017
Figure 18. The annual mean AOD values in different land-use coverage during 1980–2015.
Remotesensing 10 01064 g018
Table 1. Geographical and annual mean meteorological informationof the CARSNET stations that were used in this study.
StatisticsLat (deg)Lon (deg)A (m)P (hpa)RHSH (h)T (°C)
max47.73° N126.77° E3648.91042.11.0014.6035.70
min22.63° N79.93° E2.5638.90.050.00−33.10
mean--856.9922.70.566.5911.49
std--956.799.10.214.1112.06
Note: Lat is latitude, Lon is longitude, A is altitude, P is surface pressure, RH is relative humidity, SH is sunshine hour, T is air temperature.
Table 2. Basic information about the MODIS and MERRA-2 products that were used in this study.
Dataset NameParametersSpatial ResolutionTemporal ResolutionTemporal Range
MOD04_L2/MYD04_L2Aerosol optical depth
(AOD, 550 nm)
10 kmInstantaneously2002–2014
MOD08_D3/MYD08_D3Aerosol optical depth
(AOD, 550 nm)
1° (lat) × 1° (lon)Instantaneously2002–2014
MERRA-2Aerosol optical depth
(AOD, 550 nm)
0.50° (lat) × 0.625° (lon)Daily1980–2017
anthropogenic aerosol emissions
(BCEMAN, OCEMAN, SO2MAN and SO4MAN)
AOD for dust aerosol
(DUAOD, 550 nm)
AOD for black carbon aerosol
(BCAOD, 550 nm)
AOD for organic carbon aerosol
(OCAOD, 550 nm)
AOD for Sea salt aerosol
(SSAOD, 550 nm)
AOD for SO4 aerosol
(SO4AOD, 550 nm)

