Article

Time-Series Multispectral Indices from Unmanned Aerial Vehicle Imagery Reveal Senescence Rate in Bread Wheat

1
Institute of Crop Sciences, National Wheat Improvement Centre, Chinese Academy of Agricultural Sciences (CAAS), Beijing 100081, China
2
College of Agronomy, Xinjiang Agricultural University, Urumqi 830052, China
3
International Maize and Wheat Improvement Centre (CIMMYT) China Office, c/o CAAS, Beijing 100081, China
4
INRA, UMR-EMMAH, UMT-CAPTE, UAPV, 228 Route de l’aérodrome CS 40509, 84914 Avignon, France
*
Authors to whom correspondence should be addressed.
Remote Sens. 2018, 10(6), 809; https://doi.org/10.3390/rs10060809
Submission received: 11 April 2018 / Revised: 19 May 2018 / Accepted: 21 May 2018 / Published: 23 May 2018

Abstract

:
Detection of senescence’s dynamics in crop breeding is time consuming and needs considerable details regarding its rate of progression and intensity. Normalized difference red-edge index (NDREI) along with four other spectral vegetative indices (SVIs) derived from unmanned aerial vehicle (UAV) based spatial imagery, were evaluated for rapid and accurate prediction of senescence. For this, 32 selected winter wheat genotypes were planted under full and limited irrigation treatments. Significant variations for all five SVIs: green normalize difference vegetation index (GNDVI), simple ratio (SR), green chlorophyll index (GCI), red-edge chlorophyll index (RECI), and normalized difference red-edge index (NDREI) among genotypes and between treatments, were observed from heading to late grain filling stages. The SVIs showed strong relationship (R2 = 0.69 to 0.78) with handheld measurements of chlorophyll and leaf area index (LAI), while negatively correlated (R2 = 0.75 to 0.77) with canopy temperature (CT) across the treatments. NDREI as a new SVI showed higher correlations with ground data under both treatments, similarly as exhibited by other four SVIs. There were medium to strong correlations (r = 0.23–0.63) among SVIs, thousand grain weight (TGW) and grain yield (GY) under both treatments. Senescence rate was calculated by decreasing values of SVIs from their peak values at heading stage, while variance for senescence rate among genotypes and between treatments could be explained by SVIs variations. Under limited irrigation, 10% to 15% higher senescence rate was detected as compared with full irrigation. Principle component analysis corroborated the negative association of high senescence rate with TGW and GY. Some genotypes, such as Beijing 0045, Nongda 5181, and Zhongmai 175, were selected with low senescence rate, stable TGW and GY in both full and limited irrigation treatments, nearly in accordance with the actual performance of these cultivars in field. Thus, SVIs derived from UAV appeared as a promising tool for rapid and precise estimation of senescence rate at maturation stages.

Graphical Abstract

1. Introduction

Bread wheat is a major staple crop and provides the calorie needs of one-third of the global population [1]. Sustainable wheat production under climate change condition will largely depend upon resilience of cultivars to weather extremes [2]. Drought and heat are estimated to reduce 9 to 10% annual yield by worldwide [3], especially terminal drought in Asia [4]. Improved yield-related physiological attributes under abiotic stress is a continually area of research to aid wheat breeding efforts. The rate of senescence caused by disintegration of these traits is an important selection criterion that can be used to improve crop adaptability under drought and heat conditions [5].
Senescence is an important time-point which utilizes available resources of the plants for remobilization of nutrients to the sink. It is not a chaotic breakdown, but rather, a complex, dynamic process, generally programmed and driven by genetic and environmental factors [6]. Senescence can be affected in different ways: time of onset, intensity, and rate of progression. Under extreme stress conditions, early senescence caused by maturation due to rapid breakdown of plant tissues and macromolecules, for example chlorophyll, results in significant yield penalties [7,8]. Borrell et al. [9] demonstrated negative impacts of high senescence rate on grain yield under water limited and heat conditions. Senescence has a strong relationship with green leaf area, chlorophyll contents and canopy temperature [10,11,12,13]. Wheat genotypes with improved stay-green traits have delayed senescence [8,14], and therefore selection for low senescence could improve cultivar’s performance under stressed condition [9,14].
As senescence occurs in a progressive manner, its reproducible quantification at multiple time points through standardized methods could allow accurate comparisons among genotypes [9]. However, accurate phenotyping of senescence rate is still a diverse, time-consuming exercise and needs a lot of details. For instance, visual estimates for rate of loss of green leaf area and chlorophyll measured by SPAD equipment were reported as useful traits in identification of delayed senescence genotypes [14]. Over the last few years, ground based-high throughput approaches have been optimized for non-destructive estimation of spectral vegetation indices (SVIs) such as normalized vegetation index (NDVI), simple ratio (SR), and chlorophyll indices (CI) [15,16,17,18,19]. These SVIs are mainly surrogates for green biomass, leaf area index (LAI), level of chlorophyll, and photosynthesis rate. These spectral vegetation indices can be used for assessment of senescence rate during maturation. The availability of cost-effective, high resolution multi-spectral sensors have made unmanned aerial vehicles (UAV) a mainstream approach in crop physiology research, especially for temporal quantification of spatial traits from large of diverse populations to maximize selection accuracy under a range of environmental factors [20].
Multispectral sensors and RGB cameras have been used for spectral imagery of different light reflectance bands (near infrared, red, red-edge, green, and blue) using UAV to detect biomass [21], LAI [22], plant density [23], and photosynthetic activity [24] in rapeseed, barley and wheat crops. Rate of emergence and spring survival were also estimated in wheat through UAV-based multispectral imagery [25]. Moreover, Satellite-based vegetation data have also been used for crop growth monitoring [26,27,28]. Recently, UAV-based vegetation indices such as the enhanced vegetation index (EVI) and the normalized difference red edge (NDRE) were estimated to evaluate physiological status of wheat and sorghum crops during maturation under drought conditions [8,26]. As senescence is an important attribute for selection regarding stay-green genotypes there is a need to develop an accurate method using cost-effect spectral data to predict senescence rate. Rapid monitoring of senescence at multiple time-points could help to increase selection intensity and accuracy in wheat breeding. The objectives of the current study were to (1) assess the associations between UAV-derived spectral vegetation indices SVIs and physiological traits measured by handheld instruments; (2) predict senescence rate from UAV-based SVIs as well as its impact on yield-related traits; and (3) evaluate the diversity of wheat germplasm for senescence rate under two irrigation treatments.

2. Material and Methods

2.1. Germplasm

A set of 32 bread wheat cultivars and advanced lines were selected to evaluate the ability of a multi-spectral sensor mounted on UAV for the prediction of senescence using five SVIs. These genotypes were representative of cultivars released in the North China Winter Wheat Region over the last 40 years, covering Tianjin, Beijing, northern parts of Hebei province, and part of Shanxi province. The study panel included historical cultivars and new cultivars as well as advanced lines performing differently in stay-green during terminal drought and under high temperatures. Cultivars and pedigree information is presented in Table S1 (Supplementary Material).

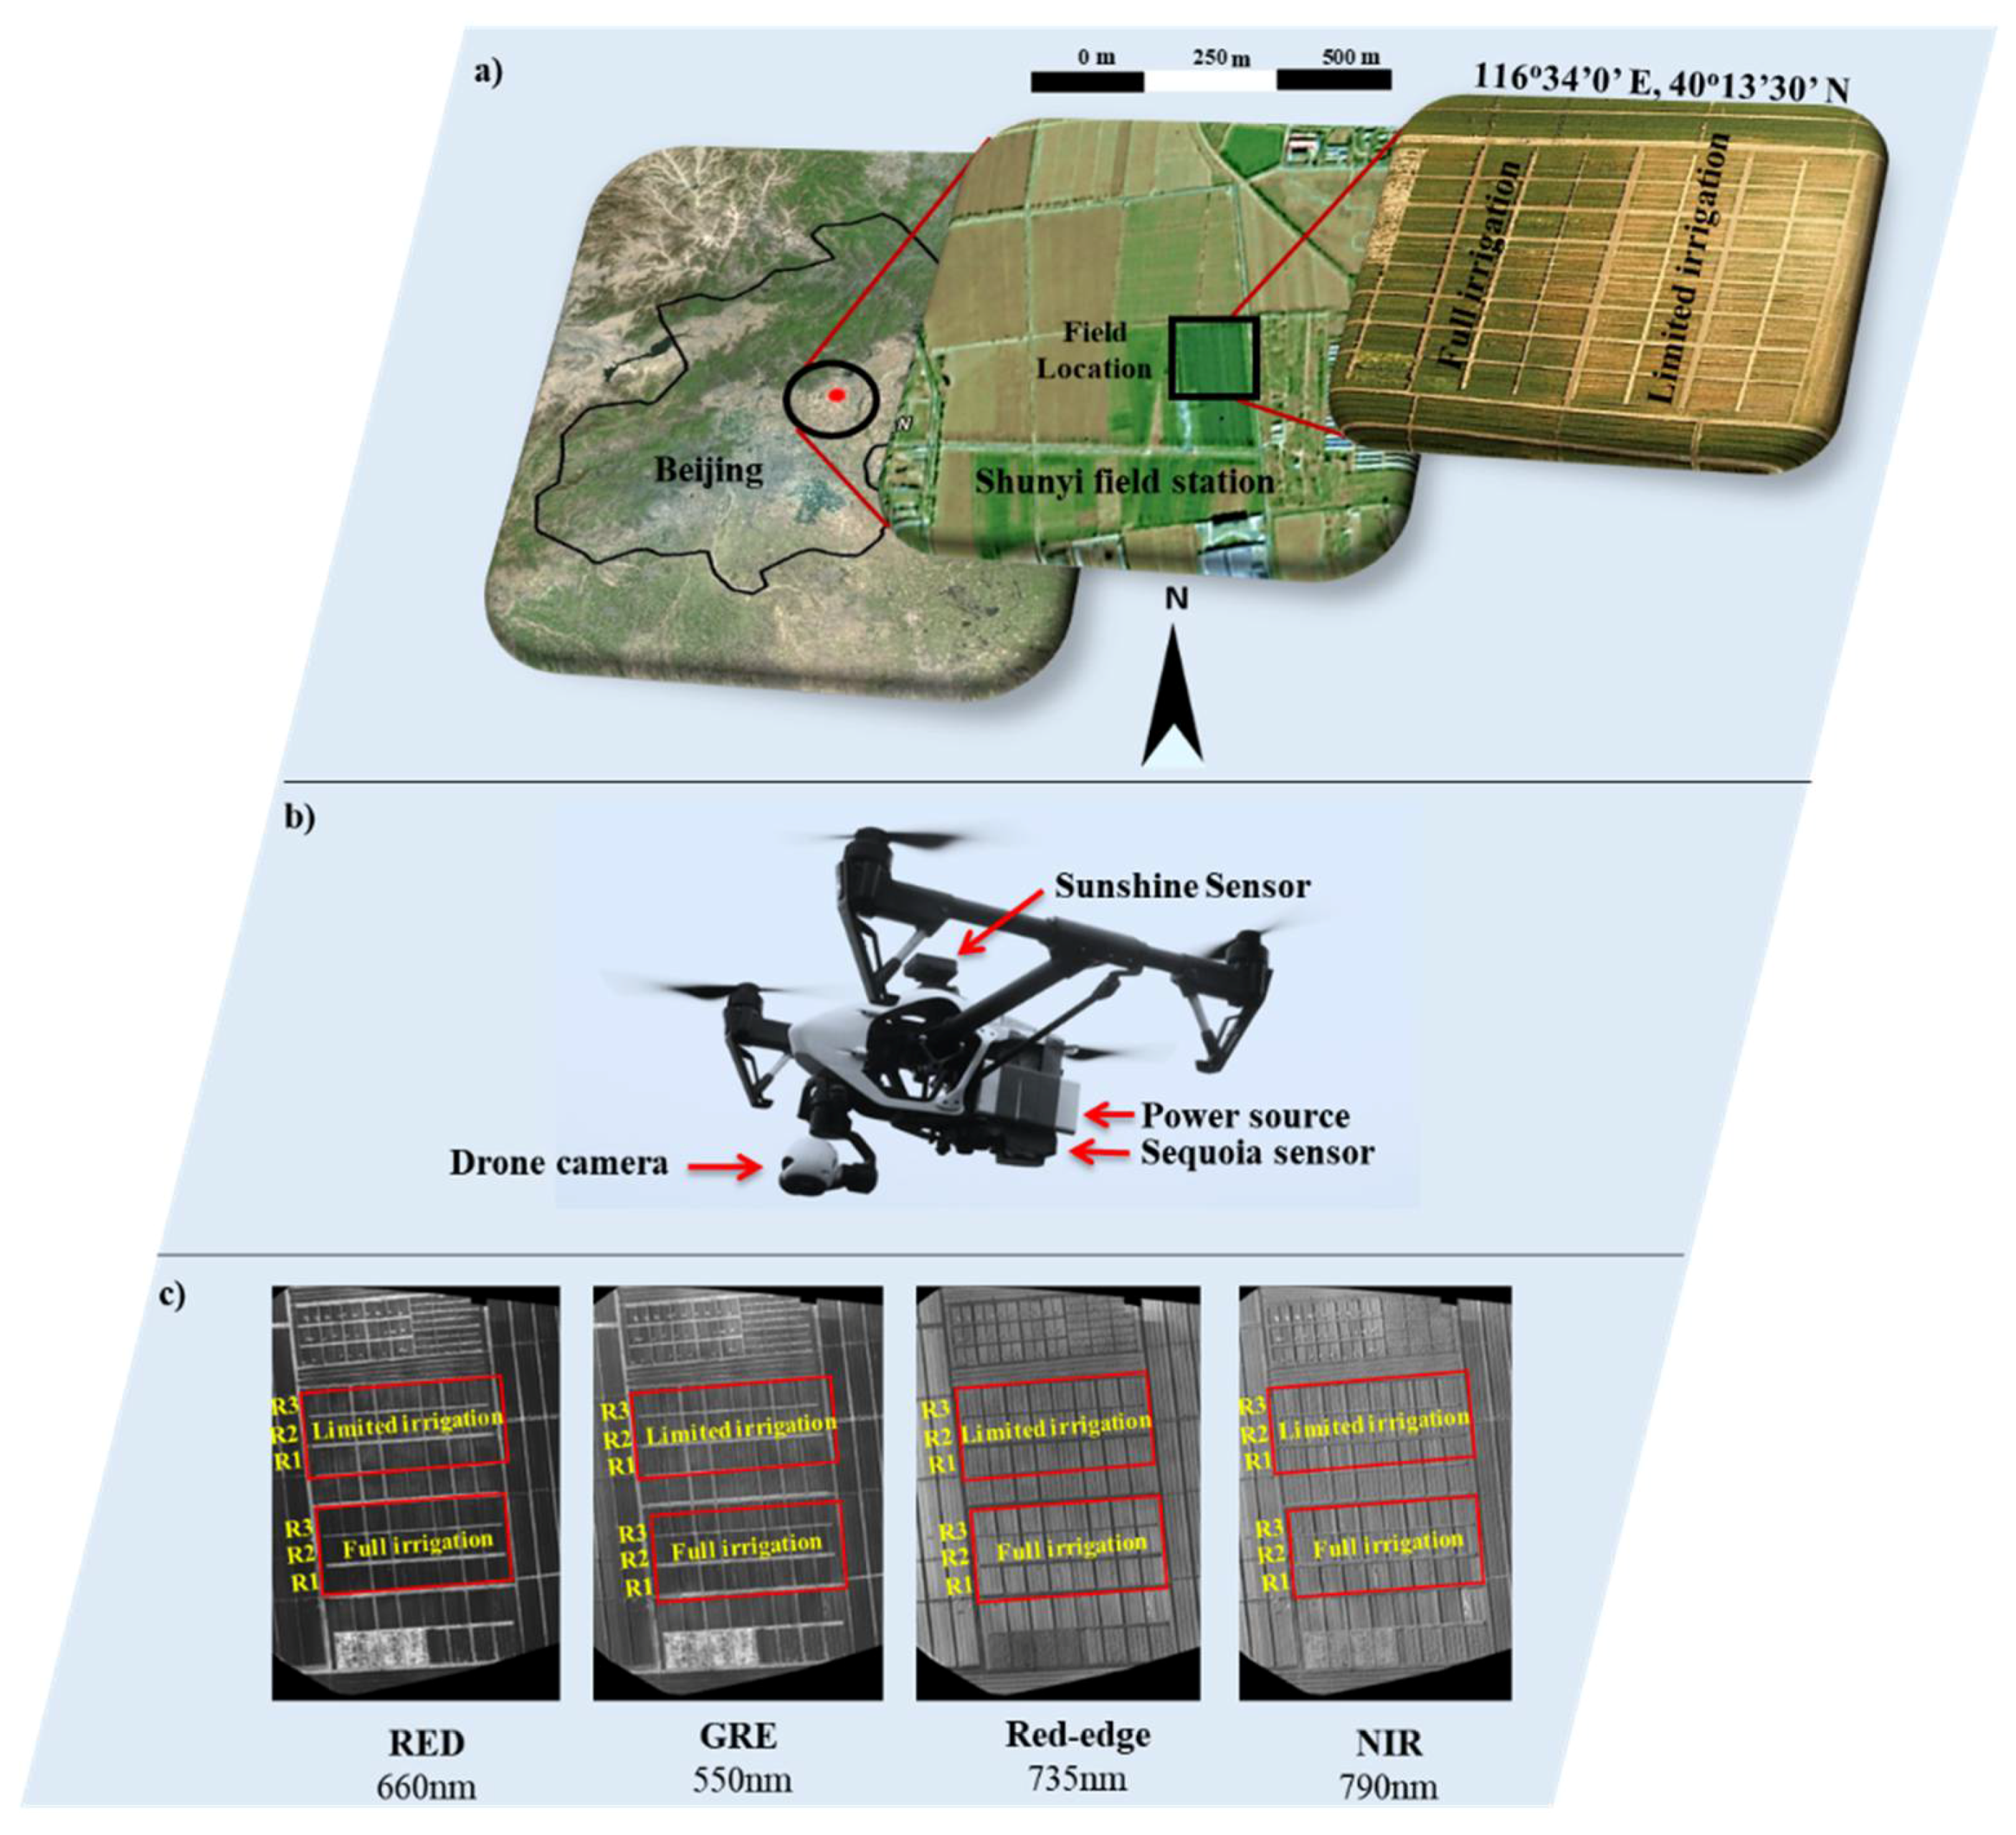
2.2. Experimental Design

The site of field trial was (40°13′30″ N, 116°34′0″ E) Shunyi Experimental Station of the Chinese Academy of Agricultural Sciences (CAAS), Beijing (Figure 1a). A randomized complete block design with three replications was employed. Each plot consisted of 7.5 m six rows, 1.2 m in width, and with 0.2 m inter-row spacing. The trials were planted 23 October 2017 with a seedling rate of 270 seedlings/m2 and harvested on 13 June 2018. The limited irrigation treatment was restricted to flooding after seedling and tillering, whereas full irrigation treatment was continued to further irrigation at the stem elongation and early grain filling stages at levels of 2250 to 2700 m3 ha−1. Nutrient levels for both treatments were maintained at the optimal level. Seasonal precipitation was 128 mm from planting to harvesting. Each plot was harvested by combine harvester after full maturity to estimate grain yield.

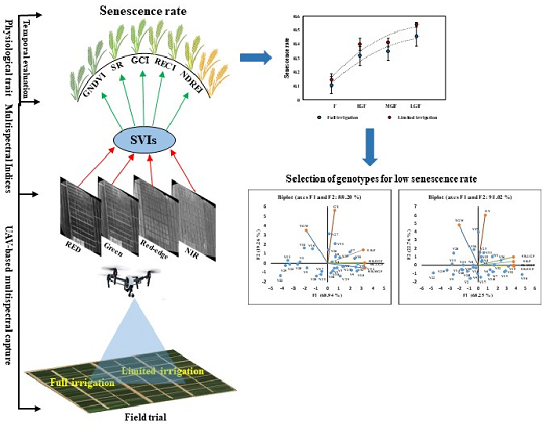
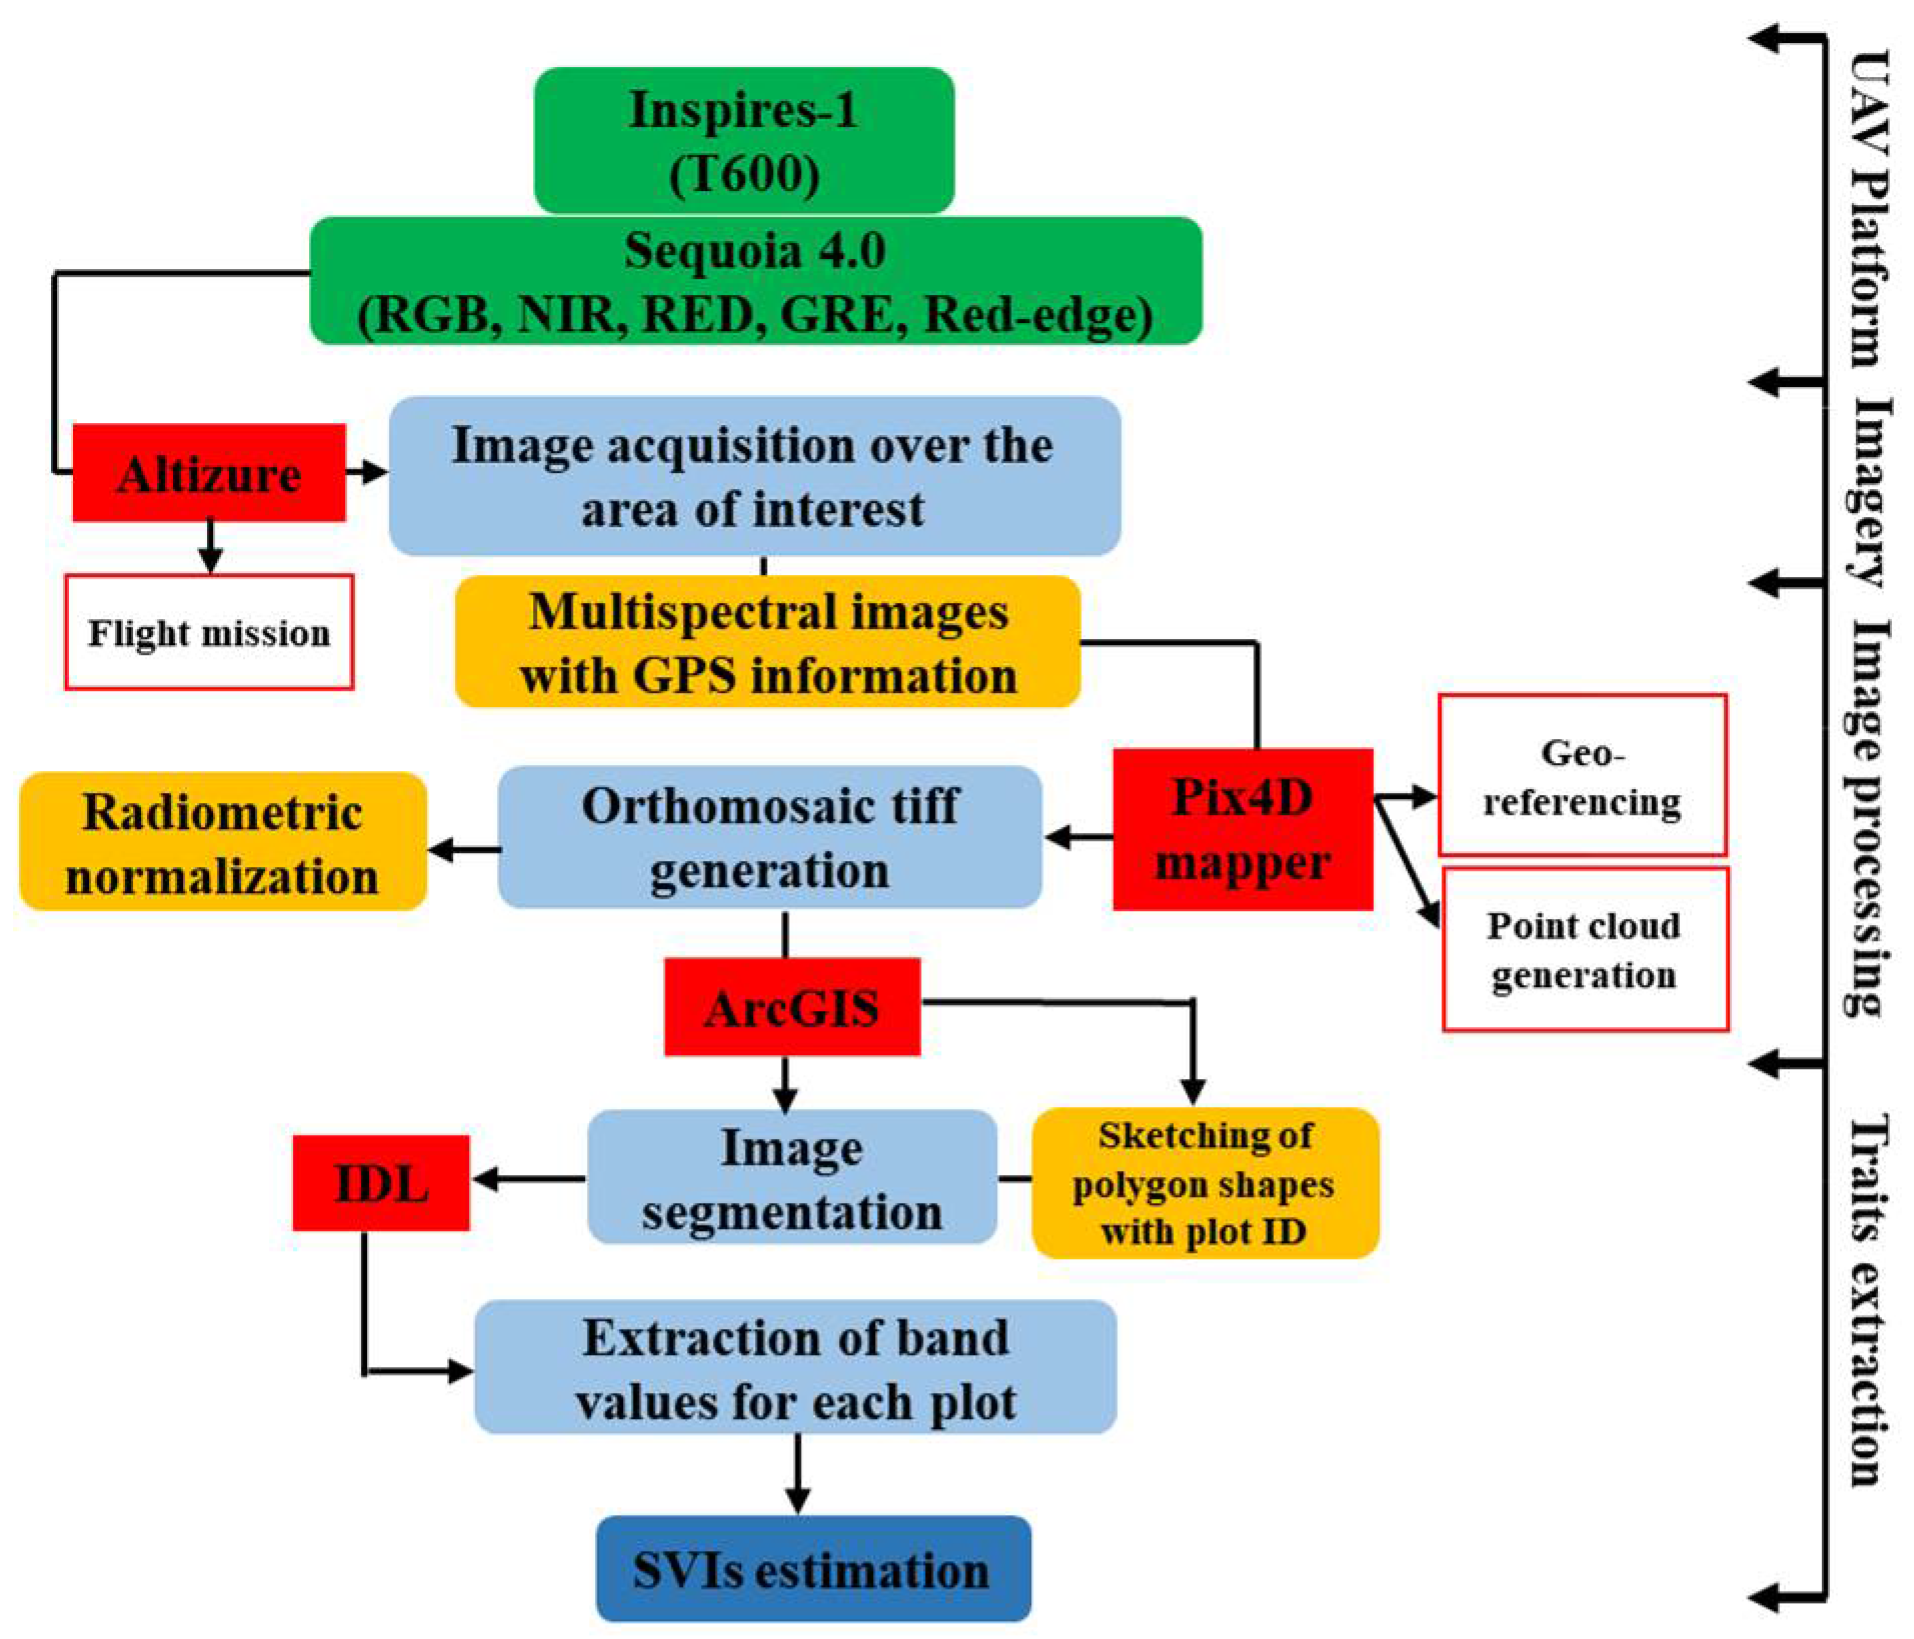
2.3. UAV Platform and Flight Mission

A sequoia 4.0 multi-spectral camera with built-in global positioning system (GPS) device (Micasense Parrot, Seattle, WA, USA) (https://www.micasense.com/parrotsequoia/) mounted on an advanced auto-operational DJI Inspires 1 model T600 (SZ DJI Technology Co., Shenzhen, China) was used for multispectral imagery (Figure 1b). The main advantage of the T600 was its ability to hover at low altitude and slow speed, which allowed to capture high-resolution images. Sequoia 4.0 can simultaneously capture 4 different band images with GPS information at specific intervals and with the same resolution (1280 × 960 pixels) images of 10 nm bandwidth (half maximum bandwidth) for red-edge band and 40 nm bandwidth for infra-red, red and green bands; details of bands wavelength are shown in Figure 1c. A sunshine sensor was employed with sequoia sensor to minimize error due to the variation in ambient light during the imagery. Flight missions over the trial were designed in the open source flight planning software Altizure DJI version 3.6.0 (https://www.altizure.com). To obtain sufficient image resolution, each flight was flown at 30 to 40 m above the ground at a speed of 2.5 m/s to get 85% forward and side image overlapping Images were captured at 1.5 s intervals. Average ground sampling distance (GSD) of sequoia sensor was 2.5 to 2.8 cm at 30 and 40 m altitude, respectively.

2.4. Data Acquisition Schedule

Data acquisition occurred at heading and anthesis, and at early, mid and late grain filling stages, which were considered important to capture the growth dynamics and patterns of senescence under different irrigation treatments. The data acquiring schedule is given in Table 1.

2.5. Image Processing and Data Extraction

The main advantage of the Sequoia sensor is that it captures multispectral images with accurate geo-reference information, which is important to achieve precise point clouds for good quality orthomosaic generation. Pix4D mapper (Version 1.4, PIX4d, Lausanne, Switzerland) (https://pix4d.com/) was used for orthomosaic generation after each aerial photoshoot of the experimental area. The key steps of the orthomosaic generation using Pix4D mapper comprised camera alignment, geo-referencing, building dense point cloud, generating DSM and orthomosaic as previously reported in some studies [29,30,31]. Moreover, Pix4D mapper have ability to compute accurate GCPs after matching the mutual tie points positions of images capture from camera automatically to minimize the error probability in orthomosaic generation. Data acquisition from UAV platform to image processing for extraction of band values is elaborated in Figure 2. ArcMap scripted in ArcGIS (Version 10.3.1 Esri, USA) (http://www.esri.com/arcgis/about-arcgis) was used for image segmentation to extract the useful information of each plot. For this, polygon shapes were generated with a specific plot ID defining the particular germplasm [31]. Spectral values were analyzed using combined orthomosaic TIFF images of four different bands and polygon shape files in IDL (Version 8.6, Harris, Geospatial Solutions, Inc. Reston, CO, USA). Reflectance calibration was done using calibrated reflectance panel with known reflectance values provided by Micasense (Micasense Parrot, Seattle, WA, USA).

2.6. Estimation of Narrowband SVIs and Senescence Rate

Four SVIs, i.e., green normalized difference vegetation index (GNDVI), red-edge chlorophyll index (RECI), green chlorophyll index (GCI), and simple ratio (SR), are mainly surrogate for crop architecture and health-related physiological attributes depending on developmental stage [24,25]. The normalized difference red-edge index (NDREI), reported first time in this study, was mainly evaluated to detect the green leaf area during senescence.
NDREI and RECI are sensitive to less green parts of the plants and provide insight about photosynthesis status during senescence. SVIs were measured through band reflectance values captured by the Sequoia 4.0 sensor (Table 2). Senescence rate was calculated by subtracting the SVI values captured at flowering to late grain filling stages from their peak values at heading [29].
Senescence rate = (SVI values at heading stage) − (SVI values at maturation)

2.7. Collection of Ground Morphological Data

To verify the accuracy of UAV-based SVIs for assessment at different growth stages, physiological traits such as leaf chlorophyll level, canopy temperature (CT) and leaf area index (LAI) were measured by a using SPAD-502 Plus (Konica Minolta, Japan), infrared thermometer (Spectrum Tech., Inc. Aurora, IL, USA) and Decagon’s AccuPAR LP-80 ceptometer (METER Group, Inc. Pullman, WA, USA), respectively. Chlorophyll was averaged from flag leaves of 10 plants and canopy temperature was taken from the top of each plot at ½ m distance during 1 p.m. to 2 p.m. Previously these traits were used for senescence estimation [9,12]. Yield related traits including kernels per spike (KPS), thousand grain weight (TGW), and grain yield (GY) were calculated following Gao et al. [34].

2.8. Statistical Analysis

All statistical analyses were performed in R package [35]. Linear regressions and the correlation matrix were calculated to evaluate the relationship between all observed parameters. A mix linear model was used to test the significance of variation between genotypes, treatments, and their interactions for spectral vegetation indices and ground traits. The results were accepted as significant at p ≤ 0.05. The following general model was used:
Y = X β + Z μ + ε
where Y is the response demonstrated by fixed (β) and random (μ) effects with random error (ε). X and Z indicate fixed and random effects, respectively.
To capture the phenotypic variation due to genetic diversity we calculated broad-sense heritability for SVIs in each treatment using entries as a random effect according to Segal et al. [36].
H2 = σg2/(σg2 + σε2/r)
where σg2 and σε2 represent the genotypic and error variances, respectively, and r is number of replications for each genotype. Heritability of each component across the growth stages give researchers an indication about the consistency of trait under a particular environment.
Principal component analysis (PCA) was used for multivariate analysis to assess the diversity in germplasm for SVIs. The basic equation used for PCA in matrix notation was,
Y = W′X
where W is a matrix of coefficients that is determined by PCA and X is an adjusted data matrix consisting of n observations (rows) on p variables (columns).

3. Results

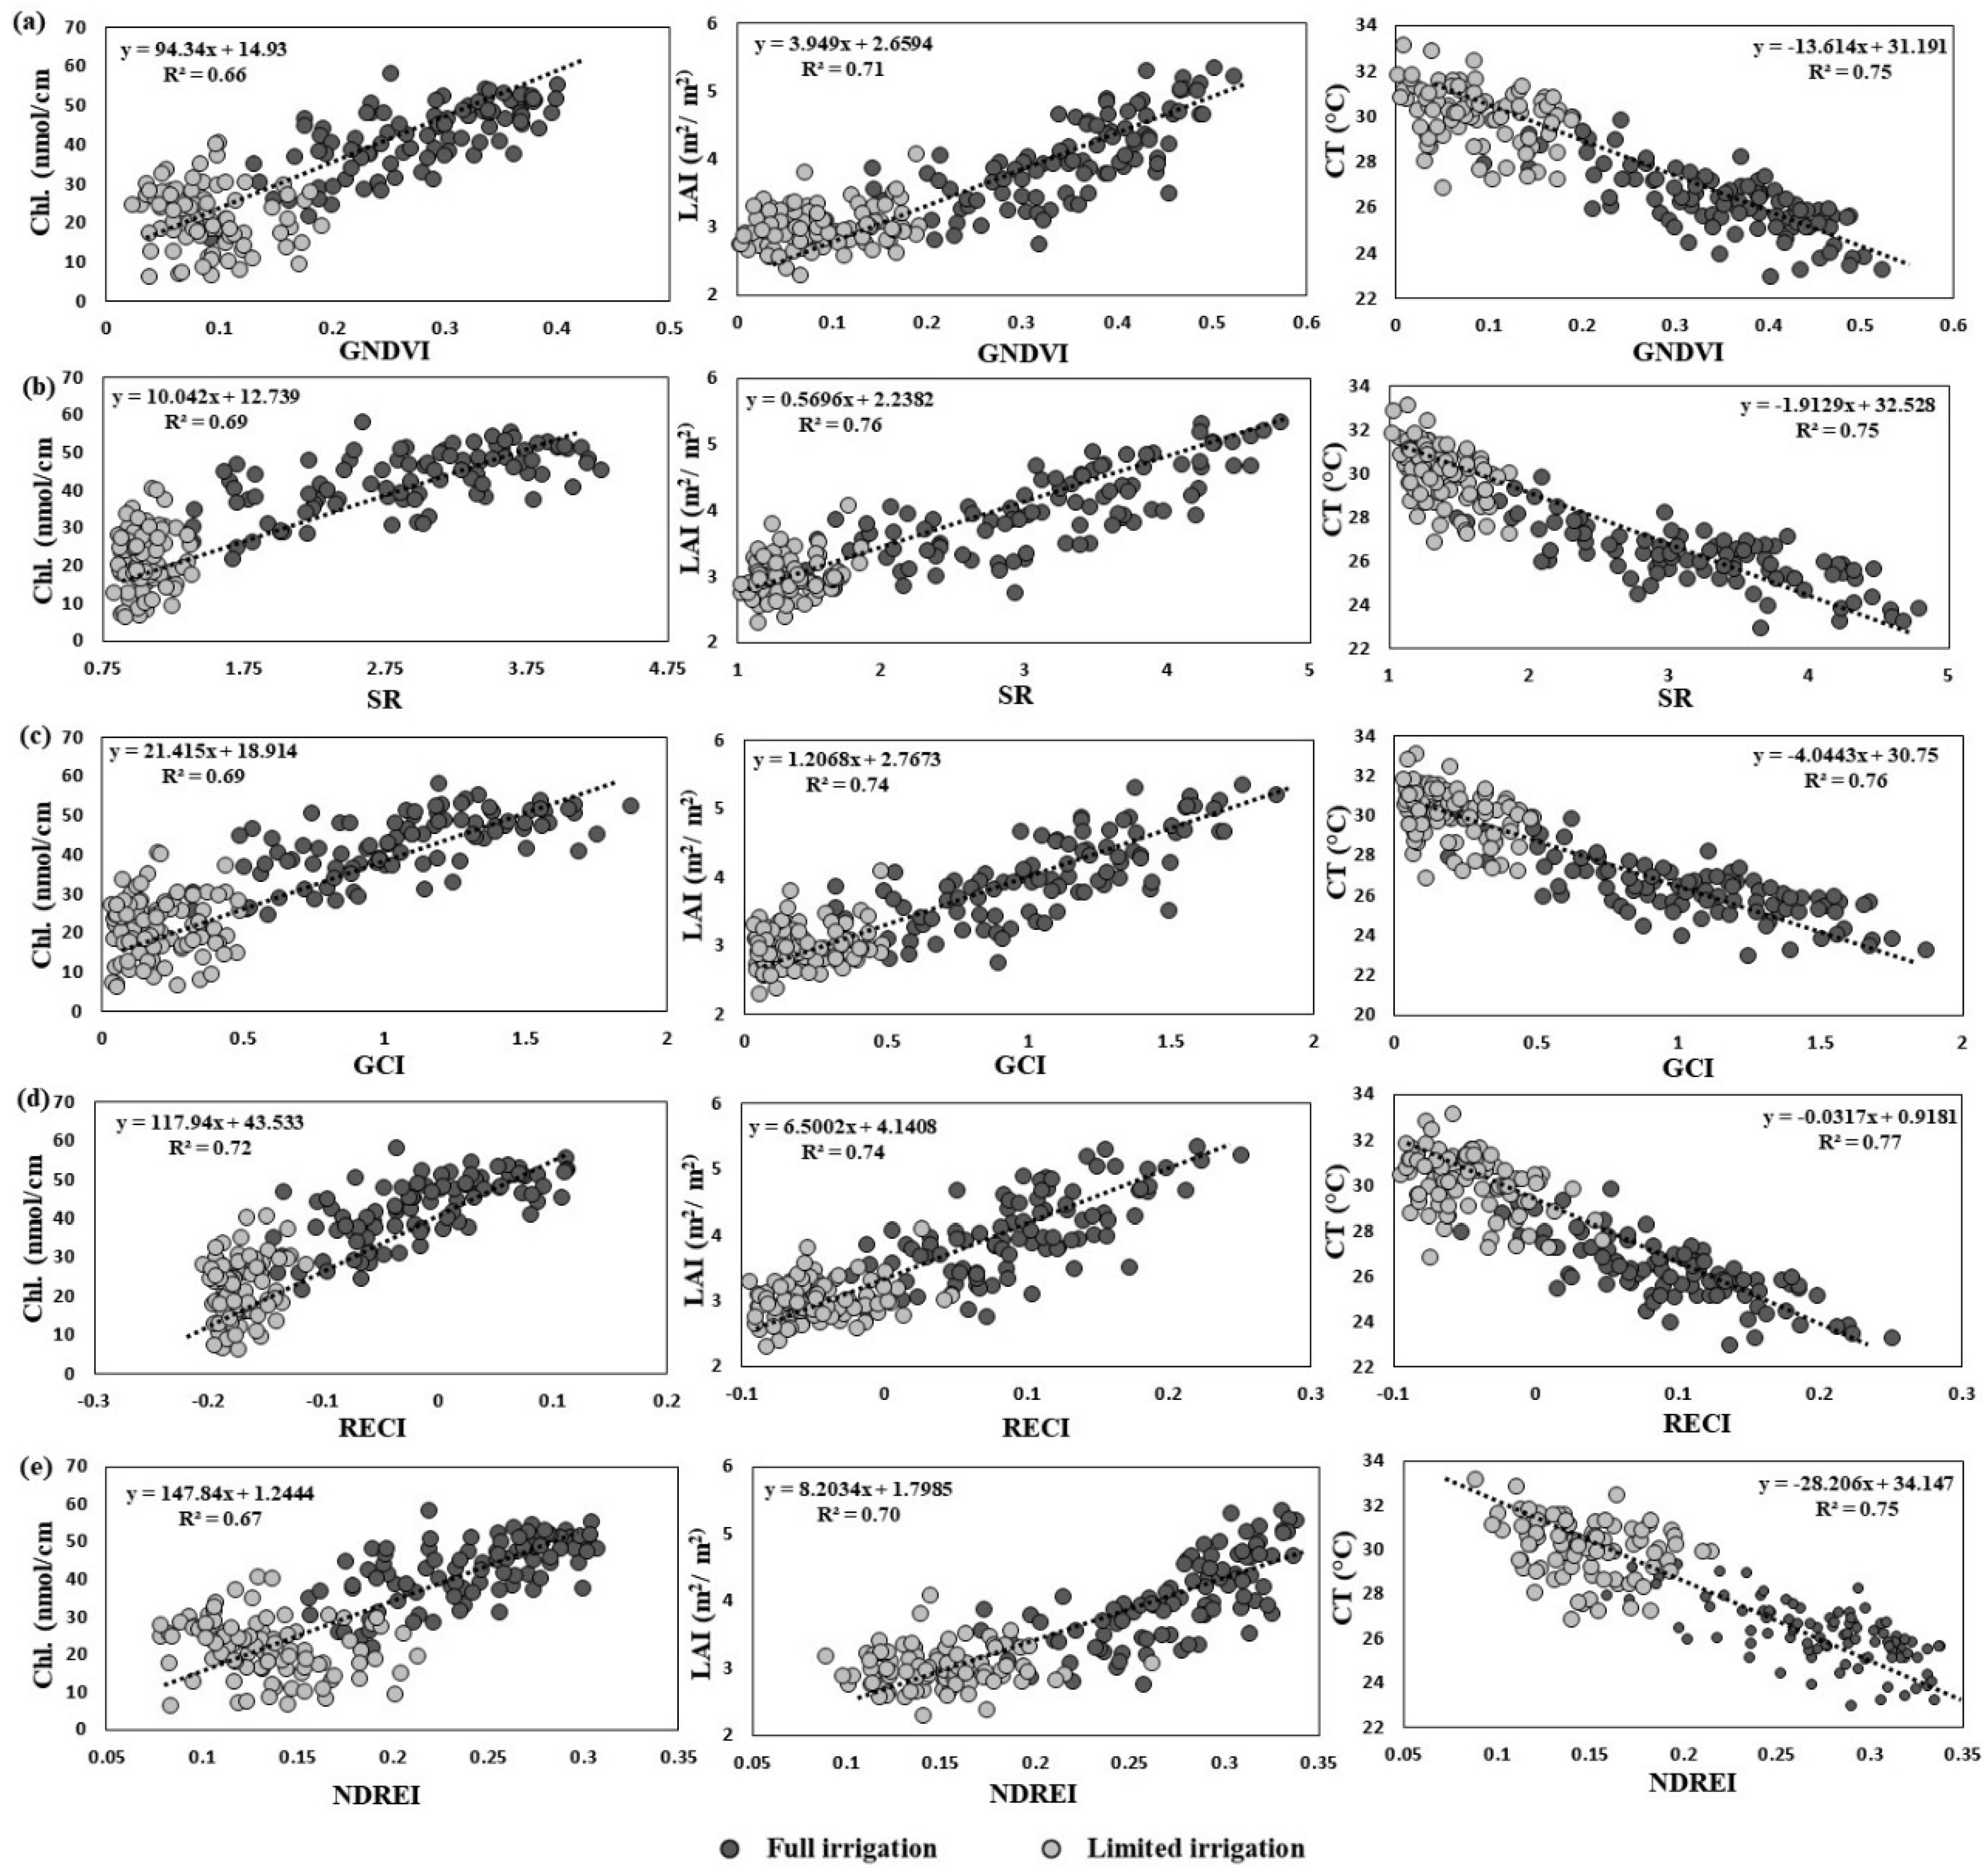
3.1. Accuracy of SVI Data to Predict Growth Status

As presented in Figure 3, high regression values (R2 = 0.66 to 0.72) were observed between UAV-based SVIs and the chlorophyll measured by SPAD at late grain filling. Correlations were also high (R2 = 0.69 to 0.76) between SVIs and leaf area index detected from the light ceptometer during the mid and late grain filling stages. Moreover, ground canopy temperature measured by thermo-radiometer showed strong negative correlations (R2 = 0.75 to 0.78) with SVIs. Pearson’s coefficients of correlations were also significantly higher, ranging from 0.55 to 0.78 between SVIs and ground chlorophyll and LAI, but −0.13 to −0.76 between SVIs and CT during the heading to late grain filling stages (Figure 4 and Figure 5). Heritabilities were moderate to high (0.65 to 0.97) for all SVIs in both irrigation treatments (Table 3).

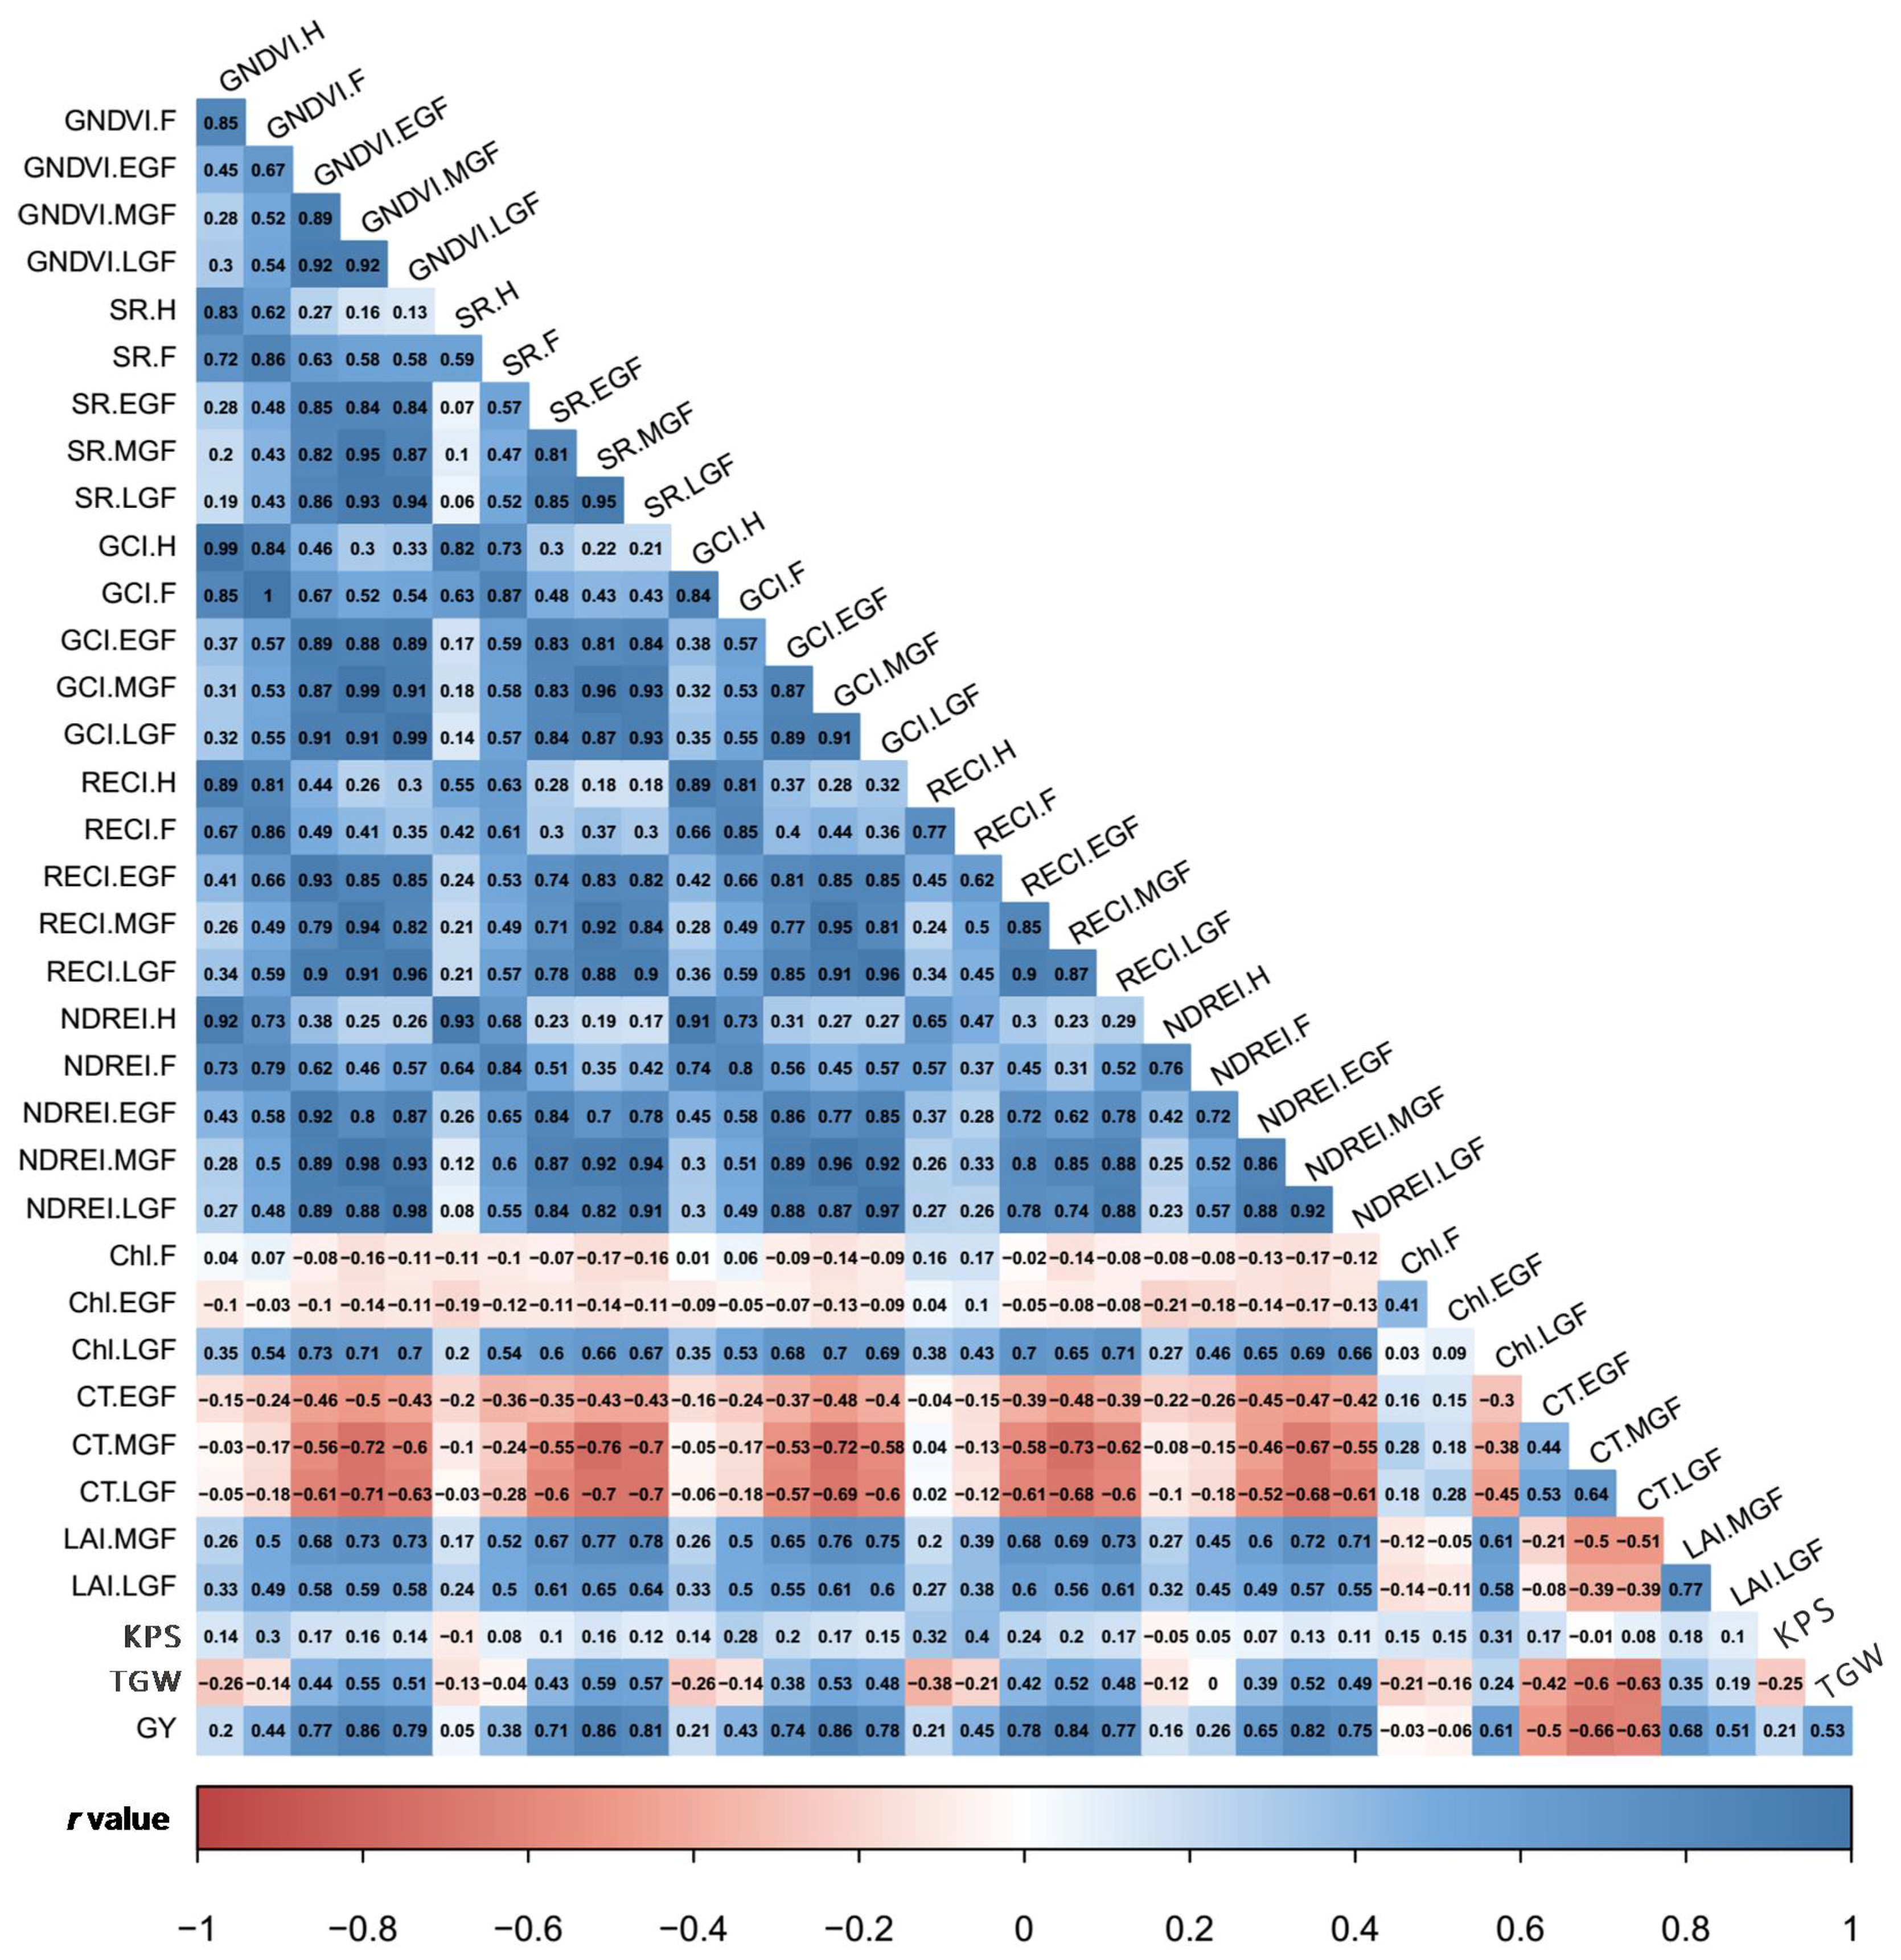
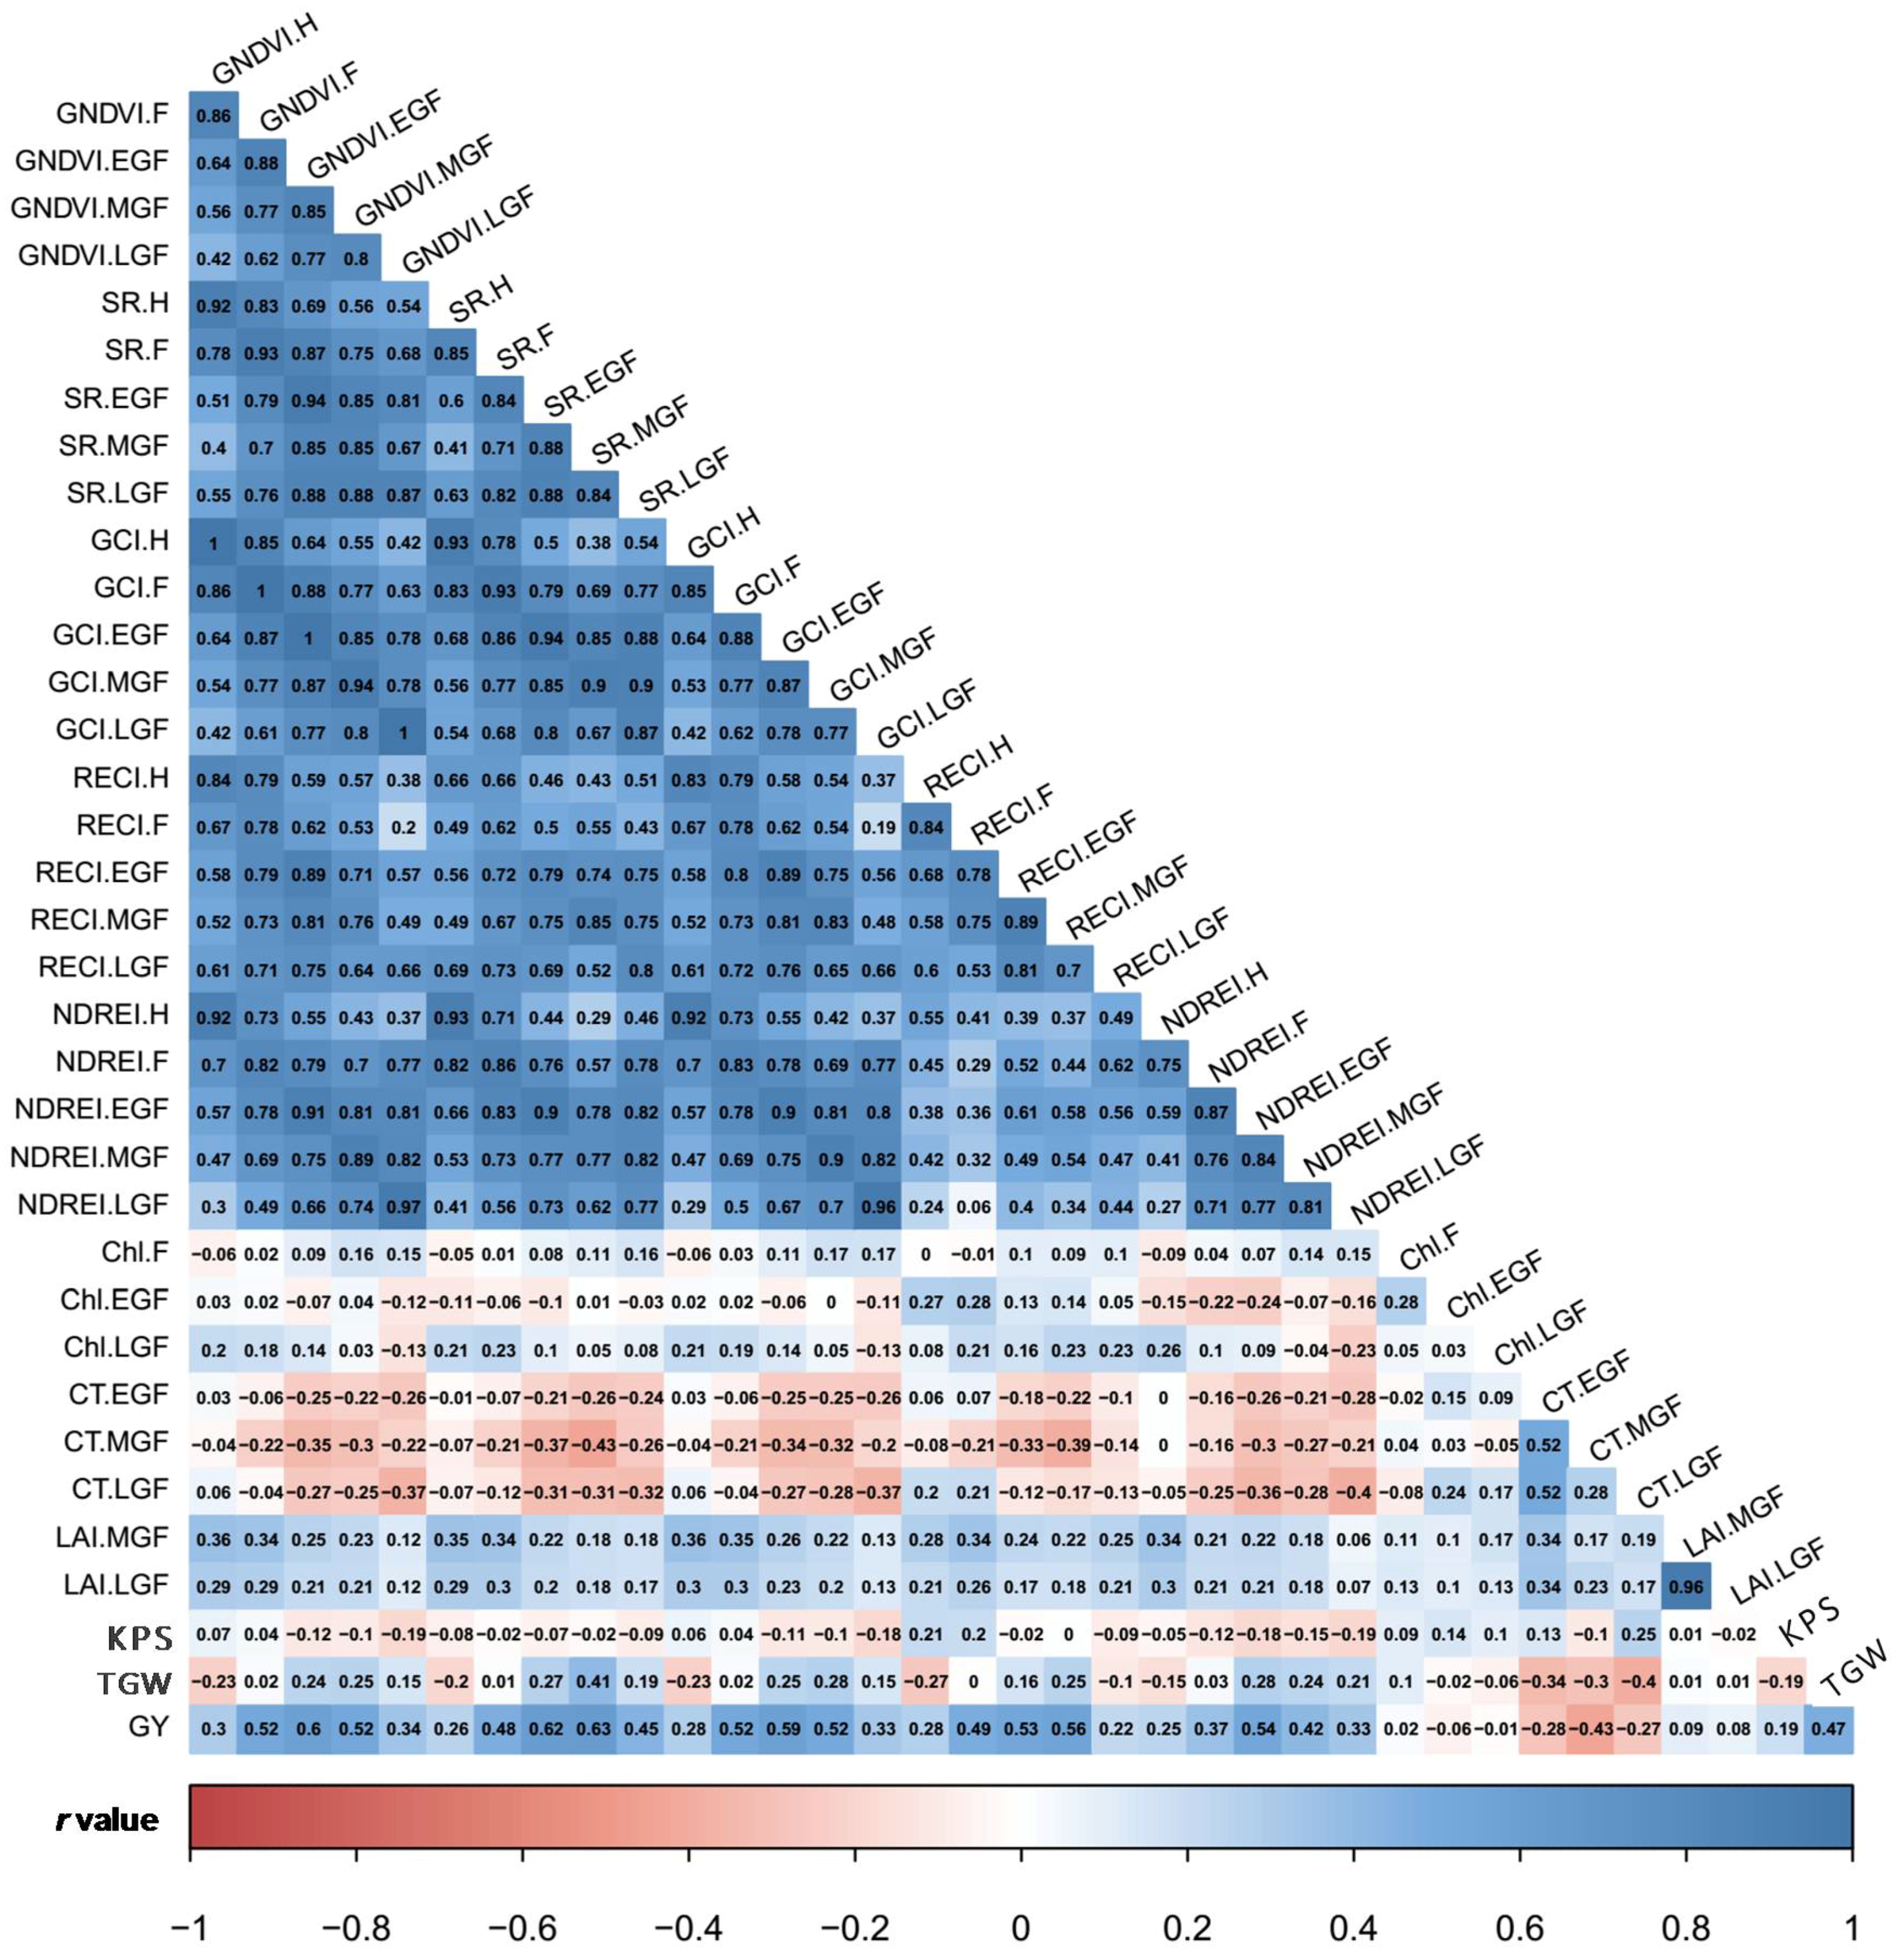
3.2. Estimates of Variance Components and Correlations among SVIs and Yield Traits

There were highly significant variations among genotypes (p ≤ 0.001) for all traits across the five growth stages (Table 3) and also significant differences (p ≤ 0.0001) between irrigation treatments and genotypes treatment interaction for all traits. Broad sense heritabilities were also higher for full irrigation treatment ranging from 0.69 to 0.97 compared with 0.65 to 0.95 for limited irrigation at all five stages. Grain yield was strongly correlated with GNDVI (r = 0.86), SR (r = 0.86), GCI (r = 0.86), NDREI (r = 0.82) and RECI (r = 0.84) under full irrigation at mid grain filling (Figure 4 and Figure 5). A similar pattern was observed with lower correlation values in limited irrigation conditions. TGW was positively correlated with SVIs at mid grain filling with correlations ranging from 0.52 to 0.59 under full irrigation, and 0.24 to 0.41 under limited irrigation. GNDVI, GCI and RECI showed significant but low correlations (r = 0.28 to 0.40) with KPS under full irrigation at flowering, but under limited irrigation KPS was associated with RECI with a low correlation (r = 0.21). Negative correlations of GY and ground-based chlorophyll measurements (r = −0.07 to −0.17) during flowering to early grain filling and with CT (r = −0.13 to 0.70) under both water treatments were observed, while LAI showed a higher correlation with GY (r = 0.51 to 0.68) at the mid to late grain filling stages under full as compared to limited irrigation treatments, where low correlations (r = 0.08 to 0.09) were observed under both irrigation treatments (Figure 4 and Figure 5).

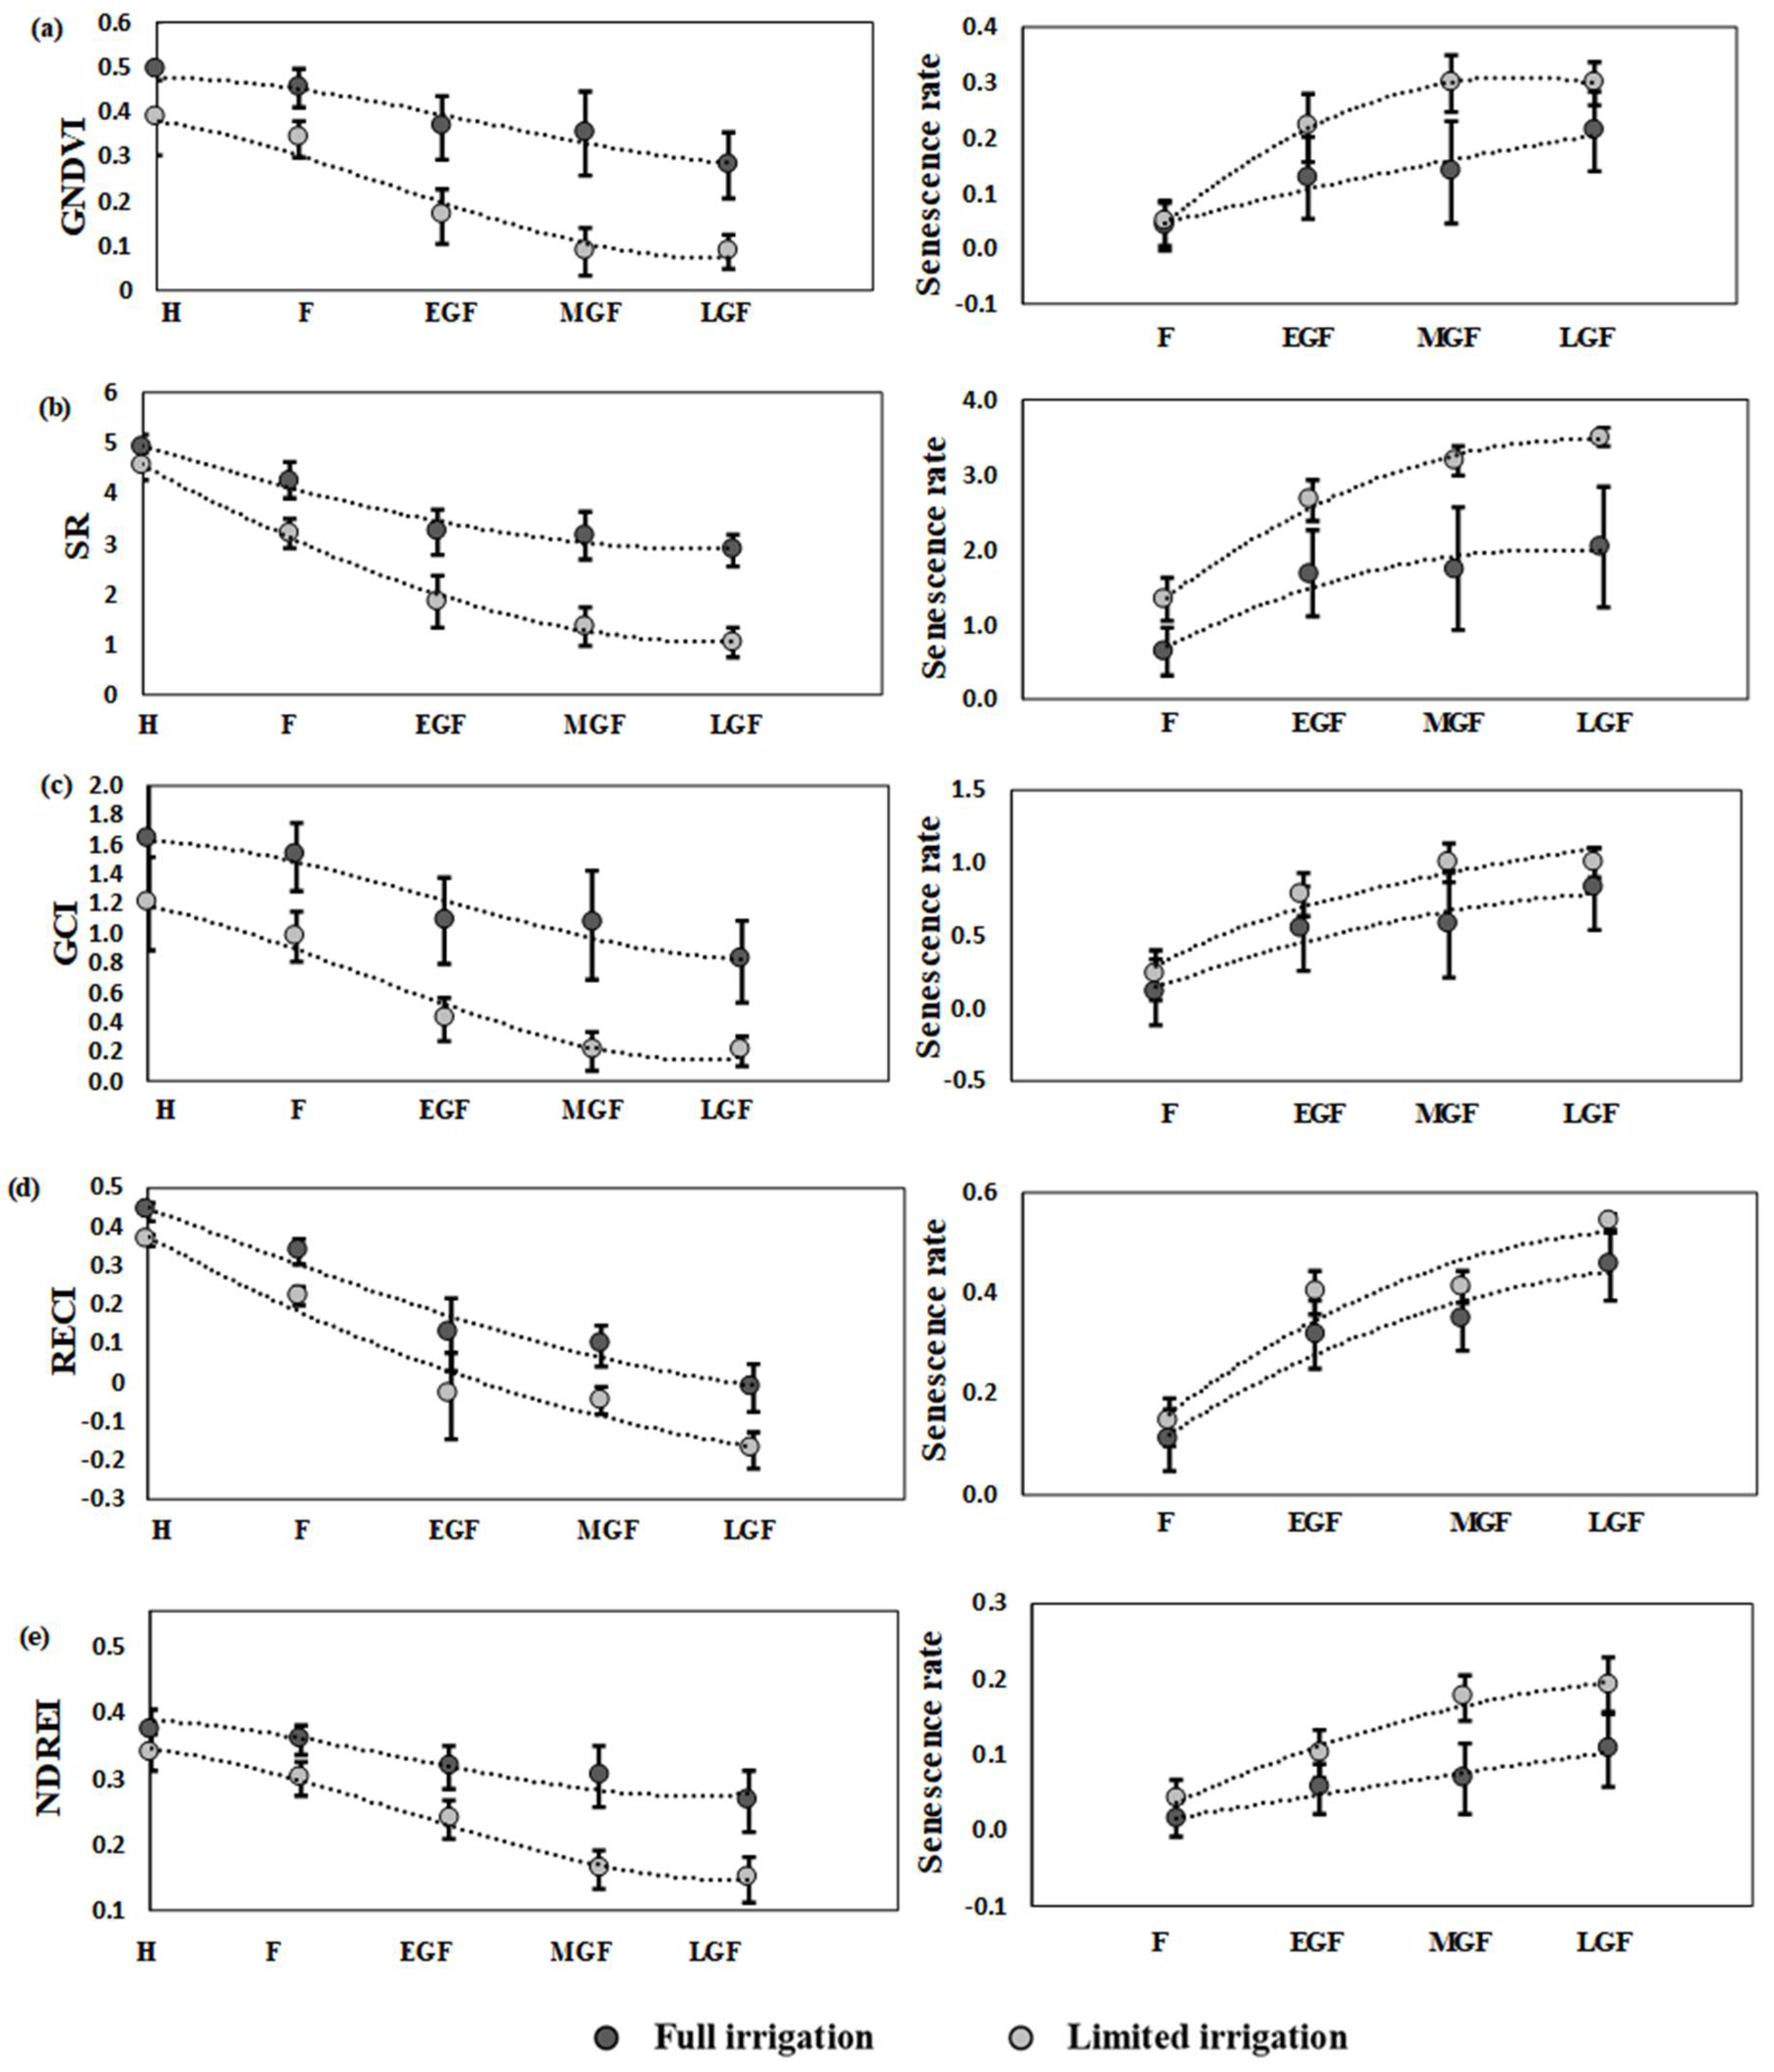
3.3. Dynamics and Interaction of SVIs during Different Growth Stages

The aggregated values of GNDVI, SR, GCI, NDREI, and RECI were highest at the heading stage under both full and limited irrigations (Figure 6). SVIs averaged from limited irrigation treatment were 10% to 20% lower at all five growth stages compared to full irrigation. Furthermore, SVIs under limited irrigation decreased rapidly after flowering compared with full irrigation. The correlation of SVIs recorded at different physiological stages provided temporal insight about plant phenology. Significant correlations (r = 0.27 to 0.68) observed between SVIs calculated at heading and during grain filling, indicated a strong link between the vegetative and maturation stages of plant growth especially in limited irrigation conditions (Figure 5). NDREI showed stronger correlations (r = 0.75 to 0.87) among growth stages compared with the other four SVIs under limited irrigation, indicating that NDREI can be used to predict the temporal growth status of the crop. Apart from the low values of SVIs during the heading to flowering stages under limited irrigation, KPS, TGW and GY were reduced by 3%, 10% and 24%, respectively (Figure 5 and Figure 7).

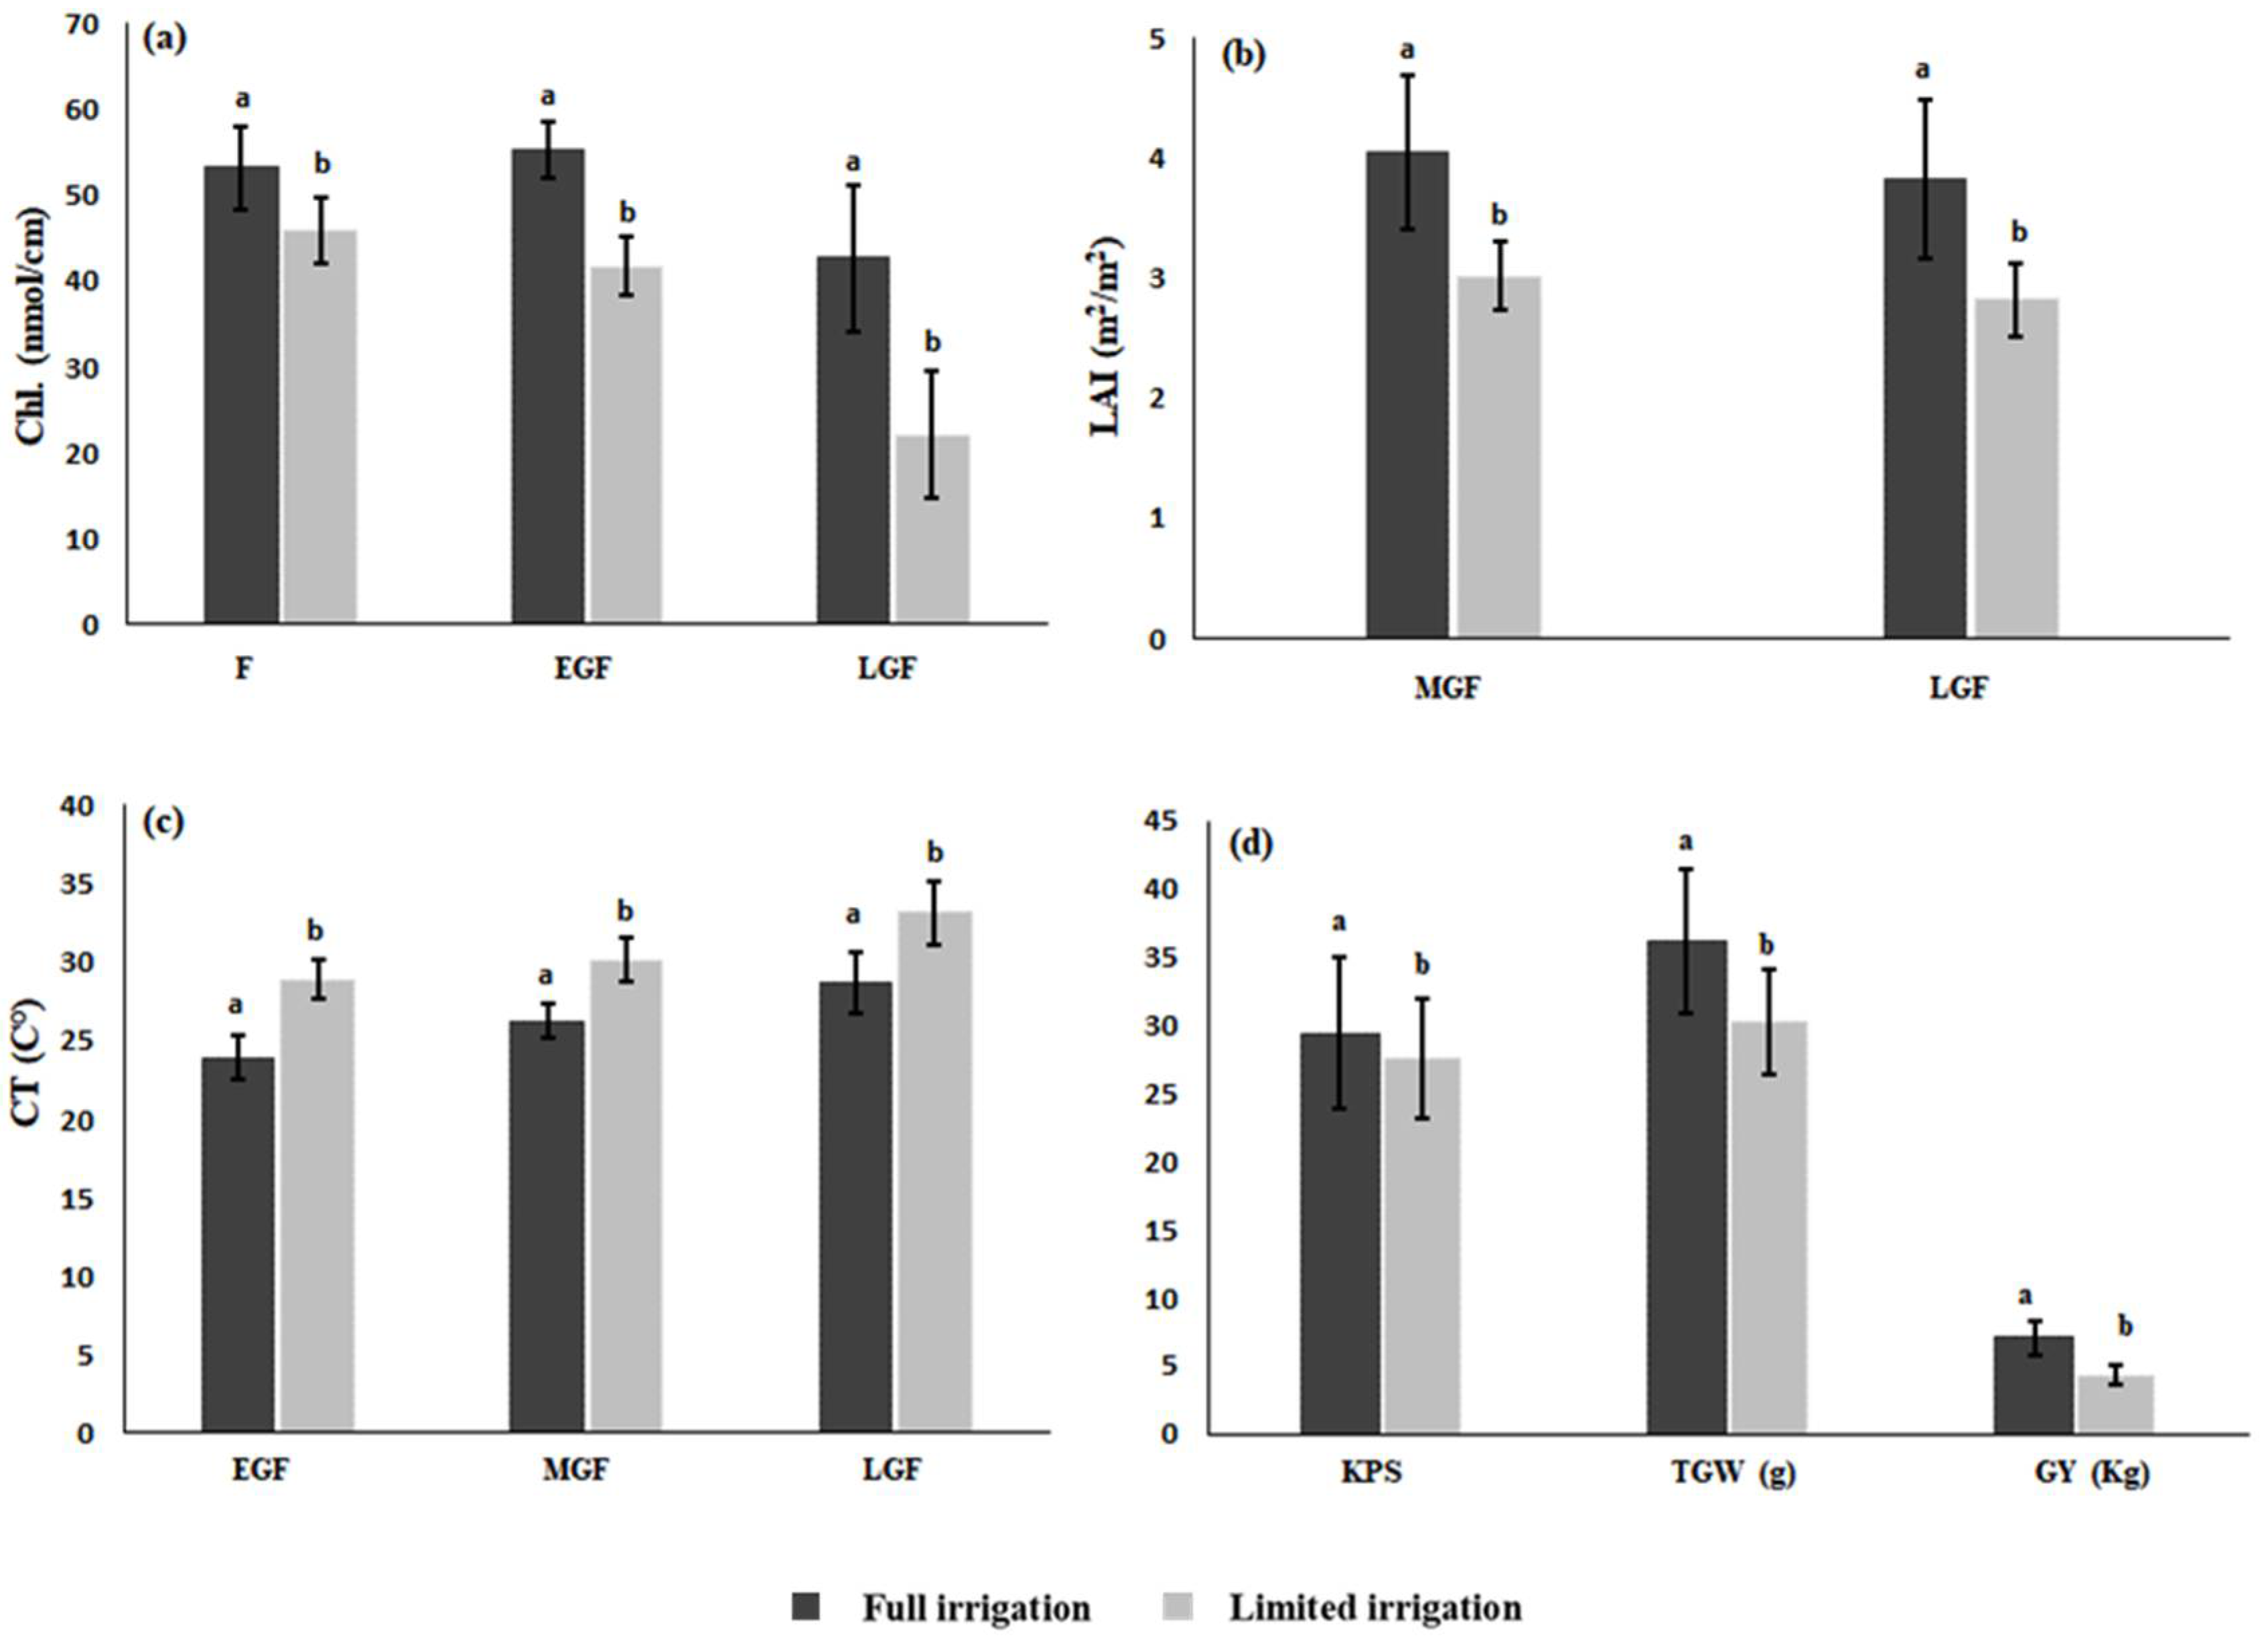
3.4. Impact of Senescence Rate on Yield and Performance of Genotypes

SVIs declined continuously from heading to maturity. Therefore, the senescence rates for each genotype under both irrigation treatments were calculated by subtracting the declining stage from the peak stage values (Figure 6). All five SVIs showed similar patterns of senescence under limited irrigation. There were 10% to 15% higher senescence rates compared to the full irrigation and led to 10 days earlier maturity and 24% less grain yield (Figure 6 and Figure 7). Principle component analysis (PCA) was conducted to visualize associations between senescence rate and yield traits (Figure 8). There were negative effects of high senescence rate on TGW and GY under both irrigation treatments as shown by a clear separation on the axes between yield-associated variables (TGW, GY) and senescence rate calculated from all five SVIs. Cultivars were evenly positioned in all quadrants. Genotypes positioned on the third and fourth quadrants were those with higher senescence rates. The cultivar positioned in the second quadrant had low senescence rates with stable TGW and GY. Some cultivars, such as Beijing 0045, Nongda 5181 and Zhongmai 175 selected from the second quadrant maintained TGW and GY with low senescence rates for all five SVIs under both treatments (Figure 8).

4. Discussion

4.1. Validation of SVI Data at Different Growth Stages

Several studies reported strong correlations between UAV-based NDVI and ground-based data collected from handheld sensors and demonstrated the application of UAV data for yield prediction [8,37,38,39,40,41]. Spectral vegetation indices reflect the physiological status of plants based on different wavelength band values. Under stress conditions, near infrared reflectance (NIR) decreases while red bands increase, thus SR provides information about green biomass under stress [38]. Gitelson et al. [32] described higher sensitivity of the green spectral band than the red band even at 60% yellowing of leaves. Therefore, GNDVI and GCI provided guidance for detection of green biomass and chlorophyll level. RECI was reported as a sensitive index of chlorophyll level during senescence because the red-edge band covers a wider range of chlorophyll levels than the red band [40]. This study also revealed a high correlation of UAV-derived RECI for leaf chlorophyll detected by SPAD at late grain filling (Figure 3). However, NDREI also showed strong correlations with chlorophyll and LAI, indicating that it could be used to explain the proportions of chlorophyll and green leaf area during senescence, especially under low irrigation condition (Figure 3).
Strong correlations were detected between SVIs and ground-measured physiological traits in both regression analyses (R2 = 0.69 to 0.78) and Pearson correlations (r = 0.55 to 0.78) at mid to late grain filling, whereas there were significant negative correlations (−0.43 to −0.76) between SVIs and CT (Figure 3, Figure 4 and Figure 5). Negative to positive correlations (r = −0.17 to 0.17) between UAV-based SVIs and chlorophyll measurements using handheld sensors were likely due to observation error during acquisition of ground-based data. The error could be due to the fact that ground-based observations are based on 5 to 10 plants, whereas UAV-derived SVIs were representative of the whole experimental unit. Lower correlations under limited irrigation indicated that hand-held data were collected from healthy representative parts, whereas SVIs were derived from whole experimental unit (Figure 4 and Figure 5). These results showed that SVIs derived from the UAV provided more accurate phenotypic values with much lower cost and less time, compared to data collected by hand-held devices. Thus, growth dynamics of crops can be predicted from SVI differences in contrasting environments.

4.2. Genotypic Variation and Traits Correlation

Since performance of a germplasm can be predicted thorough physiological behavior in specific growing environments, stable trait variation can be used for crop improvement [38,40,41,42,43,44,45,46]. Significant genotypic variations with high heritability were observed across treatments for SVIs, and ground-based physiological and yield traits. Significant impacts of these traits on grain yield were previously reported under different growing environments [11,39,40,41]. Drought tolerant genotypes use trade-offs through earlier yellowing of leaves to minimize yield loss under drought conditions [47]. Likewise, plants with a narrow leaf structure avoid excessive moisture loss during the milking to maturation stages [48,49]. Moreover, drought and heat resistant plants have cooler canopies than non-resistant plants [11]. Under limited irrigation condition, low NDREI and four other SVI measures after flowering indicated decreased canopy greenness due to breakdown of chlorophyll and have higher CT under limited irrigation conditions (Figure 6 and Figure 7). The consistently significant negative correlations between all SVI values and CT across treatments confirmed the use of image-based multispectral bands to detect genetic variation for cooler canopies with stay-green expression (Figure 4 and Figure 5). Strong relationships between ground sensor-based spectral vegetation indices and GY in diverse environments were reported previously [38,45]. In this study, UAV-based SVIs also exhibited significant correlations with yield traits in two irrigation treatments compared to ground-based measures of physiological traits. Thus, UAVs serve as a quick platform for precise phenotyping of crops to predict physiological variation over the season. Relatively low correlations with TGW indicated that there was less mobilization of nutrients to sink under severe drought [44] (Figure 4 and Figure 5). Whole-plot measurements derived through UAV imagery were more representative than with hand-held instruments measurements. These findings also confirmed the superiority of SVIs as predictors of yield traits under diverse conditions.

4.3. The Dynamics of SVIs Explained Interaction between Growth Stages

The level of spectral vegetative indices, especially during grain filling period, can give temporal insight about development stage for stay-green studies without phenological measures [14]. The maximum increase in SVIs for wheat canopy grown under limited irrigation was occurred at the heading stage but was lower than full irrigation (Figure 6). The sudden decline in SVIs after heading represents a trade-off to maintain GY under stress conditions [8,47]. Significant correlations among developmental stages under irrigated and drought conditions provided important information regarding potential time points that could effectively explain variation among germplasms for physiological attributes and senescence [8,39,50]. Under drought conditions, rapid canopy development during the vegetative phase has a vital role in avoiding GY penalty [14]. In this study, strong correlations with significant genotypic variation were observed among SVIs calculated at heading and grain filling under limited irrigation compared to full irrigation (Figure 4 and Figure 5). In particular, NDREI results more accurately predicted that the vegetative phase had a significant role in maintaining GY potential under limited irrigation conditions from ground-based observations as presented in earlier studies. These studies demonstrated that a lower use of available resources at the pre-heading to heading stages under drought conditions could lead to low canopy development and a strong association with a high rate of senescence [8,44].

4.4. Impact of Senescence Rate on Yield

SVIs have been used to predict the yield and explain senescence since they are reported for prediction of leaf chlorophyll and green leaf area during senescence [16,17,20,51]. Senescence rate provides information on the rate of breakdown important traits such as chlorophyll and green leaf area in specific environments. A fast senescence rate leads to low level of vegetation indices and a negative impact on yield related traits [8]. High levels of SVIs at physiological maturity reflect delayed senescence and thus higher mobilization of nutrients to sink during maturation [9,18]. The results indicated a rapid decline in SVI values after flowering in limited water conditions was due stress induced rapid senescence (Figure 6). PCA revealed strong negative correlations between SVI-based senescence rate and grain yield under both water treatments, but slightly higher correlations under limited irrigation (Figure 6 and Figure 8). Moreover, the rate of senescence was higher at the mid grain filling with a significant negative impact on grain yield (Figure 4 and Figure 5). Lower yield under drought conditions was due to a trade-off by plants for survival under continuous stress-induced senescence [14,52]. This was expected, as rapid senescence is a non-stay-green attribute [9,13]. As the red edge band covers a large wavelength, NDREI and RECI showed stronger correlations with all ground-based physiological traits compared to other SVIs. Therefore, NDREI could be used for future stay-green studies.

4.5. Cultivars with Low Senescence Rate

PCA showed a contrasting performance of genotypes for delayed senescence under both irrigation treatments (Figure 8). The majority of individuals were distributed in opposite quadrants of high senescence rate under full irrigation. A few genotypes had reduced senescence with high yield under severe drought. Some genotypes displayed the opposite behavior resulting lower grain yield. Cultivars such as Beijing 0045, Nongda 5181 and Zhongmai 175 with low senescence rate were selected maintaining TGW and GY across both limited and full irrigation environments (Figure 8). Results obtained from NDREI and other SVI data were consistent with field observations from many environments in northern China [34]. Previous experience was that these cultivars showed fast grain filling rates and consistently high yields under drought and heat conditions during the maturation period (unpublished data from the author’s lab). These cultivars with stay-green characteristics can be used as parents in the varietal improvement programs. Senescence rate calculated from UAV-based SVIs, especially NDREI during the grain filling stages can also be used to determine the genetic diversity of germplasm in order to increase the stability of yield potential of crops as previously reported using visual and SPAD-based ground measurements [9].

5. Conclusions

Five SVIs measured by using a UAV platform had the advantages of speed and accuracy over ground-based tools. A rapid decline in SVI values was observed from heading to late grain filling under limited irrigation, demonstrating high senescence rates with a negative impact on yield related traits. Moreover, SVIs especially NDREI, obtained from UAV was appraised to be more accurate than single plant values determined by ground-based observations. Additional detailed studies are required to refine image-based phenotyping of crops, especially in regard to improvement of sensors resolution and efficiency of image processing methods to minimize data noise.

Supplementary Materials

The following are available online at https://www.mdpi.com/2072-4292/10/6/809/s1.

Author Contributions

M.A.H. managed the UAV flights for aerial imagery, analyzed the data and wrote the paper under supervision of Z.H., M.Y. conducted ground-based field measurements, Y.X. managed and directed the trial. Y.X., A.R., X.X. and X.J. gave comments and suggestions to improve the manuscript.

Acknowledgments

We are grateful to R. A. McIntosh, Plant Breeding Institute, University of Sydney, for English editing of this manuscript. This work was funded by the National Key Project (2016YFD0101804-6), the National Natural Science Foundation of China (31671691), the National Key Technology R&D Program of China (2014BAD01B05), and the International Science and Technology Cooperation Program of China (2016YFE0108600).

Conflicts of Interest

There is no conflict of interest.

Abbreviations

ChlChlorophyll
CTCanopy temperature
EGFEarly grain filling
FFlowering
GCIGreen chlorophyll index
GNDVIGreen normalized difference vegetation index
KPSKernels per spike
GSGrowth stages
GYGrain yield
HHeading
LAILeaf area index
LGFLate grain filling
MGFMid grain filling
NDREINormalized difference red-edge index
RECIRed-edge chlorophyll index
SRSimple ratio
TGWThousand grain weight

References

  1. Ray, D.K.; Mueller, N.D.; West, P.C.; Foley, J.A. Yield trends are insufficient to double global crop production by 2050. PLoS ONE 2013, 8, e66428. [Google Scholar] [CrossRef] [PubMed]
  2. Reynolds, M.; Tattaris, M.; Cossani, C.M.; Ellis, M.; Yamaguchi-Shinozaki, K.; Pierre, C.S. Exploring genetic resources to increase adaptation of wheat to climate change. In Advances in Wheat Genetics: From Genome to Field: 12th International Wheat Genetics Symposium; Ogihara, Y., Takumi, S., Handa, H., Eds.; Springer: Tokyo, Japan, 2015; pp. 355–368. [Google Scholar]
  3. Lesk, C.; Rowhani, P.; Ramankutty, N. Influence of extreme weather disasters on global crop production. Nature 2016, 529, 84–87. [Google Scholar] [CrossRef] [PubMed]
  4. Mondal, S.; Singh, R.P.; Crossa, J.; Huerta-Espino, J.; Sharma, I.; Chatrath, R.; Singh, G.P.; Sohu, V.S.; Mavi, G.S.; Sukuru, V.S.P.; et al. Earliness in wheat: A key to adaptation under terminal and continual high temperature stress in south Asia. Field Crops Res. 2013, 151, 19–26. [Google Scholar] [CrossRef]
  5. Ma, D.; Sun, D.; Wang, C.; Ding, H.; Qin, H.; Hou, J.; Huang, X.; Xie, Y.; Guo, T. Physiological responses and yield of wheat plants in zinc-mediated alleviation of drought stress. Front. Plant Sci. 2017, 8, 860. [Google Scholar] [CrossRef] [PubMed]
  6. Vijayalakshmi, K.; Fritz, A.K.; Paulsen, G.M.; Bai, G.; Pandravada, S.; Gill, B.S. Modeling and mapping QTL for senescence-related traits in winter wheat under high temperature. Mol. Breed. 2010, 26, 163–175. [Google Scholar] [CrossRef]
  7. Chapman, S.C.; Cooper, M.; Hammer, G.L. Using crop simulation to generate genotype by environment interaction effects for sorghum in water-limited environments. Aust. J. Agric. Res. 2002, 53, 379–389. [Google Scholar] [CrossRef]
  8. Kyratzis, A.C.; Skarlatos, D.P.; Menexes, G.C.; Vamvakousis, V.F.; Katsiotis, A. Assessment of vegetation indices derived by UAV imagery for durum wheat phenotyping under a water limited and heat stressed mediterranean environment. Front. Plant Sci. 2017, 8, 1114. [Google Scholar] [CrossRef] [PubMed]
  9. Borrell, A.K.; van Oosterom, E.J.; Mullet, J.E.; George-Jaeggli, B.; Jordan, D.R.; Klein, P.E.; Hammer, G.L. Stay-green alleles individually enhance grain yield in sorghum under drought by modifying canopy development and water uptake patterns. New Phytol. 2014, 203, 817–830. [Google Scholar] [CrossRef] [PubMed]
  10. Dolferus, R. To grow or not to grow: A stressful decision for plants. Plant Sci. 2014, 229, 247–261. [Google Scholar] [CrossRef] [PubMed]
  11. Gautam, A.; Sai Prasad, S.V.; Jajoo, A.; Ambati, D. Canopy temperature as a selection parameter for grain yield and its components in durum wheat under terminal heat stress in late sown conditions. Agric. Res. 2015, 4, 238–244. [Google Scholar] [CrossRef]
  12. Pinto, R.S.; Lopes, M.S.; Collins, N.C.; Reynolds, M.P. Modelling and genetic dissection of stay-green under heat stress. Theor. Appl. Genet. 2016, 129, 2055–2074. [Google Scholar] [CrossRef] [PubMed]
  13. Borrell, A.K.; Mullet, J.E.; George-Jaeggli, B.; van Oosterom, E.J.; Hammer, G.L.; Klein, P.E.; Jordan, D.R. Drought adaptation of stay-green sorghum is associated with canopy development, leaf anatomy, root growth, and water uptake. J. Exp. Bot. 2014, 65, 6251–6263. [Google Scholar] [CrossRef] [PubMed]
  14. Lopes, M.S.; Reynolds, M.P. Stay-green in spring wheat can be determined by spectral reflectance measurements (normalized difference vegetation index) independently from phenology. J. Exp. Bot. 2012, 63, 3789–3798. [Google Scholar] [CrossRef] [PubMed]
  15. Deery, D.; Jimenez-Berni, J.; Jones, H.; Sirault, X.; Furbank, R. Proximal remote sensing buggies and potential applications for field-based phenotyping. Agronomy 2014, 4, 349–374. [Google Scholar] [CrossRef]
  16. Jin, X.; Li, Z.; Feng, H.; Xu, X.; Yang, G. Newly combined spectral indices to improve estimation of total leaf chlorophyll content in cotton. IEEE J. Sel. Top. Appl. Res. 2014, 7, 4589–4600. [Google Scholar] [CrossRef]
  17. Jin, X.; Yang, G.; Xu, X.; Yang, H.; Feng, H.; Li, Z.; Shen, J.; Lan, Y.; Zhao, C. Combined multi-temporal optical and radar parameters for estimating LAI and biomass in winter wheat using HJ and radarsar-2 data. Remote Sens. 2015, 7, 13251–13272. [Google Scholar] [CrossRef]
  18. Magney, T.S.; Eitel, J.U.; Huggins, D.R.; Vierling, L.A. Proximal NDVI derived phenology improves in-season predictions of wheat quantity and quality. Agric. For. Meteorol. 2016, 217, 46–60. [Google Scholar] [CrossRef]
  19. Tattaris, M.; Reynolds, M.P.; Chapman, S.C. A direct comparison of remote sensing approaches for high-throughput phenotyping in plant breeding. Front. Plant Sci. 2016, 7, 1131. [Google Scholar] [CrossRef] [PubMed]
  20. Rutkoski, J.; Poland, J.; Mondal, S.; Autrique, E.; Pérez, L.G.; Crossa, J.; Reynolds, M.; Singh, R. Canopy temperature and vegetation indices from high-throughput phenotyping improve accuracy of pedigree and genomic selection for grain yield in wheat. G3 Genes Genomes Genet. 2016, 6, 2799–2808. [Google Scholar] [CrossRef] [PubMed]
  21. Bendig, J.; Bolten, A.; Bennertz, S.; Broscheit, J.; Eichfuss, S.; Bareth, G. Estimating biomass of barley using crop surface models (csms) derived from UAV-based RGB imaging. Remote Sens. 2014, 6, 10395–10412. [Google Scholar] [CrossRef]
  22. Verger, A.; Vigneau, N.; Chéron, C.; Gilliot, J.-M.; Comar, A.; Baret, F. Green area index from an unmanned aerial system over wheat and rapeseed crops. Remote Sens. Environ. 2014, 152, 654–664. [Google Scholar] [CrossRef]
  23. Jin, X.; Liu, S.; Baret, F.; Hemerlé, M.; Comar, A. Estimates of plant density of wheat crops at emergence from very low altitude UAV imagery. Remote Sens. Environ. 2017, 198, 105–114. [Google Scholar] [CrossRef]
  24. Guillen-Climent, M.L.; Zarco-Tejada, P.J.; Berni, J.A.J.; North, P.R.J.; Villalobos, F.J. Mapping radiation interception in row-structured orchards using 3d simulation and high-resolution airborne imagery acquired from a UAV. Precis. Agric. 2012, 13, 473–500. [Google Scholar] [CrossRef]
  25. Sankaran, S.; Khot, L.R.; Carter, A.H. Field-based crop phenotyping: Multispectral aerial imaging for evaluation of winter wheat emergence and spring stand. Comput. Electron. Agric. 2015, 118, 372–379. [Google Scholar] [CrossRef]
  26. Li, L.; Zhang, Q.; Huang, D. A review of imaging techniques for plant phenotyping. Sensors 2014, 14, 20078–20111. [Google Scholar] [CrossRef] [PubMed]
  27. Liu, C.; Shang, J.; Vachon, P.W.; Mcnairn, H. Multiyear Crop Monitoring Using Polarimetric RADARSAT-2 Data. IEEE Trans. Geosci. Remote Sens. 2013, 51, 2227–2240. [Google Scholar] [CrossRef]
  28. Zhang, W.; Chen, E.; Li, Z.; Zhao, L.; Ji, Y.; Zhang, Y.; Liu, Z. Rape (Brassica napus L.) growth monitoring and mapping based on radarsat-2 time-series data. Remote Sens. 2018, 10, 206. [Google Scholar] [CrossRef]
  29. Potgieter, A.B.; George-Jaeggli, B.; Chapman, S.C.; Laws, K.; Suárez Cadavid, L.A.; Wixted, J.; Watson, J.; Eldridge, M.; Jordan, D.R.; Hammer, G.L. Multi-spectral imaging from an unmanned aerial vehicle enables the assessment of seasonal leaf area dynamics of sorghum breeding lines. Front. Plant Sci. 2017, 8, 1532. [Google Scholar] [CrossRef] [PubMed]
  30. Gómez-Candón, D.; De Castro, A.I.; López-Granados, F. Assessing the accuracy of mosaics from unmanned aerial vehicle (uav) imagery for precision agriculture purposes in wheat. Precis. Agric. 2014, 15, 44–56. [Google Scholar] [CrossRef]
  31. Haghighattalab, A.; Pérez, L.G.; Mondal, S.; Singh, D.; Schinstock, D.; Rutkoski, J.; Ortiz-Monasterio, I.; Singh, R.P.; Goodin, D.; Poland, J. Application of unmanned aerial systems for high throughput phenotyping of large wheat breeding nurseries. Plant Methods 2016, 12, 35. [Google Scholar] [CrossRef] [PubMed]
  32. Gitelson, A.A.; Gritz, Y.; Merzlyak, M.N. Relationships between leaf chlorophyll content and spectral reflectance and algorithms for non-destructive chlorophyll assessment in higher plant leaves. J. Plant Physiol. 2003, 160, 271–282. [Google Scholar] [CrossRef] [PubMed]
  33. Gitelson, A.A.; Viña, A.; Ciganda, V.; Rundquist, D.C.; Arkebauer, T.J. Remote estimation of canopy chlorophyll content in crops. Geophys. Res. Lett. 2005, 32. [Google Scholar] [CrossRef]
  34. Gao, F.; Ma, D.; Yin, G.; Rasheed, A.; Dong, Y.; Xiao, Y.; Xia, X.; Wu, X.; He, Z. Genetic progress in grain yield and physiological traits in chinese wheat cultivars of Southern Yellow and Huai Valley since 1950. Crop Sci. 2017, 57, 760–773. [Google Scholar] [CrossRef]
  35. R Core Team. R: A Language and Environment for Statistical Computing; R Foundation for Statistical Computing: Vienna, Austria, 2016. [Google Scholar]
  36. Sehgal, D.; Skot, L.; Singh, R.; Srivastava, R.K.; Das, S.P.; Taunk, J.; Sharma, P.C.; Pal, R.; Raj, B.; Hash, C.T.; et al. Exploring potential of pearl millet germplasm association panel for association mapping of drought tolerance traits. PLoS ONE 2015, 10, e0122165. [Google Scholar] [CrossRef] [PubMed] [Green Version]
  37. Gizaw, S.A.; Garland-Campbell, K.; Carter, A.H. Use of spectral reflectance for indirect selection of yield potential and stability in Pacific Northwest winter wheat. Field Crops Res. 2016, 196, 199–206. [Google Scholar] [CrossRef]
  38. Duan, T.; Chapman, S.; Guo, Y.; Zheng, B. Dynamic monitoring of NDVI in wheat agronomy and breeding trials using an unmanned aerial vehicle. Field Crops Res. 2017, 210, 71–80. [Google Scholar] [CrossRef]
  39. Gutierrez, M.; Reynolds, M.P.; Raun, W.R.; Stone, M.L.; Klatt, A.R. Spectral water indices for assessing yield in elite bread wheat genotypes under well-irrigated, water-stressed, and high-temperature conditions. Crop Sci. 2010, 50, 197–214. [Google Scholar] [CrossRef]
  40. Sharma, L.K.; Bu, H.; Denton, A.; Franzen, D.W. Active-optical sensors using red NDVI compared to red edge NDVI for prediction of corn grain yield in North Dakota, U.S.A. Sensors 2015, 15, 27832–27853. [Google Scholar] [CrossRef] [PubMed]
  41. Christopher, J.T.; Christopher, M.J.; Borrell, A.K.; Fletcher, S.; Chenu, K. Stay-green traits to improve wheat adaptation in well-watered and water-limited environments. J. Exp. Bot. 2016, 67, 5159–5172. [Google Scholar] [CrossRef] [PubMed]
  42. Montazeaud, G.; Karatoğma, H.; Özturk, I.; Roumet, P.; Ecarnot, M.; Crossa, J.; Özer, E.; Özdemir, F.; Lopes, M.S. Predicting wheat maturity and stay–green parameters by modeling spectral reflectance measurements and their contribution to grain yield under rainfed conditions. Field Crops Res. 2016, 196, 191–198. [Google Scholar] [CrossRef]
  43. Montesinos-López, O.A.; Montesinos-López, A.; Crossa, J.; de los Campos, G.; Alvarado, G.; Mondal, S.; Rutkoski, J.; González-Pérez, L.; Burgueño, J. Predicting grain yield using canopy hyperspectral reflectance in wheat breeding data. Plant Methods 2017, 13, 4. [Google Scholar] [CrossRef] [PubMed]
  44. Gaju, O.; Reynolds, M.P.; Sparkes, D.L.; Mayes, S.; Ribas-Vargas, G.; Crossa, J.; Foulkes, M.J. Relationships between physiological traits, grain number and yield potential in a wheat DH population of large spike phenotype. Field Crops Res. 2014, 164, 126–135. [Google Scholar] [CrossRef]
  45. Pintó-Marijuan, M.; Munné-Bosch, S. Photo-oxidative stress markers as a measure of abiotic stress-induced leaf senescence: Advantages and limitations. J. Exp. Bot. 2014, 65, 3845–3857. [Google Scholar] [CrossRef] [PubMed]
  46. Tardieu, F.; Tuberosa, R. Dissection and modelling of abiotic stress tolerance in plants. Curr. Opin. Plant Biol. 2010, 13, 206–212. [Google Scholar] [CrossRef] [PubMed]
  47. He, J.; Du, Y.-L.; Wang, T.; Turner, N.C.; Yang, R.-P.; Jin, Y.; Xi, Y.; Zhang, C.; Cui, T.; Fang, X.-W.; et al. Conserved water use improves the yield performance of soybean (Glycine max (L.) Merr.) under drought. Agric. Water Manag. 2017, 179, 236–245. [Google Scholar] [CrossRef]
  48. Yang, G.; Liu, J.; Zhao, C.; Li, Z.; Huang, Y.; Yu, H.; Xu, B.; Yang, X.; Zhu, D.; Zhang, X.; et al. Unmanned aerial vehicle remote sensing for field-based crop phenotyping: Current status and perspectives. Front. Plant Sci. 2017, 8, 1111. [Google Scholar] [CrossRef] [PubMed]
  49. Haghighattalab, A.; Crain, J.; Mondal, S.; Rutkoski, J.; Singh, R.P.; Poland, J. Application of geographically weighted regression to improve grain yield prediction from unmanned aerial system imagery. Crop Sci. 2017, 57, 2478–2489. [Google Scholar] [CrossRef]
  50. Zhang, Y.; Xu, W.; Wang, H.; Dong, H.; Qi, X.; Zhao, M.; Fang, Y.; Gao, C.; Hu, L. Progress in genetic improvement of grain yield and related physiological traits of Chinese wheat in Henan province. Field Crops Res. 2016, 199, 117–128. [Google Scholar] [CrossRef]
  51. Gourdji, S.M.; Mathews, K.L.; Reynolds, M.; Crossa, J.; Lobell, D.B. An assessment of wheat yield sensitivity and breeding gains in hot environments. Process. R. Soc. B Biol. Sci. 2013, 280, 20122190. [Google Scholar] [CrossRef] [PubMed]
  52. Mwadzingeni, L.; Shimelis, H.; Tesfay, S.; Tsilo, T.J. Screening of bread wheat genotypes for drought tolerance using phenotypic and proline analyses. Front. Plant Sci. 2016, 7, 1276. [Google Scholar] [CrossRef] [PubMed]
Figure 1. (a) Location of field trial (b) unmanned aerial vehicle (UAV) Platform and (c) orthomosaic images generated at mid grain filling stage.
Remotesensing 10 00809 g001
Figure 2. A workflow diagram of data acquisition and extraction methodology.
Remotesensing 10 00809 g002
Figure 3. Linear regressions among spectral vegetative indices (SVIs); (a) green normalized difference vegetation index (GNVDI); (b) simple ratio (SR); (c) green chlorophyll index (GCI); (d) red-edge chlorophyll index (RECI); (e) normalized difference red-edge index (NDREI) and corresponding physiological traits derived from UAV multispectral imagery at mid to late grain filling stage and ground-based sensors under two irrigation treatments. GNDVI, green normalized difference vegetation index; SR, simple ratio; GCI, green chlorophyll index; RECI, red-edge chlorophyll index; NDREI, normalized difference red-edge index; Chl., chlorophyll; LAI, leaf area index; CT, canopy temperature.
Remotesensing 10 00809 g003
Figure 4. Correlation coefficients among SVIs, and physiological and yield traits obtained under full irrigation treatment from heading to late grain filling at p ≤ 0.05. Intensity of two colours indicate the strength of both positive and negative r values. H, heading; F, flowering; EGF, early grain filling; MGF, mid grain filling; LGF, late grain filling; GNDVI, green normalized difference vegetation index; SR, simple ratio; GCI, green chlorophyll index; RECI, red-edge chlorophyll index; NDREI, normalized difference red-edge index; Chl., chlorophyll; LAI, leaf area index; CT, canopy temperature; KPS, kernels per spike; TGW, thousand grain weight; GY, grain yield.
Remotesensing 10 00809 g004
Figure 5. Correlation coefficients among SVIs, and physiological and yield traits obtained under limited irrigation treatment from heading to late grain filling at p ≤ 0.05. Intensity of two colors indicate the strength of both positive and negative r values. For abbreviations see footnote of Figure 4.
Remotesensing 10 00809 g005
Figure 6. SVIs on word from heading stage and senescence rate calculated from each SVI under two irrigation treatments. (ae) illustrate declines in GNDVI, SR, GCI, RECI and NDREI after heading and senescence rates estimated from the SVIs values at four-time points under two treatments. For abbreviations see footnote of Figure 4. Measurements were made 10 days earlier in limited irrigation treatment.
Remotesensing 10 00809 g006
Figure 7. Measurements of physiological attributes: Chl. (a), LAI (b), CT (c) and yield (d) under full and limited irrigation conditions. Alphabets indicate difference between two treatments and error bars show standard deviation of mean data from 32 genotypes. For abbreviations see footnote of Figure 4.
Remotesensing 10 00809 g007
Figure 8. Biplots results from principle component analysis (PCA) of senescence rate calculated from SVIs and yield traits under both irrigation treatments. Sub figures (ae) illustrate the PCA for GNDVI, SR, GCI, RECI and NDREI derived senescence rates, respectively, under two treatments. Different color lines represent the variables and blue circles for genotypes. For abbreviations see footnote of Figure 4.
Remotesensing 10 00809 g008
Table 1. Flight and yield-related ground data acquiring schedule.
Time PointGrowth StageZadok’s StageNumber of FlightsAltitudeGround Data
1HeadingGS-57340 m
2FloweringGS-65330 mChl.
3Early grain fillingGS-73330 mChl., CT
4Mid grain fillingGS-85230 mChl., CT, LAI
5Late grain fillingGS-91330 mChl., CT, LAI
6Maturity no KPS, TGW, GY
Chl., chlorophyll; CT, canopy temperature; LAI, Leaf area index; KPS, kernels per spike; GS, growth stage; TGW, thousand grain weight; GY, grain yield. Recording stages for limited irrigation treatment were 10 days earlier than for the full irrigation.
Table 2. Spectral vegetation indices used in this study to evaluate growth stage.
SVIBandApplicationReference
GNDVI(RNIR − Rgreen)/ (RNIR + Rgreen)Greenness, LAI[32]
SRRNIR/RredBiomass, LAI[32]
GCI(RNIR/Rgreen) − 1Chlorophyll[33]
RECI(RNIR/Rred edge) − 1Chlorophyll[33]
NDREI(Rred-edge − Rgreen)/ (Rred-edge − Rgreen)Greenness
Acronyms: GNDVI, green normalized difference vegetation index; SR, simple ratio; GCI, green chlorophyll index; RECI, red-edge chlorophyll index; NDREI, Normalized difference red-edge index; LAI, Leaf area index.
Table 3. Significance test and heritability of tested traits.
TraitGenotypeTreatmentG × EH2H2
F. ValueF. ValueF. ValueFull IrrigationLimited Irrigation
GNDVI.H19.61 ***240.08 ***3.01 **0.970.94
GNDVI.F8.42 ***908.61 ***1.94 *0.960.85
GNDVI.EGF3.20 ***715.80 ***1.140.830.74
GNDVI.MGF2.09 *962.91 ***1.190.750.75
GNDVI.LGF2.00 *920.09 ***1.87 *0.800.71
SR.H11.285 ***114.22 ***1.96 *0.930.93
SR.F5.90 ***1193.27 ***1.550.930.83
SR.EGF2.72 **973.75 ***1.410.740.69
SR.MGF1.71 *847.64 ***1.380.690.65
SR.LGF2.09 *1169.01 ***1.83 *0.690.69
GCI.H19.57 ***267.09 ***3.58 ***0.970.95
GCI.F9.72 ***1024.75 ***2.61 **0.960.85
GCI.EGF3.08 ***700.30 ***1.500.820.76
GCI.MGF2.37 **851.83 ***1.560.770.74
GCI.LGF2.44 **819.46 ***2.38 **0.810.70
RECI.H13.46 ***465.85 ***3.05 ***0.970.90
RECI.F13.65 ***735.97 ***3.16 ***0.970.88
RECI.EGF3.81 ***738.74 ***1.81 *0.850.78
RECI.MGF2.52 **662.47 ***1.470.800.79
RECI.LGF3.13 ***995.91 ***2.39 **0.830.84
NDREI.H3.13367.76 ***2.85 **0.910.90
NDREI.F28.94 ***582.26 ***1.200.900.83
NDREI.EGF6.71 ***563.87 ***0.920.740.69
NDREI.MGF4.24 ***1031.39 ***1.190.690.65
NDREI.LGF2.123 **640.66 ***1.72 *0.690.69
Chl.F1.762 *181.83 ***1.260.810.82
Chl.EGF6.33 ***1576.50 ***1.450.880.91
Chl.LGF4.45 ***590.04 ***1.340.860.84
CT.EGF3.38 ***1243.28 ***1.370.770.89
CT.MGF1.31598.65 ***0.670.640.65
CT.LGF3.32 ***549.17 ***2.17 **0.690.86
LAI.MGF3.83 ***405.43 ***1.74 *0.840.87
LAI.LGF6.88 ***527.30 ***3.61 ***0.900.84
KPS7.41 ***14.28 **1.66 *0.920.87
TGW12.28 ***296.60 ***1.600.880.95
GY2.72 **574.02 ***0.980.750.76
*, **, ***, significant at p ≤ 0.05, p ≤ 0.001 and p ≤ 0.0001, respectively. H, heading; F, flowering; EGF, early grain filling; MGF, mid grain filling; LGF, late grain filling; GNDVI, green normalized difference vegetation index; SR, simple ratio; GCI, green chlorophyll index; RECI, red-edge chlorophyll index; NDREI, normalized difference red-edge index; Chl., chlorophyll; LAI, leaf area index; CT, canopy temperature; KPS, kernels per spike; TGW, thousand grain weight; GY, grain yield.

