Article

Evaluation of Climate Change Impacts on Wetland Vegetation in the Dunhuang Yangguan National Nature Reserve in Northwest China Using Landsat Derived NDVI

1
Department of Geography and the Environment, University of North Texas, Denton, TX 76203, USA
2
Dunhuang Yangguan National Nature Reserve Administration and Management Bureau, Dunhuang 736200, Gansu, China
3
Yangguan Museum, Dunhuang 736200, Gansu, China
4
College of Resources and Environmental Sciences, China Agricultural University, Beijing 100193, China
5
Institute of Remote Sensing and Digital Earth, Chinese Academy of Sciences, Beijing 100094, China
*
Author to whom correspondence should be addressed.
Remote Sens. 2018, 10(5), 735; https://doi.org/10.3390/rs10050735
Submission received: 27 March 2018 / Revised: 26 April 2018 / Accepted: 7 May 2018 / Published: 10 May 2018
(This article belongs to the Special Issue Remote Sensing of Land-Atmosphere Interactions)

Abstract

:
Based on 541 Landsat images between 1988 and 2016, the normalized difference vegetation indices (NDVIs) of the wetland vegetation at Xitugou (XTG) and Wowachi (WWC) inside the Dunhuang Yangguan National Nature Reserve (YNNR) in northwest China were calculated for assessing the impacts of climate change on wetland vegetation in the YNNR. It was found that the wetland vegetation at the XTG and WWC had both shown a significant increasing trend in the past 20–30 years and the increase in both the annual mean temperature and annual peak snow depth over the Altun Mountains led to the increase of the wetland vegetation. The influence of the local precipitation on the XTG wetland vegetation was greater than on the WWC wetland vegetation, which demonstrates that in extremely arid regions, the major constraint to the wetland vegetation is the availability of water in soils, which is greatly related to the surface water detention and discharge of groundwater. At both XTG and WWC, the snowmelt from the Altun Mountains is the main contributor to the groundwater discharge, while the local precipitation plays a lesser role in influencing the wetland vegetation at the WWC than at the XTG, because the wetland vegetation grows on a relatively flat terrain at the WWC, while it grows on a stream channel at the XTG.

Graphical Abstract

1. Introduction

Although scientists may not fully understand the natural variability of the climate, one fact remains indisputable related to the current climate change, namely, that the temperatures during the end of the 20th century were higher than they were at any time during the last millennium and the latter half of the 20th century was perhaps one of the warmest 50-year periods during the past several millennia [1,2,3]. The intensity and spatial distribution of precipitation also changed as a result of the increased atmospheric water vapor due to global warming [4,5], but the changes in the precipitation regime are neither spatially nor temporally uniform [6,7]. Some studies have shown that wet regions have become wetter and dry regions have become drier [8]. It was found that the precipitation increased in high latitudes in the Northern Hemisphere and decreased in China, Australia, and the Small Island States in the Pacific Ocean. Nevertheless, climate change has produced significant impacts on almost all the landscapes and ecosystems on Earth, including the wetlands [9,10,11,12].
Wetlands are one of the most productive terrestrial ecosystems. As an important component of the wetland ecosystem, the wetland vegetation plays a crucial role in the ecological functions of wetland environments [13,14]; it can provide habitats for wildlife and livestock [15,16], buffer the transportation and deposition of sediments, filter pollutants from contaminated water [14,17], and impact the local hydrological and biogeochemical cycle. On the other hand, wetland vegetation can be served as a health index of the wetland ecosystem, because the degradation of a wetland ecosystem will be directly reflected in the decreased productivity and even mortality of the wetland vegetation.
Climate change associated with increased air temperature, atmospheric water vapor, and carbon dioxide and other greenhouse gases, has and will continuously create significant impacts on the wetlands. A number of studies have been carried out to assess the climate change impacts on the coastal wetlands [10,11,12], alpine and high latitude, polar wetlands, or peatlands, which are critical for storing CO2 and other greenhouse gases [12]. However, to our knowledge, few studies have focused on the wetlands in the arid and semi-arid regions, not to mention the wetlands in the extremely arid environment, such as Dunhuang (long-term average annual precipitation is less than 50 mm) in northwest China which is the research area of this study. One possible reason is that wetlands in dry regions are very scarce, but wetlands do exist in some arid regions where the groundwater is abundant, and they play a very important role in the local ecosystem, the ecological functions, the water resources and water quality, and the wildlife habitat, and affect the population living in the areas. Since the normalized difference vegetation index (NDVI) was first proposed in the 1970s [18,19,20], it has been widely used for assessing ecological responses to environmental change, and the impacts of climate change and anthropogenic activities on vegetation and ecosystem [21,22,23,24,25,26,27,28,29,30,31,32,33,34,35,36,37,38,39,40,41,42,43]. Therefore, this study aims to use NDVI derived from Landsat images in the near-infrared and red channels for evaluating the climate change impacts on the wetlands in the extremely arid region in northwest China. The results drawn from this study may shed some light on our understanding of climate change impacts on the wetlands in the extremely arid areas, and thereby offering a scientific basis for an effective protection and management of these precious ecosystems under current climate change.

2. Study Area and Data
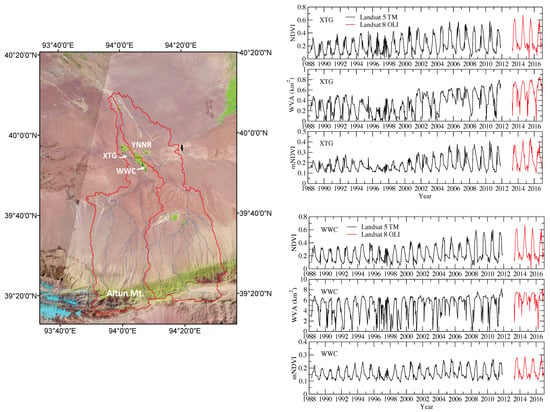
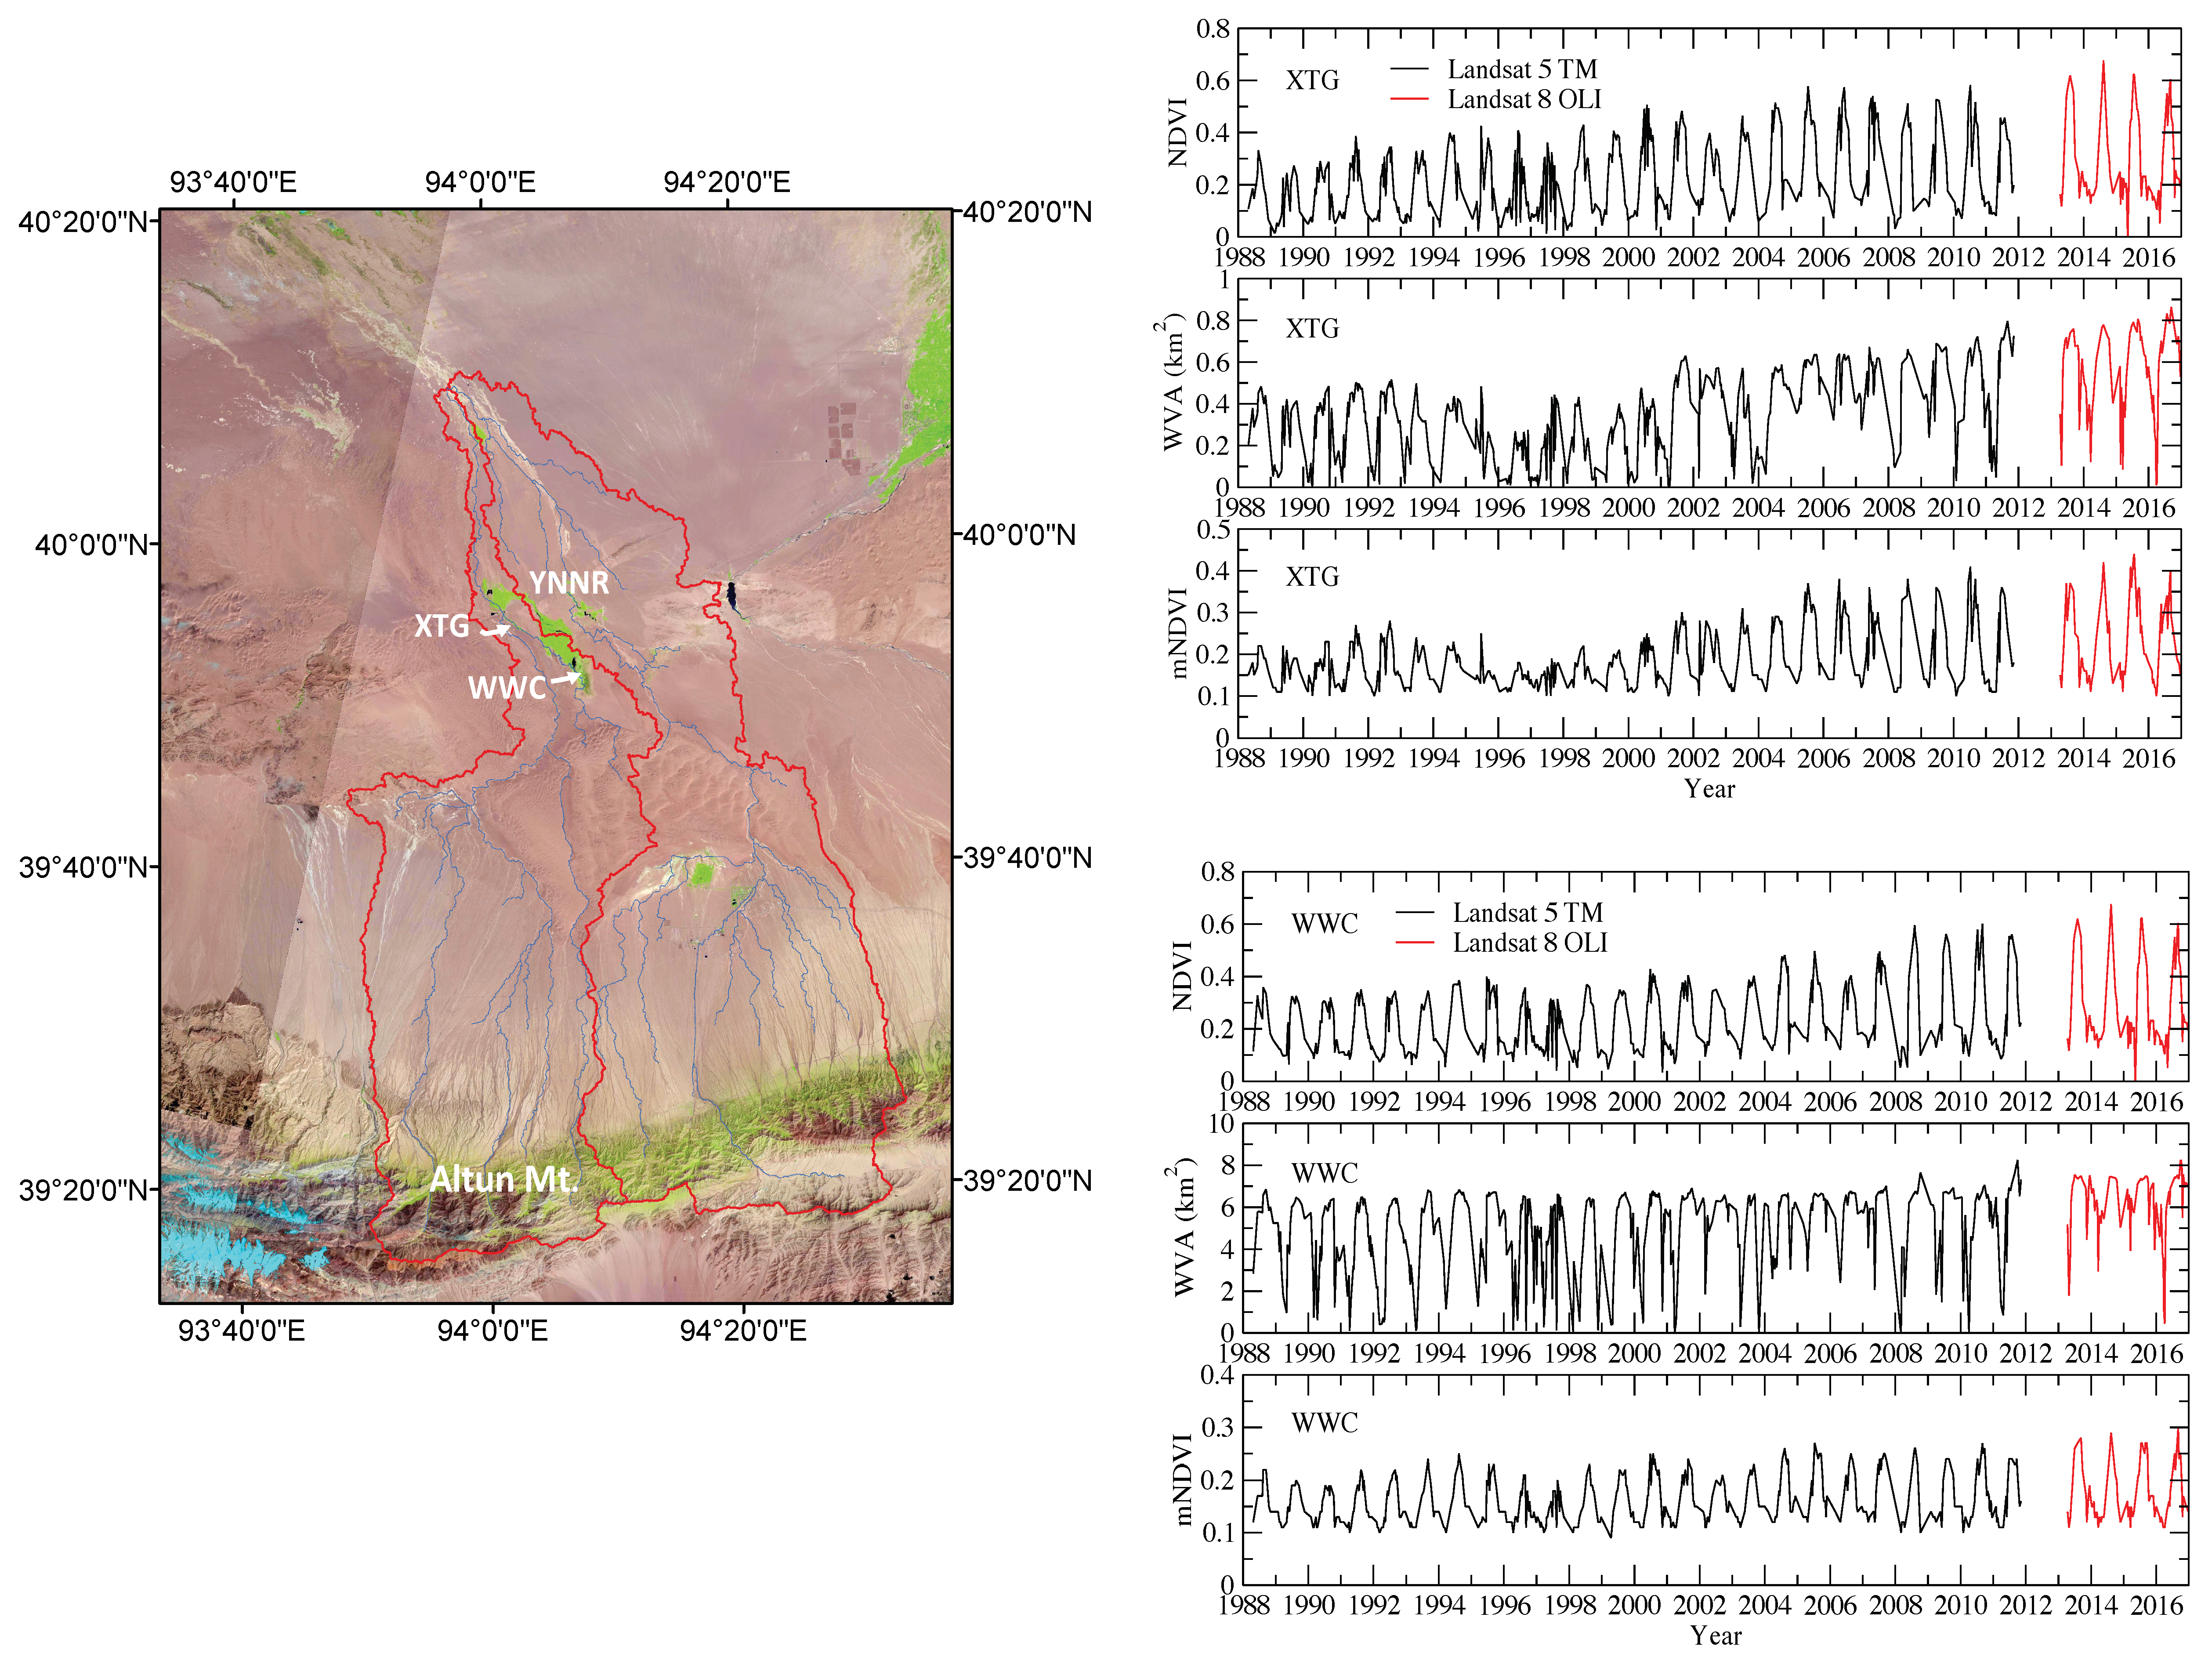
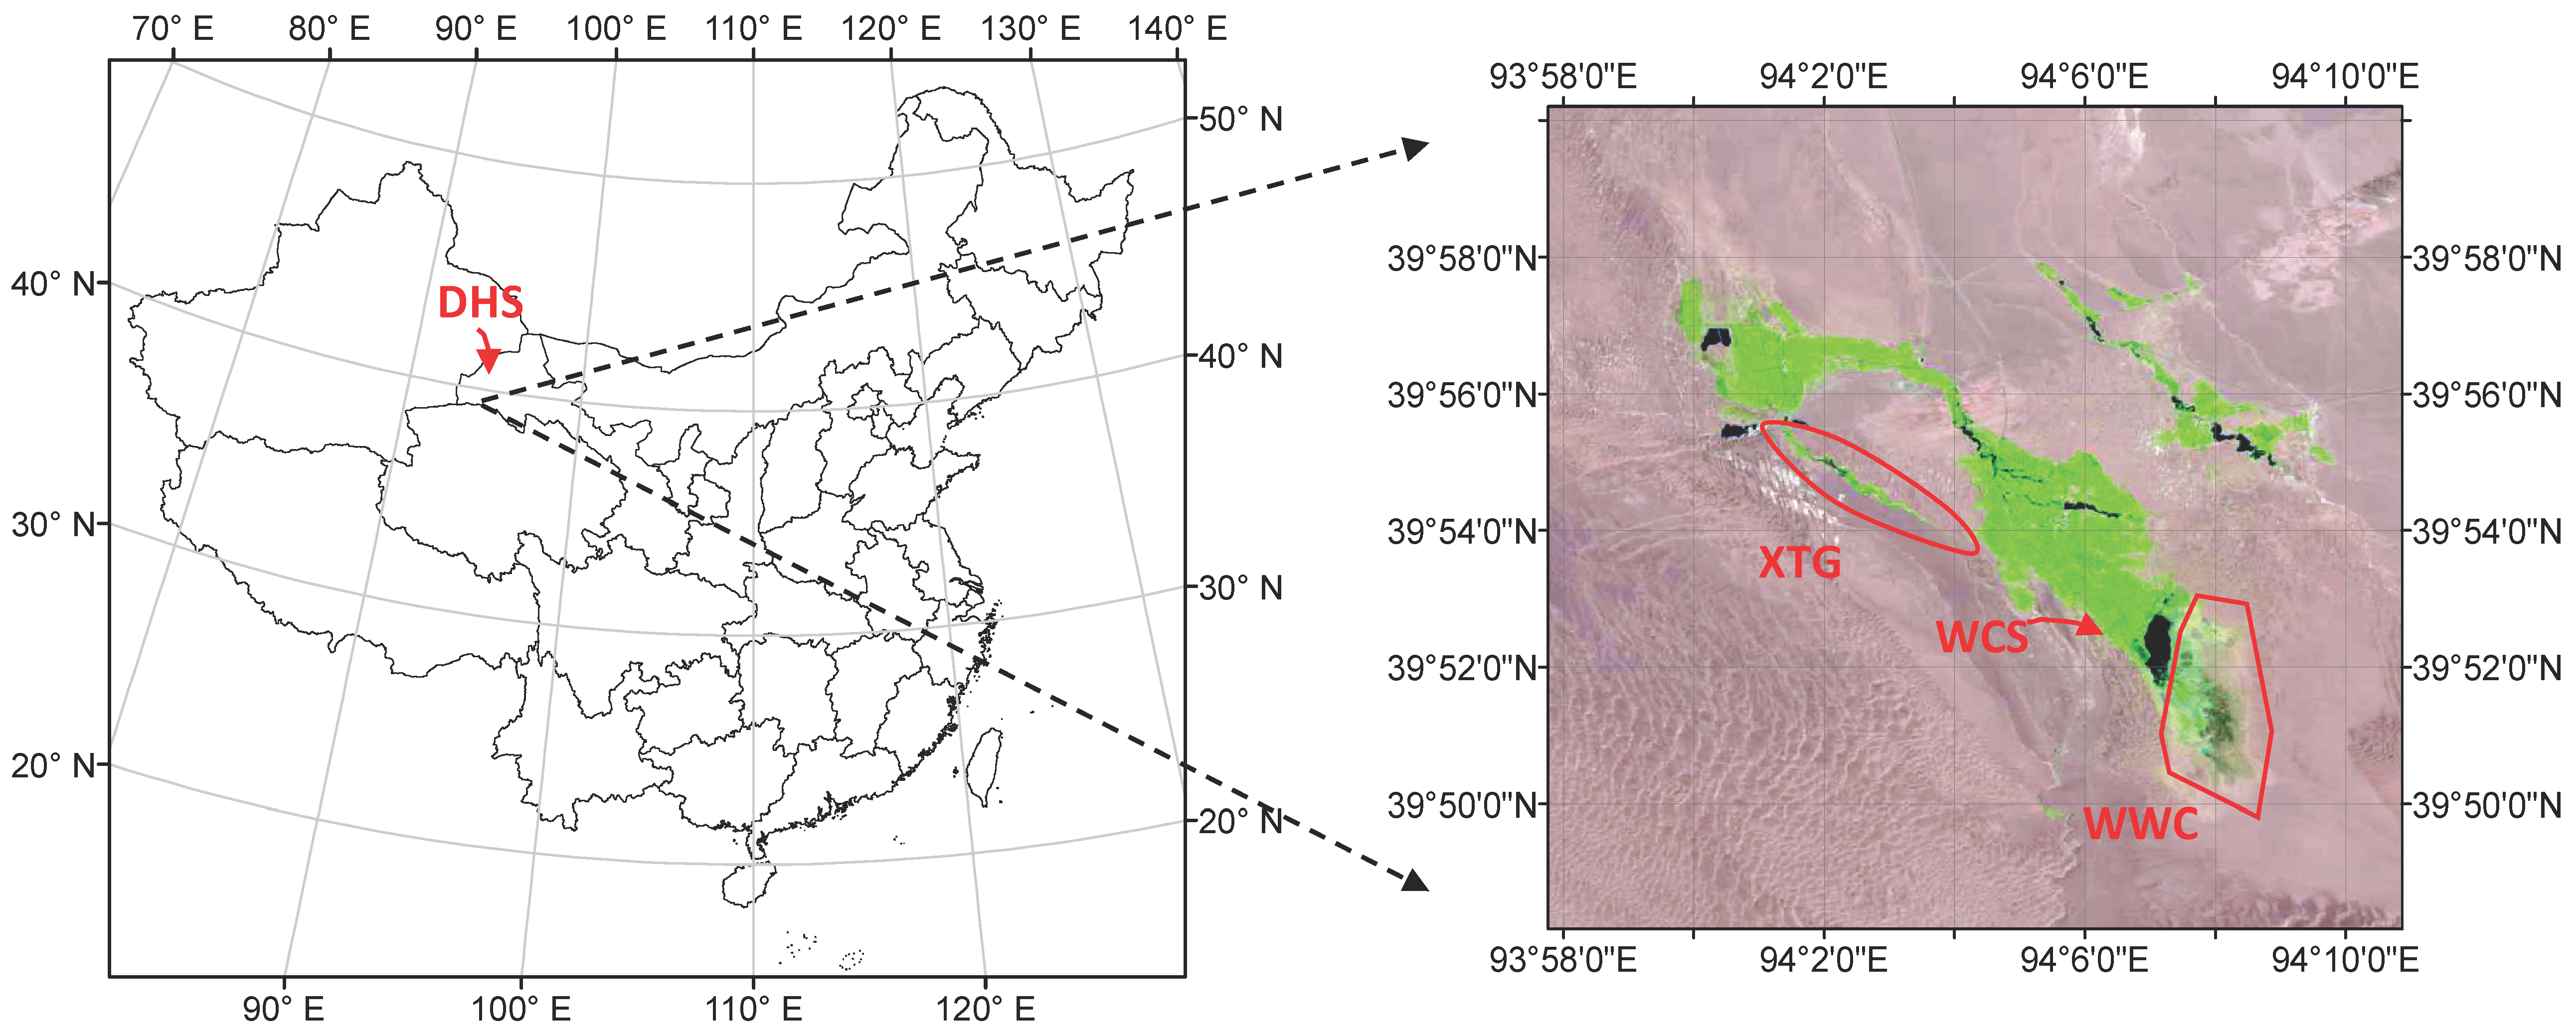
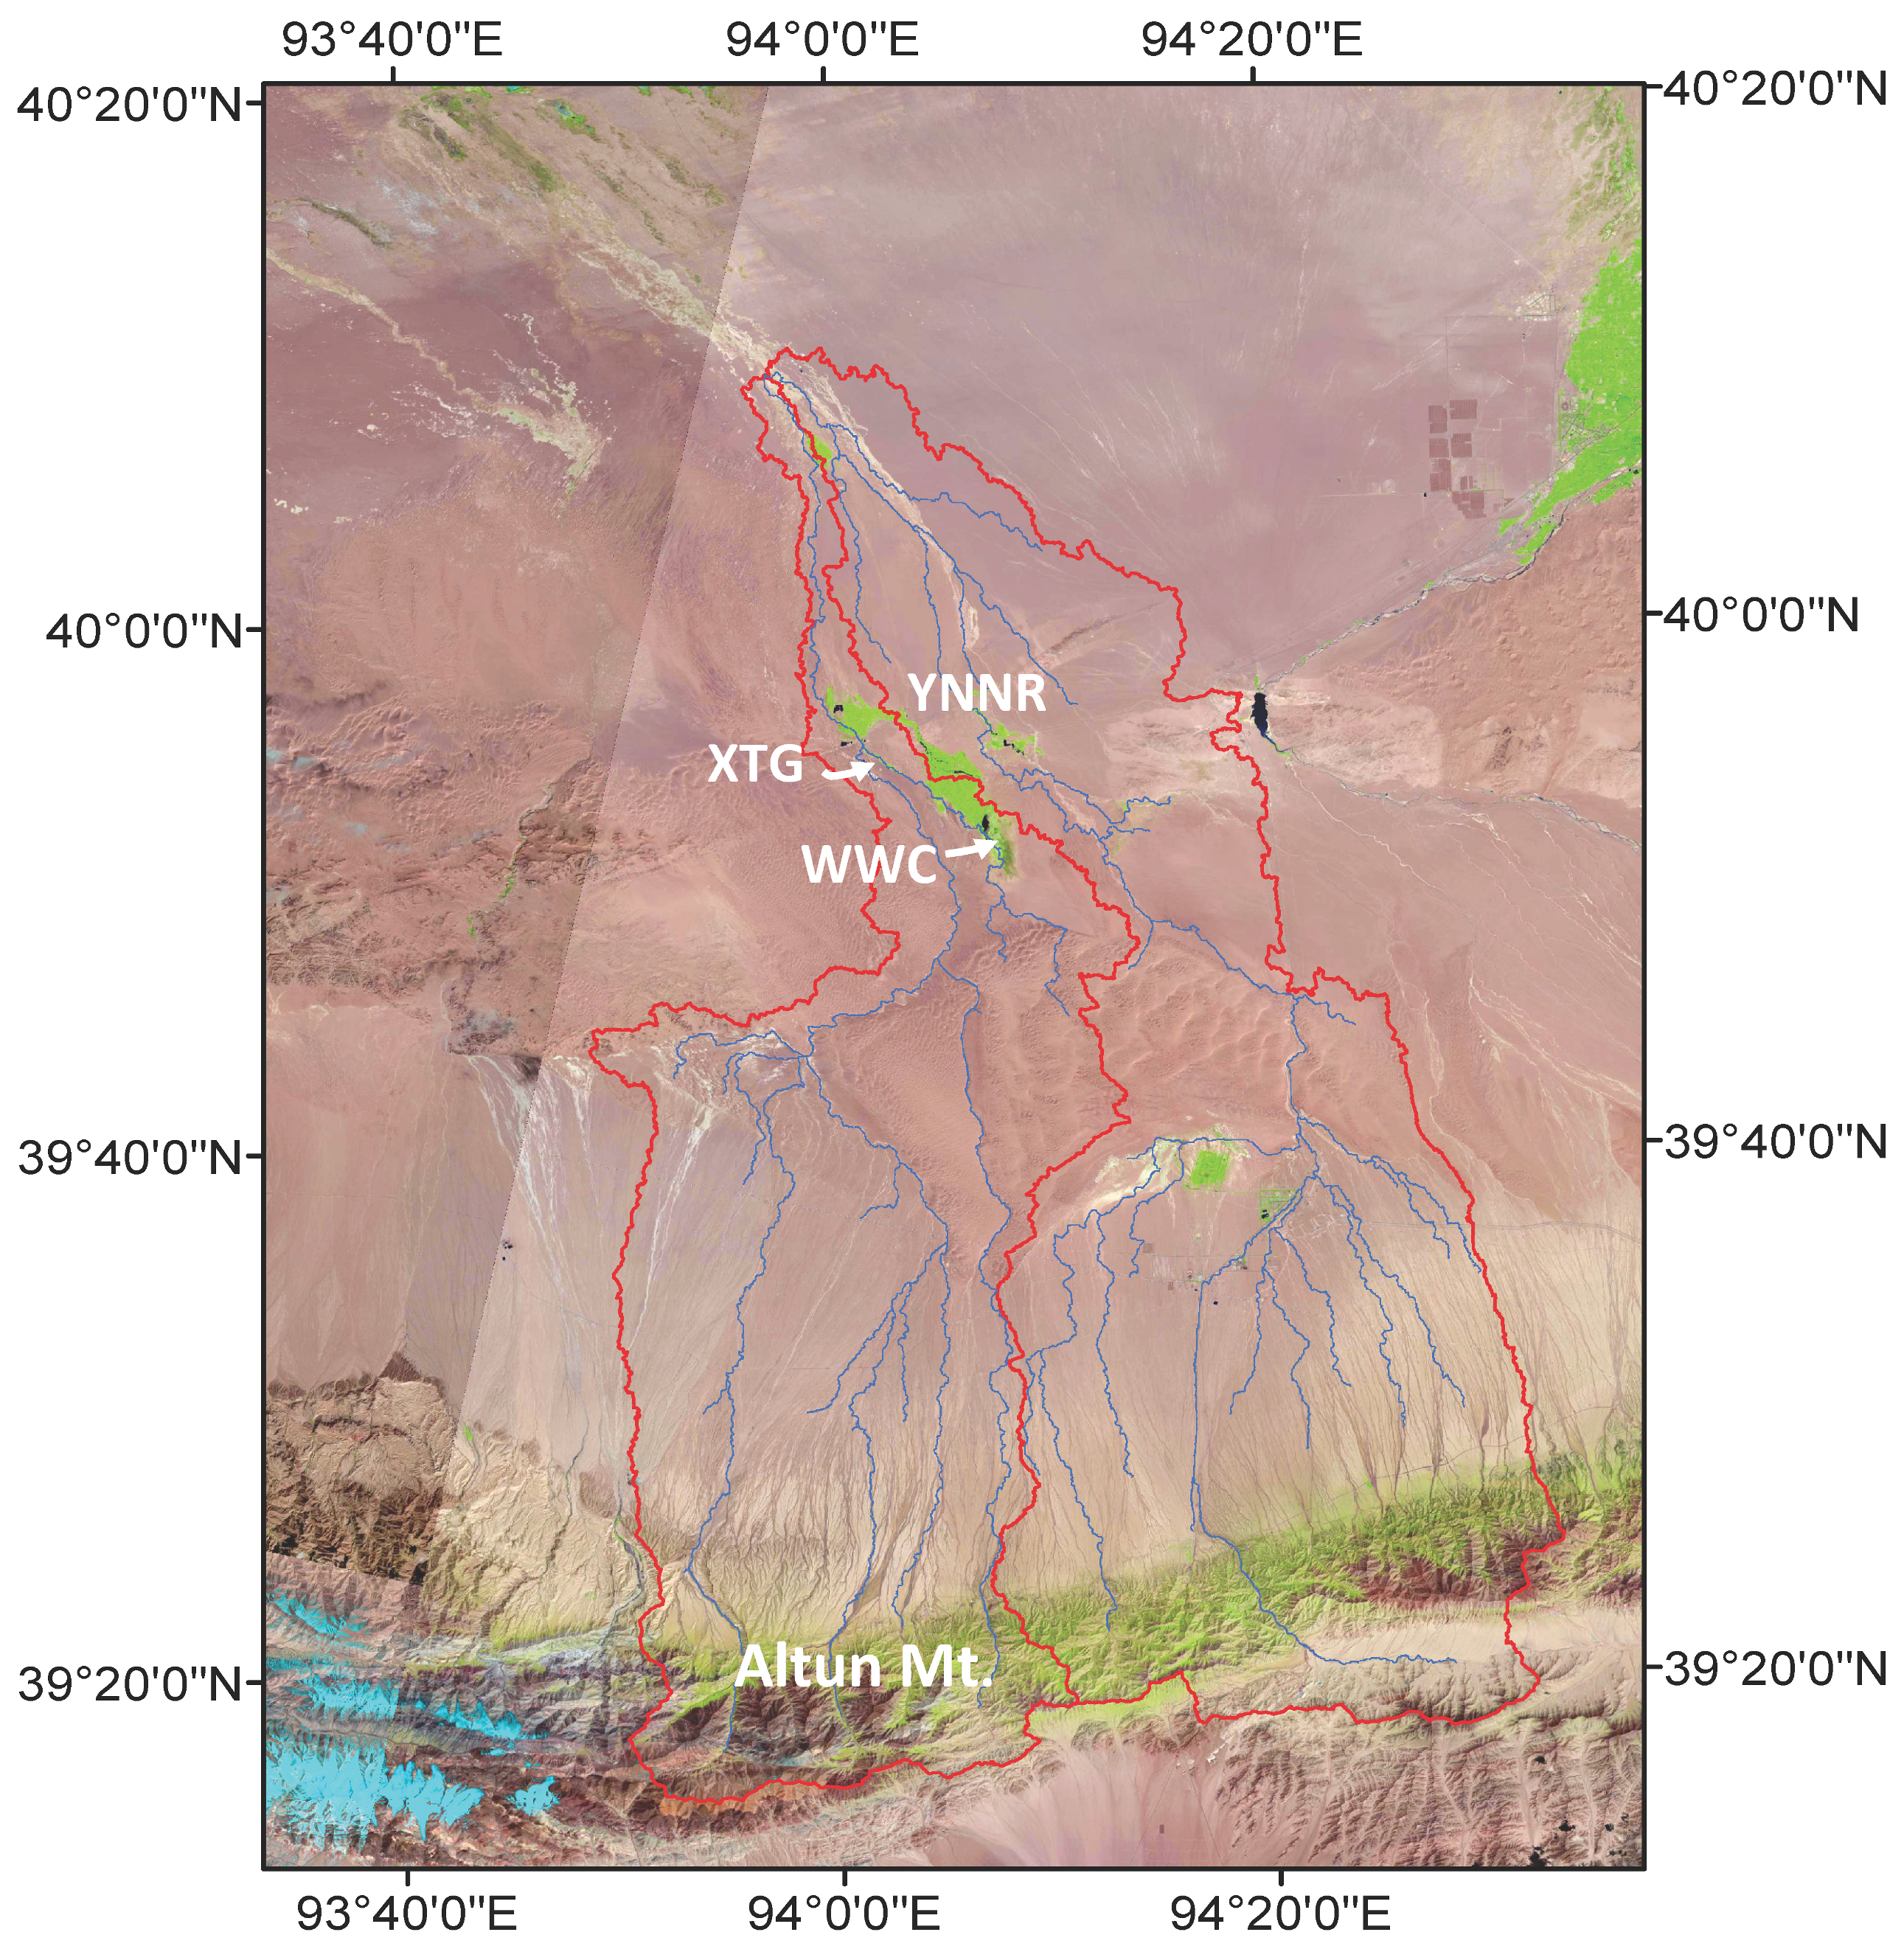
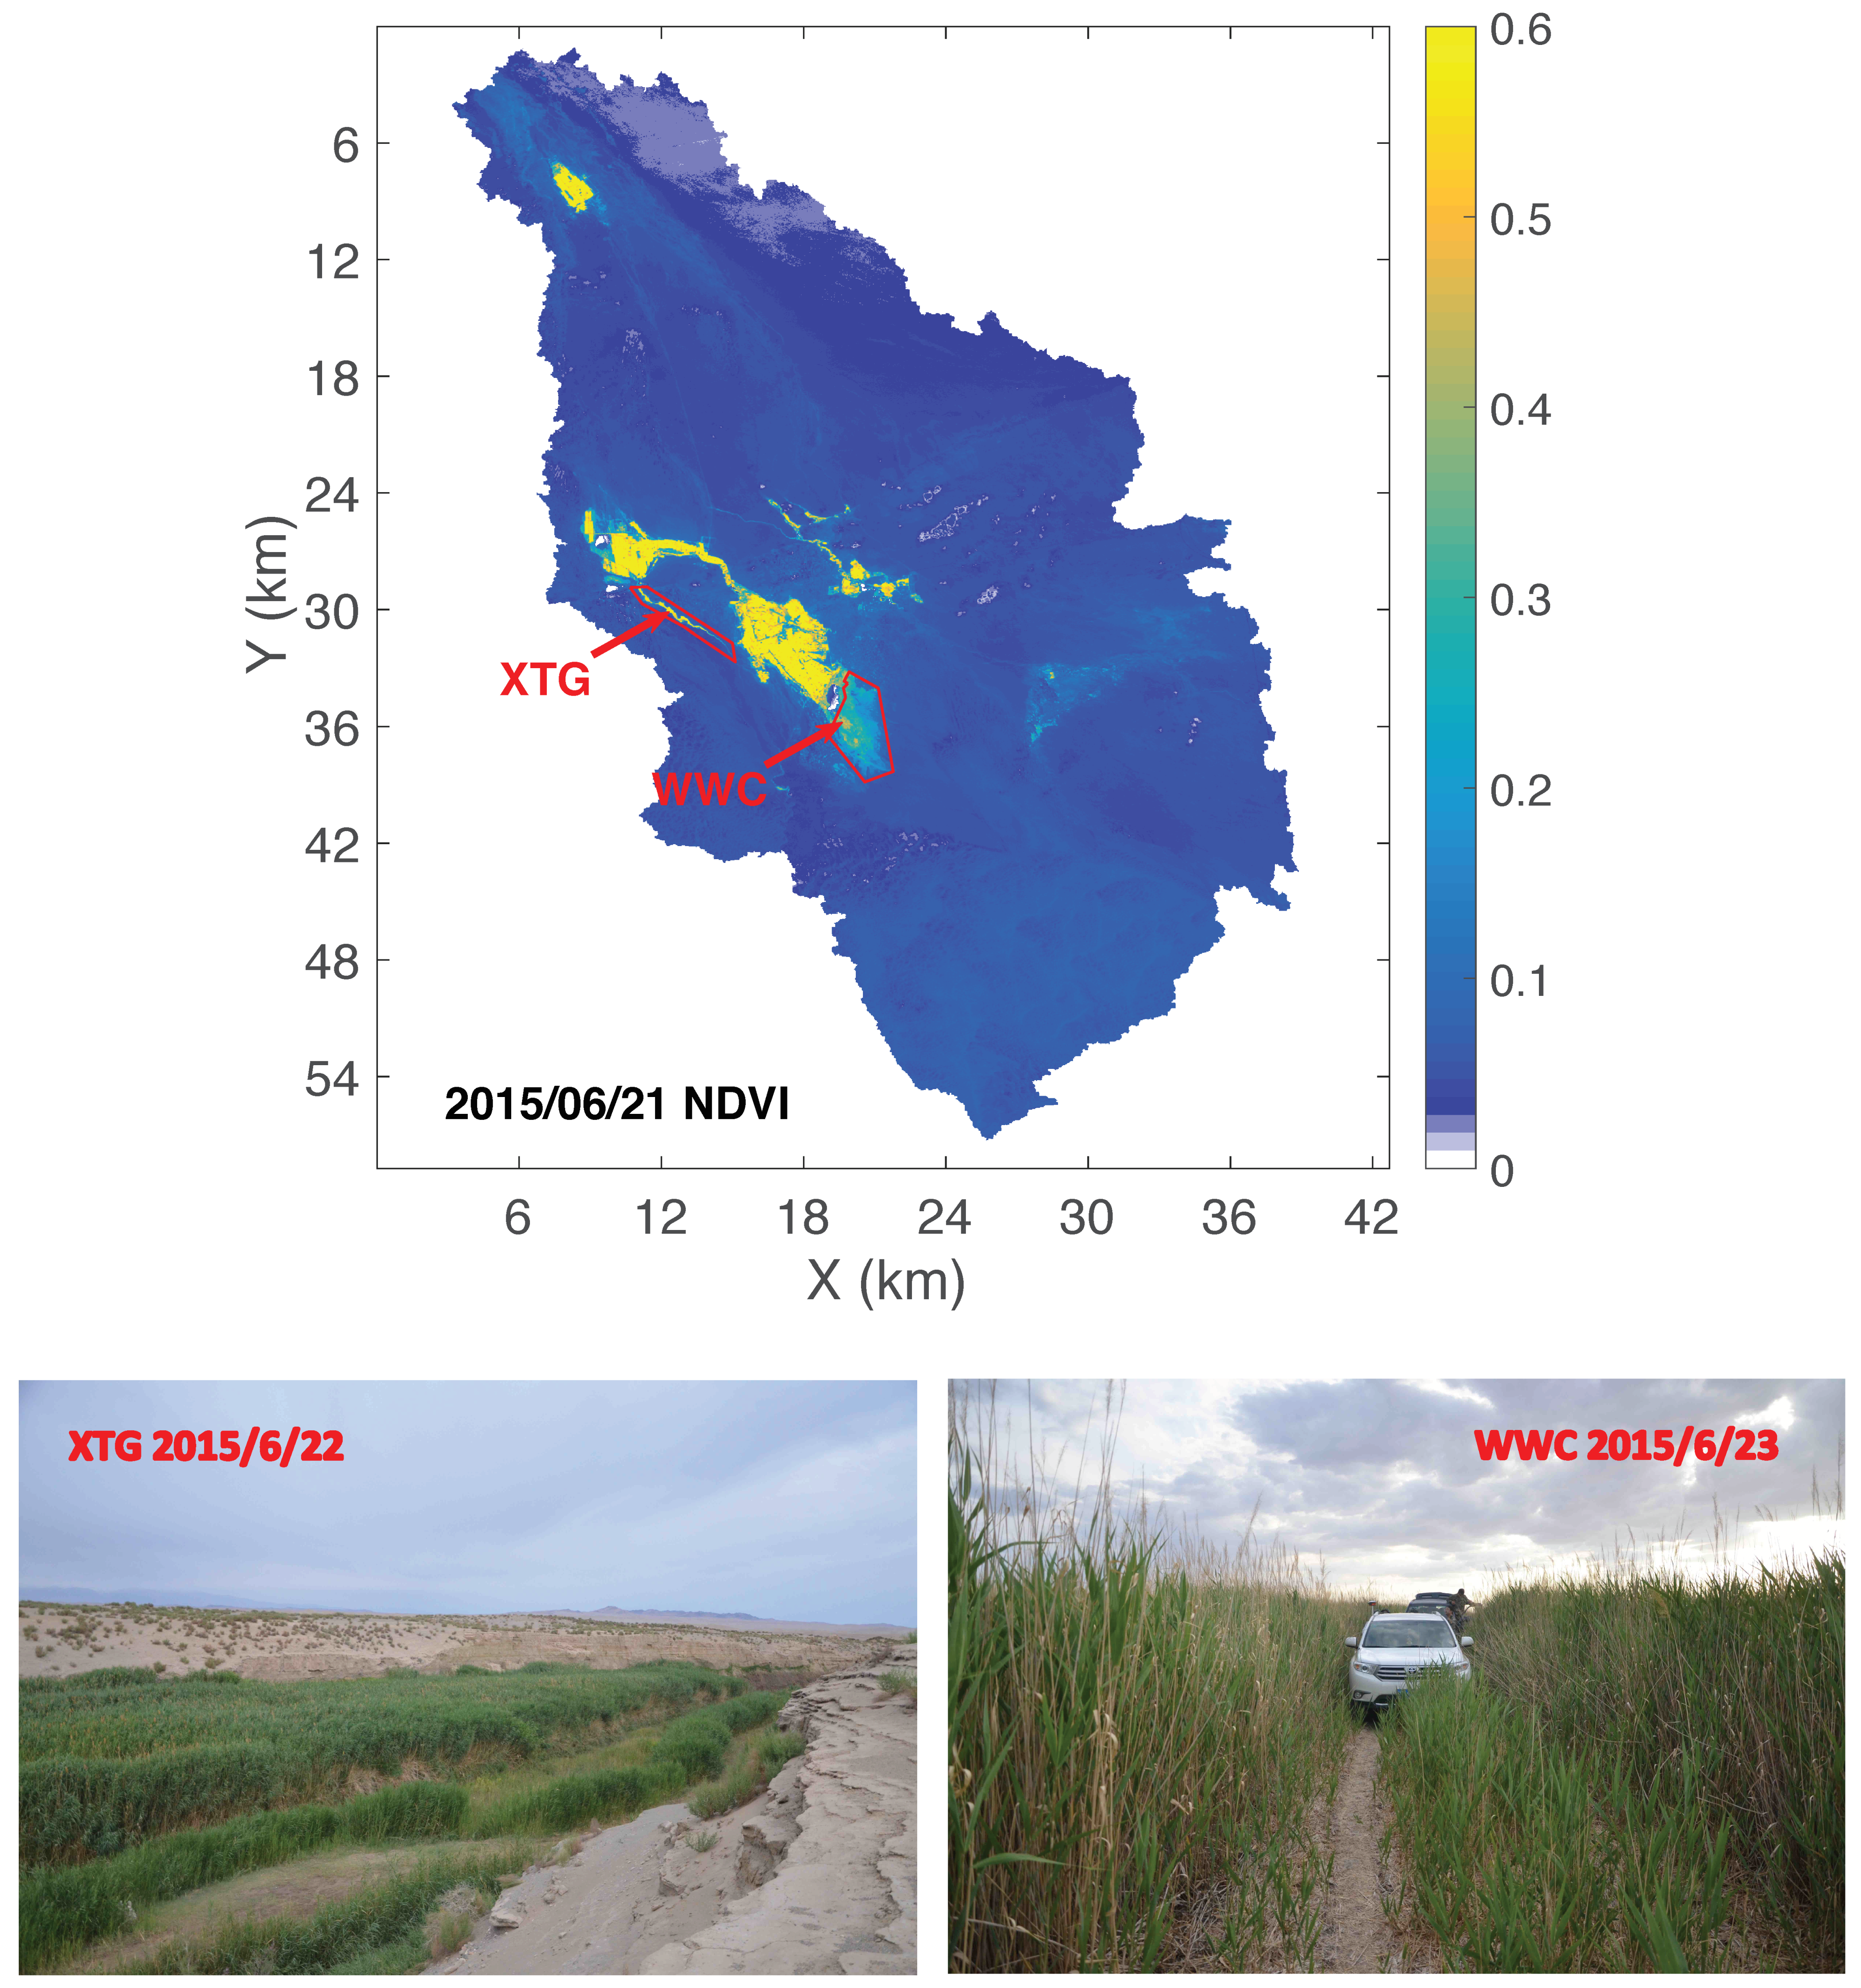
2.1. Study Area

The study area is inside the Yangguan National Nature Reserve (YNNR), located in the territory of the Nanhu Township in Dunhuang City, the westernmost point of the Gansu Province in China. It covers an area of 882 km2 between 93.8833°–94.2833°E and 39.65°–40.0833°N. The YNNR is surrounded on the west, east, south, and north by the Kumtag Desert, the Danghe Reservoir, the Akesa Kazak Autonomous County, and the Gobi Desert, respectively. The Nanhu oasis inside the YNNR is one of the few oases that extend westward in the northern oasis of the Qilian Mountains. In order to better protect the wetlands inside the YNNR, the Gansu Dunhuang Yangguan Nature Reserve was upgraded to the national level, known as the Yangguan National Nature Reserve (i.e., YNNR) in 2009. In this study, two main wetlands inside the YNNR, i.e., Xitugou (XTG) and Wowachi (WWC) are chosen for evaluating the climate change impacts on the wetland vegetation (Figure 1). The main wetland vegetation species growing in the XTG and WWC is common reed (Phragmites australis). In addition to the XTG and WWC, some wetlands are distributed in the northeast of the YNNR. However, since these wetlands belong to a different watershed, they are not selected in this study. The majority of the green areas shown in Figure 1 are actually vineyards, orchards, and crop fields, which are not wetlands, and thus, they are also not studied in this study.

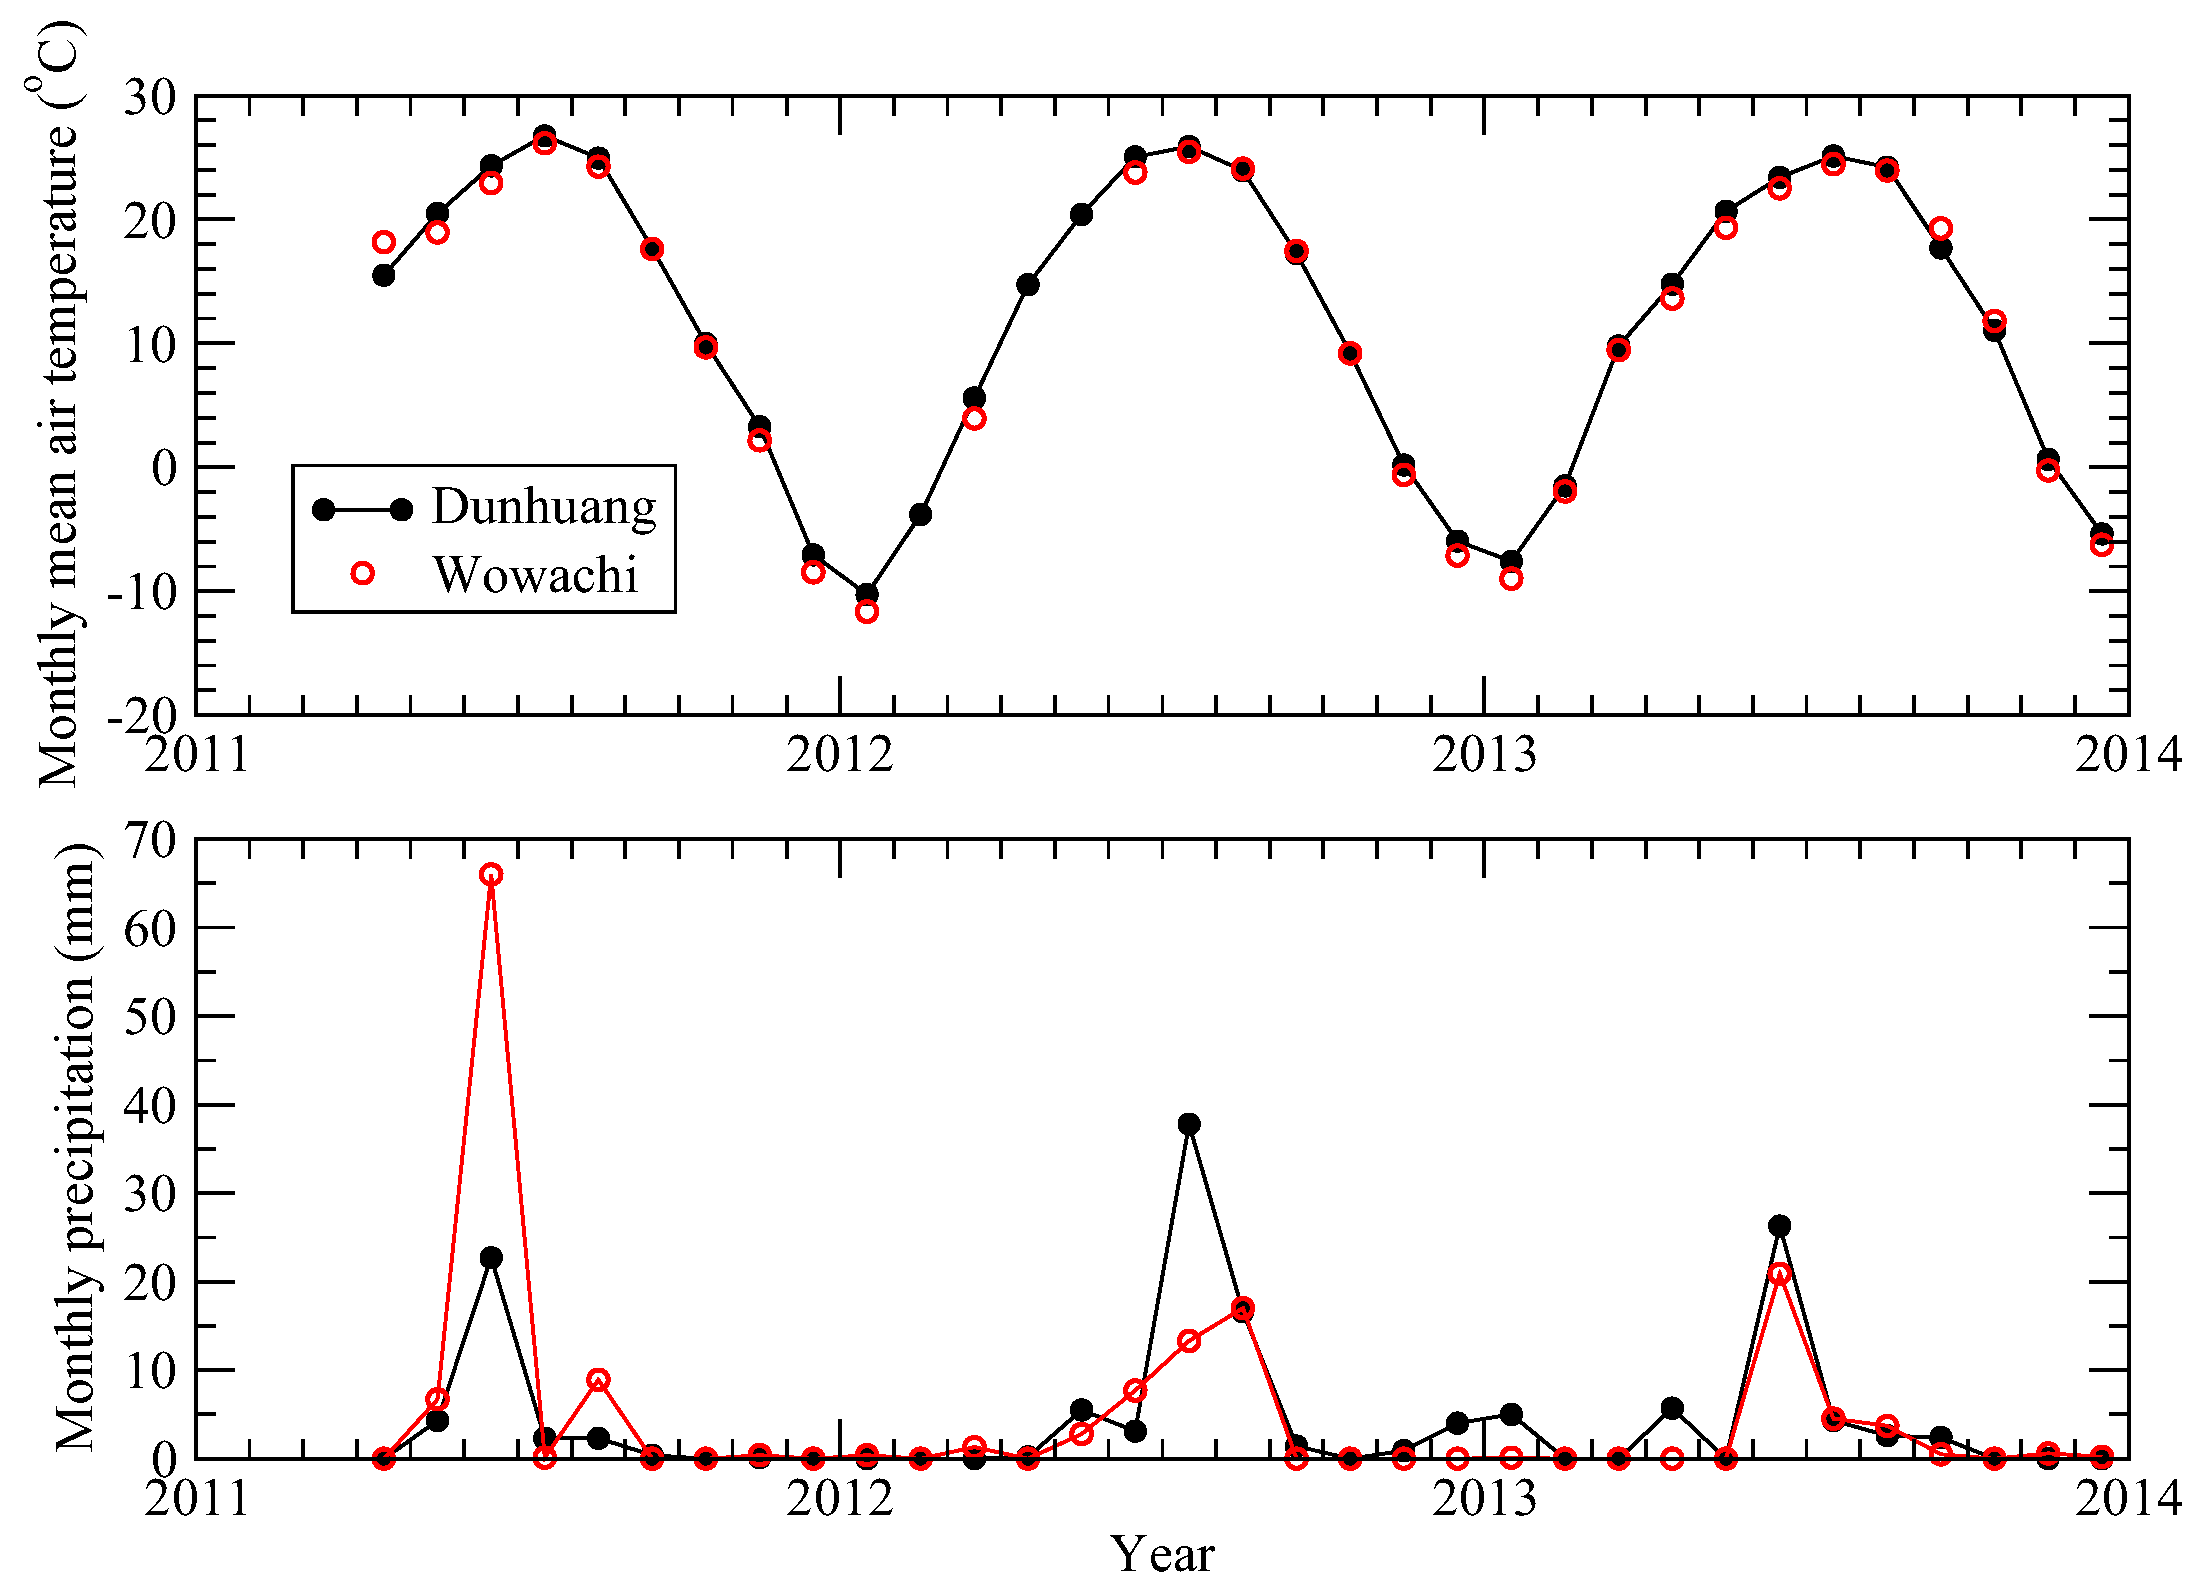
2.2. Meteorological Data

Since climate is a long-term average of weather or meteorological elements, to study the climate change impacts on the wetland vegetation inside the YNNR, a long-term record of the meteorological data over the YNNR is essential for exploring climatic characteristics and climate change in the YNNR. The main meteorological variables include temperature, precipitation, atmospheric pressure, vapor pressure (or relative humidity), wind speed, and wind direction. Although there is an automatic weather station installed in Wowachi (39.87°N, 94.11°E, labeled as WCS in Figure 1), it started collecting meteorological data hourly since 2011 and stopped working in 2013. The hourly meteorological data can be used to compute the daily mean temperature, precipitation, and mean wind speed. However, this automatic weather station could only provide a three-year meteorological data record which is too short for studying the climatic characteristics and climate change in the YNNR.
To resolve the shortage of a long-term meteorological data in the YNNR, this study utilized the Dunhuang weather station (40.15°N, 94.68°E, labeled as DHS in Figure 1), which is the closest weather station to the YNRR and has a long-term meteorological data record. The Dunhuang weather station is about 60 km northeast of the YNRR and can provide more than 60 years (from 1951 to current) of meteorological data including the daily mean, maximum, and minimum temperatures, precipitation, wind speed, vapor pressure, and so forth. To demonstrate that the meteorological data collected by the Dunhuang weather station can be used to study the climatic characteristics of the YNRR, this study first compared the temperature and precipitation collected by the Dunhuang weather station and the Wowachi automatic weather station. Based on the actual operational period of the Wowachi automatic weather station, we compared the monthly mean temperatures and the monthly precipitations from April 2011 to December 2013 and plotted them in Figure 2. Since there are many missing temperature data in February, April, and May (2012) at the Wowachi automatic weather station, the monthly mean air temperatures of these three months are not shown in Figure 2.
Figure 2 shows that monthly mean air temperatures and monthly precipitations at Wowachi were highly (the correlation coefficient is 0.997) and fairly (the correlation coefficient is 0.667) correlated with those at Dunhuang, respectively. Although the correlation coefficient of the monthly precipitation between Wowachi and Dunhuang is not as high as that of the monthly mean air temperature, the occurrence of precipitation at Wowachi actually corresponded well with that at Dunhuang. Among the 33 months (from April of 2011 to December of 2013), there are only three months when Wowachi received no precipitation while Dunhuang received more than 1 mm of precipitation. On the other hand, the mean annual precipitations from April 2011 to December 2013 at the Wowachi and Dunhuang stations are almost identical, that is, 51.7 mm and 51.4 mm, respectively. The above comparison indicates that the long-term meteorological data collected at the Dunhuang weather station are suitable for exploring the climatic characteristics and climate change in the YNNR.

2.3. The Hydrologic Regime of the YNNR

The hydrologic regime of the YNNR is directly influenced by the climatic and terrain characteristics of the area. According to the precipitation data collected at the Dunhuang weather station, the long-term (1951–2016) average annual precipitation in the YNNR is less than 50 mm, which is much less than the annual precipitation threshold for defining an arid climate, that is, 250 mm, and thus, the study area can be classified as an extremely arid area with extremely limited surface water. The channel networks (blue lines) and watershed divides (red lines) shown in Figure 3 indicate that the surface water flow in the YNNR is from the south to the north, although the surface runoff in the area is very limited because of the very limited precipitation. Almost all the channels in the area are dry without any water, except during the snowmelt season. The majority of the snowmelt coming from the snow cover over the Altun Mountains (~5000 m above mean sea level) to the south of the YNNR recharges into the local groundwater systems and flows northward, and eventually emerges in the YNNR, especially at the WWC and XTG (see Figure 3), as springs which provide precious water for the wetlands in the WWC and XTG. Therefore, to study the climate change impacts on the wetland vegetation in the YNNR, in addition to the local meteorological data, the snow depth or snow water equivalent information in the Altun Mountains is also essential. In this study, the Canadian Meteorological Centre (CMC) operational global daily snow depth analysis data [44] with a spatial resolution of 24 km were downloaded from the National Snow and Ice Data Center (NSIDC, Boulder, CO, USA) for evaluating the temporal variation of the snow depth in the Altun Mountains and its impact on the wetland vegetation in the YNNR.

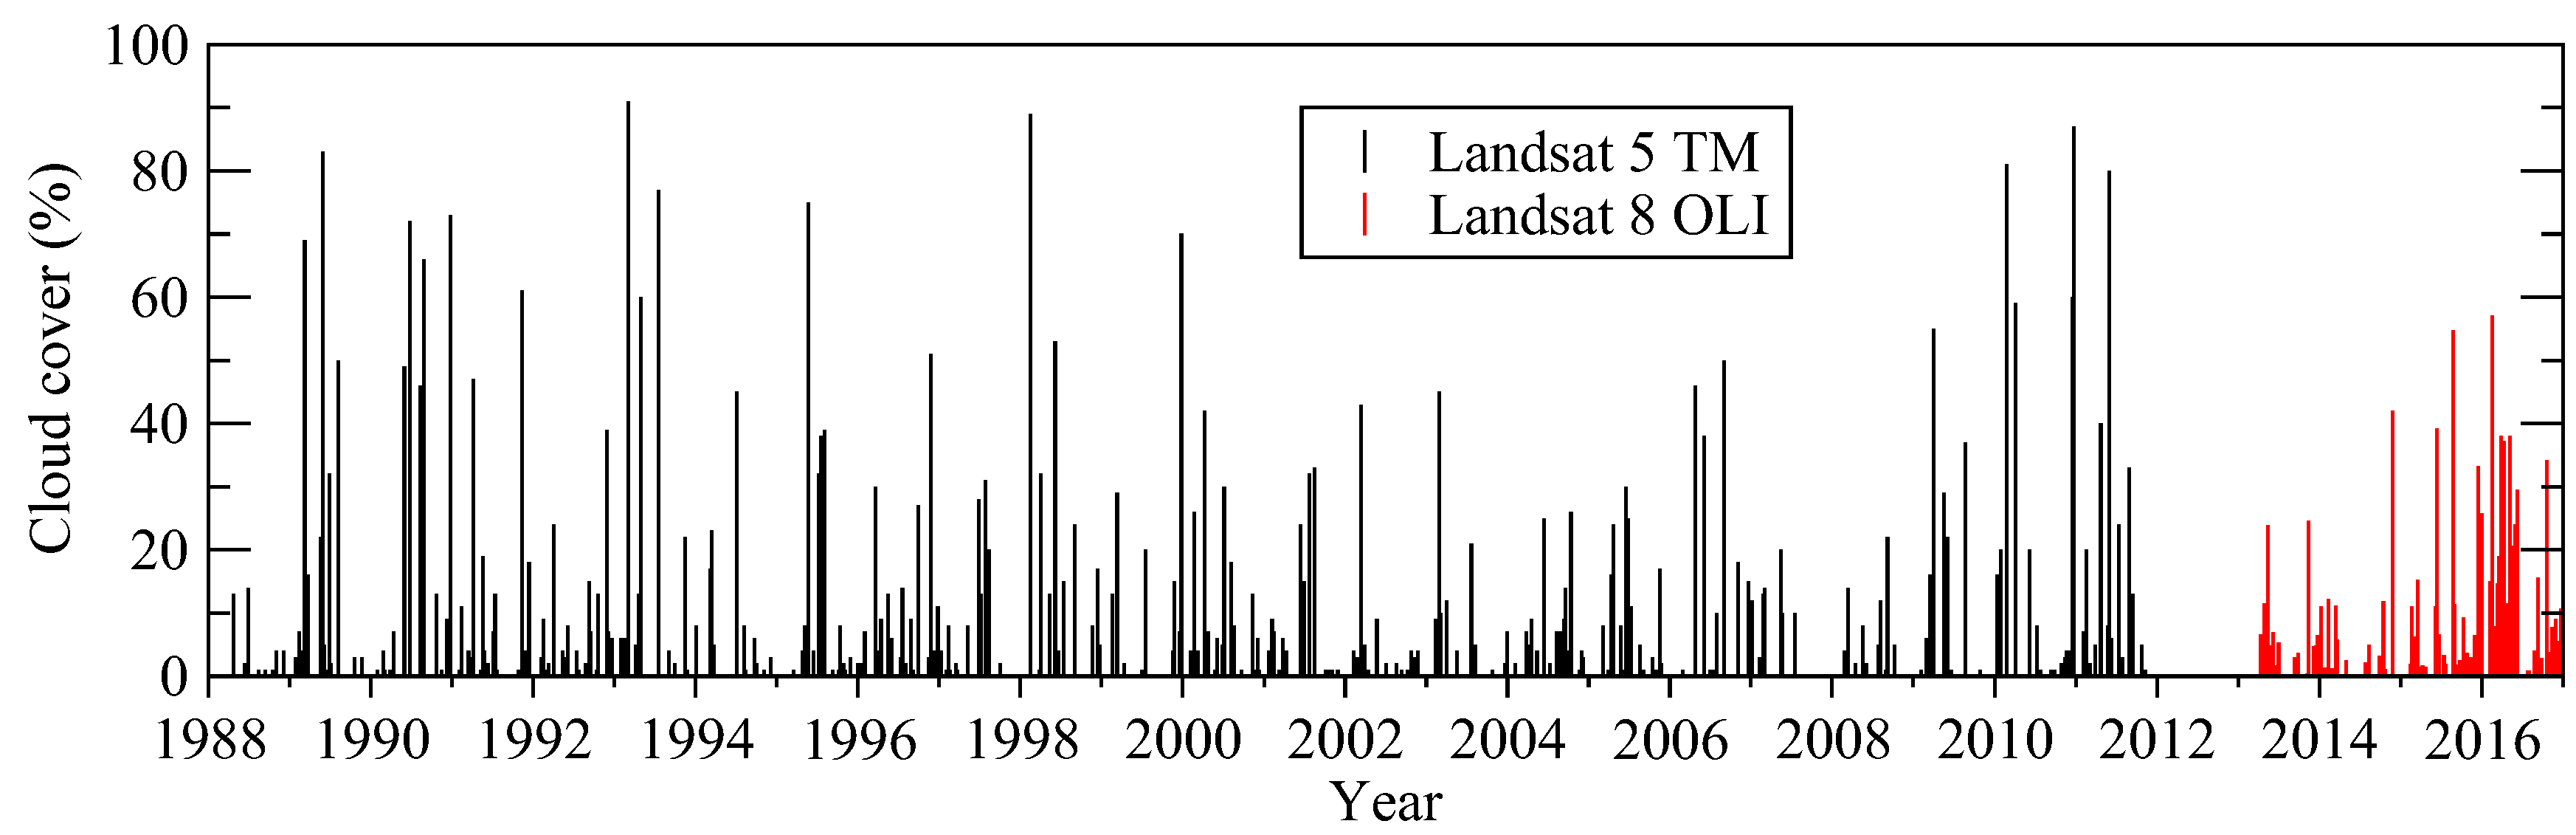
2.4. Landsat Imagery

Since the XTG in the YNNR is a narrow channel and the channel width ranges from 40 m to 200 m (see Figure 1 and Figure 3), and thus, the MODIS vegetation characteristic data products with spatial resolutions of 250 m, 500 m, and 1000 m are not suitable for studying the wetland vegetation in the XTG. The MODIS data probably works well for the wetland vegetation in the WWC. However, for consistency, this study only used the Landsat imagery for estimating the normalized difference vegetation index (NDVI). From 1988 to 2016, 453 scenes of Landsat 5 Thematic Mapper (TM) images (path = 137, row = 32) and 88 scenes of Landsat 8 Operational Land Imager (OLI) images (path = 137, row = 32) were download from the United States Geological Survey (USGS) EarthExplorer website. All the images were in the Level-1 GeoTIFF data format. To illustrate the temporal distribution of all the downloaded Landsat images for this study, Figure 4 shows the acquisition date and the associated cloud cover percentage of each image. The wide data gap between 2012 and mid-2013 shown in Figure 4 is due to the failure of Landsat 5, and because Landsat 8 was launched on 11 February 2013. Since each Landsat scene size is about 170 km north-south by 183 km east-west, and the study area is much less than each Landsat scene size, visual inspection of each image is necessary to determine if there were some clouds over the study area.

3. Methods

3.1. Computing the Normalized Difference Vegetation Index (NDVI)

In this study, both the Landsat 5 Thematic Mapper (TM) and the Landsat 8 Operational Land Imager (OLI) images were utilized for computing the normalized difference vegetation index (NDVI), which is a ratio of the spectral reflectance difference between the near-infrared (NIR) and red bands to the reflectance summation of the NIR and red bands as shown in Equation (1):
NDVI = R NIR R RED R NIR + R RED
where RNIR and RRED are the spectral reflectances in the NIR and red bands, respectively. Table 1 lists the band index and the wavelength (λ) information for the NIR and red bands of Landsat 5 TM and Landsat 8 OLI.
Prior to computing the NDVI based on Equation (1), each pixel’s digital number of Landsat red and NIR band images need to be converted to the spectral reflectance. For Landsat 5, we need first to convert the digital number to the spectral radiance as follows:
L λ = DN λ × G λ + B λ
where Lλ is the spectral radiance (W/(m2 sr μm)), DNλ is the digital number (dimensionless), Gλ is rescaling gain factor (W/(m2 sr μm)), and Bλ is the rescaling bias factor (W/(m2 sr μm)) for band λ. Table 2 lists the band-specific rescaling factors for Landsat 5′s band 3 and band 4 [45].
After the spectral radiance L λ is converted from the digital number, it can be used to compute the top-of-atmosphere (TOA) reflectance R λ (dimensionless) as follows:
R λ = π L λ d 2 ESUN λ cos θ
where d is the Earth-Sun distance in astronomical units, ESUN λ is the mean solar exo-atmospheric irradiance (W/(m2 μm)) for band λ ( ESUN λ : Band 3 = 1536 ,   Band 4 = 1031 ), θ is the solar zenith angle which is given in the metadata file of each Landsat scene. Chander et al. [45] produced a table of the Earth-Sun distance for the day of the year (DOY) using the Jet Propulsion Laboratory Ephemeris (DE405). Table 3 lists 24 Earth-Sun distances (d) for 24 DOYs which can be used to interpolate the Earth-Sun distance (d) of the DOY that is not listed in Table 3. Actually, all of the currently available level-1 Landsat data have the Earth-Sun distance information listed in the metadata files, and thus, the interpolation of the Earth-Sun distance using Table 3 is not necessary.
For the Landsat 8 OLI imagery, the digital number can be directly converted to the TOA reflectance as follows:
R λ = ( DN λ × M λ + A λ ) / cos θ
where M (dimensionless) and A (dimensionless) are rescaling factors for converting the digital number to the reflectance in band λ , and θ is the solar zenith angle in the degree which is given in the metadata file of each Landsat 8 scene. The conversion of the TOA reflectance from the Landsat 8 OLI digital number has been simplified since all the bands have the same M and A values, that is, M = 2 × 10 5 , A = −0.1.
Due to the spectral difference between Landsat 8 OLI and Landsat 7 ETM+, it was found that the Landsat 8 derived NDVI (NDVI8) is slightly greater than the Landsat 7 derived NDVI (NDVI7) [46]. Roy et al. (2016) used about 28 million 30-m pixels extracted from 6317 Landsat 7 ETM+ and Landsat 8 OLI images to construct a regression relationship between NDVI7 and NDVI8 as follows:
NDVI 7 = 0.011 + 0.969 NDVI 8
To maintain the temporal continuity between the Landsat 5 TM derived and Landsat 8 OLI derived NDVIs, Equation (5) was employed for converting the Landsat 8 OLI derived NDVIs to the equivalent Landsat 5 TM derived NDVIs, because the wavelengths of the near-infrared and red bands of the Landsat 5 TM are identical to those of Landsat 7 ETM+.

3.2. Trend and Correlation Analyses

To detect if there exists a temporal trend in a variable Y, such as climatic components (e.g., air temperature, precipitation, vapor pressure, wind speed, snow depth) or vegetation characteristics (e.g., NDVI, leaf area index), a linear equation can be used to fit the time series plot of Y versus time. If it is the annual time series, the linear regression equation is given as follows:
Y = at + b
where t is the year index (t = 1, 2, …, n), n is the sample size, a is the annual trend slope, and b is the intercept. Both a and b can be determined using the least squares method. Multiplying the estimated annual trend rate by 10 yields the decadal trend rate, that is, 10a.
To evaluate if there exists a strong correlation between two variables X and Y, the correlation coefficient between X and Y can be calculated as follows:
r = i = 1 n ( x i X ¯ ) ( y i Y ¯ ) i = 1 n ( x i X ¯ ) 2 i = 1 n ( y i Y ¯ ) 2 2
where r is the correlation coefficient between X and Y, i is the data index (i = 1, …, n), n is the sample size, X ¯ and Y ¯ are the means of x and y, respectively.

4. Results and Discussion

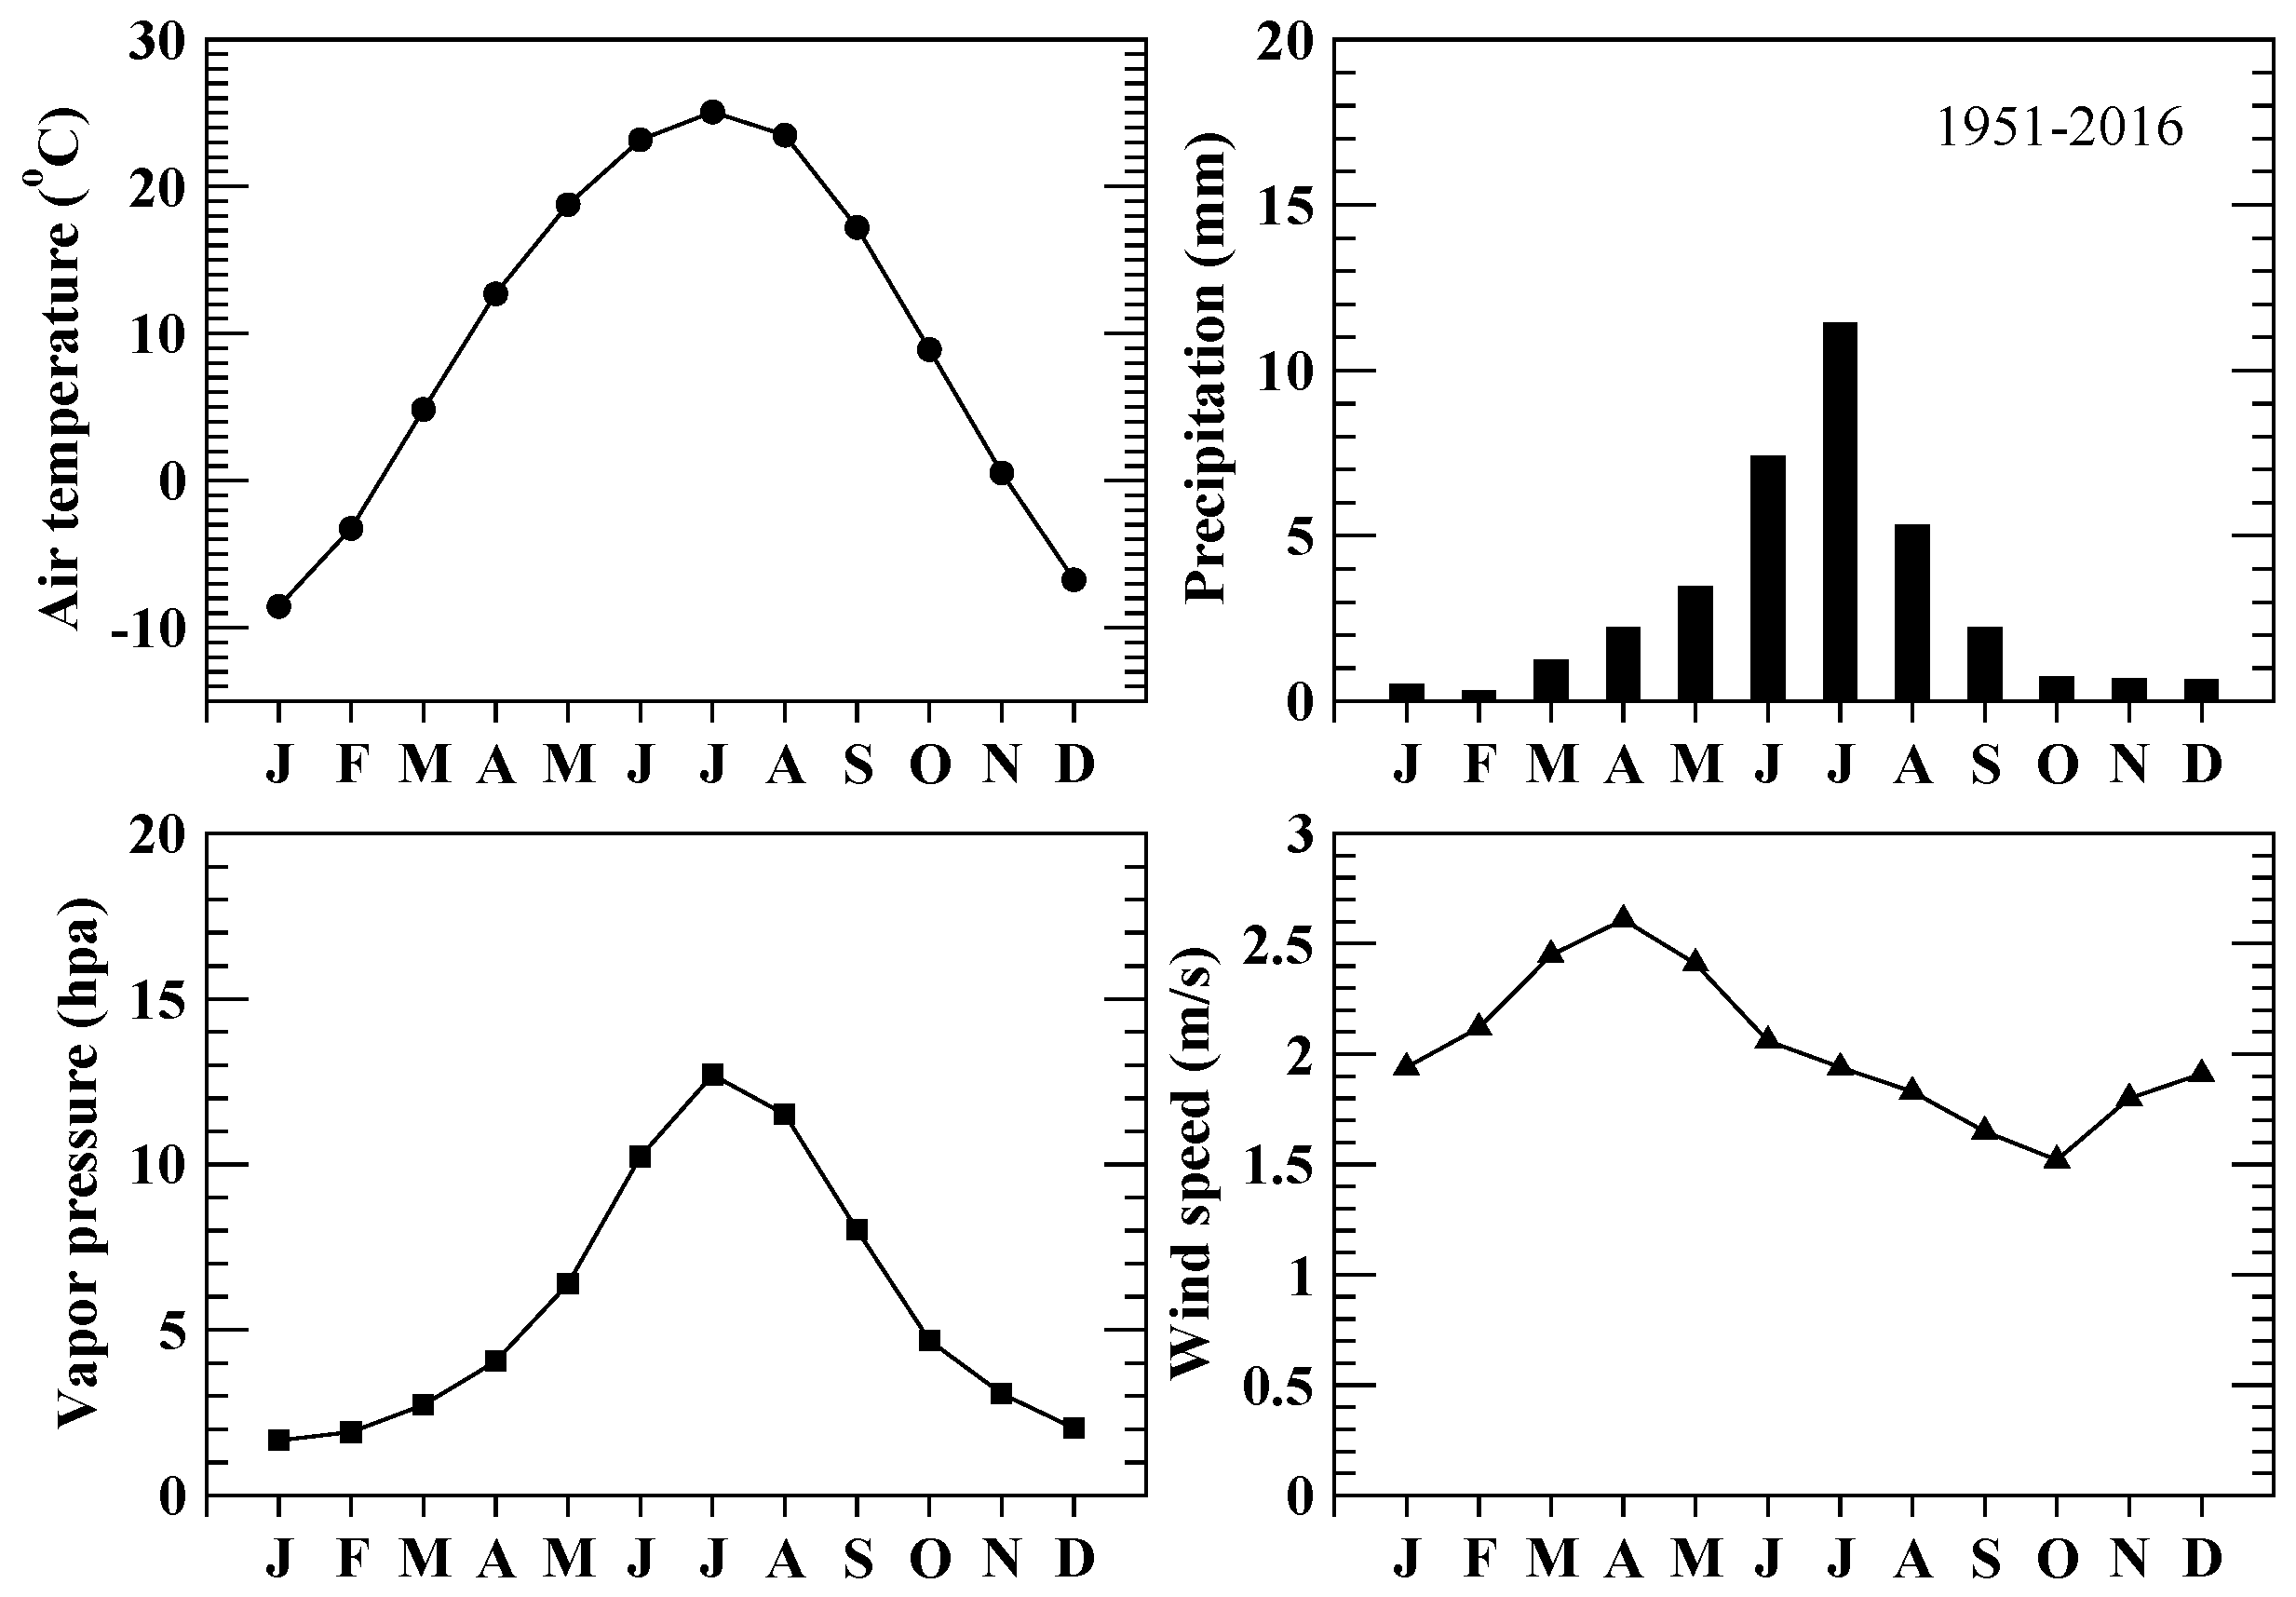
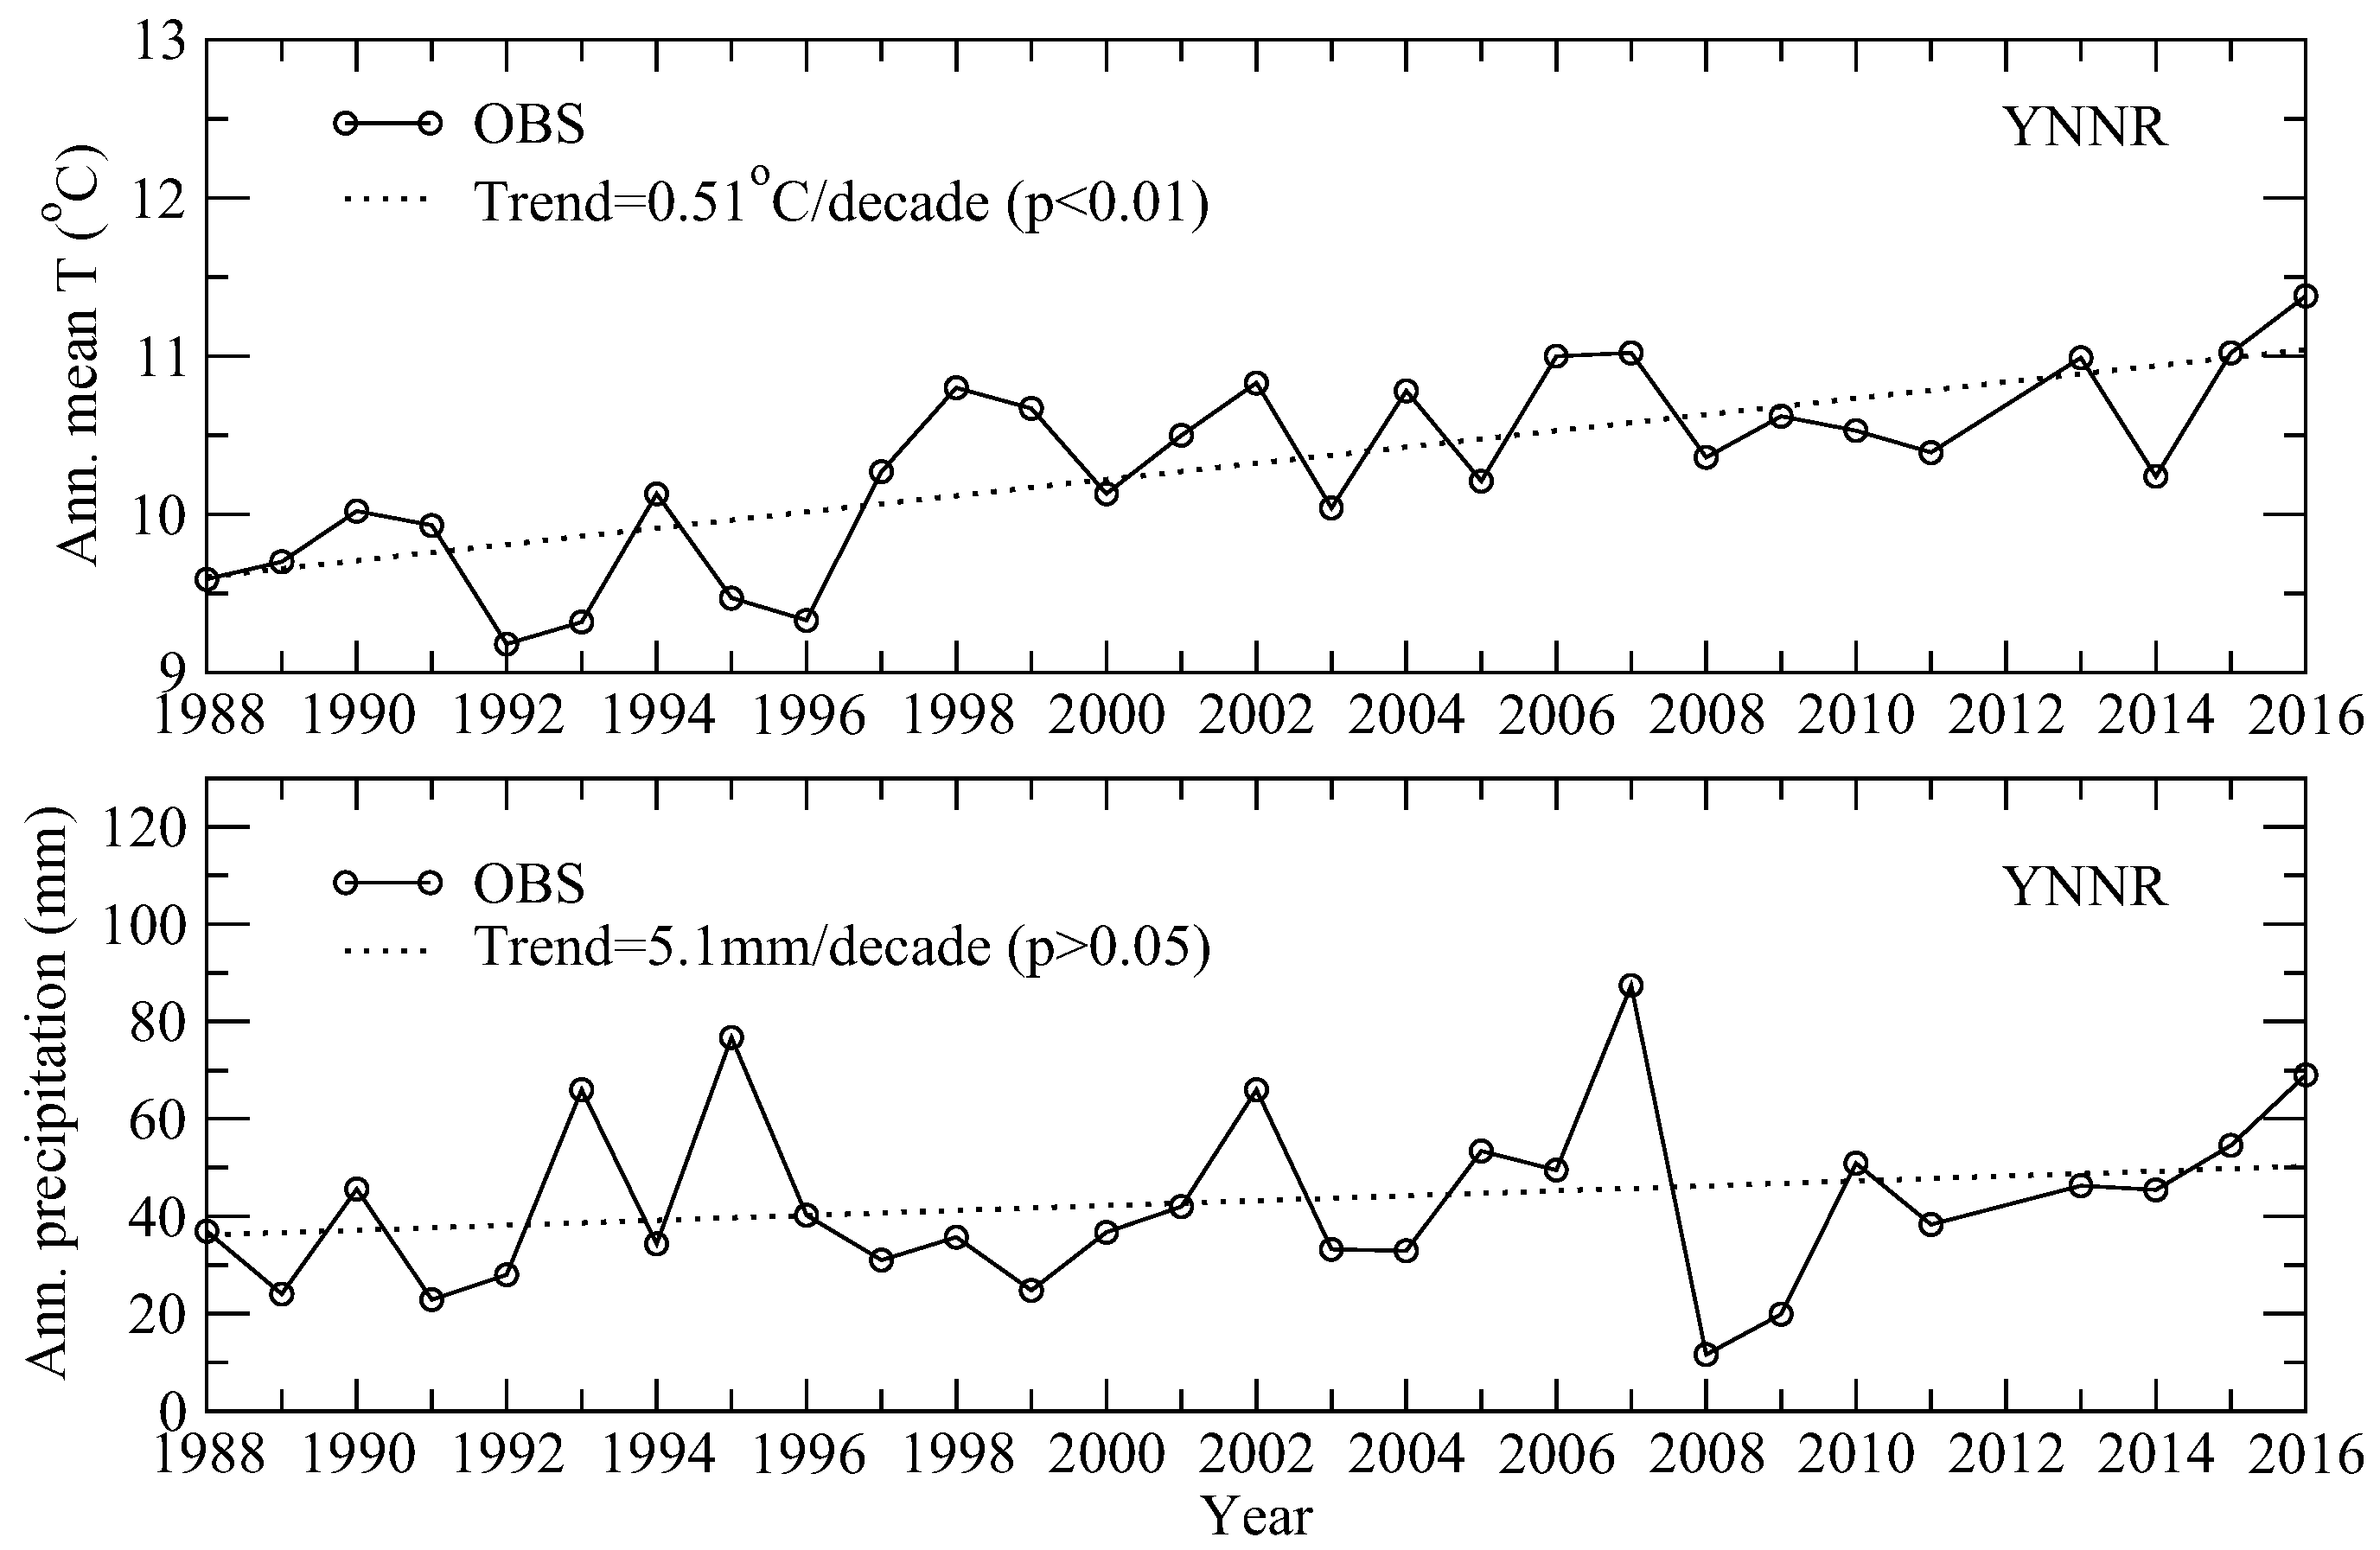
4.1. Climatic Characteristics of the YNNR

The climatic characteristics of the YNNR can be revealed by the long-term (1951–2016) meteorological data collected at the Dunhuang weather station. During 1951–2016, the average annual mean air temperature was 9.78 °C, and the average annual precipitation was 36 mm. Using the same 66-year data record, we computed the long-term average monthly mean air temperature, monthly precipitation, monthly mean atmospheric vapor pressure, and monthly mean wind speed, and plotted them in Figure 5. During the past 66 years, the monthly mean temperature, monthly precipitation, and monthly mean vapor pressure all exhibited the same pattern which was high in summer and low in winter. The highest monthly mean temperature, monthly precipitation, and monthly mean vapor pressure were 25.06 °C, 11.39 mm, and 12.71 hpa, respectively, and all occurred in July; while the lowest monthly mean temperature and vapor pressure were −8.56 °C and 1.66 hpa in January, while the lowest monthly precipitation happened in February and was 0.27 mm. The monthly mean wind speed was high in spring and low in fall, that is, 2.61 m/s in April, and 1.52 m/s in October. The extremely limited annual precipitation and seasonal precipitation in the growing season (May-August) indicate that the local precipitation and surface water in the YNNR could not sustain the growth of the wetland vegetation in this area, and snowmelt and groundwater must be the main water supply for the wetland vegetation in the YNNR wetlands.

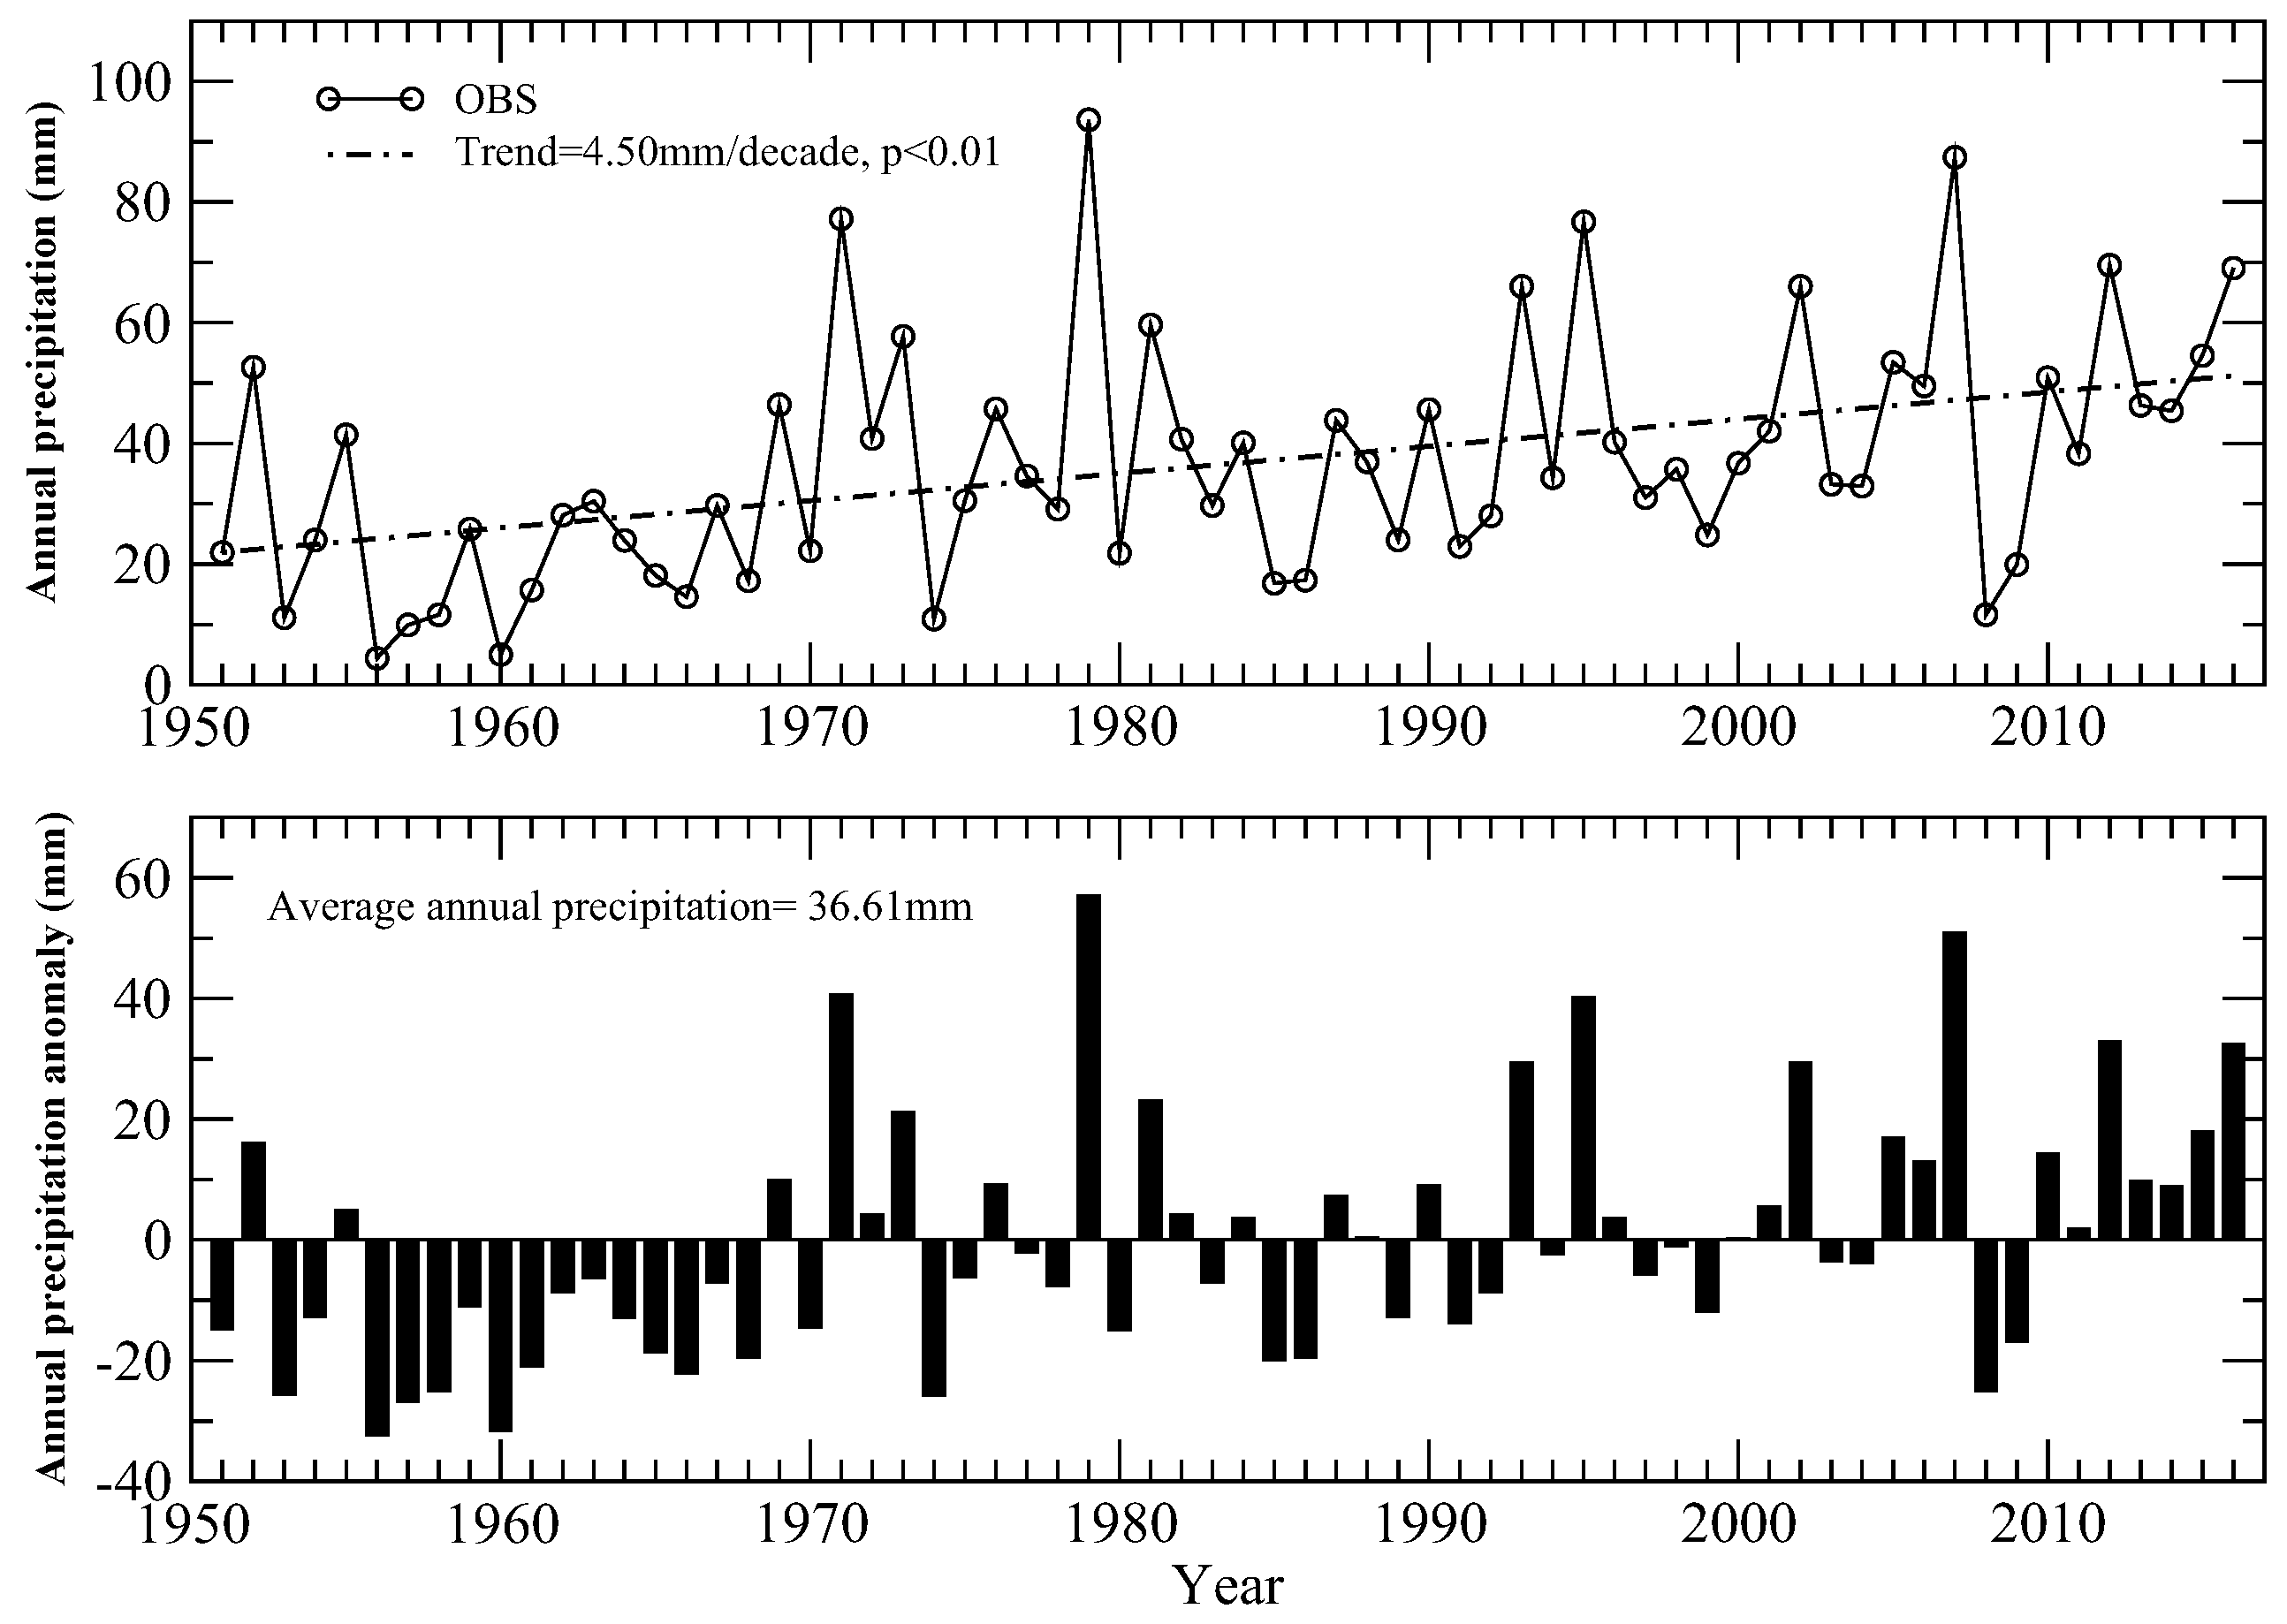
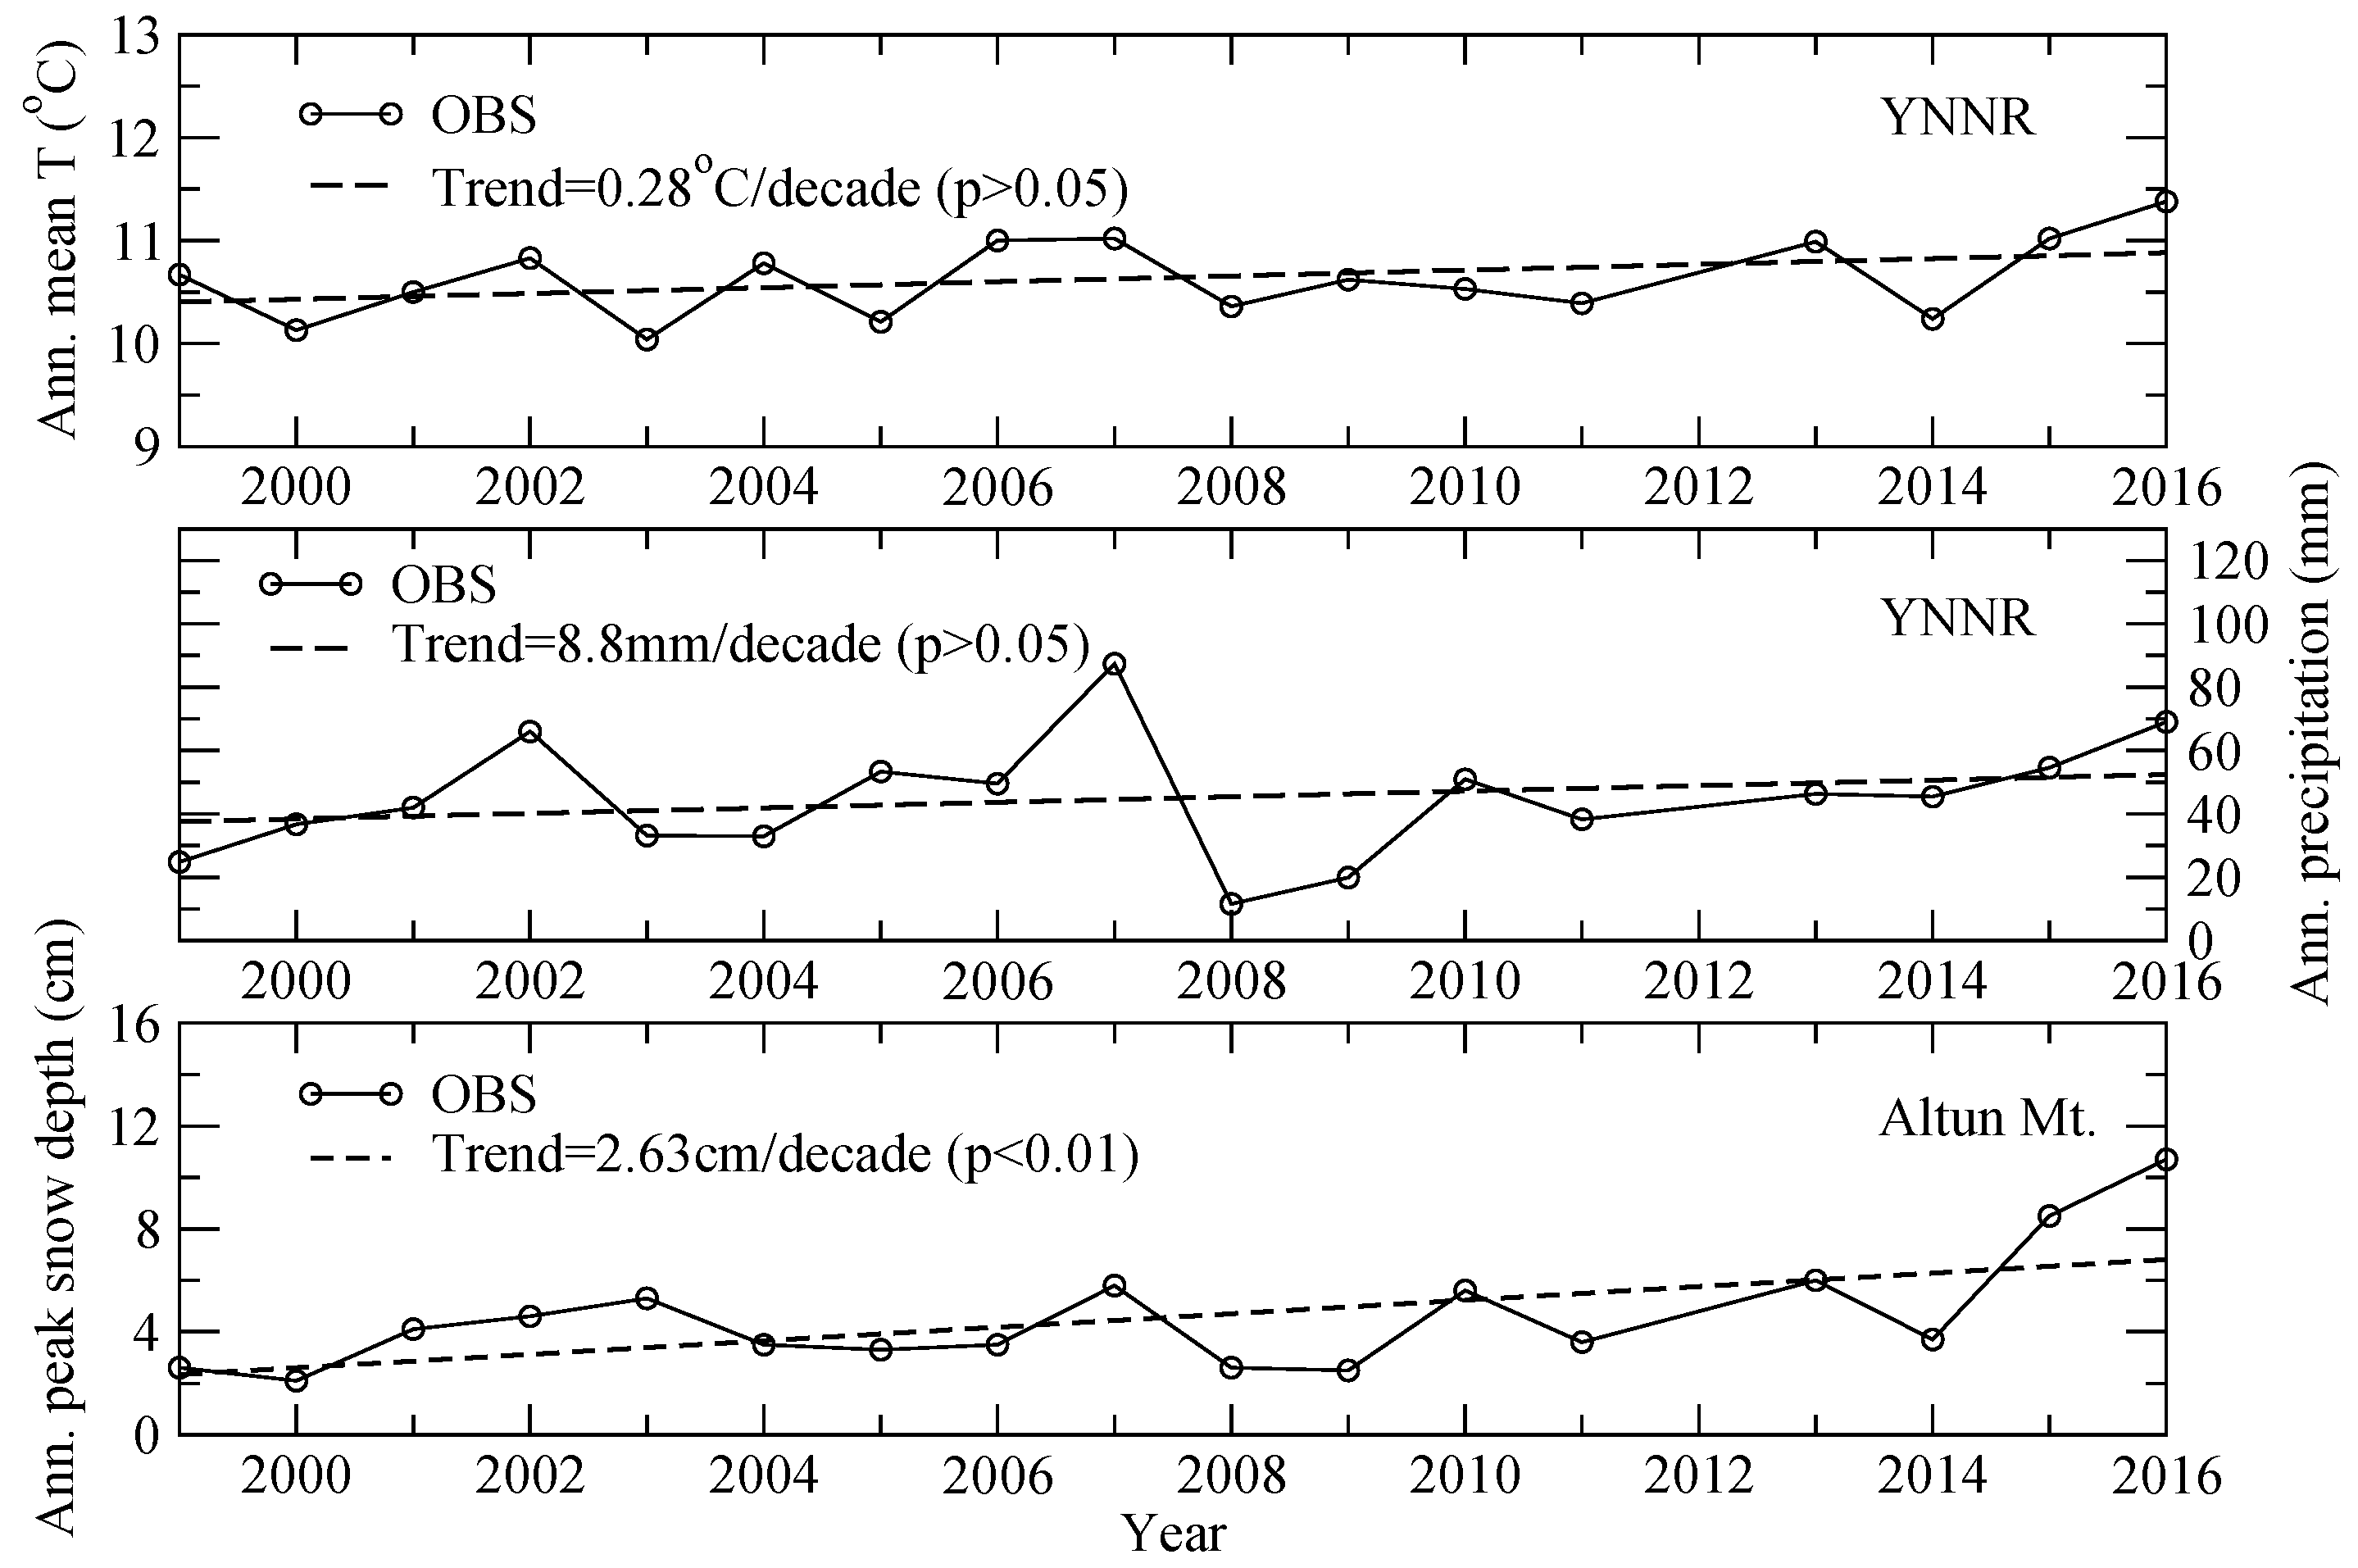
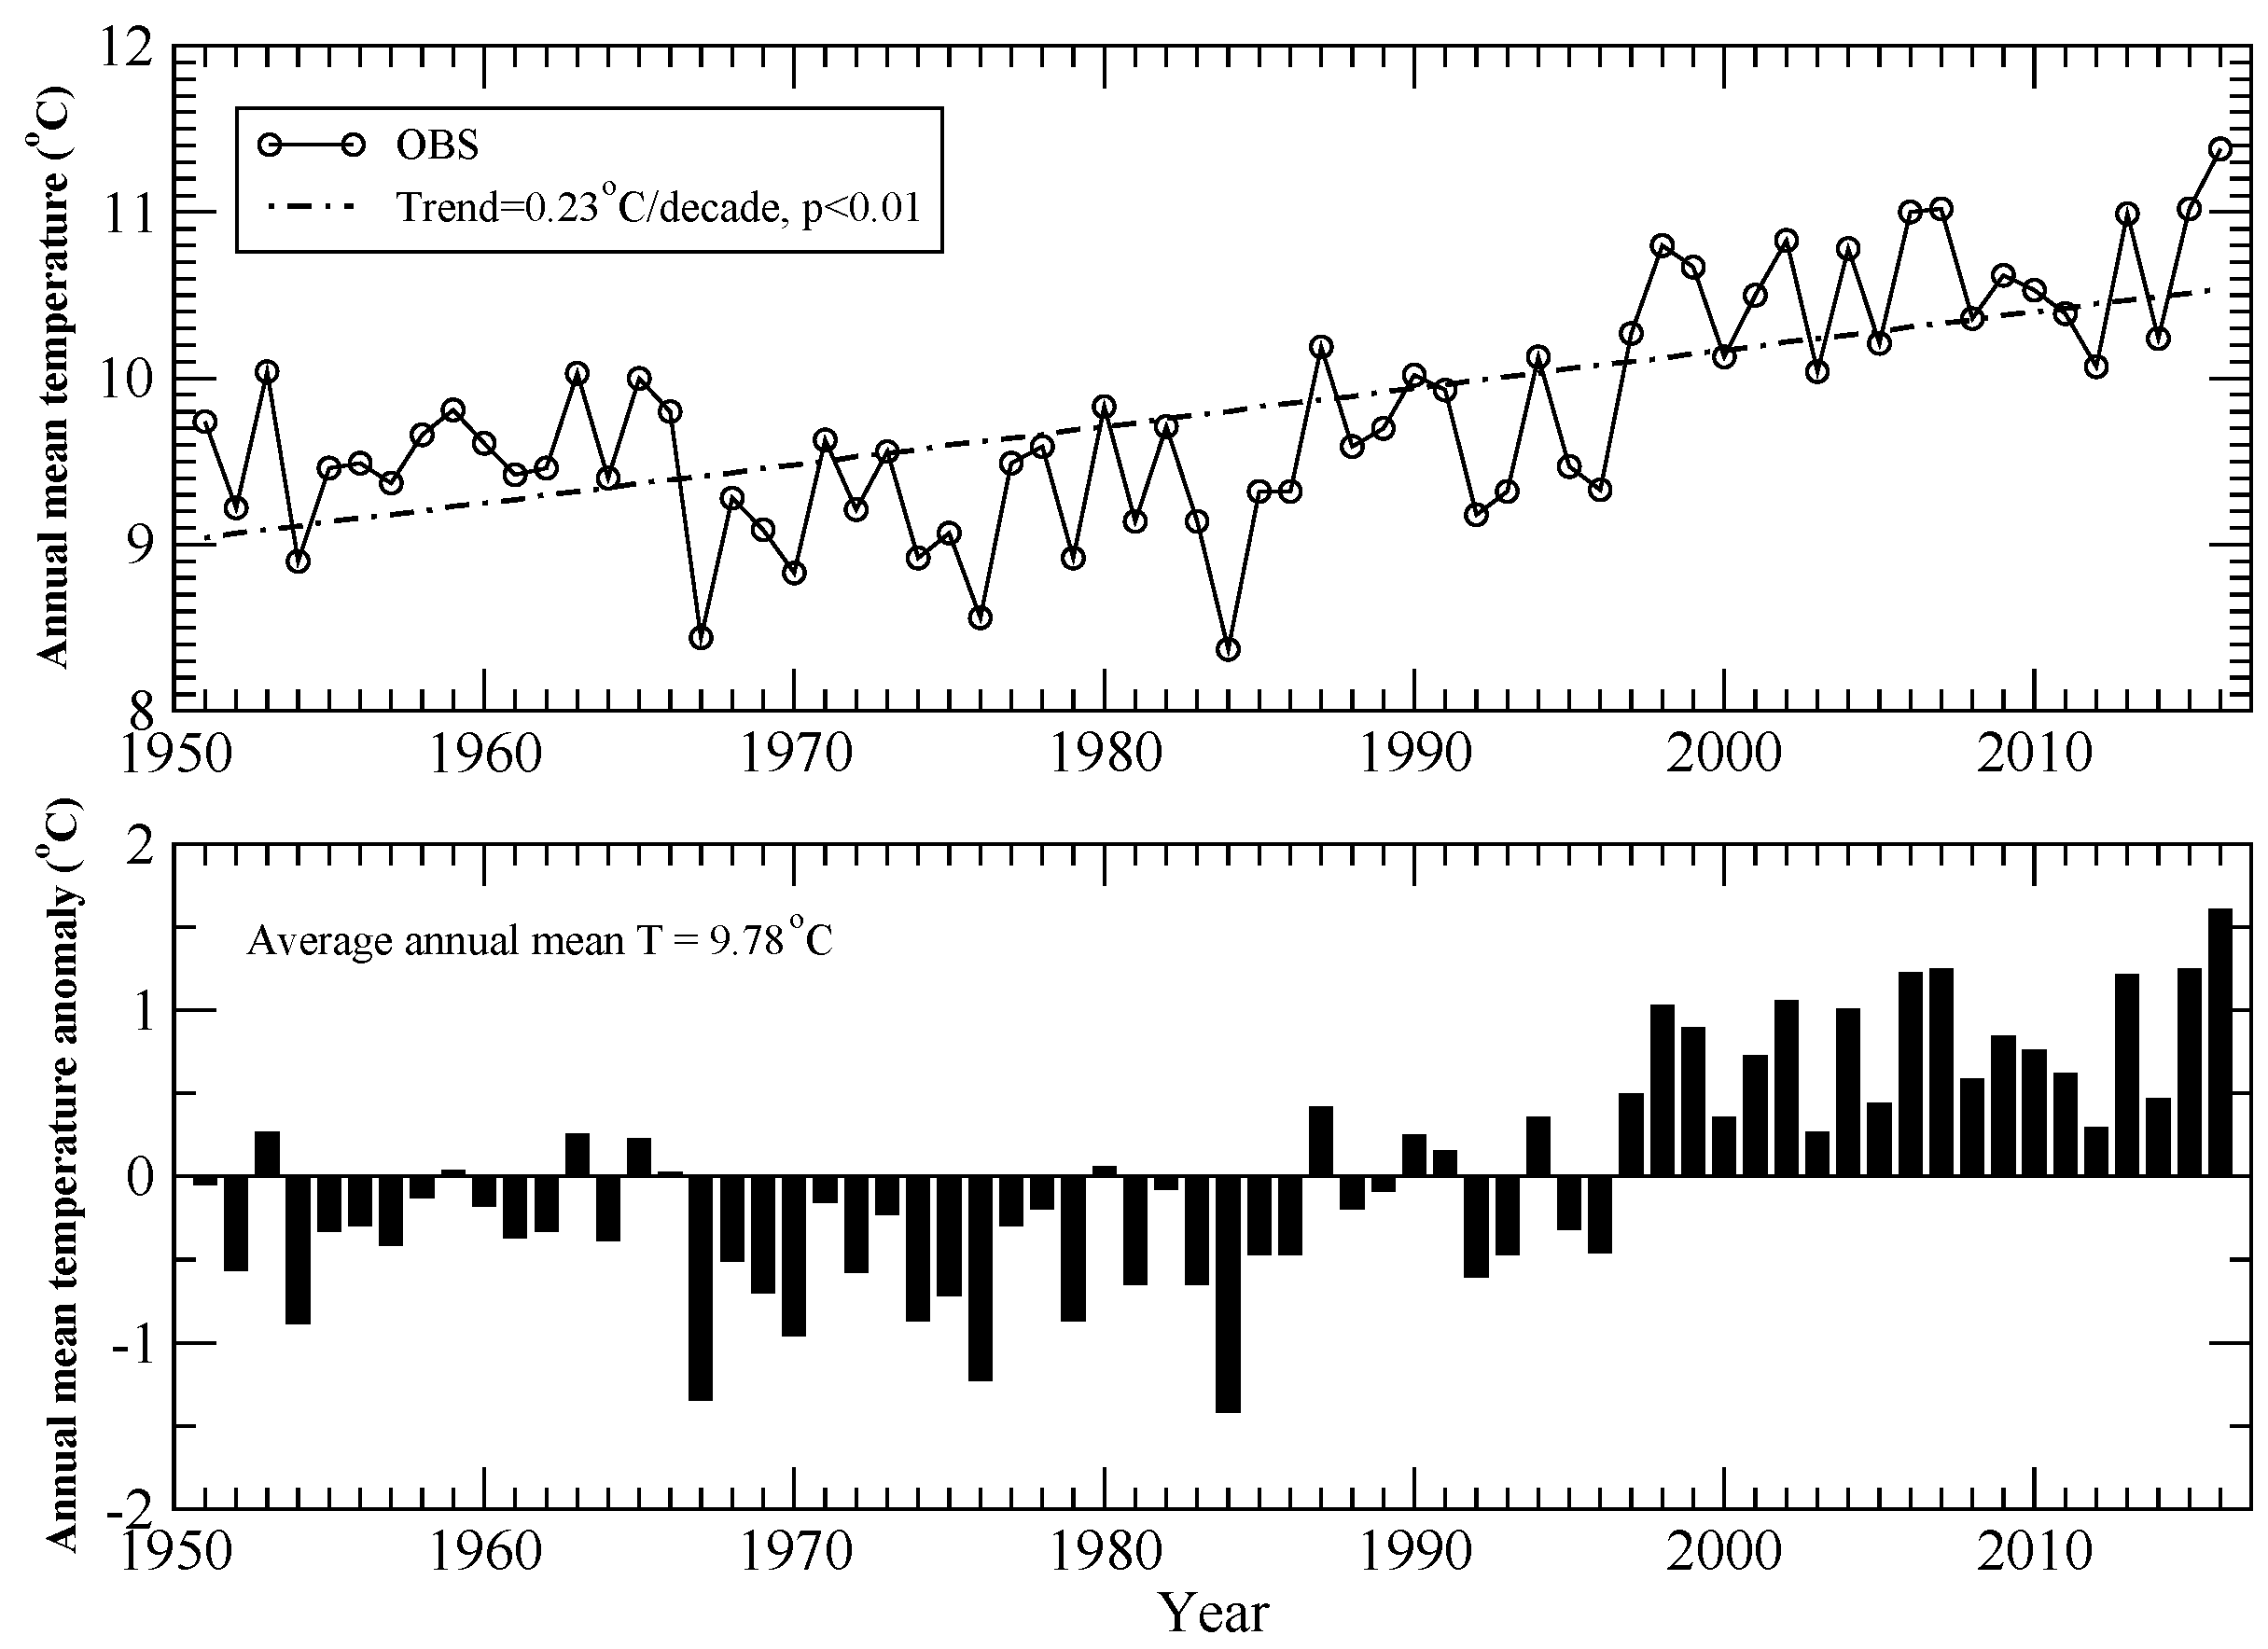
4.2. Climate Change in the YNNR

According to the fifth assessment report produced by the Intergovernmental Panel on Climate Chang (IPCC, 2013) [47], the Earth’s climate has warmed globally by approximately 0.72 °C [0.49–0.89] over the past 60 years, and the decade of the 2000s has been the warmest period compared to any other decade since the late 19th century. To investigate the temperature change in the YNNR, the time series plot of the annual mean temperature in the YNNR and the best fit of the time series plot were shown in Figure 6, which demonstrated that the temperature in the YNNR had exhibited a significant (p < 0.01) increasing trend with a decadal rate of 0.23 °C/decade (or 1.38 °C/6 decades), which is almost twice that of the global average temperature increase in the past six decades, that is, 0.72 °C [47]. The annual mean temperature anomaly plotted in Figure 6 shows that during the past 20 years (since 1997), the annual mean temperature anomaly was always positive, and thus, the temperature increase in the past 20 years was the most significant and the strongest. These results are consistent with the IPCC’s report [47].
Figure 7 shows that the annual precipitation in the YNNR during 1951–2016 exhibited a significant increasing trend (p < 0.01) with a growth rate of 4.50 mm/decade. According to the annual precipitation anomaly illustrated in Figure 7, we can find that the largest positive anomaly occurred in 1979, which caused the flood in the Danghe River to the east of the YNNR. Since 1990 there were six positive anomalies greater than 20 mm, and they occurred in 1993, 1995, 2002, 2007, 2012, and 2016, respectively. In the period of 1950–1970, the annual precipitation showed almost continuous negative anomalies, indicating that the climate in the YNNR in the 1950s and 1960s was drier than in the past two decades. Combined with the change of the annual mean temperature and precipitation during 1951–2016, we can find that the climate in the YNNR exhibited a tendency of warming and “wetting”, but the annual precipitation in the YNNR was still much less than that of the threshold for classifying a desert climate (that is, 250 mm), which means that the precipitation regime in the YNNR has not changed fundamentally and it is still extremely dry.

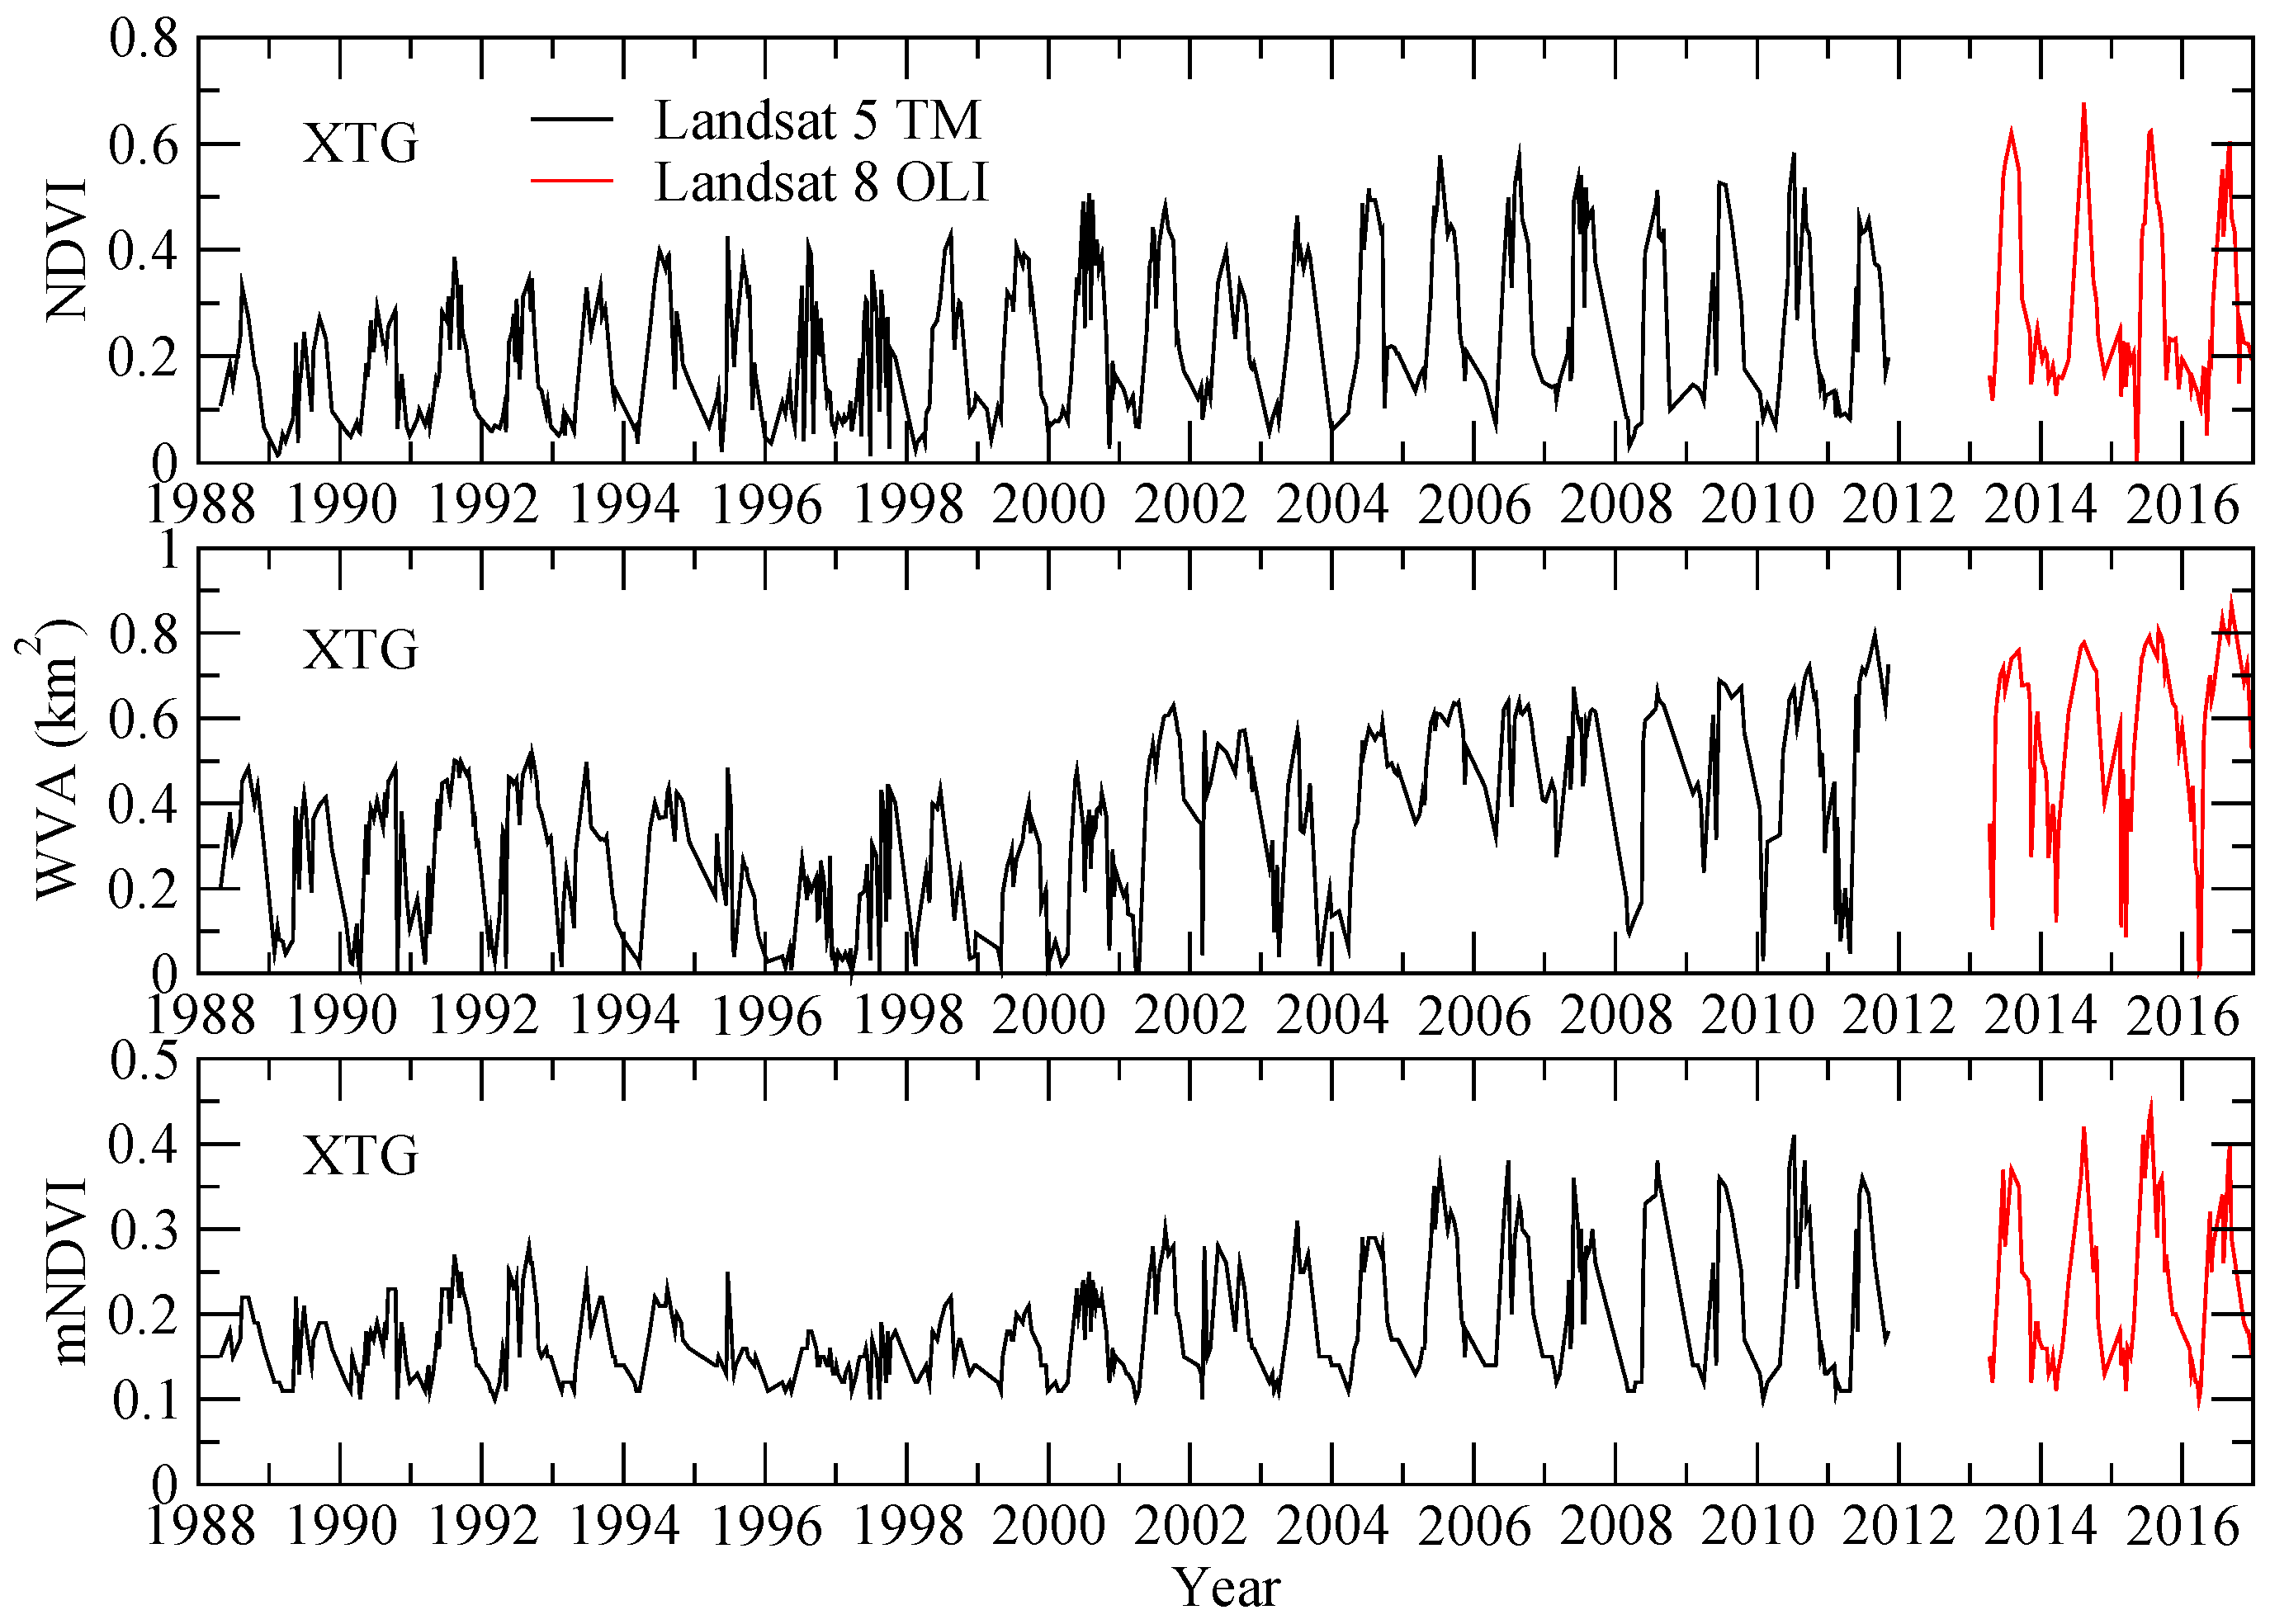
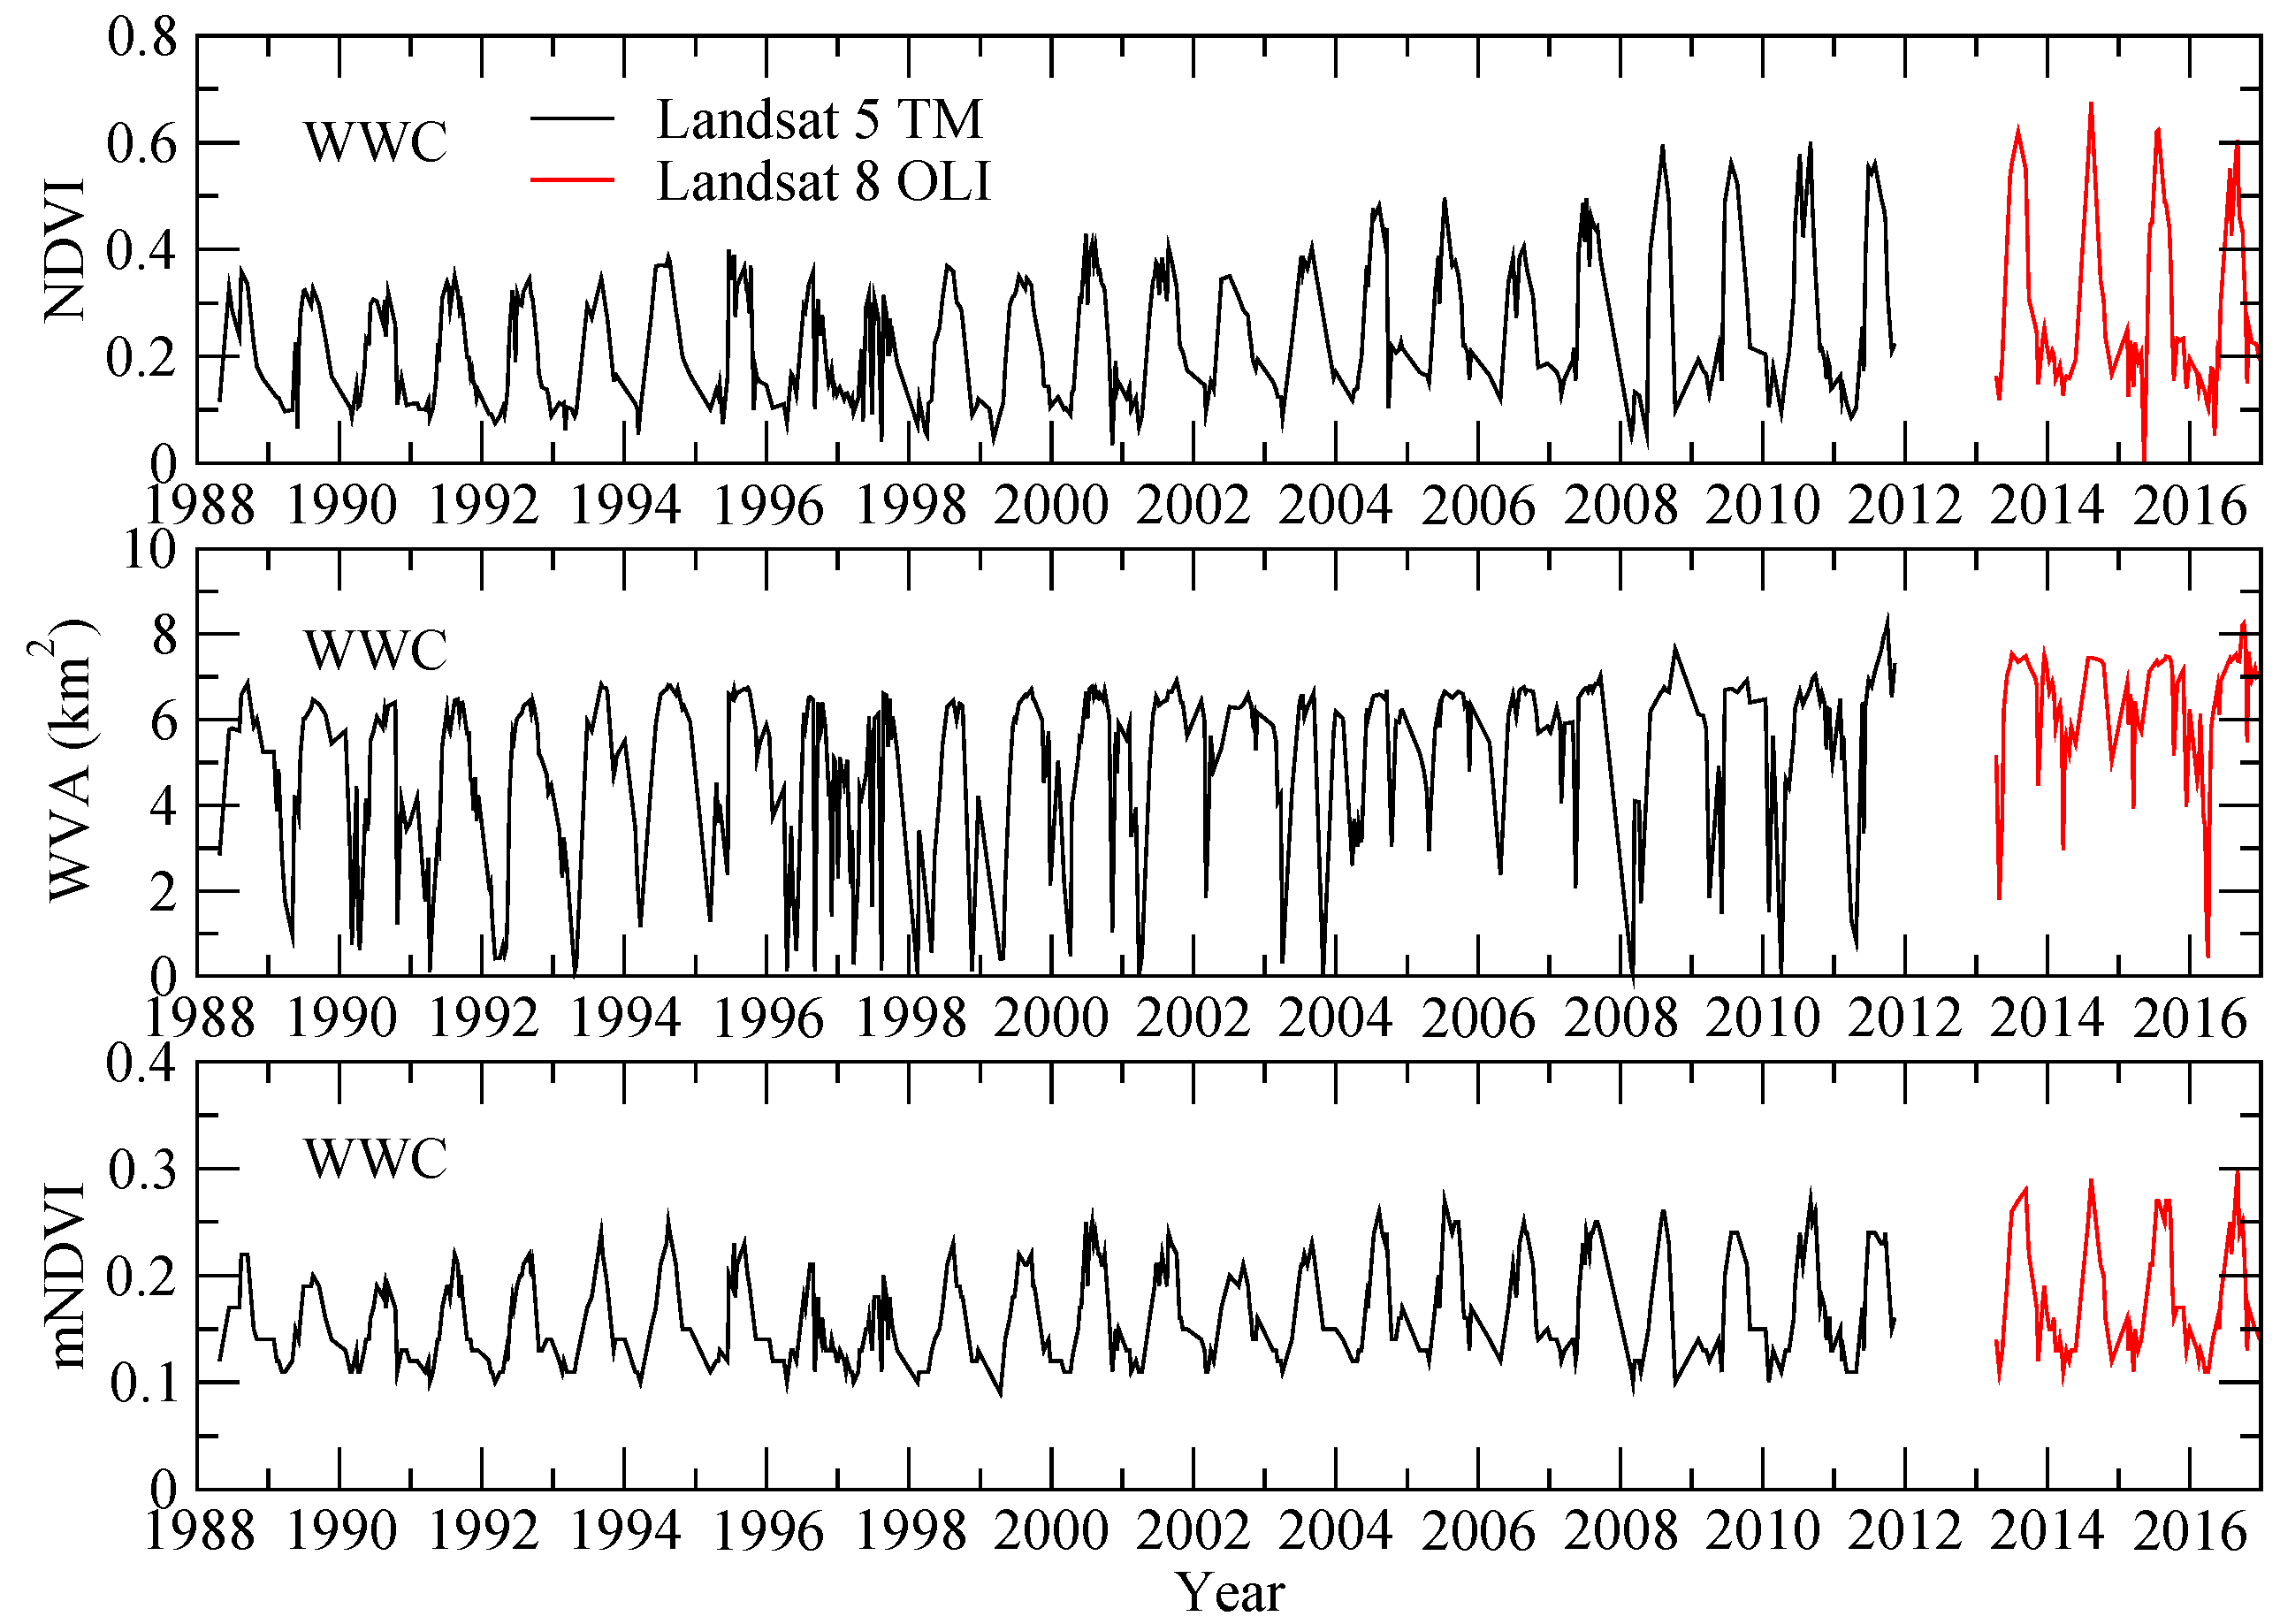
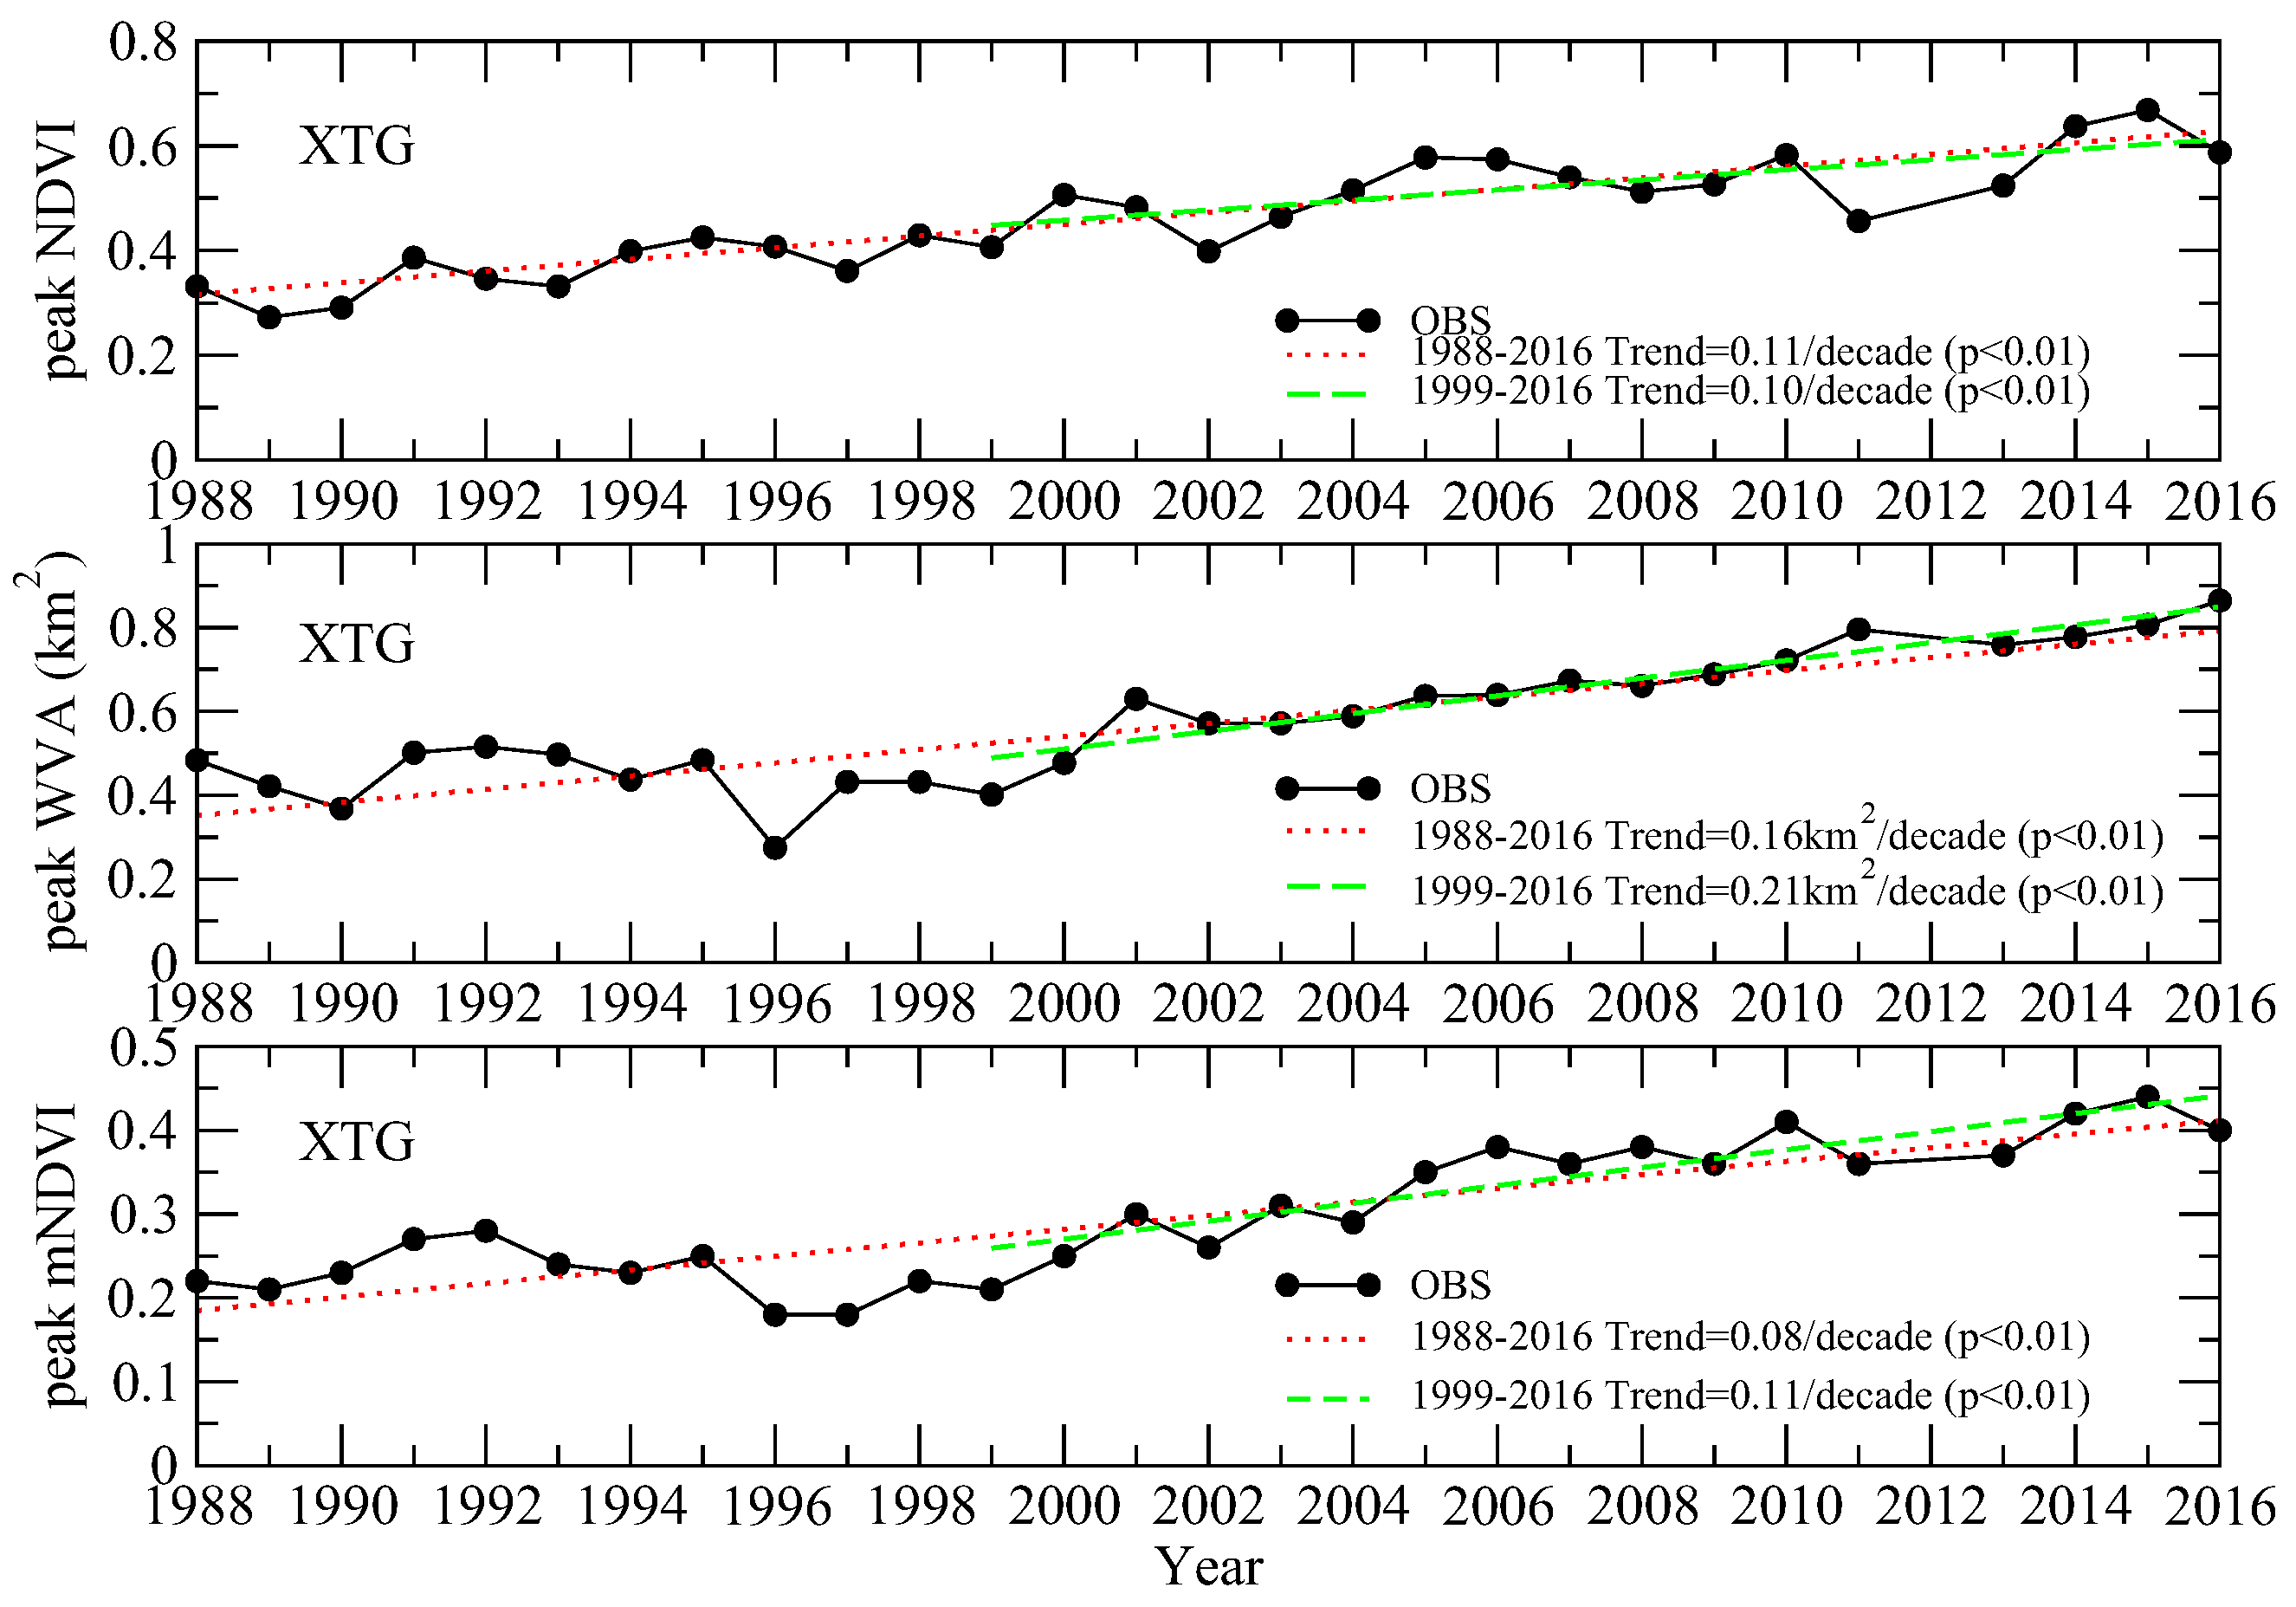
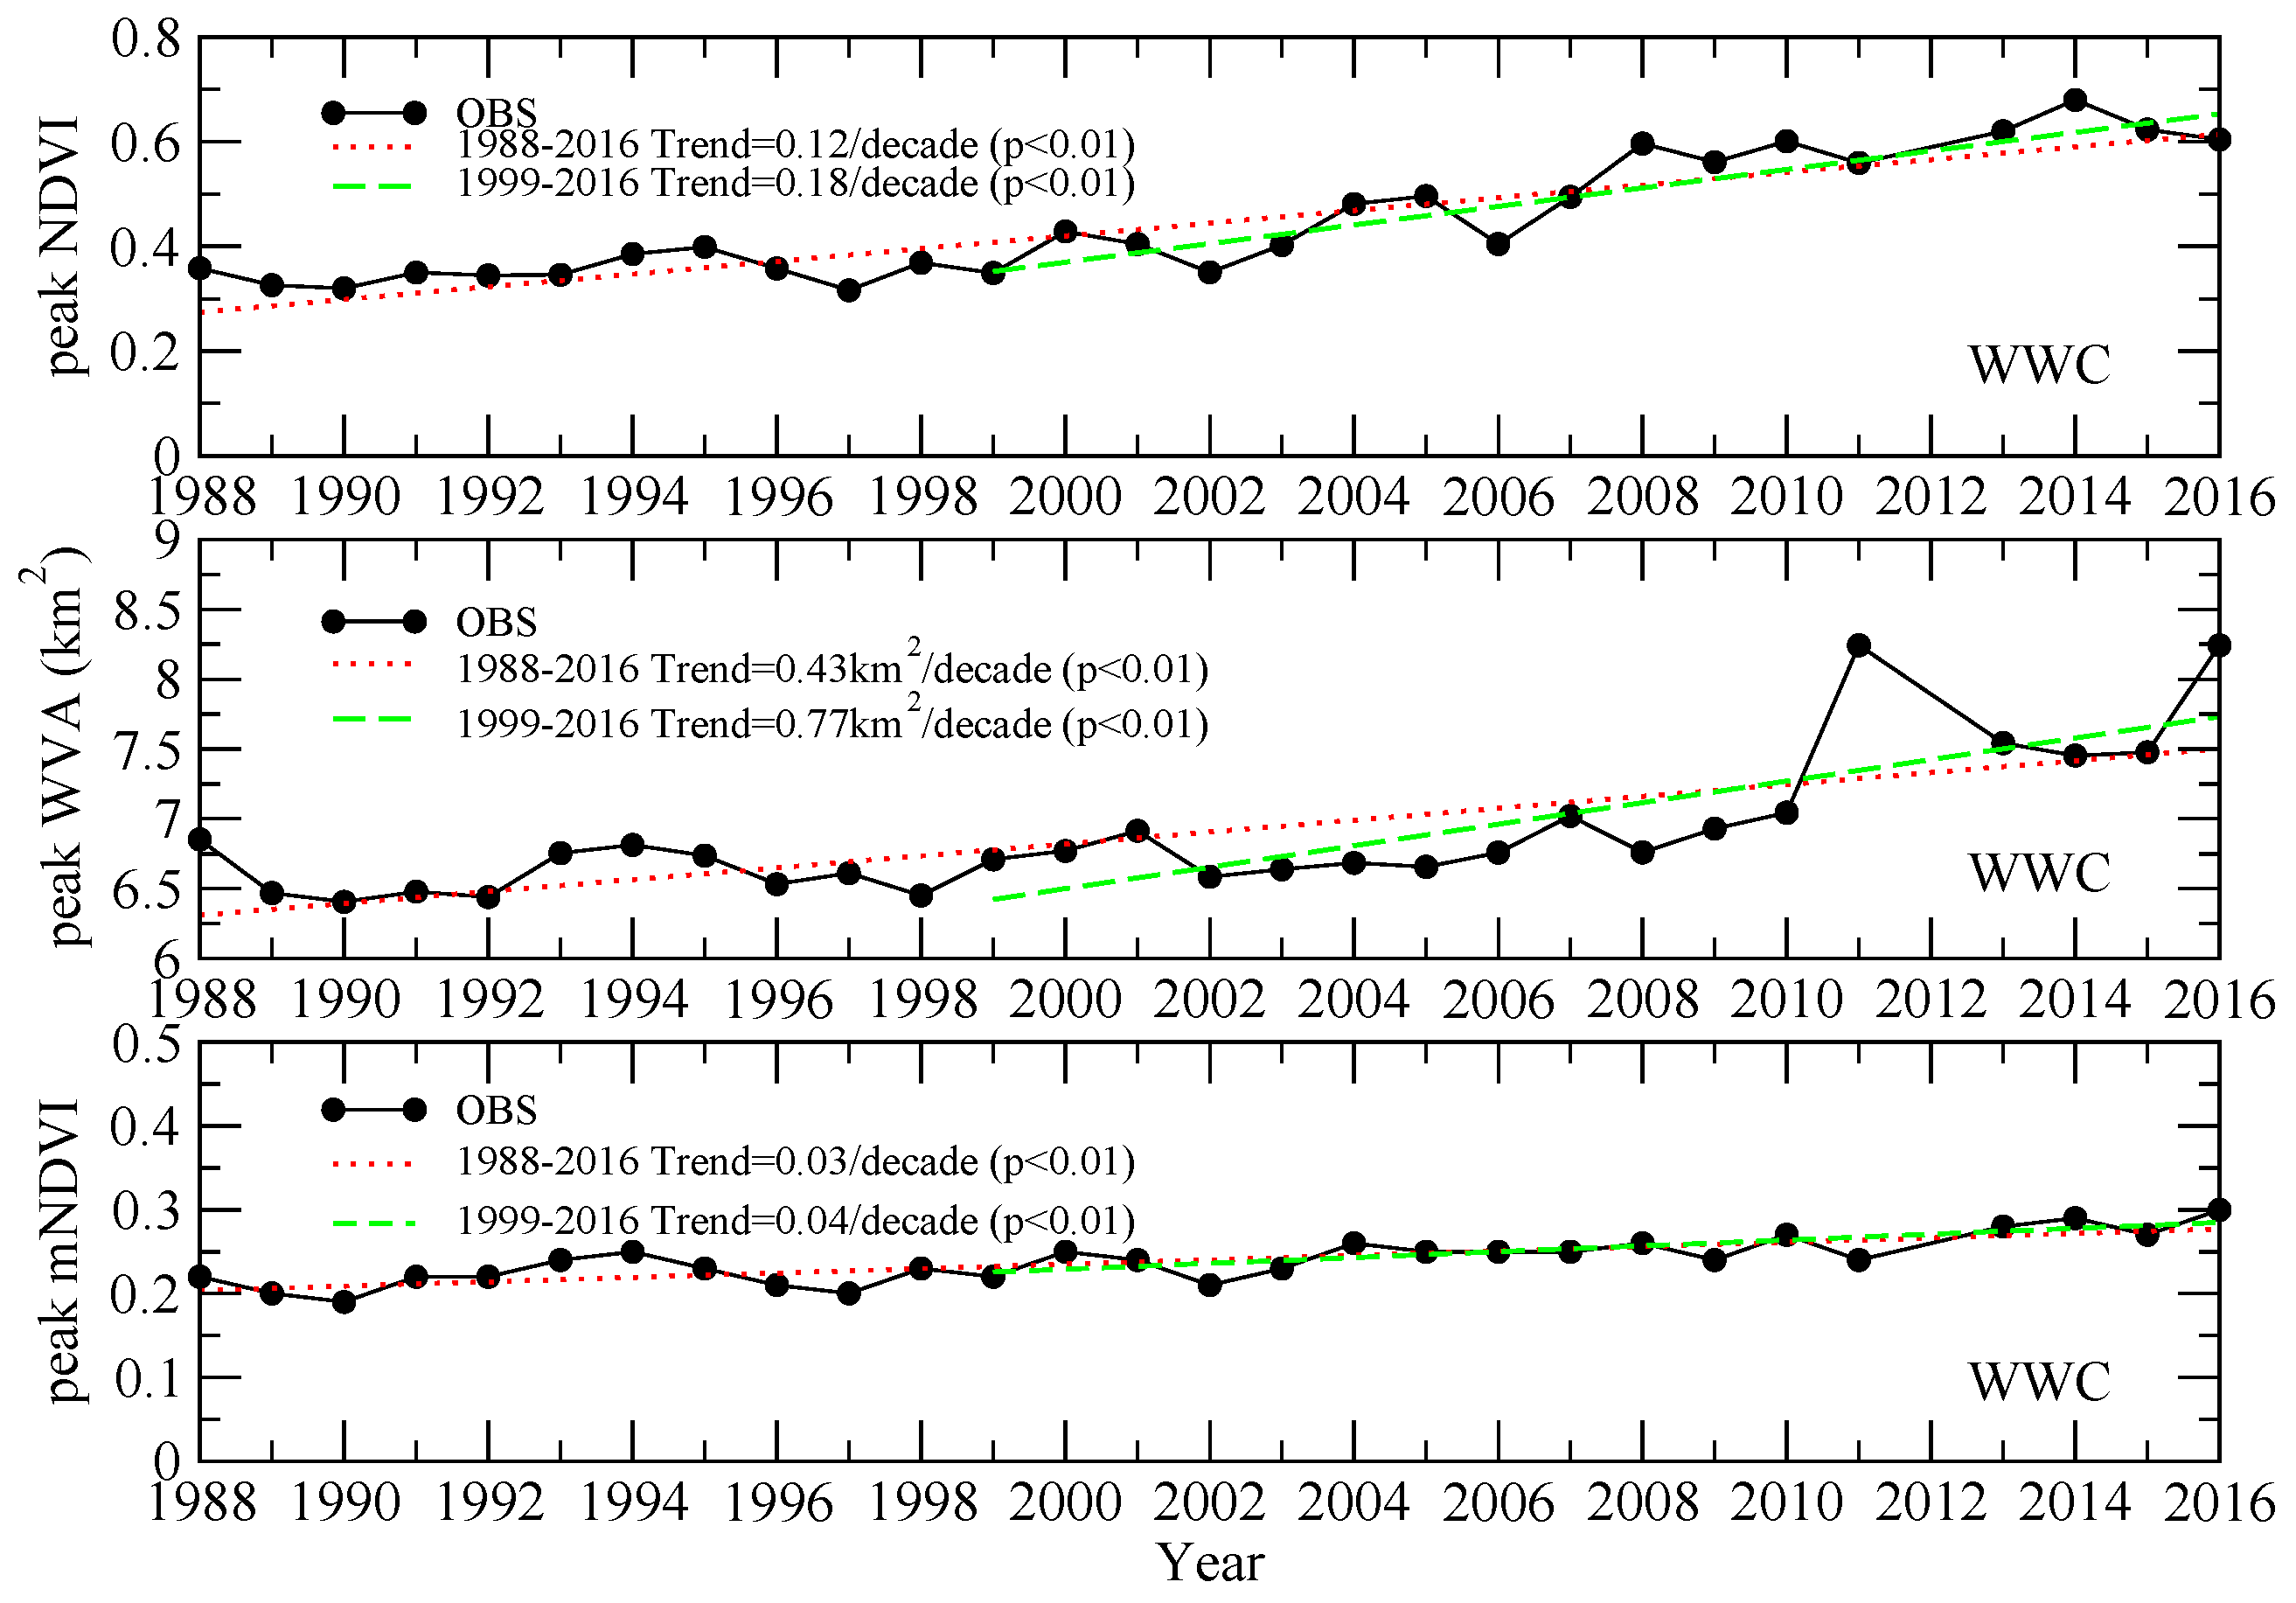
4.3. Analysis of the Landsat Derived NDVIs of the Wetland Vegetation in the YNNR

To evaluate the climate change impacts on the wetland vegetation in the YNNR, we first used the methods described in Section 3.1 to compute the NDVI based on near-infrared and red band images of each of the 541 downloaded Landsat scenes (453 Landsat 5 TM and 88 Landsat 8 OLI images). As an example, Figure 8 shows the computed NDVI in the YNNR on June 21, 2015, from the Landsat 8 OLI near-infrared and red band images. According to Figure 8, the NDVI of the majority of the area is less than 0.1 because of the Gobi Desert. The areas with NDVI >0.5 are orchards, vineyards, and crop fields. Areas in the XTG and WWC as marked polygons in Figure 8 showing NDVI >0.1 are associated with wetland vegetation. In this study, two approaches were employed for analyzing the computed NDVIs. We first selected one area with full wetland vegetation cover each in the XTG and WWC areas. Considering the wetland vegetation in the XTG was confined to the narrow stream channel (the channel width ranges from about 40 m to 200 m), we only identified one Landsat image pixel (900 m2), each near the center of one wetland vegetation patch in the XTG and WWC. These two typical wetland vegetation pixels were confirmed by the ground survey conducted on 22–23 June 2015 (see Figure 8) and their geographic coordinates are XTG (39.914°N, 94.037°E) and WWC (39.869°N, 94.127°E) as pointed by the red arrows in Figure 8. The time series plots of the computed NDVIs of these two pixels were shown in Figure 9 and Figure 10 for the XTG and WWC, respectively. During the growing seasons, some very low NDVIs shown in Figure 9 and Figure 10 are due to clouds.
Based on the ground survey (22–23 June 2015) and the high-resolution satellite imagery provided by Google Earth, we determined that NDVI >0.1 was the best threshold for identifying the wetland vegetation in the XTG and WWC. Using the threshold of 0.1, we computed the wetland vegetated area (WVA) (that is, NDVI >0.1) and the spatial mean NDVI (mNDVI) inside the XTG and WWC from each Landsat derived NDVI image. The time series plots of WVA and mNDVI for the XTG and WWC were also plotted in Figure 9 and Figure 10, respectively.
According to Figure 9 and Figure 10, the wetland vegetation in the identified typical wetland vegetation pixels and the wetland vegetated area (WVA) and the spatial mean NDVI (mNDVI) of the entire wetland vegetation in the XTG and WWC all exhibited an increasing trend, especially during the past 20 years, which are clearly reflected in the annual maximum values that are directly related to the overall productivity and biomass in the entire wetland area [21,22]. Therefore, it is better to conduct the trend and correlation analyses of the annual maximum values rather than the entire time series of the computed NDVIs, WVAs, and mNDVIs. The time series plots of these peak values at the XTG and WWC are plotted in Figure 11 and Figure 12, respectively. As shown in Figure 11 and Figure 12, a significant increasing trend (p < 0.01) was detected for each of the peak values (that is, NDVI, WVA, and mNDVI) at both the XTG and WWC during 1988–2016. Given the CMC’s snow depth dataset is from 1999 to 2016, the trend analysis was also performed for each time series plot of peak values during 1999–2016 (see Figure 11 and Figure 12). Similar to the detected trends during the past 30 years, all trends during the past 20 years were also positive and significant (p < 0.01). Almost all the trends of the past 20 years except for the peak NDVI trend at the XTG are greater than those of the past 30 years, especially the growth rate of the peak WVA (wetland vegetated area) at the WWC during 1999–2016 which increased by 80%.

4.4. Climate Change Impacts on the Wetland Vegetation in the YNNR

As the results shown in Section 4.2, the climate in the YNNR during the past 60 years has exhibited a significant warming trend in the annual mean temperature (trend = 0.23 °C/decade, p < 0.01), and a significant “wetting” trend in the annual precipitation (trend = 4.5 mm/decade, p < 0.01). To correlate the climate change in the YNNR with the temporal variation of the wetland vegetation at the XTG and WWC, we first employed the trend analysis to extract the trends in the annual mean temperature and annual precipitation during the past 30 years, as shown in Figure 13.
According to Figure 13 from 1988 to 2016, the annual mean temperature displayed a significant increasing trend with a rate of +0.51 °C/decade (p < 0.01) which is more than double of the trend (+0.23 °C/decade) during the past 60 years, and the annual precipitation also showed a non-significant increasing trend with a rate of +5.1 mm (p > 0.05) which is close to the trend during the past 60 years (that is, +4.5 mm/decade, p < 0.01). These results indicate that during the past 30 years, the climate warming in the YNNR has intensified, while the precipitation regime has not changed significantly because the annual precipitation in the YNNR had only increased at a very low rate. Using the correlation analysis method as described in Section 3.2, we computed the correlation coefficients (r) between the wetland vegetation characteristics (that is, the peak NDVI, peak WVA, and peak mNDVI) and the climatic variables, that is, the annual mean temperature and annual precipitation, and listed the results in Table 4.
The results shown in Table 4 indicate that the increased annual mean temperatures in the YNNR played a significant role in the wetland vegetation growth in the XTG and WWC during the past 30 years (1988–2016) because all the correlations coefficients between the wetland vegetation characteristics and annual mean temperature are above 0.50 and the p values are less than 0.01. However, the non-significant increase in precipitation (+5.1 mm/decade, p > 0.05) contributed little to the wetland vegetation growth in the YNNR during the past 30 years, because all correlations coefficients between the wetland vegetation characteristics and annual precipitation are less than 0.30 and p > 0.05.
The photosynthesis of vegetation requires sunlight and water. The YNNR in the Gobi Desert has sufficient sunshine. Therefore, the growth of the vegetation in the YNNR mainly depends on the supply of water. We know that the surface water in the YNNR is extremely scarce and the growth of vegetation primarily depends on the melting of snow from the Altun Mountains, recharging into the groundwater system and flowing from the south to the north beneath the surface as the groundwater flows. Part of the groundwater in the vicinity of the YNNR emerges as springs at the surface (known as seepages or spring eyes). Therefore, to study the impacts of climate change on the wetland vegetation in the YNNR, changes in the snow cover in the Altun Mountains and the impacts caused by the snow cover changes should also be evaluated. In this study, the annual peak snow depth over the Altun Mountains during each snow cover season from 1999 to 2016 was extracted from the Canadian Meteorological Centre (CMC) operational global daily snow depth analysis data [18] (the CMC snow depth data is only available from 1999 to current). Based on the period of the CMC snow depth data, we re-assessed the trend values of each climatic variable including the annual peak snow depth during the past 20 years (that is, 1999–2016) and plotted them in Figure 14.
Figure 14 indicates that from 1999 to 2016, the annual mean temperature and annual precipitation in the YNNR both displayed an insignificant (p > 0.05) increasing trend at a rate of +0.28 °C/decade and +8.8 mm/decade, respectively, while the annual peak snow depth over the Altun Mountains showed a significant increasing trend (2.63 cm/decade, p < 0.01). According to Figure 11 and Figure 12, the wetland vegetation at the XTG and WWC also exhibited a significant increasing trend during 1999–2016 and the growth rates of the wetland vegetation characteristics (i.e., peak NDVI, peak WVA, and peak mNDVI) of the past 20 years are generally greater than those of the past 30 years. To evaluate the cause of these significant increasing trends, we computed the correlation coefficients between the wetland vegetation characteristics and the climatic variables and listed them in Table 5.
The results listed in Table 5 demonstrate that during the past 20 years, the major contributor to wetland vegetation growth at the XTG and WWC is the increased annual peak snow depth in the Altun Mountains because all the correlation coefficients are greater than 0.40, and p < 0.05, while the correlation coefficients between the wetland vegetation characteristics with annual mean temperature and annual precipitation are all less than 0.30, and p > 0.05. The correlation coefficients between the annual precipitation and the wetland vegetation characteristic at the XTG are generally greater than those at the WWC, which is probably due to the fact that the wetland vegetation at the XTG mainly grows in the stream channel (known as the XTG, see Figure 3) with surface water detention. Therefore, the surface runoff generated by the precipitation is collected in the XTG and thus, has a direct impact on and contribution to the XTG’s wetland vegetation. While the wetland vegetation growing at the WWC is distributed on a relatively flat terrain (see Figure 3) with limited surface water detention, and thus, the local precipitation caused a lesser impact on the wetland vegetation at the WWC.

5. Conclusions

To study the climate change impacts on the wetland vegetation in the Dunhuang Yangguan National Nature Reserve (YNNR) (39°39′–40°05′N, 93°53′–94°17′E) in the Gansu Province of China, about 541 Landsat 5 TM and Landsat 8 OLI images between 1988 and 2016 were used to compute the normalized difference vegetation indices (NDVIs) of the wetland vegetation (mainly reed) at Xitugou (XTG) and Wowachi (WWC) inside the YNNR. At each site, three wetland vegetation characteristics were extracted from the computed NDVIs for evaluating the climate change impacts on the wetland vegetation, which include (1) the annual maximum NDVI at the identified typical wetland vegetation area (i.e., peak NDVI); (2) the annual maximum wetland vegetated area (i.e., peak WVA); and (3) the annual maximum spatial mean NDVI of the wetland vegetated area (i.e., peak mNDVI). It was found that the wetland vegetation at XTG and WWC both had shown a significant increasing trend in the past 20–30 years. Almost all the trends of the past 20 years except for the peak NDVI trend at the XTG were greater than those of the past 30 years, and the growth rate of the peak WVA (wetland vegetated area) at the WWC during 1999–2016 increased by 80%. The increase in the annual mean temperature in the past 20 years combined with the increase in the annual peak snow depth over the Altun Mountains led to the increase of the wetland vegetation at XTG and WWC. The contribution of the snowmelt to the increase of the wetland vegetation in the YNNR was higher than the contributions from the temperature rise and the slight precipitation increase. The influence of the local precipitation on the wetland vegetation at the XTG was greater than that at the WWC, since the XTG’s wetland vegetation mainly grows in the confluence area of the stream channel with a larger flow accumulation area, while the WWC’s wetland vegetation grows on a large flat area. This study demonstrated that in extremely arid regions such as the YNNR with an average annual precipitation less than 50 mm, the major constraint to the wetland vegetation is the water availability in soils which is greatly related to the surface water detention and discharge of groundwater. At both XTG and WWC, the snowmelt from the Altun Mountains is the main contributor to the groundwater discharge, while the local precipitation plays a less important role in influencing the WWC’s wetland vegetation growing on a relatively flat terrain (with lower surface water detention) than the XTG’s wetland vegetation living inside a stream channel (with higher surface water detention).

Author Contributions

F.P., J.X. and Y.J. conceived and designed the study; F.P., J.L. and T.Z. conducted the field experiments; F.P., Q.H. and X.P. analyzed the climate data; F.P., C.W. and X.X. processed Landsat images and analyzed NDVIs; F.P. wrote the paper.

Acknowledgments

The authors would like to thank guest editors Huilin Gao and Liming Zhou, and three anonymous reviewers for their constructive comments and suggestions. This study was partially funded by the Dunhuang Yangguan National Nature Reserve Administration and Management Bureau.

Conflicts of Interest

The authors declare no conflict of interest. The founding sponsors had no role in the design of the study; in the collection, analyses, or interpretation of data; in the writing of the manuscript, and in the decision to publish the results.

References

  1. Bradley, R.S. Past global changes and their significance for the future. Quat. Sci. Rev. 2000, 19, 391–402. [Google Scholar] [CrossRef]
  2. Bradley, R.S. 1000 years of climate change. Science 2000, 288, 1353–1355. [Google Scholar] [CrossRef]
  3. Luterbacher, J.; Dietrich, D.; Xoplaki, A.E.; Grosjean, M.; Wanner, H. European seasonal and annual temperature variability, trends, and extremes since 1500. Science 2004, 303, 1499–1503. [Google Scholar] [CrossRef] [PubMed]
  4. O’Gorman, P.A.; Schneider, A. The physical basis for increases in precipitation extremes in simulations of 21st-century climate change. Proc. Natl. Acad. Sci. USA 2009, 106, 14773–14777. [Google Scholar] [CrossRef] [PubMed]
  5. Trenberth, K.E. Attribution of climate variations and trends to human influences and natural variability. Wiley Interdiscip. Rev. Clim. Chang. 2011, 2, 925–930. [Google Scholar] [CrossRef]
  6. Walther, G.R.; Post, E.; Convey, P.; Menzel, A.; Parmesan, C.; Beebee, T.J.; Fromentin, J.M.; Hoegh-Guldberg, O.; Bairlein, F. Ecological responses to recent climate change. Nature 2002, 416, 389–395. [Google Scholar] [CrossRef] [PubMed]
  7. Frich, P.; Alexander, L.V.; Della-Marta, D.; Gleason, B.; Haylock, M.; Klein Tank, A.M.G.; Pelerson, T. Observed coherent changes in climatic extremes during the second half of the twentieth century. Clim. Res. 2002, 19, 193–212. [Google Scholar] [CrossRef]
  8. Wentz, F.J.; Ricciardulli, L.; Hilburn, K.; Mears, C. How much more rain will global warming bring? Science 2007, 317, 233–235. [Google Scholar] [CrossRef] [PubMed]
  9. Dore, M.H. Climate change and changes in global precipitation patterns: What do we know? Environ. Int. 2005, 31, 1167–1181. [Google Scholar] [CrossRef] [PubMed]
  10. Erwin, K.L. Wetlands and global climate change: The role of wetland restoration in a changing world. Wetl. Ecol. Manag. 2009, 17, 71–84. [Google Scholar] [CrossRef]
  11. Scavia, D.; Field, J.C.; Boesch, D.F.; Buddemeier, R.W.; Burkett, V.; Cayan, D.R.; Fogarty, M.; Harwell, M.A.; Howarth, R.W.; Mason, C.; et al. Climate change impacts on U.S. coastal and marine ecosystems. Estuaries 2002, 25, 149–164. [Google Scholar] [CrossRef]
  12. Burkett, V.; Kusler, J. Climate change: Potential impacts and interactions in wetlands of the United States. J. Am. Water Resour. Assoc. 2000, 36, 313–320. [Google Scholar] [CrossRef]
  13. Adam, E.; Mutanga, O.; Rugege, D. Multispectral and hyperspectral remote sensing for identification and mapping of wetland vegetation: A review. Wetl. Ecol. Manag. 2010, 18, 281–296. [Google Scholar] [CrossRef]
  14. Silva, T.S.; Costa, M.P.; Melack, J.M.; Novo, E.M. Remote sensing of aquatic vegetation: Theory and applications. Environ. Monit. Assess. 2008, 140, 131–145. [Google Scholar] [CrossRef] [PubMed]
  15. Mutanga, O.; Adam, E.; Cho, M.A. High density biomass estimation for wetland vegetation using WorldView-2 imagery and random forest regression algorithm. Int. J. Appl. Earth Obs. Geoinf. 2012, 18, 399–406. [Google Scholar] [CrossRef]
  16. Owino, A.O.; Ryan, P.G. Recent papyrus swamp habitat loss and conservation implications in western Kenya. Wetl. Ecol. Manag. 2007, 15, 1–12. [Google Scholar] [CrossRef]
  17. Huang, J.; Wang, S.; Yan, L.; Zhong, Q. Plant photosynthesis and its influence on removal efficiencies in constructed wetlands. Ecol. Eng. 2010, 36, 1037–1043. [Google Scholar] [CrossRef]
  18. Rouse, J.W.; Haas, R.H.; Schell, J.A.; Deering, D.W. Monitoring vegetation systems in the Great Plains with ERTS. In Proceedings of the 3rd Earth Resource Technology Satellite (ERTS) Symposium, Washington, DC, USA, 10–14 December 1973; Scientific and Technical Information Office, National Aeronautics and Space Administration: Washington, DC, USA, 1974; Volume 1, pp. 48–62. [Google Scholar]
  19. Deering, D.W.; Rouse, J.W.; Haas, R.H.; Schell, J.A. Measuring forage production of grazing units from Landsat MSS data. In Proceedings of the 10th International Symposium on Remote Sensing of Environment; University of Michigan: Ann Arbor, MI, USA, 1975; pp. 1169–1178. [Google Scholar]
  20. Deering, D.W. Rangeland Reflectance Characteristics Measured by Aircraft and Spacecraft Sensors. Ph.D. Dissertation, Texas A&M University, College Station, TX, USA, 1978; 338p. [Google Scholar]
  21. Pettorelli, N.; Vik, J.O.; Mysterud, A.; Gaillard, J.; Tucker, C.J.; Stenseth, N.C. Using the satellite-derived NDVI to assess ecological responses to environmental change. Trends Ecol. Evol. 2005, 20, 503–510. [Google Scholar] [CrossRef] [PubMed]
  22. Peruelo, J.M.; Lauenroth, W.K. Inter-annual variability of NDVI and its relationship to climate for North American shrublands and grasslands. J. Biogeogr. 1998, 25, 721–733. [Google Scholar] [CrossRef]
  23. Forkel, M.; Carvalhais, N.; Verbesselt, J.; Mahecha, M.D.; Neigh, C.S.R.; Reichstein, M. Trend change detection in NDVI time series: Effects of inter-annual; variability and methodology. Remote Sens. 2013, 5, 2113–2144. [Google Scholar] [CrossRef]
  24. Eastman, J.R.; Sangermano, F.; Machado, E.A.; Rogan, J.; Anyamba, A. Global trends in seasonality of normalized difference vegetation index (NDVI), 1982–2011. Remote Sens. 2013, 5, 4799–4818. [Google Scholar] [CrossRef]
  25. Bhatt, U.; Walker, D.A.; Raynolds, M.K.; Bieniek, P.A.; Epstein, H.E.; Comiso, J.C.; Pinzon, J.Z.; Tucker, C.J.; Polyakov, I.V. Recent declines in warming and vegetation greening trends over Pan-Arctic Tundra. Remote Sens. 2013, 5, 4229–4254. [Google Scholar] [CrossRef]
  26. Mao, J.; Shi, X.; Thorton, P.E.; Hoffman, F.M.; Zhu, Z.C.; Myneni, R.B. Global latitudinal-asymmetric vegetation growth trends and their driving mechanisms: 1982–2009. Remote Sens. 2013, 5, 1484–1497. [Google Scholar] [CrossRef]
  27. Kariyeva, J.; van Leeuwen, W.J.D. Environmental drivers of NDVI-based vegetation phenology in Central Asia. Remote Sens. 2011, 3, 203–246. [Google Scholar] [CrossRef]
  28. Xu, G.; Zhang, H.; Chen, B.; Zhang, H.; Innes, J.L.; Wang, G.; Yan, J.; Zheng, Y.; Zhu, Z.; Myneni, R.B. Changes in vegetation growth dynamics and relations with climate over China’s landmass from 1982 to 2011. Remote Sens. 2014, 6, 3263–3283. [Google Scholar] [CrossRef]
  29. Bi, J.; Xu, L.; Samanta, A.; Zhu, Z.; Myneni, R. Divergent Arctic-Boreal vegetation changes between North America and Eurasia over the past 30 years. Remote Sens. 2013, 5, 2093–2112. [Google Scholar] [CrossRef]
  30. Li, Z.; Guo, X. Detecting climate effects on vegetation in northen mixed prairie using NOAA AVHRR 1-km time series NDVI data. Remote Sens. 2012, 4, 120–134. [Google Scholar] [CrossRef]
  31. Liu, Y.; Li, Y.; Li, S.; Motesharrei, S. Spatial and temporal patterns of global NDVI trends: Correlations with climate and human factors. Remote Sens. 2015, 7, 13233–13250. [Google Scholar] [CrossRef]
  32. Zhou, Y.; Zhang, L.; Fensholt, R.; Wang, K.; Vitkovskaya, I.; Tian, F. Climate contributions to vegetation variations in Central Asian Drylands: Pre-and Post-USSR collapse. Remote Sens. 2015, 7, 2449–2470. [Google Scholar] [CrossRef]
  33. Bao, G.; Qin, Z.; Bao, Y.; Zhou, Y.; Li, W.; Sanjjav, A. NDVI-based long-term vegetation dynamics and its response to climatic change in the Mongolian Plateau. Remote Sens. 2014, 6, 8337–8358. [Google Scholar] [CrossRef]
  34. He, B.; Chen, A.; Wang, H.; Wang, Q. Dynamic response of satellite-derived vegetation growth to climate change in the Three North Shelter Forest region in China. Remote Sens. 2015, 7, 9998–10016. [Google Scholar] [CrossRef]
  35. Li, S.; Yang, S.; Liu, X.; Liu, Y.; Shi, M. NDVI-based analysis on the influence of climate change and human activities on vegetation restoration in the Shaanxi-Gansu-Ningxia Region, Central China. Remote Sens. 2015, 7, 11163–11182. [Google Scholar] [CrossRef]
  36. Cai, H.; Yang, Y.; Wang, K.; Xiao, J. Is forest restoration in the Southwest China karst promoted mainly by climate change or human induced factors? Remote Sens. 2014, 6, 9895–9910. [Google Scholar] [CrossRef]
  37. Liu, X.; Zhu, X.; Li, S.; Liu, Y.; Pan, Y. Changes in growing season vegetation and their associated driving forces in China during 2001–2012. Remote Sens. 2015, 7, 15517–15535. [Google Scholar] [CrossRef]
  38. Hou, W.; Gao, J.; Wu, S.; Dai, E. Interannual variations in growing–season NDVI and its correlation with climate variables in the southwest karst region of China. Remote Sens. 2015, 7, 11105–11124. [Google Scholar] [CrossRef]
  39. Zhang, R.; Ouyang, Z.; Xie, X.; Guo, H.; Tan, D.; Xiao, X.; Qi, J.; Zhao, B. Impact of climate change on vegetation growth in arid northwest of China from 1982 to 2011. Remote Sens. 2016, 8. [Google Scholar] [CrossRef]
  40. Gao, Q.; Schwartz, M.; Zhu, W.; Wan, Y.; Qing, X.; Ma, X.; Liu, S.; Williamson, M.A.; Peters, C.B.; Li, Y. Changes in global grassland productivity during 1982 to 2011 attributable to climatic factors. Remote Sens. 2016, 8. [Google Scholar] [CrossRef]
  41. Huang, K.; Zhang, Y.; Zhu, J.; Liu, Y.; Zu, J.; Zhang, J. The influence of climate change and human activities on vegetation dynamics in the Qinghai-Tibet Plateau. Remote Sens. 2016, 8. [Google Scholar] [CrossRef]
  42. Tang, B.; Wu, D.; Zhao, X.; Zhou, T.; Zhao, W.; Wei, H. The observed impacts of wind farms on local vegetation growth in northern China. Remote Sens. 2017, 9. [Google Scholar] [CrossRef]
  43. Xia, G.; Zhou, L. Detecting wind farm impacts on local vegetation growth in Texas and Illinois using MODIS vegetation greenness measurements. Remote Sens. 2017, 9. [Google Scholar] [CrossRef]
  44. Brown, R.D.; Brasnett, B. Canadian Meteorological Centre (CMC) Daily Snow Depth Analysis Data, 2017, Version 1; NASA National Snow and Ice Data Center Distributed Active Archive Center: Boulder, CO, USA, 2017.
  45. Chander, G.; Markham, B.L.; Helder, D.L. Summary of current radiometric calibration coefficients for Landsat MSS < TM, ETM+, and EO-1 ALIO sensors. Remote Sens. Environ. 2009, 113, 893–903. [Google Scholar]
  46. Roy, D.P.; Kovalskyy, V.; Zhang, H.K.; Vermote, E.F.; Yan, L.; Kumar, S.S.; Egorov, A. Characterization of Landsat-7 to Landsat-8 reflective wavelength and normalized difference vegetation index continuity. Remote Sens. Environ. 2016, 185, 57–70. [Google Scholar] [CrossRef]
  47. IPCC. Climate Change 2013: The Physical Science Basis Technical Summary; Intergovernmental Panel on Climate Change: Geneva, Switzerland, 2013; 222p. [Google Scholar]
Figure 1. The locations of the two wetlands, i.e., Xitugou (XTG) and Wowachi (WWC), inside the Yangguan National Nature Reserve (YNNR) in the Gansu Province of China. The arrows marked DHS (Dunhuang Station) and WCS (Wowachi Station) point to the locations of the Dunhuang weather station and the Wowachi automatic weather station, respectively.
Remotesensing 10 00735 g001
Figure 2. The time series plots of the monthly mean air temperatures and monthly precipitations measured at the Dunhuang weather station and the Wowachi automatic weather station.
Remotesensing 10 00735 g002
Figure 3. The hydrologic regime of the YNNR. The blue lines are channel networks, and the red lines are watershed divides.
Remotesensing 10 00735 g003
Figure 4. The time series plot of the cloud cover percentages of all the downloaded Landsat 5 TM (black) and Landsat 8 OLI (red) images.
Remotesensing 10 00735 g004
Figure 5. The plots of monthly mean air temperature, monthly precipitation, monthly mean vapor pressure, and wind speed.
Remotesensing 10 00735 g005
Figure 6. The time series plot of the annual mean temperature and the trend (top); the annual mean temperature anomaly plot (bottom).
Remotesensing 10 00735 g006
Figure 7. The time series plot of the annual precipitation and the trend (top); and annual precipitation anomaly plot (bottom).
Remotesensing 10 00735 g007
Figure 8. The NDVI on 21 June 2015 computed from the Landsat 8 OLI near infrared and red band images. The red arrows point to the typical wetland vegetation pixels in the XTG and WWC on the NDVI image (top). Two pictures (bottom) showing the wetland vegetation and the landscape of these two pixels that were taken during the field survey on 22–23 June 2015.
Remotesensing 10 00735 g008
Figure 9. The time series plots of NDVI at the XTG’s typical wetland vegetation pixel (top), the wetland vegetated area (center), and the spatial mean NDVI (bottom) in the XTG.
Remotesensing 10 00735 g009
Figure 10. The time series plots of NDVI at the WWC’s typical wetland vegetation pixel (top), the wetland vegetated area (center), and the spatial mean NDVI (bottom) in the WWC.
Remotesensing 10 00735 g010
Figure 11. The time series plots and trends of peak NDVI at the XTG’s typical wetland vegetation pixel (top), the peak wetland vegetated area (center), and the peak spatial mean NDVI (bottom) in the XTG.
Remotesensing 10 00735 g011
Figure 12. The time series plots and trends of peak NDVI at the WWC’s typical wetland vegetation pixel (top), peak wetland vegetated area (center), and the peak spatial mean NDVI (bottom) in the WWC.
Remotesensing 10 00735 g012
Figure 13. The time series plots and trends of the annual mean temperature (top) and annual precipitation (bottom) in the YNNR.
Remotesensing 10 00735 g013
Figure 14. The time series plots and trends of the annual mean temperature (top) and annual precipitation (center) in the YNNR, and the annual peak snow depth in the Altun Mountains (bottom) during 1999–2016.
Remotesensing 10 00735 g014
Table 1. The Landsat spectral bands used for computing NDVI.
BandLandsat 5 TMLandsat 8 OLI
Band Indexλ (μm)Band Indexλ (μm)
RedBand 30.626–0.693Band 40.636–0.673
NIRBand 40.776–0.904Band 50.851–0.879
Table 2. The band-specific rescaling factors for Landsat 5′s band 3 and band 4.
Gλ (W/(m2 sr μm))Bλ (W/(m2 sr μm))
Band 31.043976−2.21
Band 40.876024−2.39
Table 3. The Earth-Sun distance in astronomical units.
DOYdDOYdDOYdDOYd
10.9832910.99931961.01652880.9972
150.98361061.00332131.01493050.9925
320.98531211.00762271.01283190.9892
460.98781351.01092421.00923350.9860
600.990915211.01402581.00573490.9843
740.99451661.01582741.00113650.9833
Table 4. The correlation coefficients (r) between the wetland vegetation characteristics at the XTG and WWC and the annual mean temperature and annual precipitation in the YNNR during 1988–2016.
Peak NDVIPeak WVAPeak mNDVI
XTGWWCXTGWWCXTGWWC
T *0.65 (p < 0.01)0.53 (p < 0.01)0.62 (p < 0.01)0.51 (p < 0.01)0.56 (p < 0.01)0.54 (p < 0.01)
P *0.27 (p > 0.05)0.14 (p > 0.05)0.29 (p > 0.05)0.28 (p > 0.05)0.27 (p > 0.05)0.24 (p > 0.05)
* T: annual mean temperature; P: annual precipitation.
Table 5. The correlation coefficients (r) between the wetland vegetation characteristics at the XTG and WWC and the climatic variables during 1999–2016.
Peak NDVIPeak WVAPeak mNDVI
XTGWWCXTGWWCXTGWWC
T *0.21 (p < 0.05)0.13 (p > 0.05)0.38 (p > 0.05)0.36 (p > 0.05)0.25 (p > 0.05)0.31 (p > 0.05)
P *0.28 (p > 0.05)0.03 (p > 0.05)0.34 (p > 0.05)0.26 (p > 0.05)0.25 (p > 0.05)0.21 (p > 0.05)
S *0.49 (p < 0.05)0.42 (p < 0.05)0.64 (p < 0.01)0.59 (p < 0.05)0.50 (p < 0.05)0.54 (p < 0.05)
* T: annual mean temperature; P: annual precipitation; S: annual peak snow depth.

