Communication

Updating Absolute Radiometric Characteristics for KOMPSAT-3 and KOMPSAT-3A Multispectral Imaging Sensors Using Well-Characterized Pseudo-Invariant Tarps and Microtops II

1
Cal/Val & Data Quality Control Team, National Satellite Operation & Application Center, Korea Aerospace Research Institute, Daejeon 34133, Korea
2
Applied Plant Science, Chonnam National University, Gwangju 61186, Korea
3
Division of Physical Metrology, Korea Research Institute of Standards and Sciences, Daejeon 35208, Korea
4
National Meteorological Satellite Center of Korea Meteorological Administration, Satellite Analysis Division, Jincheon-gun, Chungcheongbuk-do 27803, Korea
5
Department of Spatial Information Engineering, Pukyong National University, Busan 48513, Korea
*
Author to whom correspondence should be addressed.
Remote Sens. 2018, 10(5), 697; https://doi.org/10.3390/rs10050697
Submission received: 21 March 2018 / Revised: 22 April 2018 / Accepted: 27 April 2018 / Published: 2 May 2018
(This article belongs to the Special Issue Atmospheric Correction of Remote Sensing Data)

Abstract

:
Radiometric calibration of satellite imaging sensors should be performed periodically to account for the effect of sensor degradation in the space environment on image accuracy. In this study, we performed vicarious radiometric calibrations (relying on in situ data) of multispectral imaging sensors on the Korea multi-purpose satellite-3 and -3A (KOMPSAT-3 and -3A) to adjust the existing radiometric conversion coefficients according to time delay integration (TDI) adjustments and sensor degradation over time. The Second Simulation of a Satellite Signal in the Solar Spectrum (6S) radiative transfer model was used to obtain theoretical top of atmosphere radiances for both satellites. As input parameters for the 6S model, surface reflectance values of well-characterized pseudo-invariant tarps were measured using dual ASD FieldSpec® 3 hyperspectral radiometers, and atmospheric conditions were measured using Microtops II® Sunphotometer and Ozonometer. We updated the digital number (DN) of the radiance coefficients of the satellites; these had been used to calibrate the sensors during in-orbit test periods in 2013 and 2015. The coefficients of determination, R2, values between observed DNs of the sensors, and simulated radiances for the tarps were more than 0.999. The calibration errors were approximately 5.7% based on manifested error sources. We expect that the updated coefficients will be an important reference for KOMPSAT-3 and -3A users.

Graphical Abstract

1. Introduction

Radiometric calibration of satellite sensors involves converting a measured digital number (DN) to physical units of radiance (e.g., reflectance) to provide reliable quantified scientific data. The process can be classified into pre- and in-flight calibrations [1]. Pre-flight calibration is conducted using laboratory experiments of a well-known radiance source to determine the linear relationship between DN and radiance for each spectral band of the satellite sensor. Although the satellite imaging sensor of the launched satellite is well calibrated by the pre-flight process, the sensor responses to radiometric targets tend to change in orbit because of the differences between laboratory and space environments. The imaging sensor is also influenced by outgassing phenomena, extreme temperature conditions, and exo-atmospheric solar radiation, which affects optical transmission and the charge-coupled device (CCD) [2,3,4]. In addition, sensor aging over time contributes to sensor degradation [5,6]. In a previous report on sensor degradation of the advanced very high-resolution radiometer (AVHRR), band 1 (0.58–0.68 nm) and 2 (0.725–1.00 nm) responses decreased by 4.5% and 3.6%, respectively, in just one year [6]. A report on the Landsat-7 onboard lamp 1, which is typically operational during imaging, showed a decrease of between 1.9% (band 7, 2080–2350 nm) and nearly 30% (band 1, 450–515 nm) in the seven bands over ten years [7]. Therefore, the DN to radiance coefficient must be periodically updated to maintain the quality of satellite imagery [8,9].
There are three typical approaches used to radiometrically calibrate satellite imaging sensors in orbit: onboard, cross- (or inter-) satellite, and vicarious (relying on in situ data) calibration [3,9,10]. Onboard calibration is processed by onboard-mounted calibrators (e.g., a solar diffuser and a blackbody gain monitor) on a satellite, using artificial or natural sources such as lamps, deep space, or the sun, as reference targets. Onboard calibrators provide an opportunity to periodically monitor the performance and stability of the imaging sensor and perform radiometric calibrations at a high temporal frequency [3,4]. However, it is difficult to mount such calibrators on satellites due to the constraints of power, weight, cost, and the space environment [9,11]. Furthermore, calibrator performance must be regularly checked or compensated for by other calibration approaches because over time, uncertainties would increase due to degradation of the calibrators [6].
Cross-calibration is commonly applied to numerous imaging sensors. Typical examples include the advanced space-borne thermal emission and reflection radiometer (ASTER), the moderate resolution imaging spectroradiometer (MODIS), and Landsat TM/ETM+ [12,13,14,15]. Obtaining the reference radiance using this approach is more straightforward than in other calibration methods because the imaging sensor can be calibrated using only satellite images. Cross-calibration employs another well-calibrated satellite imaging sensor and stable radiance from relatively homogeneous land cover such as a desert, deep ocean or lakes, a snowfield, or the top of thick convective clouds [4,9,16]. Nevertheless, several factors can cause errors, including a gap in imaging times, a difference of spectral response functions, a fully non-homogeneous radiance of the reference target, and different viewing geometries and spatial resolution [8,9,17].
Meanwhile, vicarious calibration relies on in-situ data and is processed using a radiative transfer model based on well-characterized natural or artificial targets determined from a field campaign and measurements of atmospheric aerosol optical depth (AOD), water vapor, ozone, and CO2 concentration. This approach requires labor-intensive efforts and substantial time to obtain consistent radiance data from the reference target because not only is it challenging to find homogenous land cover in nature, but it is not easy to obtain reference radiance values in the field at the exact time when the satellite of interest passes under bright conditions. Moreover, making artificial reference targets or constructing the necessary instruments to obtain in situ data can be expensive [18]. Nevertheless, this radiometric calibration approach is employed in many studies because it provides highly accurate results using optimal information on ground truth data at the time of satellite imaging and excellent reference targets when using pseudo-invariant tarps, e.g., a black target can be made similar to a blackbody [6,18,19,20,21].
In this study, the vicarious radiometric calibration approach based on in situ data was applied to the Korea multi-purpose satellite-3 and -3A (KOMPSAT-3 and -3A/Arirang-3 and -3A), which are sun-synchronous orbit satellites launched on 25 May 2012 and 25 March 2015, respectively. Both satellites use the same satellite bus and payload. The main difference between them is that only KOMPSAT-3A has an infrared sensor to monitor day-and-night, and it has a higher spatial resolution than KOMPSAT-3. The objective of the satellites was to develop an Earth observation system using panchromatic, multispectral, and infrared (only for KOMPSAT-3A) imagery with very high spatial resolution for monitoring of the surface environment, vegetation, ocean, and natural disasters [22]. Initial radiometric calibrations of the satellites were previously reported for the initial satellite conditions during the in-orbit test (IOT) periods in 2013 and 2015, respectively [11,22]. However, it is necessary to reexamine the sensor responses and update the DN to radiance coefficients, because four and two years have passed, respectively, since the initial radiometric calibration. Additionally, on 22 August 2015, the TDI (Time Delay Integration) values of KOMPSAT-3A multispectral bands changed due to their lower sensitivity to low surface reflectance area values. Therefore, the coefficients should also be adjusted by performing a new vicarious calibration for consistent radiance values. Although most studies related to these satellites have focused on the verification and calibration of the imaging sensors [23,24,25,26,27,28,29,30], efforts to improve and conserve the quality of satellite images must be maintained. Therefore, this study performs an absolute radiometric calibration of KOMPSAT-3 and -3A multispectral images from electro-optical imaging sensors to obtain the latest DN to radiance coefficients.

2. Materials and Methods

The characteristics of high-resolution optical satellites include a narrow field of view (FOV) and a long revisit time. Therefore, it is difficult to perform radiometric calibration with a high temporal frequency using natural targets such as deep convection clouds, the deep ocean, or bright deserts. On the contrary, a field campaign using artificial reference targets, typically tarps, can be a useful way to calibrate a high-resolution satellite sensor. In this study, vicarious radiometric calibrations of KOMPSAT-3 and -3A multispectral imaging sensors were performed using radiometric tarps and atmospheric measurements. Table 1 shows detailed specifications of the KOMPSAT-3 and -3A sensors, where the main difference between the satellites is their spatial resolution and the presence of IR channels mounted on KOMPSAT-3A. Although the detailed sensor specifications are slightly different, the multispectral bands of the Advanced Earth Image Sensor System (AEISS) and AEISS-A, mounted on KOMPSAT-3 and -3A, respectively, have the same spectral response functions (SRF) and practical spectral ranges as the bands affected by atmospheric constituents and the surface. Therefore, the same algorithm was used for the vicarious radiometric calibration of each satellite sensor using the radiative transfer model.
We selected three different field campaign sites: Goheung in South Korea (34.60°N, 127.20°E), Naju in South Korea (35.10°N, 126.82°E), and Zuunmod in Mongolia (47.72°N, 106.96°E). Figure 1 shows images of the study area for each field campaign site; the left column shows the RGB images and the right column is a subset of images of the multispectral bands from KOMPSAT-3 and -3A. For the field campaigns, we prepared four distinctive radiometric tarps with reflectances ranging from approximately 3% to 60% (Figure 1b,d,f). The canvas tarps were chemically treated to obtain constant reflectance values from the samples. The size of each of tarp was 10 m × 20 m; at the Mongolia site, larger tarps were used (20 m × 20 m, Figure 1f). Considering the spatial resolution of KOMPSAT-3 and -3A, the minimum number of observed pixels in the horizontal direction for tarps in the satellite image was 3 for KOMPSAT-3 and 4 for -3A. We selected the center pixels of each tarp as reference pixels to minimize radiometric interference from neighboring pixels since the size of the tarps are wider than the effective function of the point spread function of the AEISS charge-coupled device (CCD) camera [31,32].
For the vicarious calibration, we performed several field campaigns at each site to acquire reliable tarp reflectance values; however, the available images for sensor calibration were limited due to cloudy weather conditions. Table 2 shows the selected geometric conditions of KOMPSAT-3 and -3A images used for radiometric calibration. We obtained only four valid field campaign measurements, despite attempting at least ten. Additionally, for the KOMPSAT-3 images observed on 14 May 2017 and 27 July 2017, the viewing zenith angles of the satellite sensor were greater than 10°; this means that bidirectional reflectance distribution (BRD) effects of the surface target are expected. Thus, the BRD function (BRDF) of the reference radiometric tarps should be measured, thereby reducing the uncertainty of the BRDF effect, in order to use them as radiometric calibration samples.
Primary processing of the vicarious calibration using a radiative transfer model depends on the simulation quality of the theoretical top of atmosphere (TOA) radiance received by spectral sensors of KOMPSAT-3 and -3A. In this study, the Second Simulation of a Satellite Signal in the Solar Spectrum (6S) radiative transfer model (RTM) was mainly used to simulate TOA radiance according to the SRF of satellite sensors [33] by considering various advantageous input parameters, predominantly related to surface reflectance and atmospheric effects. The 6S model was validated using other RTMs and was found to be consistent with other RTMs to within 1%, according to previous reports [34,35], meaning that it is useful for calibrating satellites to the requested accuracy. Figure 2 presents a flowchart of the vicarious radiometric calibration of KOMPSAT-3 and -3A using the 6S model.
For the optical sensors, surface reflectance is the largest term contributing to the determination of the TOA radiance observed [36]. When acquiring the reference reflectance, an ASD Fieldspec® 3 hyperspectral radiometer (Malvern Panalytical Ltd., Malvern, UK) was used to measure each radiometric tarp under nadir direction geometry. We also attempted to measure tarp reflectance using this radiometer within 30 min of the satellite passing time. Both of these ground measurement conditions were intended to reduce the effects of the bidirectional reflectance distribution function (BRDF) using relative sun-target-sensor geometry. Nevertheless, the BRDF effects caused by changing the satellite position remained, especially in the tilted viewing zenith angle (Table 2). Therefore, we calculated the laboratory-based BRDF using a gonioradiometer to compensate for the geometric discrepancies between the ASD Fieldspec® 3 and satellite-only cases of sizeable tilted sensor geometry. After determining the reference reflectance of the tarps, the atmospheric conditions were measured by a Microtops II® instrument (Solar Light Inc., Glenside, PA, USA), which can estimate the input parameters of RTMs i.e., AOD, water vapor, and total ozone. By using carefully considered input parameters of the radiative model, the theoretical TOA radiances of KOMPSAT-3 and -3A were simulated and compared with their DN values. Finally, the DN to radiance coefficients of KOMPSAT-3 and -3A were determined.

3. Results

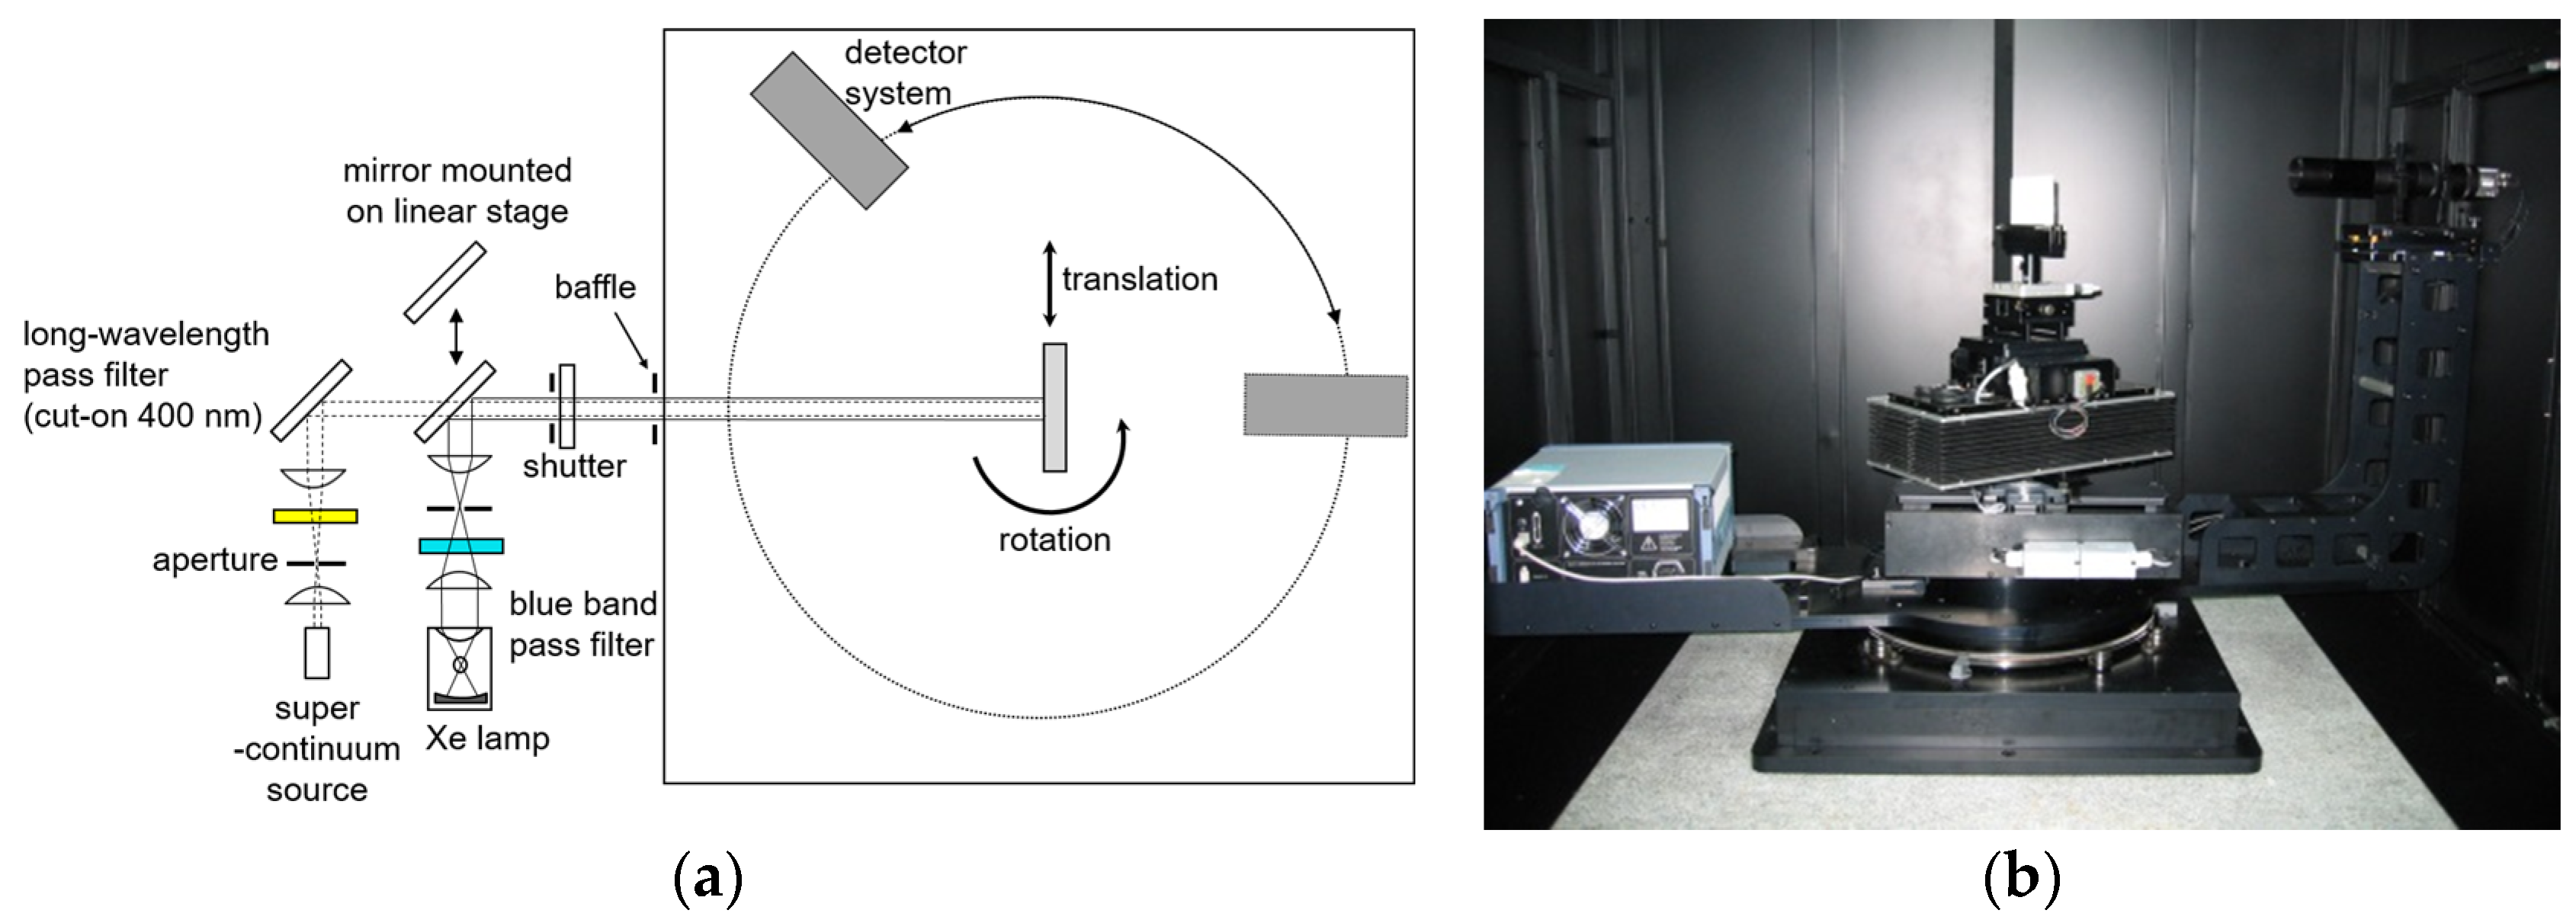
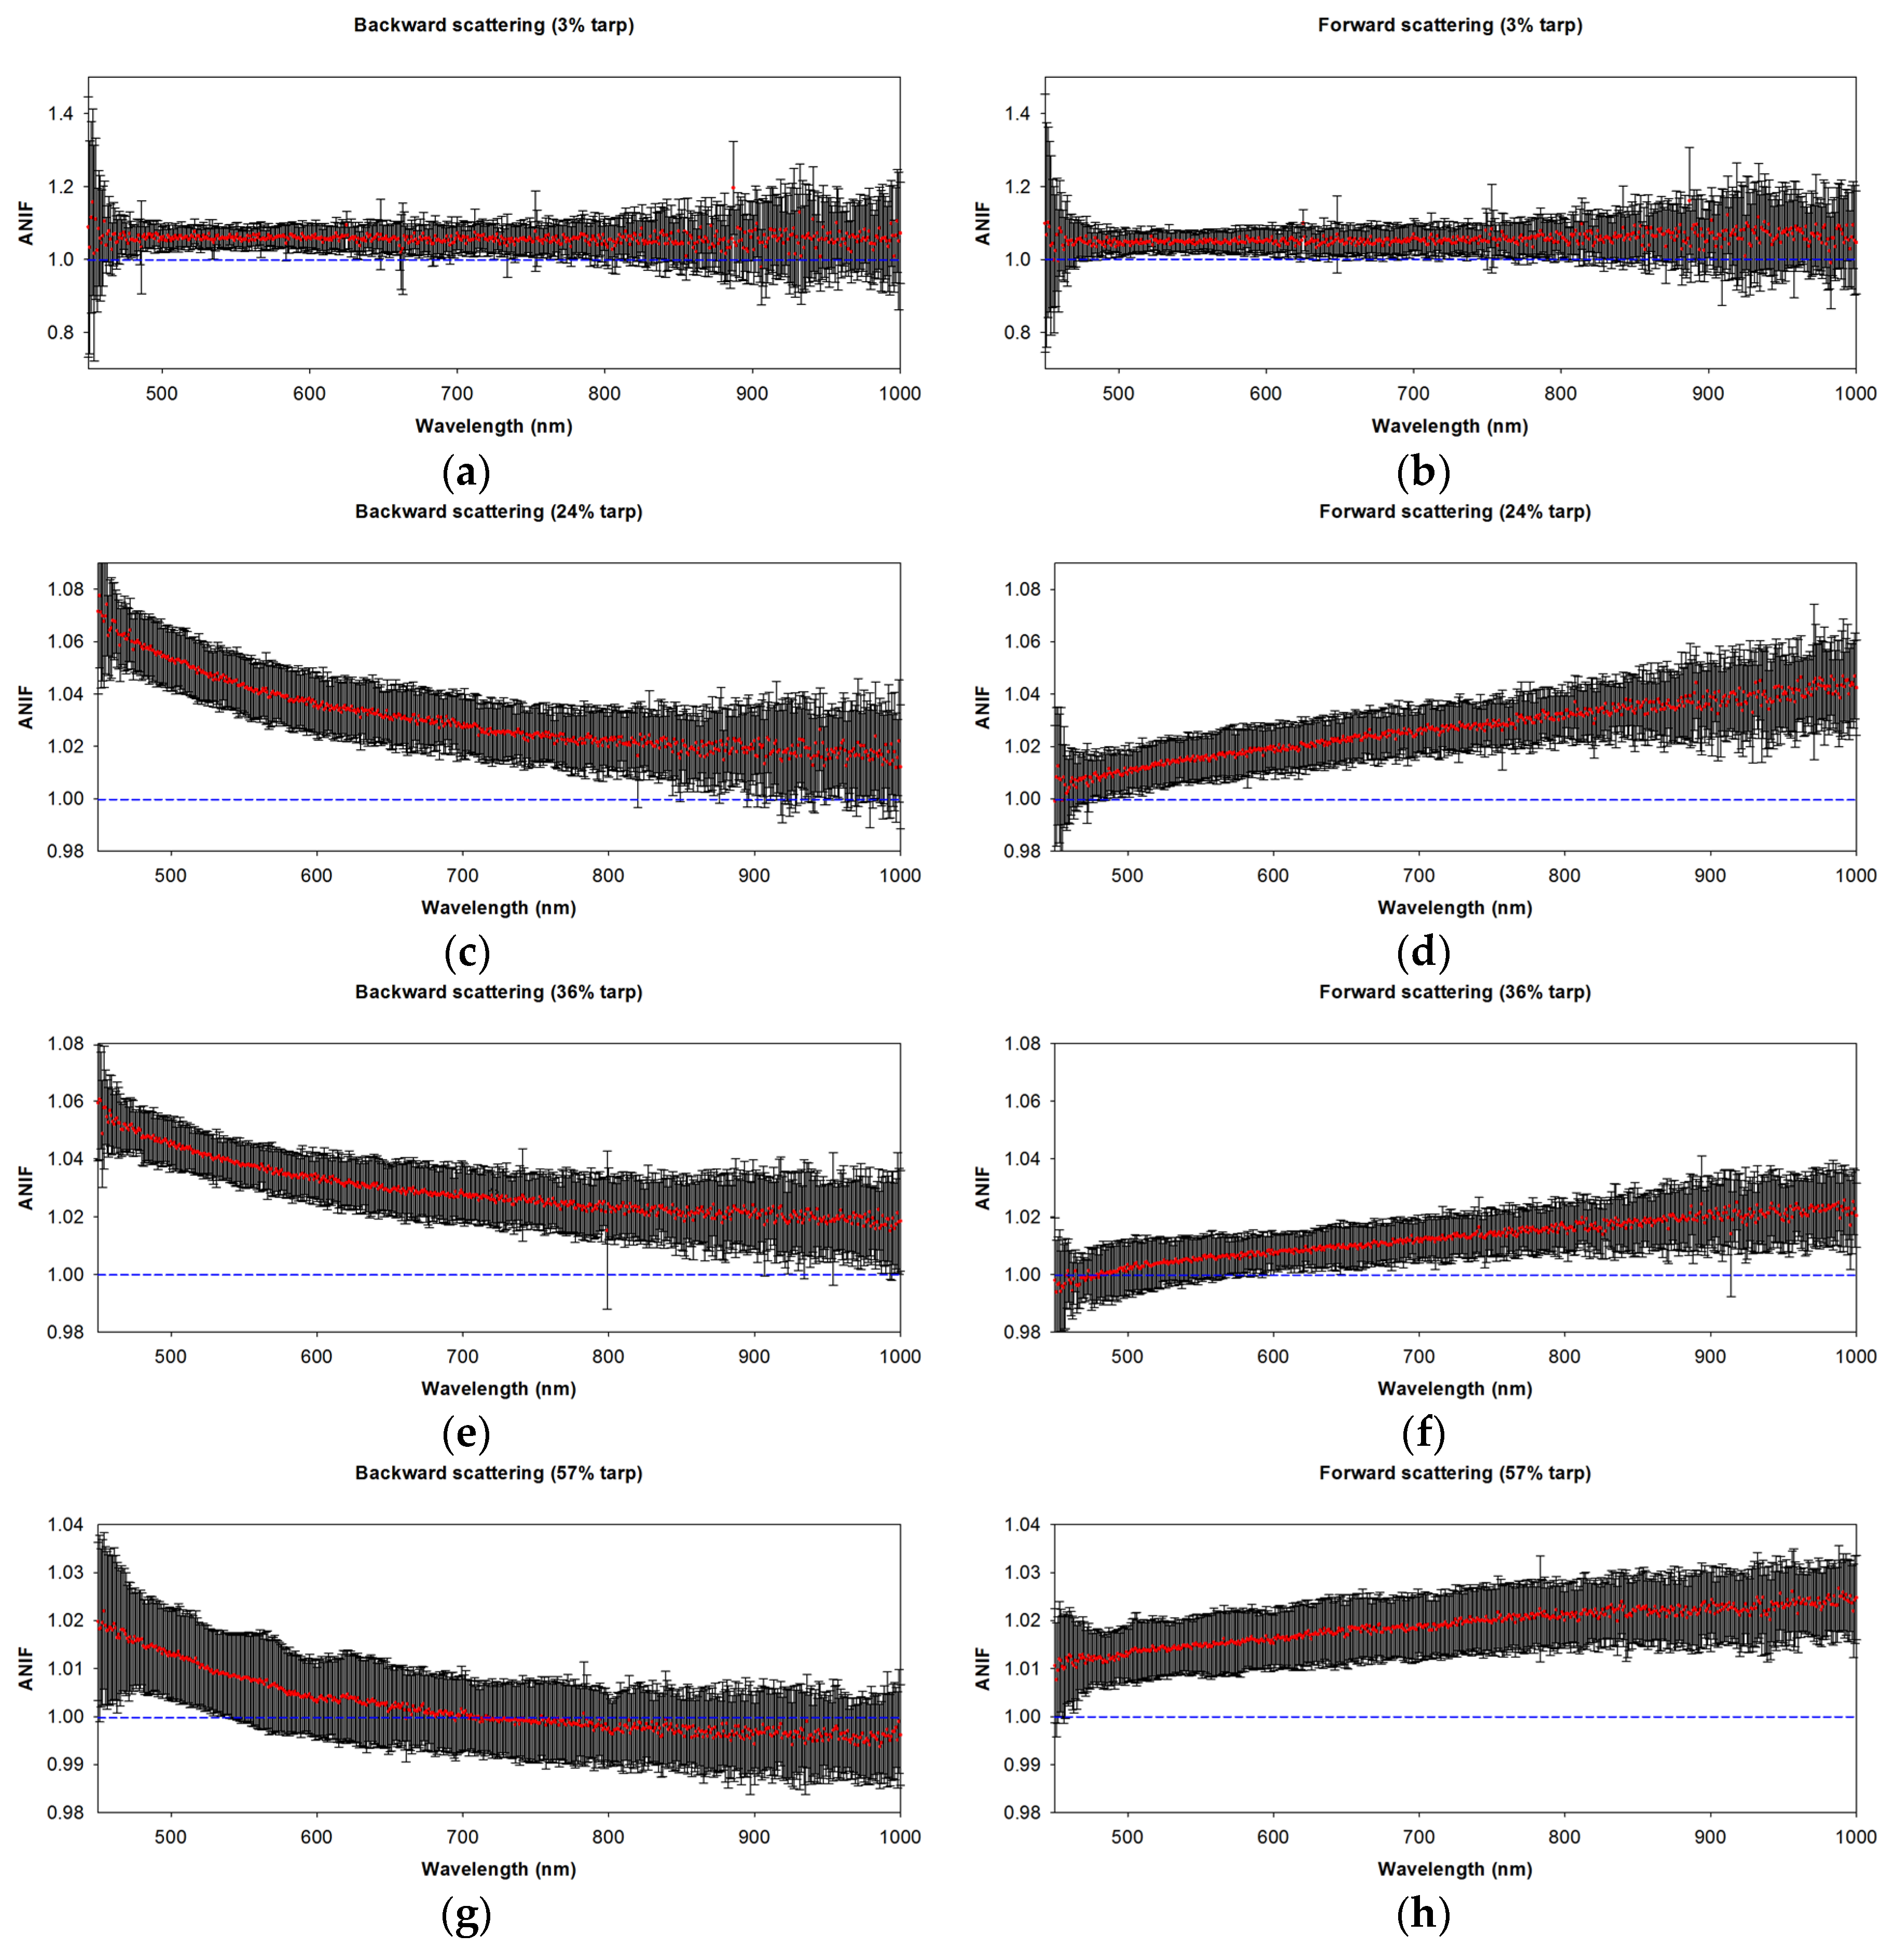
3.1. Laboratory-Based BRDF Measurements of Tarps

The BRDF measurement is used to infer reflectance at a given viewing geometry and to compute a hemispheric albedo from a reflectance measurement made from a specific direction [37]. The accuracy of such tarp-based field calibrations depends on accurate knowledge of the tarps’ laboratory-measured BRDF at a variety of source illuminations and detector scatter angles [38], since the BRDF effect is considered an unknown error quantity in the reflectance values [39]. In the case of KOMPSAT-3 and -3A, the observed surface reflectance from optical sensors are affected by the surface BRDF effect on deployed tarps even though they were carefully constructed to be flat and chemically treated to have a constant reflectance [11]. When measuring laboratory BRDF for the four field campaign cases using a hyperspectral gonioreflectometer, we only use the first case field campaign of KOMPSAT-3 as an illustration in Table 2. This is because the last two KOMPSAT-3 and -3A cases, performed at Zuunmod, Mongolia, are close to the nadir direction viewing zenith angle, which results in negligible BRDF effects of surface radiometric tarps due to an observation geometry similar to that of the ASD Fieldspec® 3. Moreover, in the second case using KOMPSAT-3, acquired on 27 July 2017, at Naju, a non-negligible BRDF effect is caused by the reflectance of radiometric tarps because KOMPSAT-3 had the largest the viewing zenith angle (21.833°). However, the two-dimensional hyperspectral gonioreflectometer could not measure the BRDFs of sample targets when the illumination and reflection angle was within 2° (under backward scattering geometry conditions) because the illuminator and detector sensors can become overlapped and thus impossible to measure (Figure 3). Therefore, we consider only the BRDF effect of the first field campaign on 14 May 2017 by reflecting the angle of incidence and reflection using a hyperspectral gonioreflectometer designed to measure two-dimensional BRDFs for the principal plane with a 3-nm radiometric resolution in the 380–1000 nm wavelength range [40].
In this study, anisotropy factors (ANIFs) of each radiometric tarp were measured using the following equation [22] to normalize sensor viewing geometry to ASD Fieldspec® 3 geometry:
ANIF ( θ i , θ r , λ ) = B R D F ( θ i , θ r , λ ) B R D F θ N = 0 ( θ i , θ N , λ ) ,
In the equation, θ i , and θ r are the illumination and reflection angle, respectively, of the corresponding wavelength λ . B R D F ( θ i , θ r , λ ) is the BRDF value according to the incident illumination and reflected elevation directions in the principal plane. It reflects the observation geometry of KOMPSAT satellites according to solar and viewing zenith angles. B R D F θ N = 0 ( θ i , θ N , λ ) is designed for the nadir direction of ASD FieldSpec® 3; therefore, the reflection angle was fixed as the nadir direction ( θ N = 0°). ANIF is an intuitive reflectance anisotropy measure that varies in theory between 0° and [24].
Figure 4 presents the measured ANIF values of the four tarps according to KOMPSAT-3 geometry, which is the first case in Table 2. The geometry conditions of the laboratory BRDF measurement include an incident angle of 28.500° and a detection angle of 17.202°. According to Table 2, forward not backward scattering of the reflectance radiance is expected, because the relative azimuth angle between the sun and the sensor is 102.4°. Figure 4a,c,e,g shows backward scattering and Figure 4b,d,f,h shows forward scattering geometry. The measured ANIF values according to wavelength spectral bands are shown as red points, the uncertainty of the BRDF measurement is represented by the vertical error bar, and the blue dashed line signifies that no BRDF effect is expected due to an ANIF value of 1. Under forward scattering conditions, the ANIF values from laboratory-based BRDF measurements depend on the spectral wavelength (Figure 4). ANIF values from laboratory-based BRDF measurements were then used to normalize tiled KOMPSAT-3 geometry to the nadir direction for the first case in Table 2.

3.2. Hyperspectral Reflectances of Tarps Using Dual ASD FieldSpec® System

Reflectance values of four reference tarps, including wavelength spectral ranges (350–950 nm) of KOMPSAT-3 and -3A, were obtained using the ASD FieldSpec® 3 hyperspectral radiometer (Figure 5). This radiometer has been widely used for vicarious calibration of satellite imaging sensors because it is reliable and can measure a broad spectral range between 350 nm and 2500 nm [41,42,43]. The full width at half maximum (FWHM) of the radiometer is 3 nm in the range 350–700 nm and 10 nm from 700–2500 nm. Sampling spectral intervals are 1.4 nm (350–1000 nm) and 2 nm (100–2500 nm), respectively. The primary field of view for the optical fiber to measure the reflected radiance is 25° at a height of 1.5 m.
Before measuring the tarp reflectance, the radiometer sensor should be calibrated under the field conditions at the time of measurement to prevent saturation from downwelling irradiance, including optimization and dark current correction processes. This procedure is also the process to convert a digital number of the radiometer into the reflected radiance (W cm−2 nm−1 sr−1). To obtain the downwelling irradiance information for the calibration, a spectralon white reference panel was used (30.5 × 30.5 cm), which has an almost Lambertian reflectance of close to approximately 99%. The calibration should be regularly repeated whenever lighting conditions change, even by a small amount. Under non-clear sky conditions, this requires substantial time and effort because the user has to wait for clouds to pass and frequent calibrations are required to maintain constant lighting conditions at the time of calibration and measurement. Therefore, it is preferable to perform the field campaign in clear sky conditions with no clouds. However, it is rare that ideal sky conditions and the satellite image acquisition time coincide in practice. Hence, the error caused by the difference between the calibration and measurement times is the most problematic issue with the ASD FieldSpec® 3 radiometer.
In this study, a dual radiometer system was constructed to reduce these inherent errors and to obtain stable and reliable reflectance values for the tarps. The main aim is to minimize the error due to the variation in lighting conditions by simultaneously measuring the white reference and the target using two radiometers. The system consists of three procedures. First, we measured the white reference using two ASD FieldSpec® 3 radiometers simultaneously for inter-calibration, which calibrates the difference between the sensor responses of both radiometers based on the white reference panel. Second, one radiometer measured the white reference (fixed FieldSpec® 3, FFS) whilst the other measured the tarps (mobile Fieldspec® 3, MFS) at the same time (Figure 5). Through this process, simultaneous downwelling and reflecting radiance values were obtained. Third, the inter-calibrated reflectances were calculated during post-processing using the following equation:
reflectance = ( M F S _ R a d w r , t = 0 / F F S _ R a d w r , t = 0 ) · ( M F S _ R a d t a r g e t , t = i / F F S _ R a d w r , t = i ) ,
where F F S _ R a d w r , t = 0 and M F S _ R a d w r , t = 0 are the radiances of the white reference measured by FFS and MFS, respectively, and F F S _ R a d w r , t = i and M F S _ R a d t a r p , t = i are the radiances of the white reference and the tarps measured by FFS and MFS, respectively.
The spectral reflectances of the reference tarps were measured with ten repetitions for each point and 10 points for each tarp to ensure accuracy of the reflectance through repetition. The measured hyperspectral reflectance curves for all tarps and dates in this study showed almost flat patterns for the spectral band range of the KOMPSAT 3 and -3A (Figure 6). The mean reflectances of the four tarps were 3%, 24%, 36%, and 57%, respectively. The tarps were homogeneous within 1% spatial variations of ±0.1%, ±0.3%, ±0.4%, and ±0.8%, respectively. The spectral band reflectances of the tarps required for the radiometric calibration were calculated by applying the SRF curve of the two satellites (Figure 7).

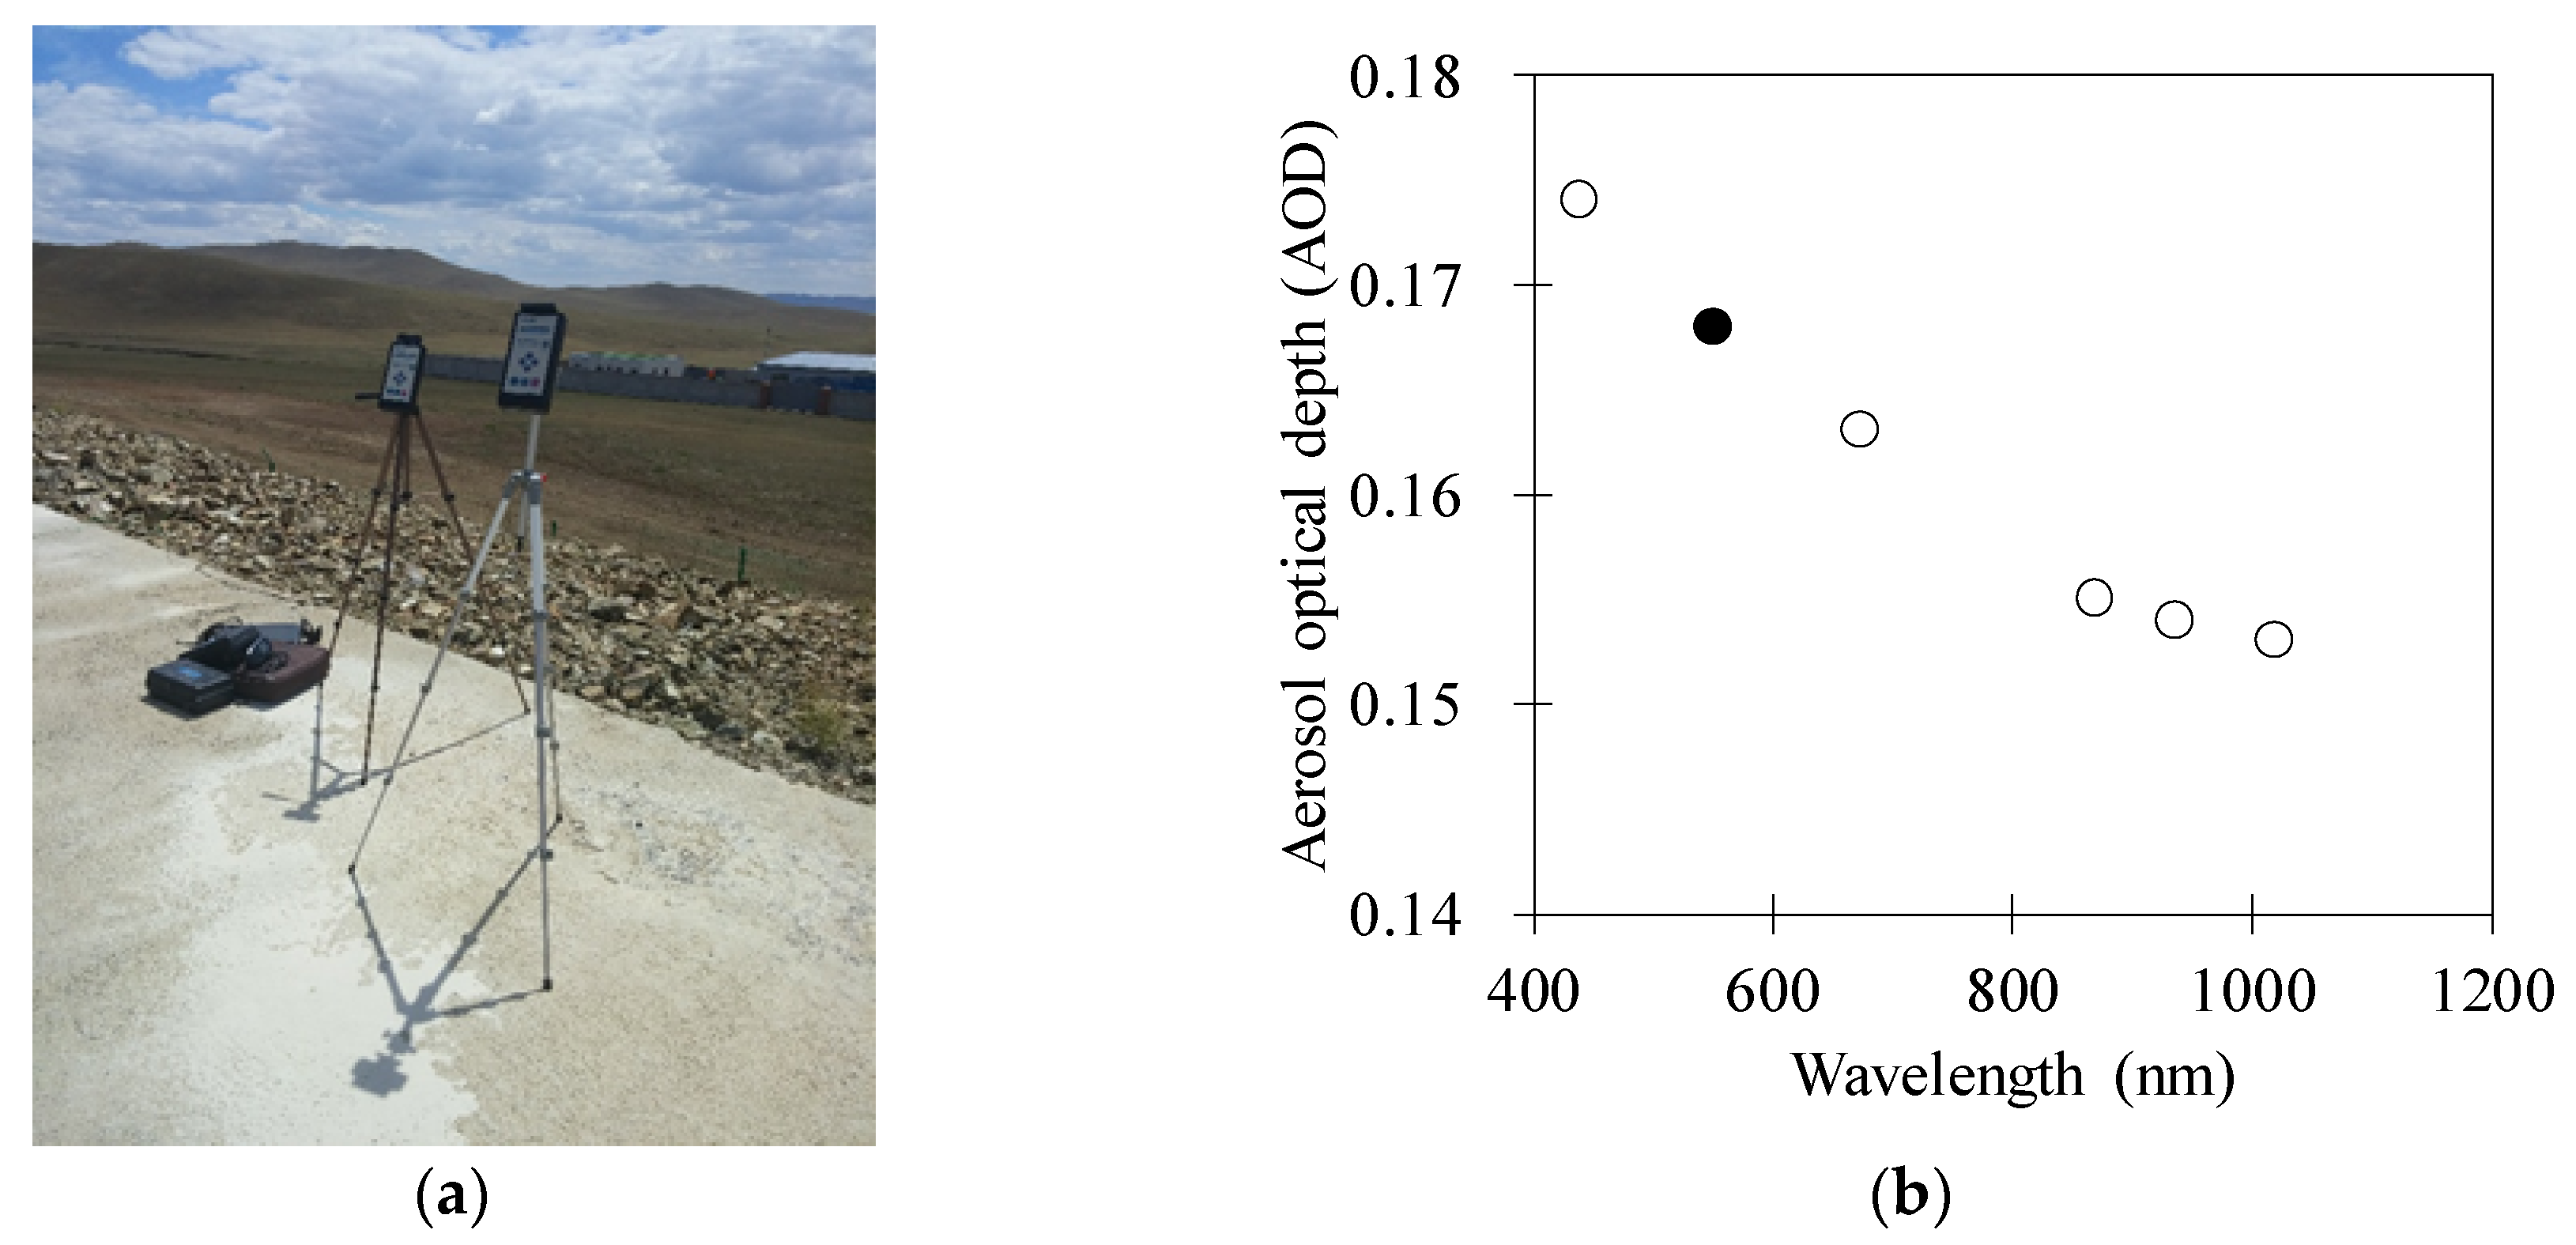
3.3. Microtops II® Sunphotometer and Ozonometer Measurement of Atmospheric Conditions

Microtops II® Sunphotometer and Ozonometer were used to measure atmospheric information. Both have been widely used in vicarious calibration of satellite imaging sensors [3,4,41,44]. The measurement factors, including AOD, water vapor, and ozone, were used to run the 6S model as input parameters (Figure 8a). These instruments have the advantage of being lightweight (600 g), small in size (10 × 20 × 4.3 cm), easy to operate, and relatively low in cost. The Sunphotometer has two visible and three near-infrared (NIR) channels (440, 675, 870, 936, and 1020 nm) to measure AOD and water vapor. The Ozonometer has three ultraviolet B (UVB) channels (305, 312, and 320 nm) to measure total ozone. The instruments were fixed on a tripod to measure the atmospheric information, which typically results in a significant standard deviation of approximately 0.23% according to Microtops II® user guide (version 2.43); however, this can change according to user skill or atmospheric conditions.
The 6S model used to determine the TOA radiances for the KOMPSAT-3 and -3A requires the AOD to be in the 550 nm channel [11,21]; however, this does not exist in the Sunphotometer. In this study, the Ångström exponent [45] was used to estimate the AOD in the 550 nm channel. The exponent is an empirical function indicating that the dependence of AOD on the spectral wavelength is inversely related [17,44,46]. Therefore, when the AODs for the two wavelengths are obtained, the AOD between both wavelengths can be estimated through the following empirical Ångström equation:
τ λ = τ λ 0 · ( λ / λ 0 ) α ,
where τ λ is the AOD at wavelength λ , τ λ 0 is the AOD at reference wavelength λ 0 , and α is the Ångström parameter. The following equation calculates this parameter:
α = ( ln τ 1 τ 2 ) / ( ln λ 1 λ 2 ) ,
where τ 1 and τ 2 are the AOD of two different spectral wavelengths λ 1 and λ 2 , respectively. In this study, the AODs at 440 and 870 nm were used to determine the Ångström parameter (Figure 8b). Table 3 shows the measured values of water vapor (g cm−2), total ozone (cm-atm), and AOD in 550 nm used as the atmospheric input parameters of the 6S model.

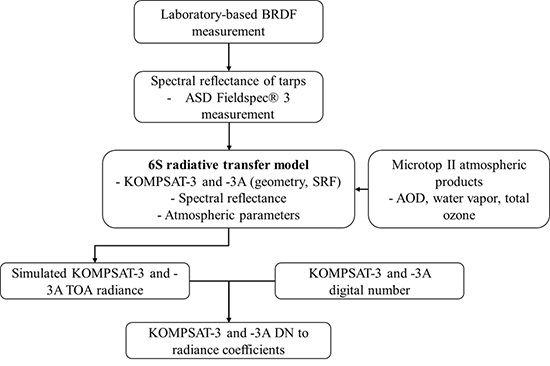
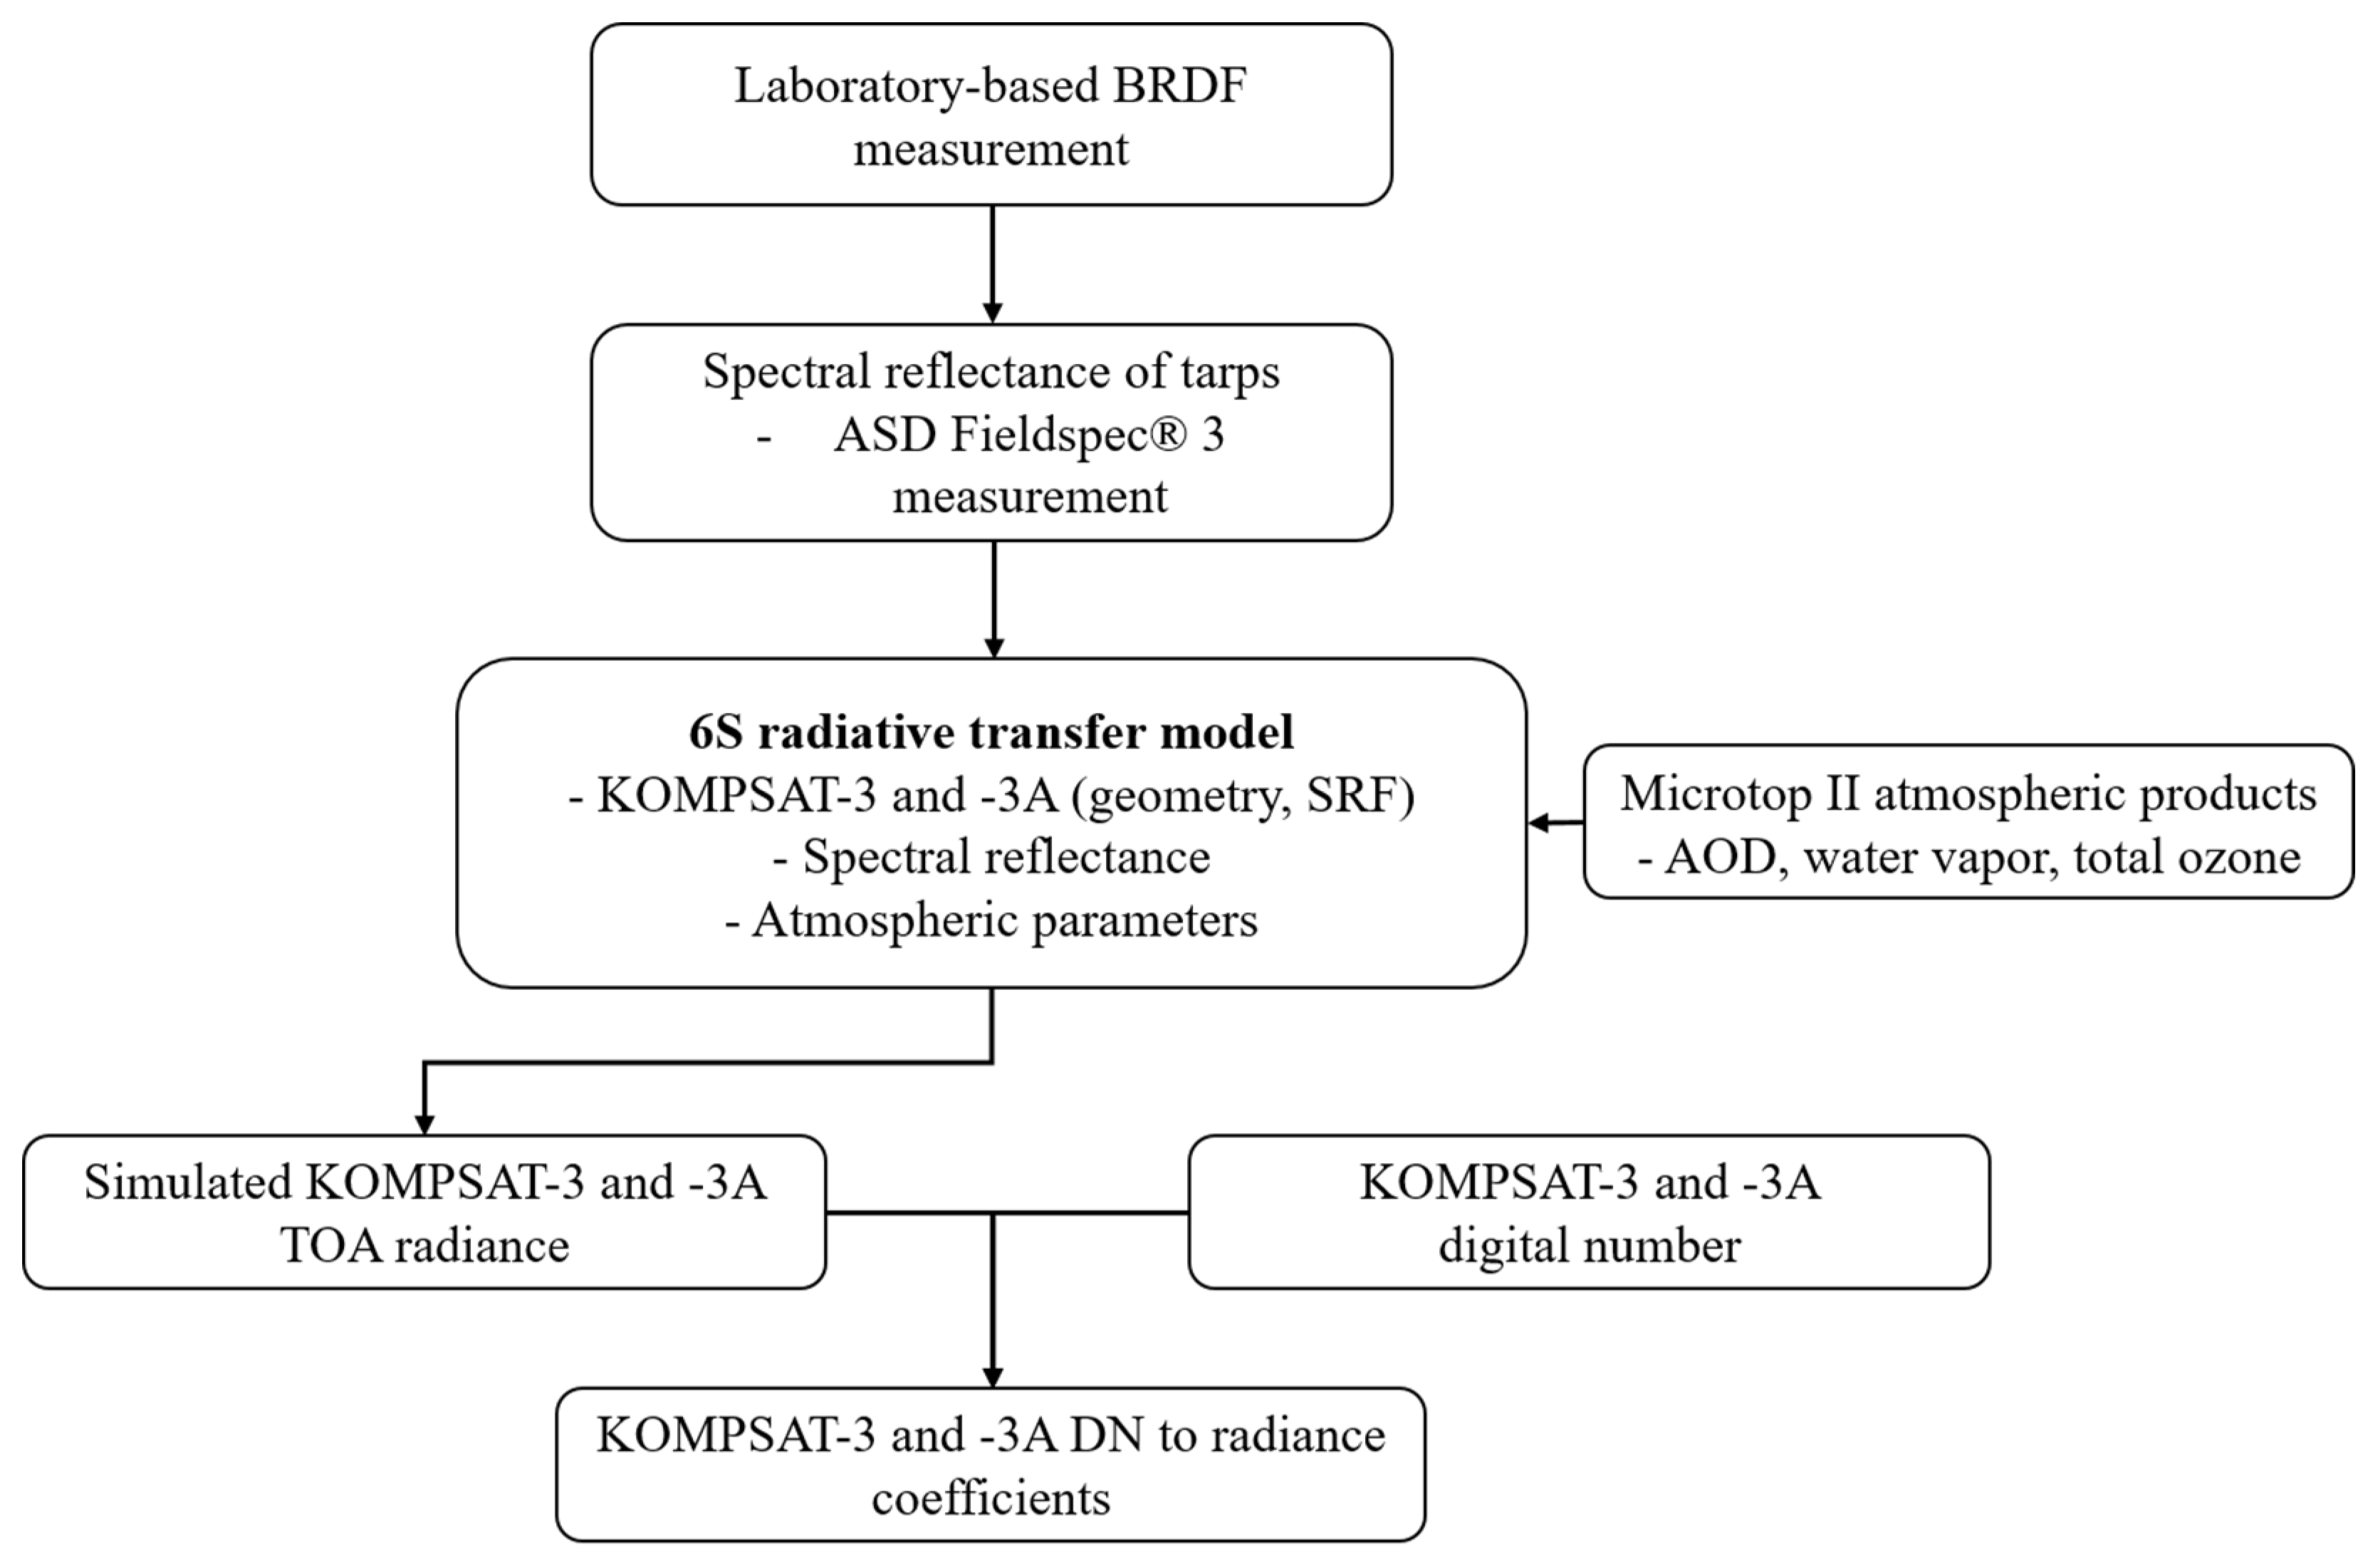
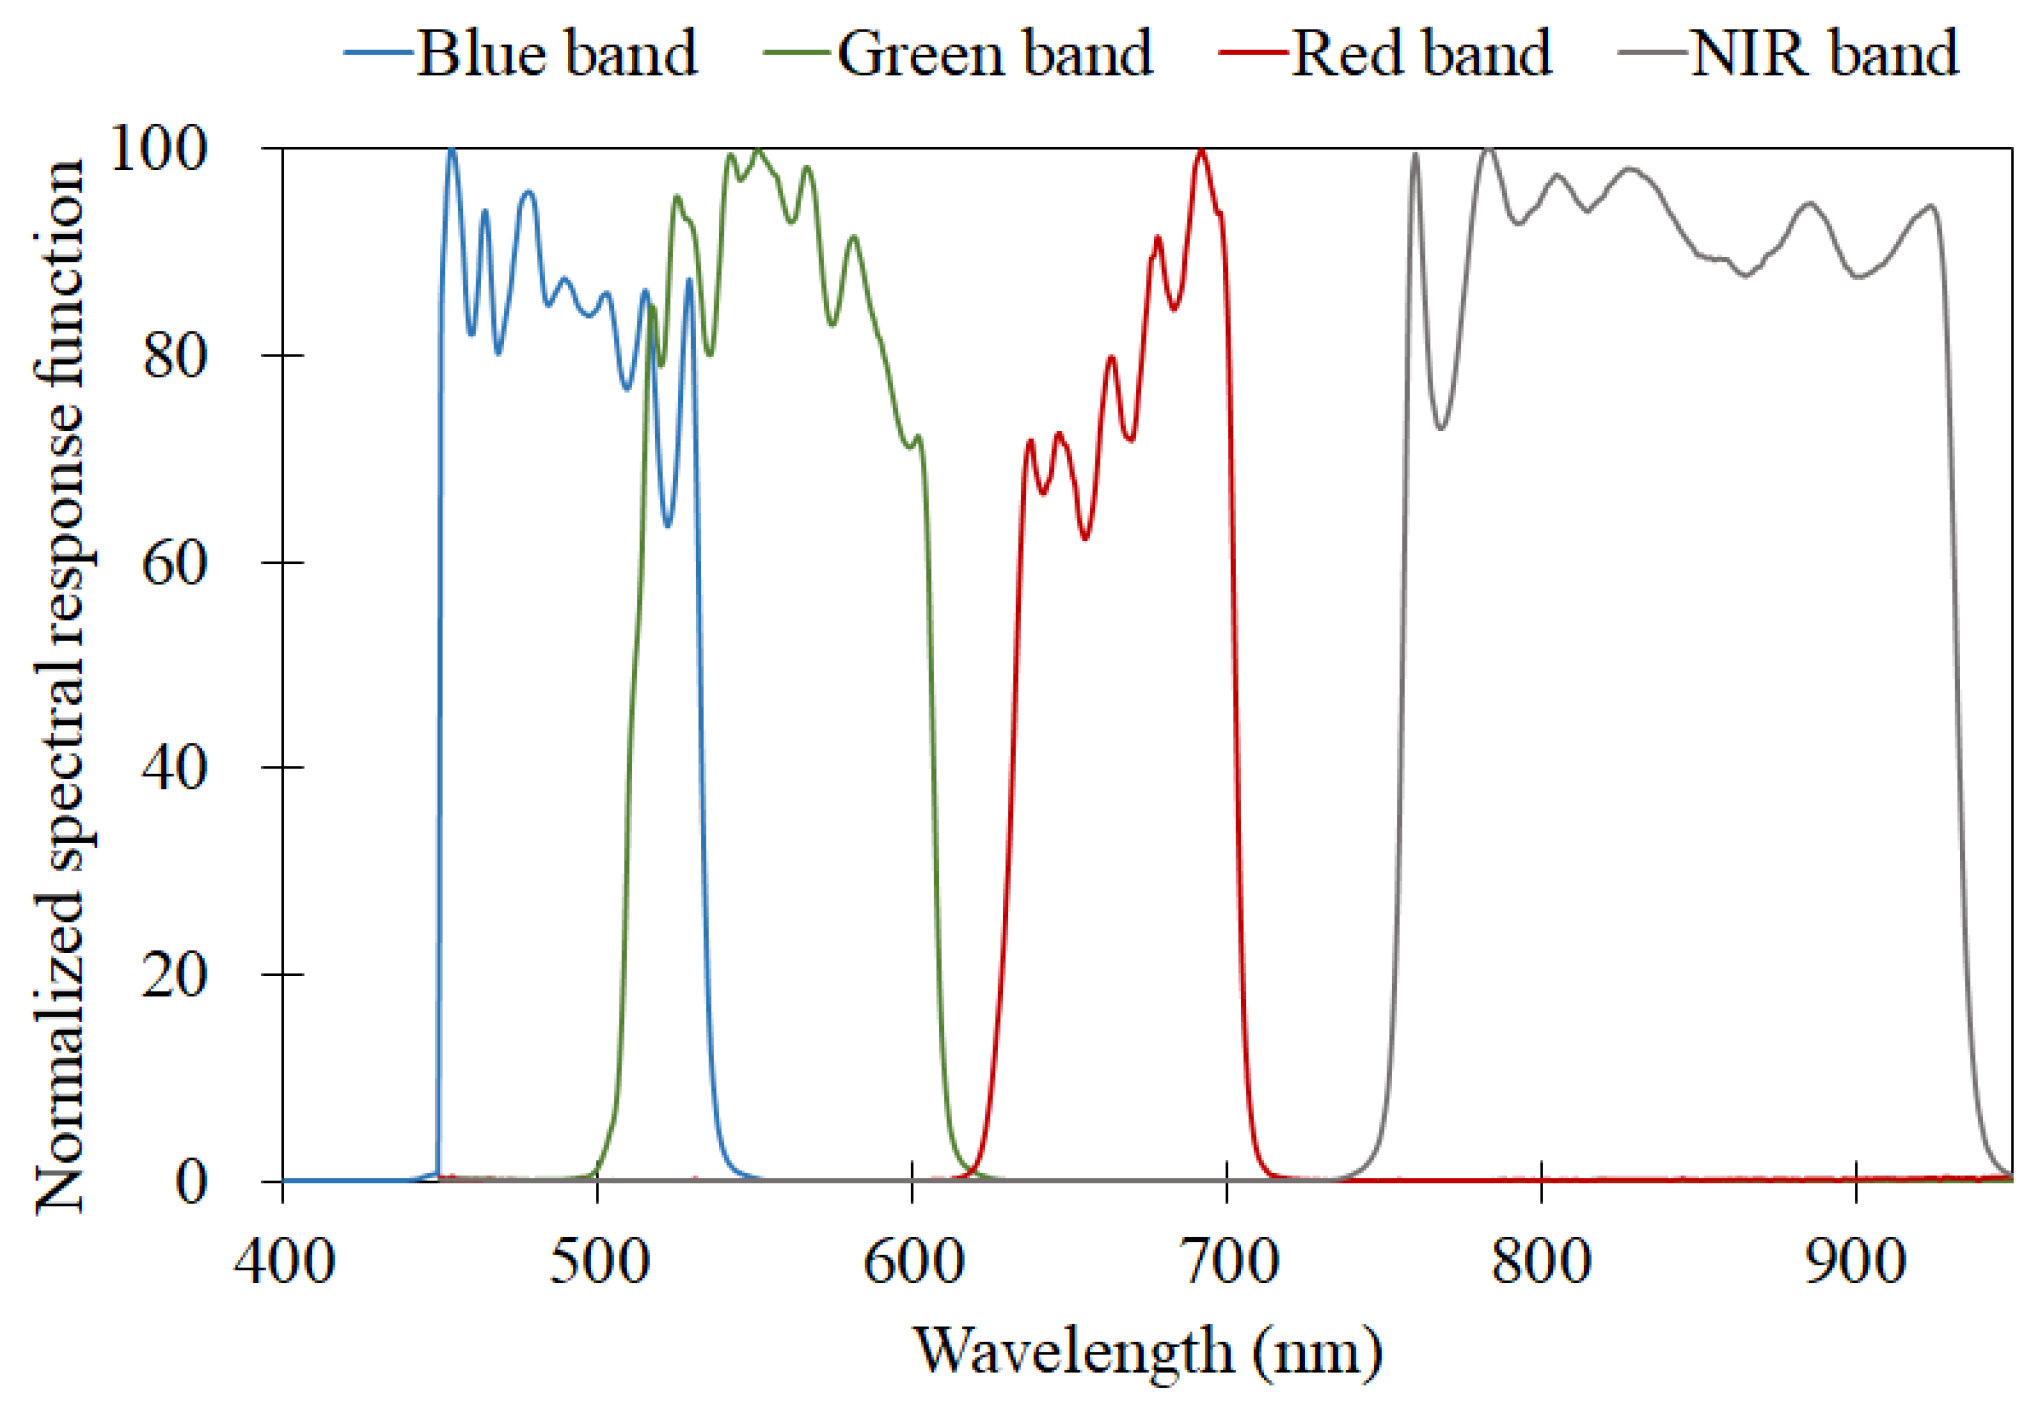
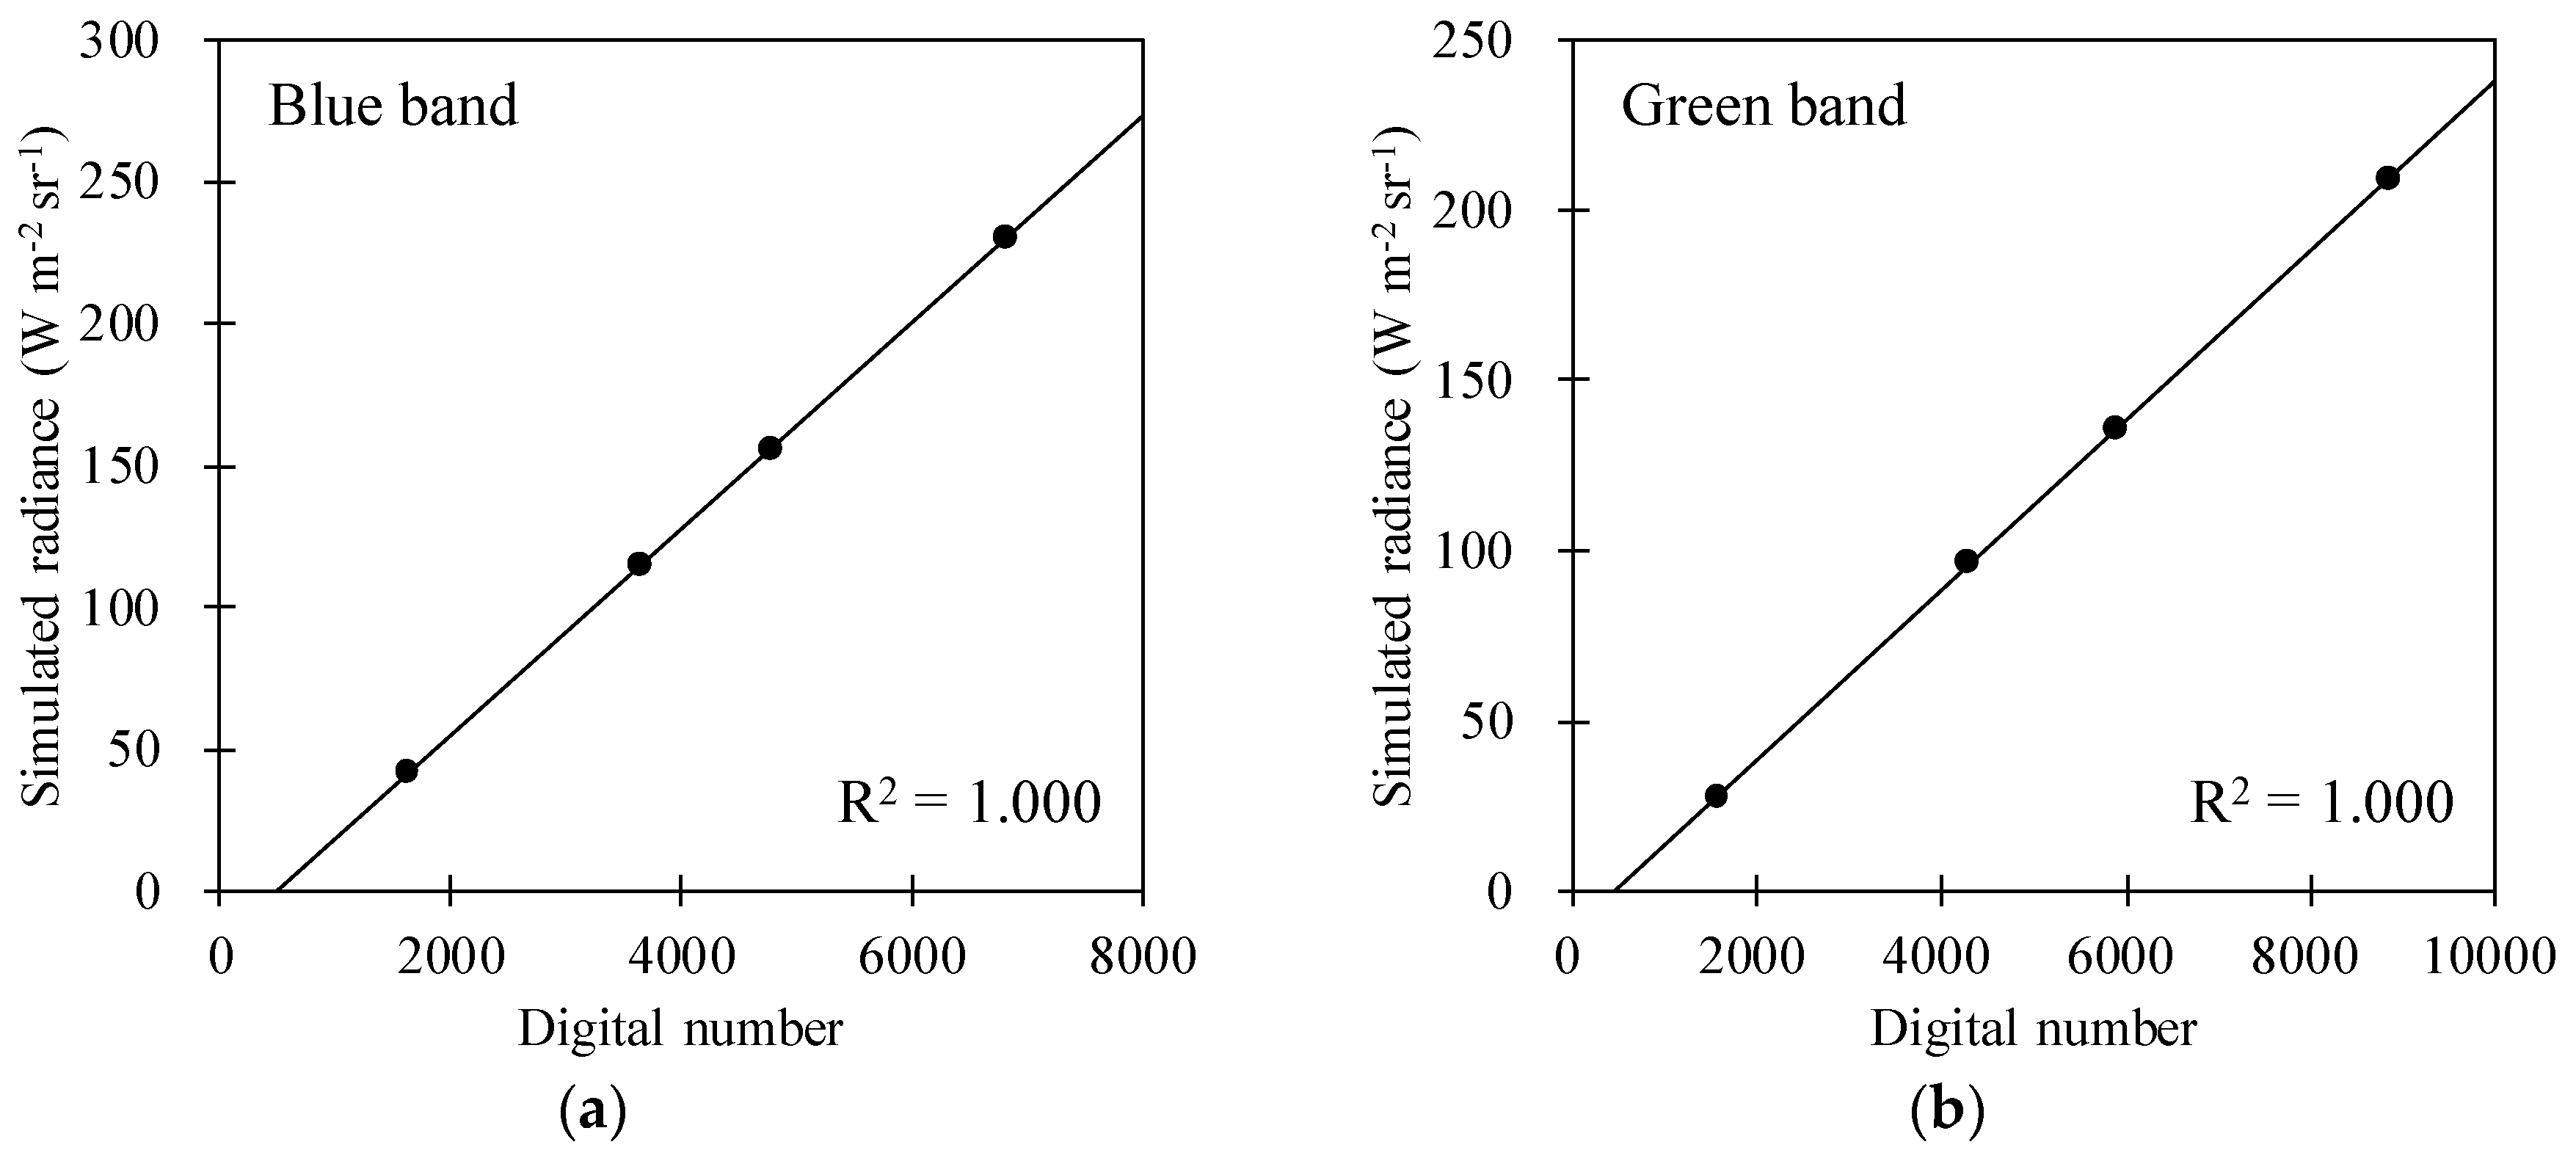
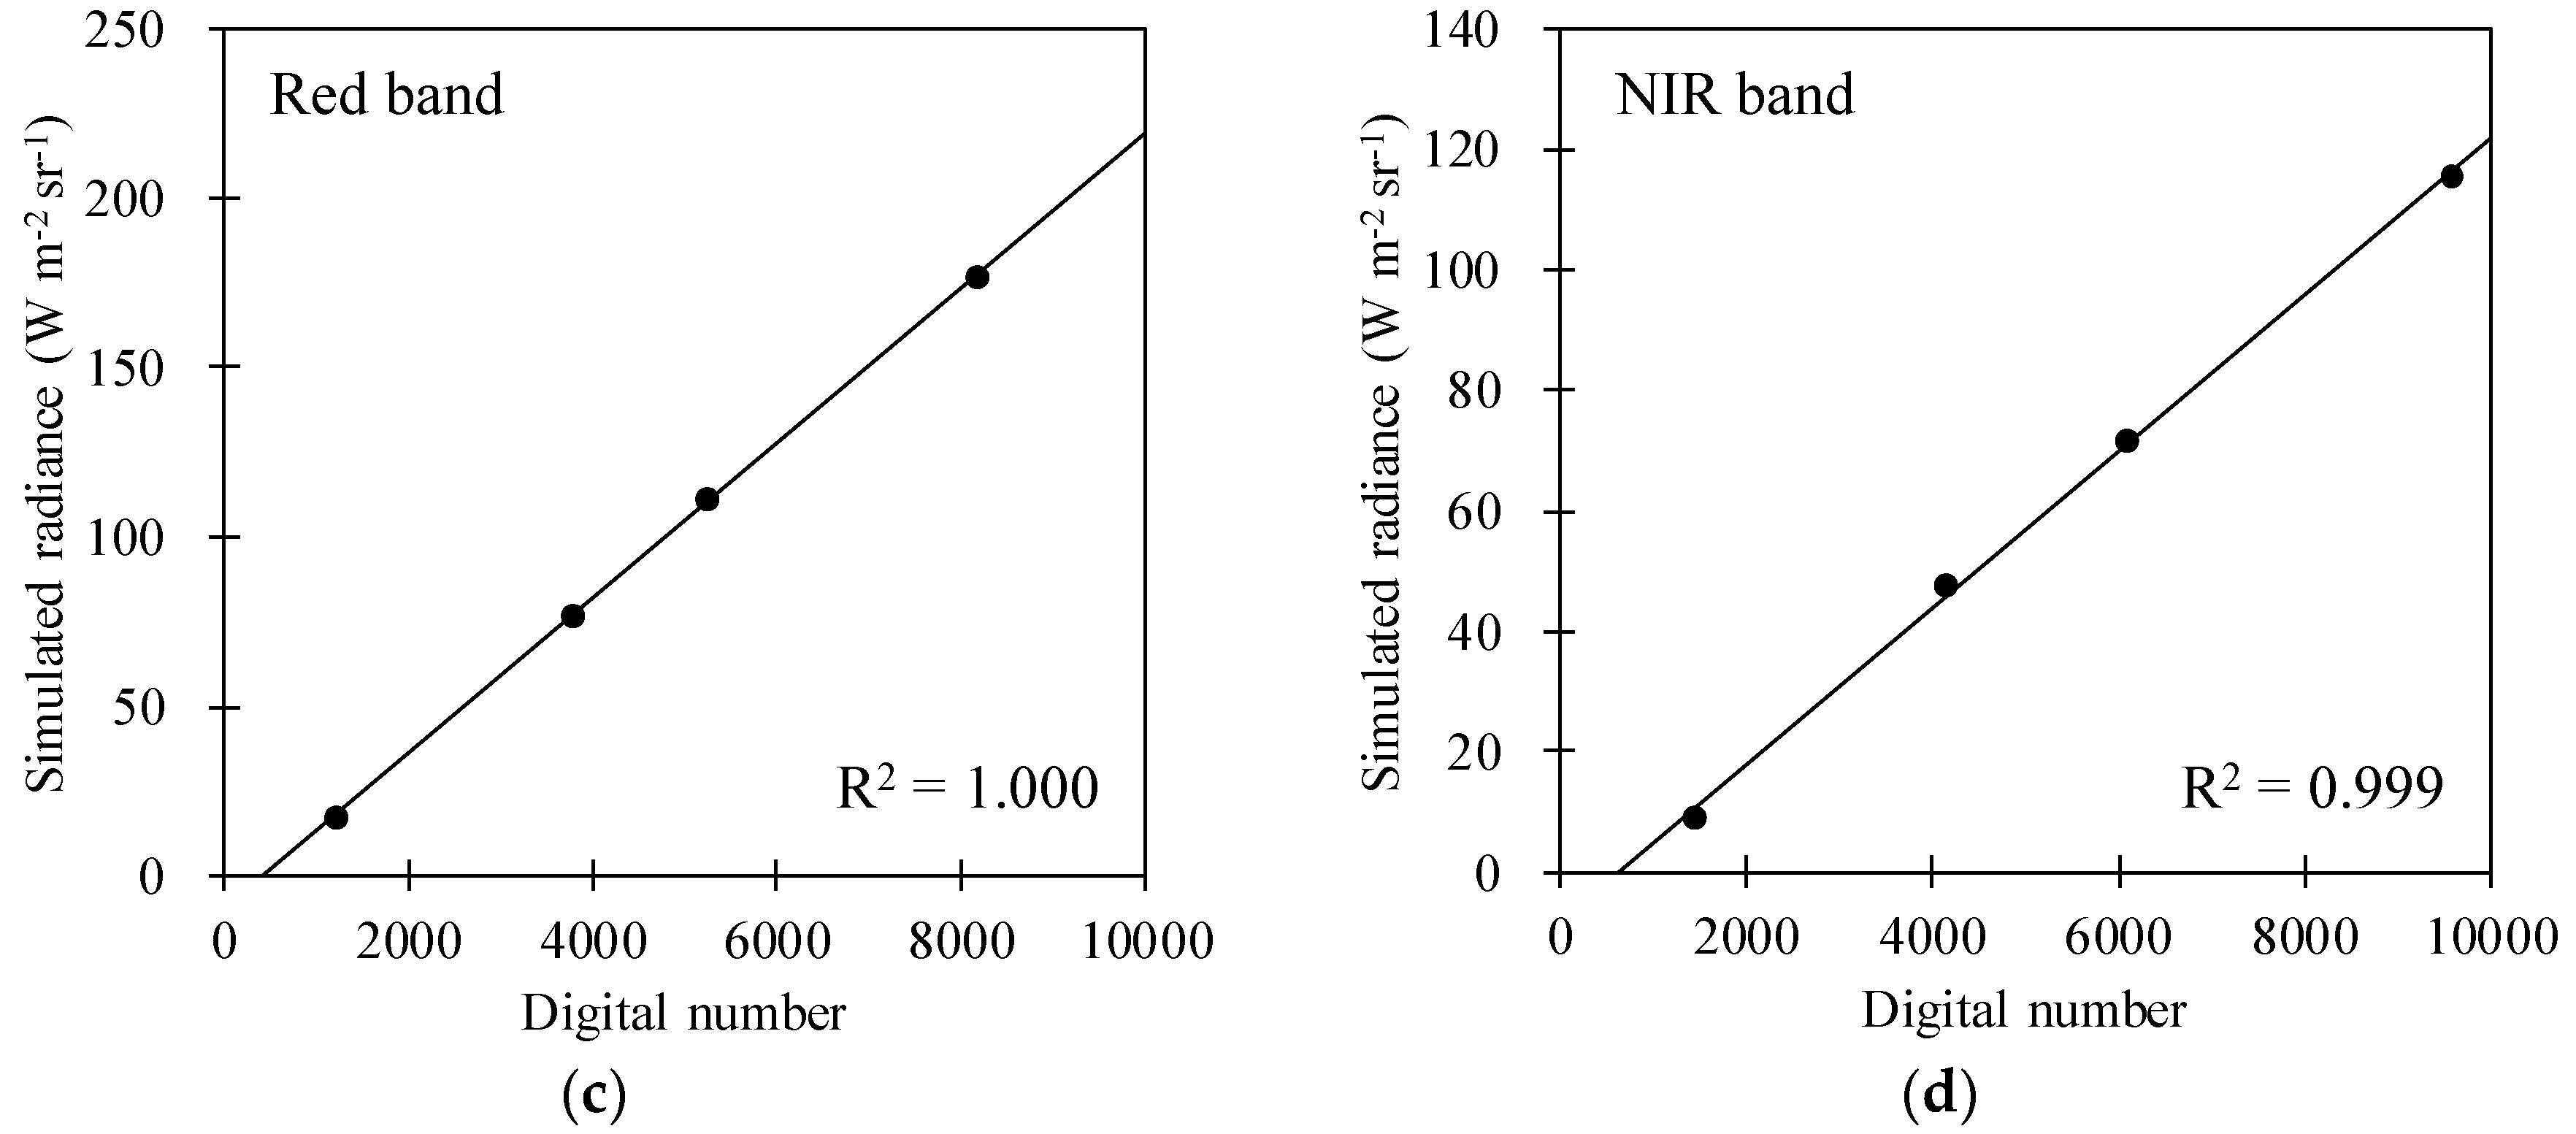
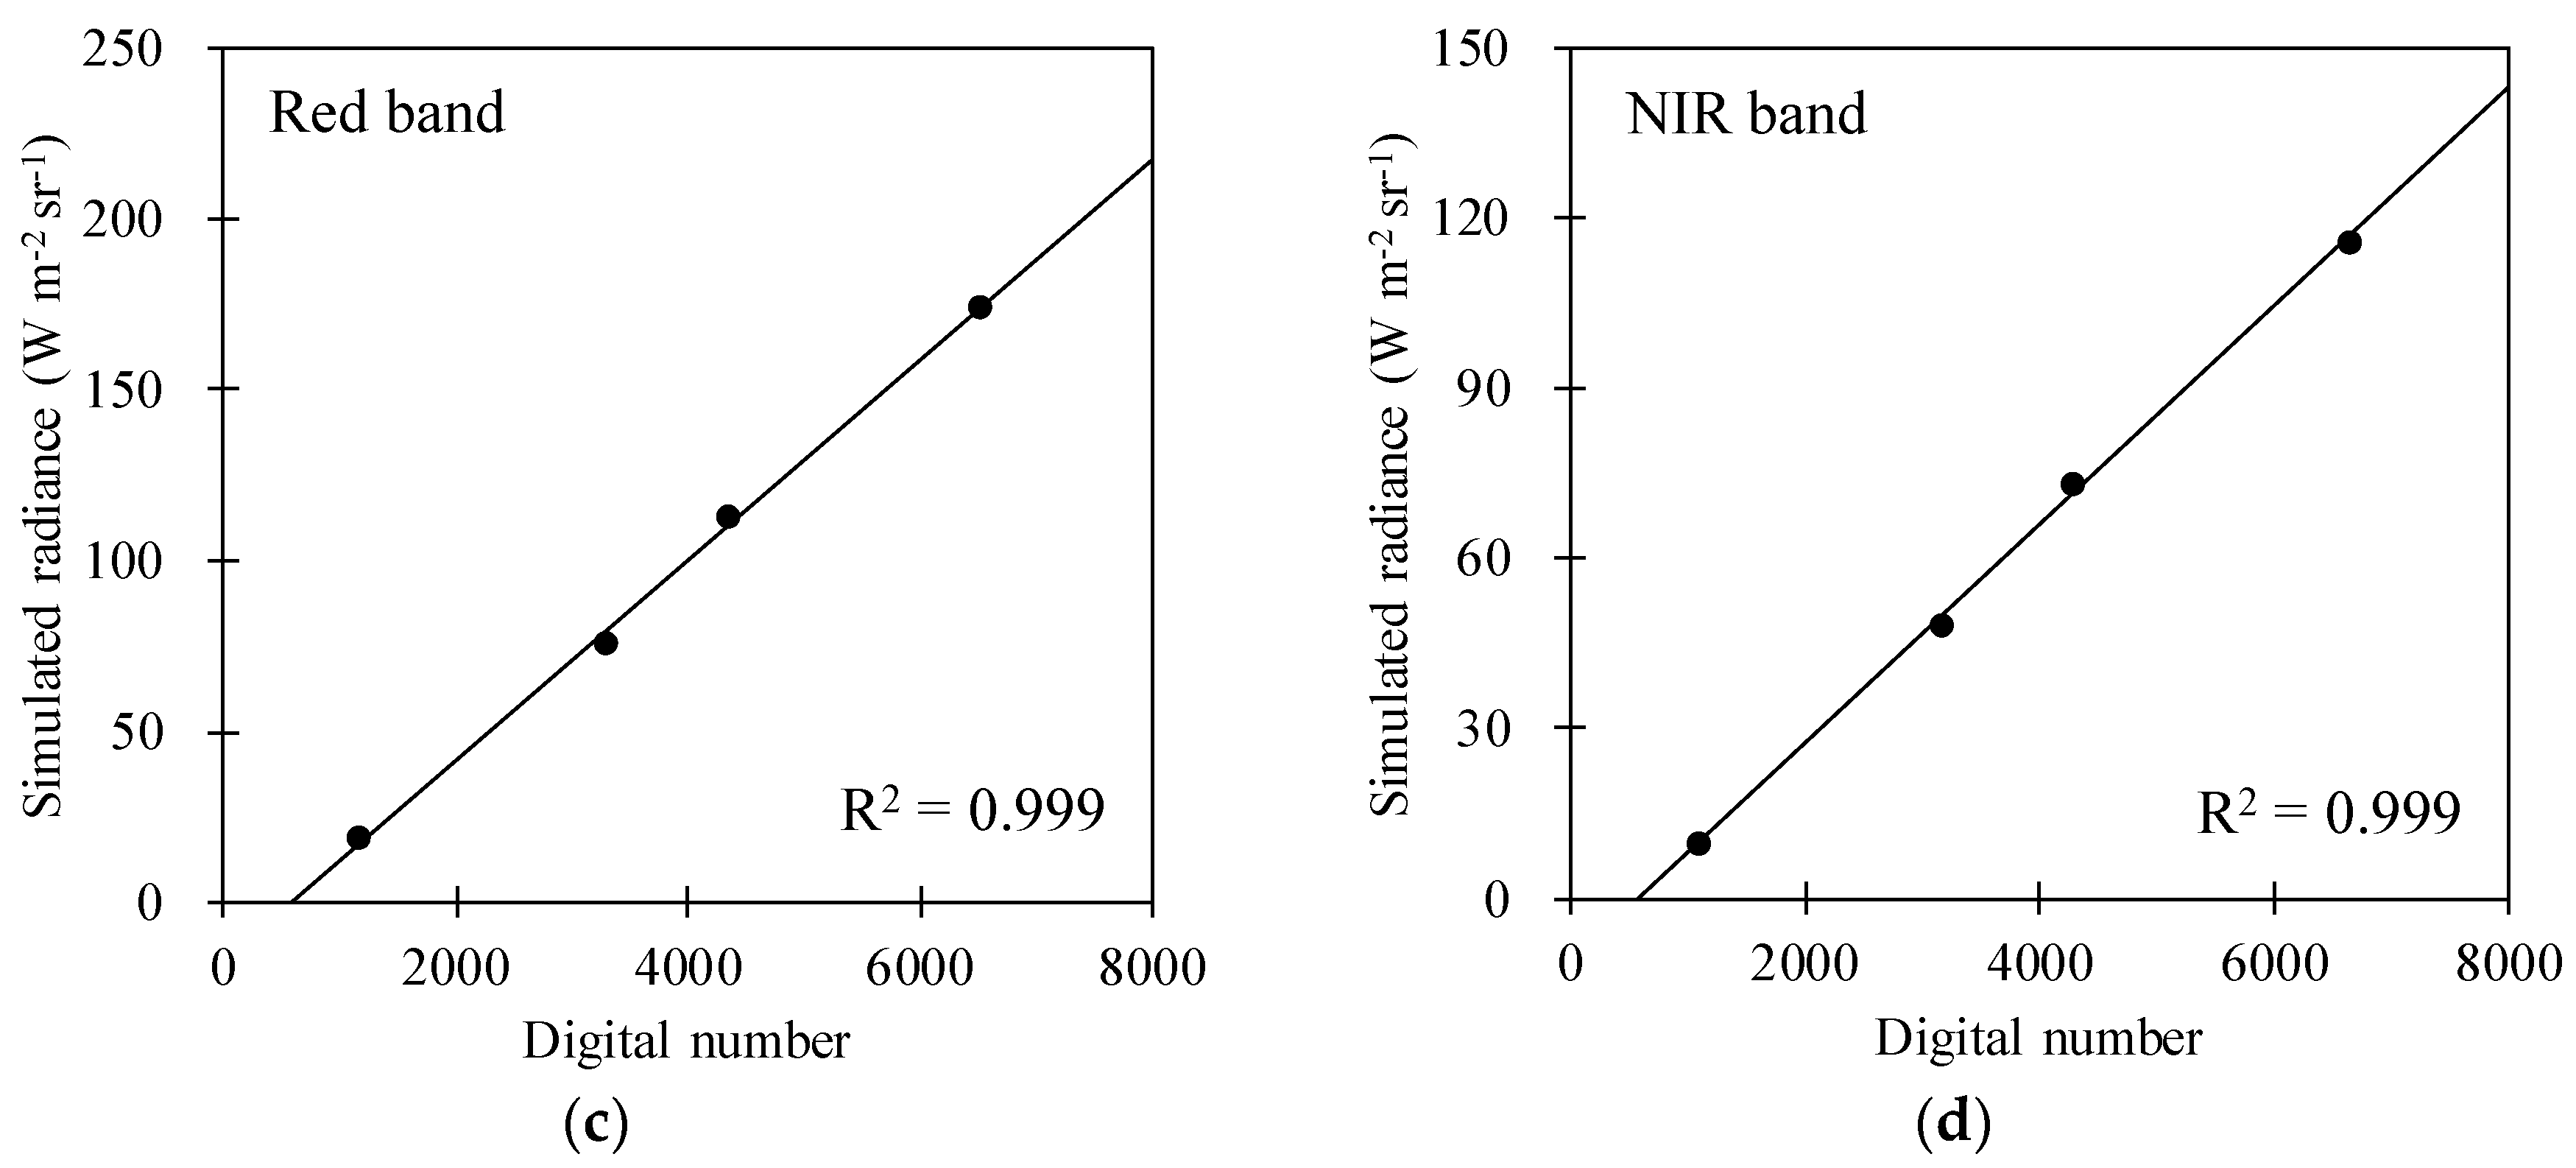
3.4. Determination of DN to Radiance Coefficients for KOMPSAT-3 and -3A

Finally, in this study, we updated the DN of the radiance coefficients of KOMPSAT-3 and -3A in light of the changed TDI adjustment of the payload CCD specification for KOMPSAT-3A and of the fact that sensor degradation over time is expected, especially for KOMPSAT-3. Table 4 shows the estimated radiometric calibration coefficients (scale) and offsets from intensive field campaigns during 2017.
In the case of KOMPSAT-3A, although only one scale factor was estimated, despite several field observations, the geometric and atmospheric conditions in Table 2 and Table 3 are valid for determining DN to satellite radiance coefficients. The viewing zenith angle of KOMPSAT-3A acquired on 19 September 2017 is 3.112°, meaning that a negligible BRDF effect is expected because the geometric difference between ASD and KOMPSAT-3A is less than 5°. Figure 9 shows the scatterplots between KOMPSAT-3A DN and TOA radiance from the 6S radiative transfer model for four multispectral bands. The scatter plots of TOA radiance calculated from four distinctive radiometric tarps and the KOMPSAT-3A DN values are closely located along the lines of linear regression in each spectral band. Additionally, the coefficient of determination (R2) values all exceed 0.999, indicating that the suggested methods are suitable for determining DN to radiance coefficients.
In the case of KOMPSAT-3, however, three cases of scale factors were estimated by performing field campaigns during the study period due to benign weather conditions. However, comparing each scale factor in Table 4 shows that these are non-negligibly different values, which would cause a substantial TOA radiance error despite using the same KOMPSAT-3 data. The major reason for the scale factor difference is likely the large viewing zenith angles of KOMPSAT-3 because the greater the tilt of the satellite zenith angle, the more substantial the BRDF effect of the surface radiometric tarps. The last field campaign of KOMPSAT-3 at the Zuunmod site in Mongolia (Table 4), acquired on 18 June 2015 exhibits the best results because the viewing zenith angle of the satellite is similar to the nadir direction of ASD Fieldspec® 3. Figure 10 shows the scatterplots between KOMPSAT-3 DN and simulated TOA radiance for all multispectral bands acquired on 20 September 2017. Through this relationship, the scale factor of the last column of Table 4 is determined as the KOMPSAT-3 DN to radiance coefficients for four multispectral bands. All the dots between TOA radiance and KOMPSAT-3 for four distinctive radiometric tarps are closely located over the linear least-square fit lines. Additionally, the R2 values for all spectral bands are 0.999, indicating that the determined scale factors are reasonable for converting DN to radiance with reliable accuracy.
In Table 4, the main reasons for scale difference between KOMPSAT-3 and -3A are the use of different TDI values and the deterioration of KOMPSAT-3. The reason for applying difference TDIs in this case is that the sensitivity of each sensor changes differently after launch, and TDIs are adjusted to enhance the image interpretation using relative radiometric correction to meet the purpose of satellite mission.
Lastly, we compared the previous and updated scale factors for the multispectral sensors of the two satellites (Table 5). In KOMPSAT-3, the updated scale factors increased more for all spectral bands than they did in previous ones. It means that the sensor sensitivities were decreased. On the other hand, for KOMPSAT-3A, the scale factors decreased compare to previous ones except for the blue band. This is because the sensor sensitivities of KOMPSAT-3A was increased through adjusting the TDI values due to lower sensitivities after the sensor calibration had been performed last time, as mentioned above.

4. Discussion

In this study, we officially updated the DN to radiance coefficients for KOMPSAT-3 and -3A to ensure that accurate and quantitative images are available for practical use, as the imaging sensor needs to be calibrated both geometrically and radiometrically [27,28]. Because the accuracy of radiometric calibration ultimately influences all relevant fields utilized by KOMPSAT-3 and -3A, it is essential to determine the variations of KOMPSAT-3 and -3A due to TDI adjustments and sensor degradation over time.
We acquired the four scale factors during the study period in 2017. However, the first two scale factors of KOMPSAT-3, which were acquired on 14 May 2017 and 27 July 2017, respectively (Table 4), differed from the last Mongolia case. The main reason for this was that BRDF effects of the surface radiometric tarps were mostly caused by tilted satellite geometry. In the first case alone, laboratory-based BRDF correction could be applied to normalize tilted satellite viewing zenith angle geometry to the nadir direction because the illuminator and detector sensors could be overlapped for the second case, as mentioned. In Table 4, the values in parentheses in the first column are the BRDF corrected scale factors using ANIF values of laboratory BRDF measurements for the sampled tarps. The BRDF corrected scale factors tended to approach the value of the last column scale factors of KOMPSAT-3, but differences remained. We inferred that two-dimensional laboratory BRDF measurements could not reflect the BRDF effect of an azimuth angle direction because the actual satellite and the sun’s position were approximately 90° from each other. In other words, it is effective if the position of the satellite, tarps, and the sun were similar to those with 2D hyperspectral gonioreflectometers; however, BRDF uncertainty increases as these are out of the principle plane, and the uncertainty magnitude is unknown. A common problem of radiometric calibration of optical sensors is how to reduce the expected error factors in order to calculate hypothetical TOA radiance; this can be achieved by carefully preparing the input parameters of the radiative transfer model, especially for atmospheric and ground measurement conditions. We have already shown how radiometric conversion coefficients can be adjusted by simply correcting the variation of satellite geometry using laboratory BRDF measurements, indicating the importance of input parameters for considering the BRDF effects of the radiometric tarp. To report detailed radiometric calibration results, in this study the relative error budgets of various calibrations of KOMPSAT-3 and -3A were analyzed considering the expected error factors. When analyzing the approximate error budget of vicarious calibrations, even worst-case conditions were simply provided to inform readers that these radiometric errors exist.
Table 6 shows the estimated error budgets induced by the vicarious calibration of KOMPSAT-3 and -3A during the study periods. They have the same combined error budget values because the sensor specifications for AEISS and AEISS-A and the vicarious calibration algorithm are the same. Among the causes of error, a relative radiometric correction such as non-uniformity and pixel burst contributes the most to total budgets. One of the primary goals of high-resolution optical satellites is to estimate categorical variables such as image interpretation, land cover, land use, and change detection. Therefore, relative (pixel-to-pixel within uniform scenes) radiometric correction was performed to improve their uniformity and sharpness, and to eliminate pixel noise from non-uniform CCD array sensitivity. During the in-orbit-test (IOT), non-uniformity correction (NUC) based on the slide-slither image observation method and an image data restoration (de-noising) algorithm were applied to KOMPSAT-3 and -3A to reduce non-uniformity, eliminate sparkle lines, and minimize the pattern noise by selecting dark DN areas. The raw DN of the CCD sensors are unavoidably changed by this process [47]. More specifically, the NUC method resulted in the greatest DN change, a variation of about 3%. In addition, modulation transfer function compensation (MTFC) de-noising and pixel burst, respectively, resulted in less than a 1% change in the DN. Therefore, a 5% error, which is a sufficient margin due to the DN distortion by the relative radiometric correction.
In this study, we did not interpret how DN variations caused by relative radiometric correction propagate into the absolute radiometric calibration of KOMPSAT-3 and -3A. Different methods of relative radiometric correction exist, such as MTFC, NUC, de-noising, and pixel burst correction; however, the distortion of DN due to relative radiometric correction is too complicated, because it depends on the conditions of the reference target, location, and atmospheric correction. In future research, we aim to interpret the effects of relative radiometric accuracy assessment. In this study, however, we focused on updating the absolute radiometric calibration results of KOMPSAT-3 and KOMPSAT-3A according to TDI adjustments and sensor degradation over time.
In the case of solar irradiance, we used solar irradiance profiles recommended by the Committee on Earth Observation Satellites (CEOS) community [48] as input parameters for the radiative transfer model. In this study, a 1% radiance error was employed since there is no evidence for a change to the solar irradiance data that are used in radiative transfer model calculation [49]. Although there are differences in the wavelength resolution between the 1 nm solar irradiance data and the 2.5 nm spectral resolution of the 6S radiative model do exist, the CEOS profiles have a higher spectral resolution than the 6S model, meaning that this difference should not significantly increase the uncertainty of the input values. In this study, the last two cases of KOMPSAT-3 and -3A satellites in Table 4 were used for the official DN to radiance coefficients of the satellites because they are most similar to ASD Fieldspec® 3 geometry. However, although the geometry discrepancy between the satellites and the ASD Fieldspec® 3 is low, observation differences remain. Therefore, we assigned a radiance error of less than 1% due to the last two cases.
During the field campaign, errors in the surface reflectance measurement and fundamental instrument errors of ASD Fieldspec® were also expected. In the case of surface reflectance error from ASD Fieldspec®, the reflectance variation within each wavelength SRF of KOMPSAT-3 and -3A has an uncertainty of approximately 1% for each multispectral band when measuring ASD (Figure 6). The dual ASD Fieldspec® radiometer system was performed to reduce the inherent error of the radiometer and obtain stable and reliable reflectance values for the tarps. By using the dual radiometer system, we minimized the error due to the variation in weather conditions by simultaneously measuring the white reference and the target using the two radiometers. Thus, the errors can be reduced by comparing single ASD Fieldspec® 3 measurements. Also, the typical instrument error of ASD Fieldspec® was assigned as less than 1%. Lastly, regarding the atmospheric conditions for AOD, total ozone, and column water vapor, using state-of-art Microtops II® resulted in valid accuracy values for each piece of atmospheric information. According to the user manual of Microtops II®, the precision of the instruments is approximately 1–2%. Furthermore, the sensitivity due to these error propagations to the TOA radiance of the radiative transfer model is substantially less than 2%. In the case of AOD, there is no channel at 550 nm, which is used in the 6S radiative transfer model. Therefore, we used the Ångström exponent law to interpolate that an aerosol optical depth of 550 nm, with two neighboring 440 and 870 nm channels. The accuracy of the Ångström exponent law depends mainly on the size and composition of particles and degree of mixing ratio. Under benign weather conditions such as those in Mongolia, it is assumed that the uncertainty due to interpolation based on the Ångström exponent law would be fairly low, and could be used as a generally accepted true value that is used generally [50]. Accurate atmospheric measurement with precise sunphotometers are needed to obtain more specific aerosol optical properties.
Therefore, it is expected to have an error of less than 1% when using the current atmospheric instrument to simulate TOA radiance. To conclude, the combined errors of the vicarious calibration for KOMPSAT-3 and-3A sensors, approximately 5.7%, were based on the assumption that each of the manifested error sources was independent. We know that each of the mentioned error terms is not independent since each error may be offset or amplified during absolute radiometric calibration; some of the errors may or may not also be propagated into others. However, it is difficult to interpret these complicated effects. Therefore, this study simply provides worst-case uncertainty regarding the calculated error budget as a reminder that these radiometric errors exist.
Despite efforts to reduce the uncertainties of vicarious radiometric calibration, there are still issues to be addressed in future work. Laboratory-based BRDF measurements were used to normalize the satellite sensor geometry to the nadir direction, but they showed limitations for correcting the BRDF effects of the radiometric tarp. The hyperspectral gonioreflectometer was designed to measure two-dimensional BRDFs, meaning that only the critical plane measurement is available and it is difficult to measure the BRDF effects of azimuth angle. However, the satellite observation geometry has 3-D coordinate measurements. According to Georgiev and Butler [38], the higher the viewing zenith angle, the higher the BRDF effects in the azimuth angle direction. Future research should consider developing a new three-dimensional gonioreflectometer to determine the BRDF effects of azimuth direction. In addition, due to the characteristic of polar orbiting KOMPSAT satellites that are observing the world area, most of it is observed with the optimized sensor specifications used in this study. However, in some cases, different TDI and relative radiometric corrections are applied in order to enhance the image interpretation in bright areas such as bright desert or snow area. This study did not consider this case since the reflectance range of radiometric tarps is from 3% to 60% similar with most cases of natural reflectance. This means that the updated coefficients can be available in most cases of natural reflectance targets.

5. Conclusions

We described the vicarious radiometric calibration approach for multispectral imaging sensors of the KOMPSAT-3 and -3A satellites based on field campaigns. Microtops II® instruments were used to measure atmospheric conditions and were highly efficient in conducting field campaigns multiple times over three study sites due to their simple operation and portability. Additionally, the dual ASD FieldSpec® hyperspectral radiometer system provided stable reflectances for the reference tarps, even in cloudy atmospheric conditions. Therefore, we conclude that the use of these instruments could increase the efficiency of field campaign-based sensor calibration.
In this study, field campaigns were attempted twelve times, but only four satellite images were obtained due to weather limitations. Furthermore, the satellite images obtained from the two field campaigns in South Korea had somewhat more substantial errors due to the large viewing zenith angles of the imaging sensors. Nonetheless, when considering sensor geometry and weather conditions, the newly updated coefficients obtained from the field campaigns in Mongolia are sufficient to provide users with consistent coefficients for the KOMPSAT-3 and -3A satellite.

Author Contributions

J.-M.Y. developed the research plan and supervised the work. J.-M.Y. and S.J. analyzed data and prepared the manuscript and figures. J.K., J.H., C.-S.L., and C.C. participated in the literature review, data acquisition, method selection, and discussions. All authors were equally involved in the editing of the manuscript.

Acknowledgments

We are grateful to the editors and anonymous referees for their helpful comments and suggestions. This study was supported by the Korea Aerospace Research Institute (FR18720).

Conflicts of Interest

The authors declare no conflict of interest.

References

  1. Chander, G.; Markham, B. Revised Landsat-5 TM radiometric calibration procedures and postcalibration dynamic ranges. IEEE Trans. Geosci. Remote Sens. 2003, 41, 2674–2677. [Google Scholar] [CrossRef]
  2. Franz, B.A.; Bailey, S.W.; Werdell, P.J.; McClain, C.R. Sensor-independent approach to the vicarious calibration of satellite ocean color radiometry. Appl. Opt. 2007, 46, 5068–5082. [Google Scholar] [CrossRef] [PubMed]
  3. Thome, K.J.; Arai, K.; Tsuchida, S.; Biggar, S.F. Vicarious Calibration of ASTER via the Reflectance-Based Approach. IEEE Trans. Geosci. Remote Sens. 2008, 46, 3285–3295. [Google Scholar] [CrossRef]
  4. Liu, C.C.; Kamei, A.; Hsu, K.H.; Tsuchida, S.; Huang, H.M.; Kato, S.; Nakamura, R.; Wu, A.M. Vicarious Calibration of the Formosat-2 Remote Sensing Instrument. IEEE Trans. Geosci. Remote Sens. 2010, 48, 2162–2169. [Google Scholar] [CrossRef]
  5. Rao, C.R.N.; Chen, J.; Sullivan, J.T.; Zhang, N. Post-launch calibration of meteorological satellite sensors. In Advances in Space Research; Tsuchiya, K., Ed.; Elsevier: Amsterdam, The Netherlands, 1999; Volume 23, pp. 1357–1365. ISBN 0273-1177. [Google Scholar]
  6. Thome, K.J. Absolute radiometric calibration of Landsat 7 ETM+ using the reflectance-based method. Remote Sens. Environ. 2001, 78, 27–38. [Google Scholar] [CrossRef]
  7. Markham, B.L.; Helder, D.L. Forty-year calibrated record of earth-reflected radiance from Landsat: A review. Remote Sens. Environ. 2012, 122, 30–40. [Google Scholar] [CrossRef]
  8. Dinguirard, M.; Slater, P.N. Calibration of space-multispectral imaging sensors: A review. Remote Sens. Environ. 1999, 68, 194–205. [Google Scholar] [CrossRef]
  9. Ham, S.H.; Sohn, B.J. Assessment of the calibration performance of satellite visible channels using cloud targets: Application to Meteosat-8/9 and MTSAT-1R. Atmos. Chem. Phys. 2010, 10, 11131–11149. [Google Scholar] [CrossRef]
  10. Koepke, P. Vicarious satellite calibration in the solar spectral range by means of calculated radiances and its application to Meteosat. Appl. Opt. 1982, 21, 2845–2854. [Google Scholar] [CrossRef] [PubMed]
  11. Yeom, J.M.; Hwang, J.; Jung, J.H.; Lee, K.H.; Lee, C.S. Initial Radiometric Characteristics of KOMPSAT-3A Multispectral Imagery Using the 6S Radiative Transfer Model, Well-Known Radiometric Tarps, and MFRSR Measurements. Remote Sens. 2017, 9, 130. [Google Scholar] [CrossRef]
  12. Chander, G.; Markham, B.L.; Helder, D.L. Summary of current radiometric calibration coefficients for Landsat MSS, TM, ETM+, and EO-1 ALI sensors. Remote Sens. Environ. 2009, 113, 893–903. [Google Scholar] [CrossRef]
  13. Xiong, X.X.; Barnes, W. An overview of MODIS radiometric calibration and characterization. Atmos. Sci. 2006, 23, 69–79. [Google Scholar] [CrossRef]
  14. Ono, A.; Sakuma, F.; Arai, K.; Yamaguchi, Y.; Fujisada, H.; Slater, P.N.; Thome, K.J.; Palluconi, F.D.; Kieffer, H.H. Preflight and in-flight calibration plan for ASTER. J. Atmos. Ocean. Technol. 1996, 13, 321–335. [Google Scholar] [CrossRef]
  15. Obata, K.; Tsuchida, S.; Iwao, K. Inter-Band Radiometric Comparison and Calibration of ASTER Visible and Near-Infrared Bands. Remote Sens. 2015, 7, 15140–15160. [Google Scholar] [CrossRef]
  16. Kamei, A.; Nakamura, K.; Yamamoto, H.; Nakamura, R.; Tsuchida, S.; Yamamoto, N.; Sekiguchi, S.; Kato, S.; Liu, C.C.; Hsu, K.H.; et al. Cross Calibration of Formosat-2 Remote Sensing Instrument (RSI) Using Terra Advanced Spaceborne Thermal Emission and Reflection Radiometer (ASTER). IEEE Trans. Geosci. Remote Sens. 2012, 50, 4821–4831. [Google Scholar] [CrossRef]
  17. Obata, K.; Tsuchida, S.; Yamamoto, H.; Thome, K. Cross-Calibration between ASTER and MODIS Visible to Near-Infrared Bands for Improvement of ASTER Radiometric Calibration. Sensors 2017, 17, 1793. [Google Scholar] [CrossRef] [PubMed]
  18. Helder, D.; Thome, K.J.; Mishra, N.; Chander, G.; Xiong, X.X.; Angal, A.; Choi, T. Absolute Radiometric Calibration of Landsat Using a Pseudo Invariant Calibration Site. IEEE Trans. Geosci. Remote Sens. 2013, 51, 1360–1369. [Google Scholar] [CrossRef]
  19. Hovis, W.A.; Knoll, J.S.; Smith, G.R. Aircraft measurements for calibration of an orbiting spacecraft sensor. Appl. Opt. 1985, 24, 407–410. [Google Scholar] [CrossRef] [PubMed]
  20. Vogelmann, J.E.; Helder, D.; Morfitt, R.; Choate, M.J.; Merchant, J.W.; Bulley, H. Effects of Landsat 5 thematic mapper and Landsat 7 enhanced thematic mapper plus radiometric and geometric calibrations and corrections on landscape characterization. Remote Sens. Environ. 2001, 78, 55–70. [Google Scholar] [CrossRef]
  21. Yeom, J.M.; Hwang, J.; Jin, C.G.; Lee, D.H.; Han, K.S. Radiometric Characteristics of KOMPSAT-3 Multispectral Images Using the Spectra of Well-Known Surface Tarps. IEEE Trans. Geosci. Remote Sens. 2016, 54, 5914–5924. [Google Scholar] [CrossRef]
  22. Chander, G.; Xiong, X.X.; Choi, T.Y.; Angal, A. Monitoring on-orbit calibration stability of the Terra MODIS and Landsat 7 ETM+ sensors using pseudo-invariant test sites. Remote Sens. Environ. 2010, 114, 925–939. [Google Scholar] [CrossRef]
  23. Erdenebaatar, N.; Kim, J.; Kim, T. Analysis of Geometric and Spatial Image Quality of KOMPSAT-3A Imagery in Comparison. Korea J. Remote Sens. 2017, 33, 1–13. [Google Scholar] [CrossRef]
  24. Kim, J.; Jin, C.; Choi, C.; Ahn, H. Radiometric characterization and validation for the KOMPSAT-3 sensor. Remote Sens. Lett. 2015, 6, 529–538. [Google Scholar] [CrossRef]
  25. Jeong, J.; Kim, J.; Kim, T.; Rhee, S. Evaluation of the performance of KOMPSAT-3 stereo images in terms of positioning and the generation of digital surface models. Remote Sens. Lett. 2016, 7, 955–964. [Google Scholar] [CrossRef]
  26. Seo, D.; Oh, J.; Lee, C.; Lee, D.; Choi, H. Geometric Calibration and Validation of Kompsat-3A AEISS-A Camera. Sensors 2016, 16, 1776. [Google Scholar] [CrossRef] [PubMed]
  27. Lee, K.; Kim, E.; Kim, Y. Orthorectification of KOMPSAT Optical Images Using Various Ground Reference Data and Accuracy Assessment. J. Sens. 2017, 2017, 1–14. [Google Scholar] [CrossRef]
  28. Slater, P.N.; Biggar, S.F.; Thome, K.J.; Gellman, D.I.; Spyak, P.R. Vicarious radiometric calibrations of EOS sensors. J. Atmos. Ocean. Technol. 1996, 13, 349–359. [Google Scholar] [CrossRef]
  29. Yang, A.; Zhong, B.; Wu, S.; Liu, Q. Evaluation on Radiometric Capability of Chinese Optical Satellite Sensors. Sensors 2017, 17, 204. [Google Scholar] [CrossRef] [PubMed]
  30. Lee, H.; Hand, D.; Seo, D.; Park, B.; Ahn, K. Detection of theUnified Control Points for RPCAdjustment of KOMPSAT-3 Satellite Image. Korea J. Remote Sens. 2014, 30, 829–837. [Google Scholar] [CrossRef]
  31. Nandy, P.; Thome, K.; Biggar, S. Characterization and field use of a CCD camera system for retrieval of bidirectional reflectance distribution function. J. Geophys. Res.-Atmos. 2001, 106, 11957–11966. [Google Scholar] [CrossRef]
  32. Vermote, E.F.; Tanre, D.; Deuze, J.L.; Herman, M.; Morcrette, J.J. Second simulation of the satellite signal in the solar spectrum, 6s: An overview. IEEE Trans. Geosci. Remote Sens. 1997, 35, 675–686. [Google Scholar] [CrossRef]
  33. Kotchenova, S.Y.; Vermote, E.F.; Matarrese, R.; Klemm, F.J. Validation of a vector version of the 6S radiative transfer code for atmospheric correction of satellite data. Part I: Path radiance. Appl. Opt. 2006, 45, 6762–6774. [Google Scholar] [CrossRef] [PubMed]
  34. Seidel, F.C.; Kokhanovsky, A.A.; Schaepman, M.E. Fast and simple model for atmospheric radiative transfer. Atmos. Meas. Tech. 2010, 3, 1129–1141. [Google Scholar] [CrossRef] [Green Version]
  35. Vermote, E.F.; Kotchenova, S. Atmospheric correction for the monitoring of land surfaces. J. Geophys. Res. 2008, 113, D23S90. [Google Scholar] [CrossRef]
  36. Von Hoyningen-Huene, W.; Yoon, J.; Vountas, M.; Istomina, L.G.; Rohen, G.; Dinter, T.; Kokhanovsky, A.A.; Burrows, J.P. Retrieval of spectral aerosol optical thickness over land using ocean color sensors MERIS and SeaWiFS. Atmos. Meas. Tech. 2011, 4, 151–171. [Google Scholar] [CrossRef] [Green Version]
  37. Wu, A.; Li, Z.; Cihlar, J. Effects of land cover type and greenness on advanced very high resolution radiometer bidirectional reflectances: Analysis and removal. J. Geophys. Res. 1995, 100, 9179–9192. [Google Scholar] [CrossRef]
  38. Georgiev, G.T.; Butler, J.J. Laboratory-based bidirectional reflectance distribution functions of radiometric tarps. Appl. Opt. 2008, 47, 3313–3323. [Google Scholar] [CrossRef] [PubMed]
  39. Feingersh, T.; Dorigo, W.; Richter, R.; Dor, E.B. A new model-driven correction factor for BRDF effects in HRS data. In Proceedings of the EARSel Workshop, Warsaw, Poland, 27–30 April 2005. [Google Scholar]
  40. Hwang, J.S. Absolute measurement of hyperspectral and angular reflection. Appl. Opt. 2014, 53, 6216–6221. [Google Scholar] [CrossRef] [PubMed]
  41. Teillet, P.M.; Fedosejevs, G.; Gauthier, R.P.; O’Neill, N.T.; Thome, K.J.; Biggar, S.F.; Ripley, H.; Meygret, A. A generalized approach to the vicarious calibration of multiple earth observation sensors using hyperspectral data. Remote Sens. Environ. 2001, 77, 304–327. [Google Scholar] [CrossRef]
  42. De Vries, C.; Danaher, T.; Denham, R.; Scarth, P.; Phinn, S. An operational radiometric calibration procedure for the landsat sensors based on pseudo-invariant target sites. Remote Sens. Environ. 2007, 107, 414–429. [Google Scholar] [CrossRef]
  43. Biggar, S.F.; Thome, K.J.; Wisniewski, W. Vicarious radiometric calibration of eo-1 sensors by reference to high-reflectance ground targets. IEEE Trans. Geosci. Remote Sens. 2003, 41, 1174–1179. [Google Scholar] [CrossRef]
  44. Sridhar, V.N.; Mehta, K.B.; Prajapati, R.P.; Babu, K.N.; Suthar, N.M.; Shukla, A.K. Absolute vicarious calibration of OCM2 and AWiFS sensors using a reflectance based method over land sites in the Rann of Kutch, Gujarat. Int. J. Remote Sens. 2013, 34, 5690–5708. [Google Scholar] [CrossRef]
  45. Ångström, A. The parameters of atmospheric turbidity. Tellus 1964, 16, 64–75. [Google Scholar] [CrossRef]
  46. Kaskaoutis, D.; Kambezidis, H.; Hatzianastassiou, N.; Kosmopoulos, P.; Badarinath, K. Aerosol climatology: Dependence of the angstrom exponent on wavelength over four aeronet sites. Atmos. Chem. Phys. Discuss. 2007, 7347–7397. [Google Scholar] [CrossRef]
  47. Pagnutti, M.; Ryan, R.E.; Kelly, M.; Holekamp, K.; Zanoni, V.; Thome, K.; Schiller, S. Radiometric characterization of IKONOS multispectral imagery. Remote Sens. Environ. 2003, 88, 53–68. [Google Scholar] [CrossRef]
  48. Thuillier, G.; Hersé, M.; Labs, D.; Foujols, T.; Peetermans, W.; Gillotay, D.; Simon, P.C.; Mandel, H. The solar spectral irradiance from 200 to 2400 nm as measured by the SOLSPEC spectrometer from Atlas and Eureca missions. Sol. Phys. 2003, 214, 1–22. [Google Scholar] [CrossRef]
  49. Kuze, A.; Taylor, T.; Kataoka, F.; Bruegge, C.J.; Crisp, D.; Harada, M.; Helmlinger, M.; Inoue, M.; Kawakami, S.; Kikuchi, N.; et al. Long-term vicarious calibration of GOSAT short-wave sensors: Techniques for error reduction and new estimates of radiometric degradation factors. IEEE Trans. Geosci. Remote Sens. 2014, 7, 3991–4004. [Google Scholar] [CrossRef]
  50. Cachorro, V.E.; Duran, P.; Vergaz, R.; de Frutos, A.M. Columnar physical and radiative properties of atmospheric aerosols in north central Spain. J. Geophys. Res.-Atmos. 2000, 105, 7161–7175. [Google Scholar] [CrossRef]
Figure 1. (a,c,e) KOMPSAT-3 and -3A RGB images of Goheung County, South Korea acquired on 14 May 2017, Naju, South Korea acquired on 27 July 2017, and Zuunmod, Mongolia, acquired on 19 September 2017, respectively. (b,d,f) cropped satellite RGB images showing the locations of the deployed four radiometric tarps corresponding to red squares in (a,c,e) respectively.
Remotesensing 10 00697 g001aRemotesensing 10 00697 g001b
Figure 2. Flowchart showing the vicarious radiometric calibration of KOMPSAT-3 and -3A using the 6S radiative transfer model and related input parameters.
Remotesensing 10 00697 g002
Figure 3. Schematic diagram (a) and picture (b) of the hyperspectral gonioreflectometer used for BRDF measurements on tarps.
Remotesensing 10 00697 g003
Figure 4. Measured ANIF values (red points) of KOMPSAT-3 for the Goheung field campaign sites. The uncertainty of BRDF measurement is shown by the vertical error bar and the blue dashed line means that no BRDF effect is expected due to an ANIF value of 1. (a,c,e,g) show ANIF values of 3%, 24%, 36%, and 57% tarp under backward scattering conditions, and (b,d,f,h) show the same values under forward scattering conditions.
Remotesensing 10 00697 g004
Figure 5. Picture showing radiance measurements of a white reference panel and calibration tarps using a dual ASD Fieldspec® 3 radiometer system at Goheung site in South Korea.
Remotesensing 10 00697 g005
Figure 6. Hyperspectral reflectance curves corresponding to the KOMPSAT-3 and -3A spectral range (350–900 nm) measured by the dual ASD Fieldspec® 3 radiometer system. On 14 May, 27 July, 19 and 20 September in 2017, respectively (ad).
Remotesensing 10 00697 g006
Figure 7. Relative spectral response function (SRF) for the blue, green, red, and near-infrared (NIR) spectral ranges of KOMPSAT-3 and -3A.
Remotesensing 10 00697 g007
Figure 8. (a) Picture of the Microtops II® Sunphotometer and Ozonometer, developed by (Solar Light Inc., Glenside, PA, USA) deployed at the Zuunmod site in Mongolia and (b) the measured and estimated aerosol optical depth (AOD) using the Sunphotometer. White circles are the measured AODs (440–1020 nm) while the black circle is the estimated AOD in 550 nm using the Ångström exponent based on the AODs in the 440 and 870 nm channels.
Remotesensing 10 00697 g008
Figure 9. Scatterplots between KOMPSAT-3A DN and simulated TOA radiance for all multispectral bands during the field campaign periods; (ad) represent the blue, green, red, and NIR bands, respectively.
Remotesensing 10 00697 g009aRemotesensing 10 00697 g009b
Figure 10. Scatterplots between KOMPSAT-3 DN and simulated TOA radiance fine all multispectral bands acquired on 20 September 2017; (ad) represent the blue, green, red, and NIR bands, respectively.
Remotesensing 10 00697 g010aRemotesensing 10 00697 g010b
Table 1. Detailed specifications of KOMPSAT-3 and -3A sensors.
Mission CharacteristicKOMPSAT-3KOMPSAT-3A
Design lifetime4 years4 years
Orbit altitude685 km528 km
Swath width≥15 km (at nadir)≥12 km (at nadir)
Ground sample distancePan: 0.7 m (altitude 685 km)
MS: 2.8 m (altitude 685 km)
Pan: 0.55 m (altitude 528 km)
MS: 2.2 m (altitude 528 km)
IR: 5.5 m (altitude 528 km)
Spectral bandsPan: 450–900 nm
Blue: 450–520 nm
Green: 520–600 nm
Red: 630–690 nm
NIR: 760–900 nm
Pan: 450–900 nm
Blue: 450–520 nm
Green: 520–600 nm
Red: 630–690 nm
NIR: 760–900 nm
MWIR: 3300–5200 nm
Radiometric resolution14 bit14 bit
Modulation Transfer Function (MTF)PAN ≥8%
MS ≥12%
PAN ≥10%
MS ≥13%
Signal-to-Noise Ratio (SNR)>100 for Pan and MS>100 for Pan and MS
Table 2. Selected geometric conditions of KOMPSAT-3 and -3A imagery for radiometric calibration.
DateSatelliteSiteObserved Time (UTC)Solar
Zenith
Solar
Azimuth
Viewing
Zenith
Viewing
Azimuth
14 May 2017KOMPSAT-3Goheung04:27:1628.500242.88317.202140.507
27 July 2017KOMPSAT-3Naju04:34:5920.091221.48921.833184.074
19 September 2017KOMPSAT-3AZuunmod05:38:5748.209200.9213.112259.113
20 September 2017KOMPSAT-3Zuunmod05:47:3948.040197.5880.762257.866
Table 3. Measured water vapor, total ozone, and aerosol optical depth (AOD) using the Microtops II® Sunphotometer and Ozonometer (Solar Light Inc., Glenside, PA, USA).
DateWater Vapor (g cm−2)Total Ozone (cm-atm)Aerosol Optical Depth (550 nm)
14 May 20170.9970.3500.207
27 July 20173.0010.2510.135
19 September 20170.5690.2970.055
20 September 20170.5340.3050.087
Table 4. Updated DN to radiance coefficients and offsets for KOMPSAT-3 and -3A based on vicarious calibration methods using radiometric tarps and Microtops II in 2014.
BandScale Factor
KOMPSAT-3, 05/14KOMPSAT-3, 07/27KOMPSAT-3A, 09/19KOMPSAT-3, 09/20
Blue0.0256 (0.0260) 10.02390.03620.0275
Green0.0359 (0.0365) 10.03090.02490.0382
Red0.0259 (0.0265) 10.02300.02290.0294
NIR0.0177 (0.0181) 10.01490.01300.0192
Offset
Blue−47.8711 (−48.7996) 1−45.0553−22.1416−28.4989
Green−38.8875 (−40.5952) 1−24.9649−14.0210−27.3846
Red−21.5454 (−21.6730) 1−14.8416−13.0457−21.6854
NIR−20.5972 (−20.2303) 1−14.2401−10.2834−13.5910
1 The values in parentheses are the BRDF-corrected scale factors and offsets using the ANIF of laboratory BRDF measurements for sampled tarps.
Table 5. Comparison of previous and updated DN to radiance coefficients of KOMPSAT-3 and -3A.
BandsKOMPSAT-3KOMPSAT-3A
PreviousUpdatedPreviousUpdated
Blue0.01850.02750.03010.0362
Green0.02480.03820.04380.0249
Red0.02140.02940.04430.0229
NIR0.01410.01920.02350.0130
Table 6. Approximate error budget for the vicarious calibration of KOMPSAT-3 and -3A.
FactorsRadiance Error (%)
KOMPSAT-3KOMPSAT-3A
Relative radiometric correction55
Solar irradiance data11
Laboratory-based BRDF measurements<1<1
Surface reflectance measurement11
ASD FieldSpec® 3 instrument<1<1
6S Radiative transfer11
AOD from Microtops II® Sunphotometer<1<1
Total ozone from Microtops II® Ozonometer<1<1
Column water vapor from Microtops II® Sunphotometer<1<1
Combined error ~5.7~5.7

