Abstract
The normalized difference vegetation index (NDVI) derived from remote sensing is a common explanatory variable inputted in correlative biodiversity models in the form of descriptive statistics summarizing complex time series. Here, we hypothesized that a single meaningful remotely-sensed scene can provide better prediction of species richness than any usual multi-scene statistics. We tested this idea using a 15-year time series of six-day composite MODIS NDVI data combined with field measurements of tree species richness in the tropical biodiversity hotspot of New Caledonia. Although some overall, seasonal, annual and monthly statistics appeared to successfully correlate with tree species richness in New Caledonia, a range of individual scenes were found to provide significantly better predictions of both the overall tree species richness (|r| = 0.68) and the richness of large trees (|r| = 0.91). A preliminary screening of the NDVI-species richness relationship within each time step can therefore be an effective and straightforward way to maximize the accuracy of NDVI-based correlative biodiversity models.
1. Introduction
Improving predictions of biodiversity, which encompasses the variety of life at all levels of organization (from genetic diversity within a species to diversity within entire regions or ecosystems), is essential if we are to meet the challenges posed by global change. Remote sensing is acknowledged as a promising technique that will shape the next generation of biodiversity models such as correlative species distribution models and macro-ecological models [1,2]. One of the most commonly used remotely-sensed spectral indices is the normalized difference vegetation index (NDVI), a measure of greenness calculated from reflectance in the near infrared and red portions of the electromagnetic spectrum [3]. A growing body of research has used the NDVI to predict species richness as NDVI would be a proxy for net primary productivity, which is thought to be closely related to the number of species [4]. Plant species richness measured in the field has been successfully estimated using NDVI measurements derived from a range of sensors including Advanced Very High Resolution Radiometer (AVHRR) [5,6], Landsat [5,7,8,9], radar [10] and LIDAR [11,12] in both temperate [5,6,13] and tropical ecosystems [7,8,9,11,12,13]. NDVI has also captured the attention of ecologists seeking to understand patterns of animal species richness [14,15,16]. However, the NDVI-species richness relationship remains poorly understood as it is highly context- and scale-dependent and because of correlated biotic and abiotic factors that influence NDVI [17,18].
There is increasing evidence that the strength with which NDVI correlate with species richness varies over time, both between (e.g., [5,6,17]) and within years (e.g., [13,14,17]). Thus, this variation has the potential to affect the quality of NDVI-based biodiversity models depending on which descriptive statistics and dates are used. Overall, seasonal, annual and monthly means, medians, quantiles and variances as well as extreme values of NDVI are often used as explanatory variables (e.g., [5,6,13,14,17]). However, evidences that such statistics are optimal to capture the predictive power of NDVI in biodiversity models are lacking.
We hypothesize that the NDVI-species richness relationship is so unclear that a ‘screening approach’ (without a priori assumption on what most strongly drives the relationship) may help to find a single meaningful remotely-sensed scene offering better prediction of species richness than any usual multi-scene statistics. We examined the variation of the NDVI-tree species richness relationship at a high temporal resolution (six days) and over a long time series (15 years) in a tropical biodiversity hotspot (New Caledonia) and ask which of basic descriptive statistics derived from this set of scenes or some individual timely scenes are the best predictors. In particular, we test two approaches: (1) the use of classical multi-scene statistics (mean, median, quartiles, variance or extreme values of NDVI over a given time period); and (2) a single-scene screening approach which assumes that species richness responds to unpredictable discrete events. In New Caledonia, little information about the distribution of tree species richness is currently available [19]. A second objective of this study is to produce the first map of tree species richness based on remote sensing in this tropical biodiversity hotspot.
2. Materials and Methods
2.1. Study Area
New Caledonia is an archipelago situated slightly north of the tropic of Capricorn (20–23° S; 164–167° E) c. 1500 km west of Australia and 2000 km north of New Zealand. The main island (Grande Terre) is c. 350 km in length and 50–70 km wide oriented north-west to south-east and bisected by an almost continuous mountain range reaching 1628 m a.s.l. (Mont Panié). New Caledonia has a tropical climate with annual mean temperature in lowland areas between 27 and 30 °C from November to April (wet season) and between 20 and 23 °C from June to August (dry season). Annual precipitation ranges from 300 to 4300 mm with greater precipitation on the windward east coast [20].
The landscape is a mosaic composed of secondary vegetation (c. 50%), low- to mid-elevation shrublands or ‘maquis’ found on ultramafic substrates (c. 25%), another quarter of low- to mid-elevation rainforests, 1% of montane rain forests and shrublands found above 800 m, with a few relictual patches of dry sclerophyll forests scattered along the west coast [21,22]. This variety of environments along with a complex biogeographical history is hypothesized to be the main determinant of the exceptional biological diversity of the hotspot that contains 3371 vascular plant species with an endemism rate of 75% [23]. This study focused on low- to mid-elevation and montane rainforests, which together account for 63% of the flora with an endemism rate of 83% [23].
2.2. Field Data
Species richness was quantified through 19 rainforest tree inventories covering one hectare, an area though to contain the pool of species representative of a tropical forest community. The data of three inventories were derived from publications dating from the early 1990’s [24,25], while the data of the other inventories were collected in the framework of the New Caledonian Plant Inventory and Permanent Plot Network (NC-PIPPN) between 2013 and 2017 [26] (Table 1). Plots were placed so as to maximize the geographical coverage as well as the elevation and rainfall ranges of the hotspot (Figure 1). Infraspecific taxa (subspecies and varieties) were not considered and merged at the species rank. Species richness estimates were computed (1) for all trees with a diameter at breast height (dbh) above the international standard of 10 cm [27]; and (2) for large trees only (dbh ≥ 40 cm) (Table 1). The latter was nested in the former. Almost 18,000 trees belonging to 452 native species were captured by the plots (see Supplementary File). Tree species richness was assumed to remain unchanged over the 15-year period in which remotely-sensed data were acquired as plants are fixed organisms and trees with a dbh ≥ 10 cm are most likely to be older than 15 years in absence of evidence of recent disturbances (after the 1980s) [26].

Table 1.
Summary of the 19 plots located in New Caledonia used to calculate correlation between normalized difference vegetation index (NDVI) and species richness (SR). The data source ‘IAC/UMR AMAP’ refers to authors’ affiliations.
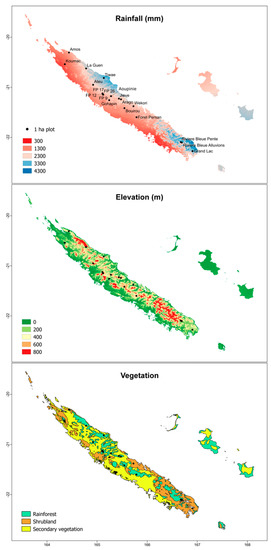
Figure 1.
Geographical and environmental distributions of the 19 one hectare plots used to examine the NDVI-tree species richness relationship in New Caledonia.
2.3. Remote Sensing and Statistical Analysis
A total of 784 filtered MODIS scenes at a 250 m resolution (MYD13Q1 six-day composite product from the Aqua satellite) dating from 24 July 2002 to 26 July 2017 were uploaded from the website of the University of Natural Resources and Life Sciences, Vienna [28]. Smoothed and gap-filled data sets were derived using the state-of-the-art Whittaker filter implemented in Matlab [29]. Values of pixels on which each plot was centered were extracted. Then, the NDVI-species richness relationship was fitted on the basis of the 19 one hectare plots using a linear model as both NDVI (Shapiro-Wilk test; p > 0.08) and species richness were normally distributed (p > 0.11). NDVI might be prone to saturation in tropical environments such as those occurring in the study area [10]. As a result, analyzes based on NDVI were compared to the same analyzes based on the enhanced vegetation index (EVI), an ‘optimized’ vegetation index designed to enhance the vegetation signal with improved sensitivity in high-biomass regions. The EVI time series (also included in the MYD13Q1 product) was uploaded from the same database as the NDVI time series [28].
Two approaches were compared in their ability to correlate with species richness measurements: (1) the use of classical multi-scene statistics which assumes that species richness responds to average values of NDVI or their distribution over a given time period; and (2) our single-scene screening approach. The former was based on 77 metrics commonly found in the literature: the mean, median, variance, first and third quartiles, maximum and minimum values over the whole 15-year period (7 metrics), over all wet seasons (7 metrics) and over all dry seasons (7 metrics) as well as the annual (32 metrics) and monthly means and variances (24 metrics) [5,6,13,14,17]. In the latter approach, the NDVI-species richness correlation was calculated for each of the 784 six-day composite scenes. This screening approach aims to select the scenes yielding the best correlation to subsequently extrapolate species richness. Then, we determined whether some of the 784 single-scene correlations outperform the 77 multi-scene correlations.
3. Results
The overall tree species richness (dbh ≥ 10 cm) ranged from 31 species/ha at Koumac to 131 species/ha at Riviere Bleue Pente with a mean of 85 ± 27 species/ha. Species richness of large trees (dbh ≥ 40 cm) was much lower and ranged from 2 species/ha at Tiwae to 29 species/ha in Aoupinie with a mean of 10 ± 7 species/ha. Mean NDVI values over plots throughout the period 2002–2017 ranged from 0.76 at Jieve to 0.87 at La Guen, the median from 0.77 at Jieve to 0.87 at La Guen, the variance from 0.0036 at Amos to 0.0129 at Ateu, minimum NDVI values from 0.54 at Grand Lac to 0.79 at Amos and maximum NDVI values from 0.82 at Jieve to 0.92 at Foret Plate 26. Average values of NDVI over the 15-year period were not associated with the overall species richness (|r| = 0.13; p = 0.60) or species richness of large trees (|r| = 0.47; p = 0.07) (Table 2). The magnitude of seasonal variations, the first, the second and third quartiles as well as the lowest extremes were also not associated with any species richness (|r| < 0.45; p > 0.07).

Table 2.
Correlation between basic descriptive statistics extracted from a 15-year time series of MODIS NDVI images produced on six-day intervals and species richness (SR) measured in 19 one hectare plots in New Caledonia. Asterisks refer to the level of significance: 0.05 < p < 0.01 (*); 0.01 < p < 0.001 (**); p < 0.001 (***).
Certain monthly statistics (e.g., wet season means) appeared to be significantly correlated with the species richness of large trees in New Caledonia (maximum |r| = 0.78; minimum p < 0.001) but not with the overall tree species richness (|r| < 0.39; p > 0.05) (Table 2). The overall tree species richness was better predicted by the overall and dry season maxima but the correlation remained relatively low (|r| = 0.52 and 0.51, respectively; p < 0.05). Based on the proposed screening approach, the single scene offering the best prediction of the overall tree species richness was taken from days 245 to 252 of 2004 (i.e., at the end of the dry season) and explained 47% of the variance (|r| = 0.68; p < 0.01). The scene offering the best prediction of the large tree species richness was taken from days 128 to 134 of 2008 (at the beginning of the dry season) and explained 83% of the variance (|r| = 0.91; p < 0.001) (Figure 2). The former increased (species richness of trees with dbh ≥ 10 cm = 324 * NDVI − 181) while the latter decreased as NDVI increased (species richness of trees with dbh ≥ 40 cm = −143 * NDVI + 126) (Figure 3 and Figure 4).
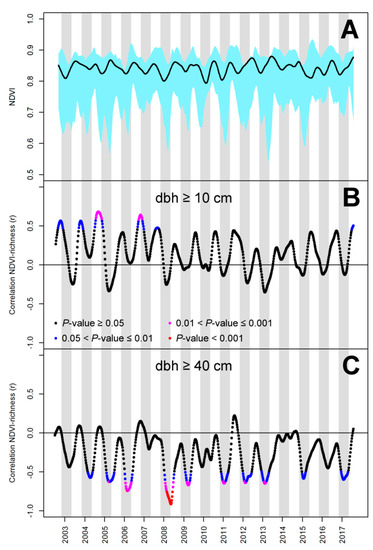
Figure 2.
Temporal variation of MODIS NDVI in 19 one-hectare plots in New Caledonia (A) and in its ability to predict species richness of trees with a diameter at breast height (dbh) above 10 cm (B) and 40 cm (C). (A) The black line represents the mean and the blue shaded area the interval within which plot values are found; (B,C) The color set refers to four significance levels of correlation tests. (A,C) The gray shaded area indicates the months of November to April (usual wet season).
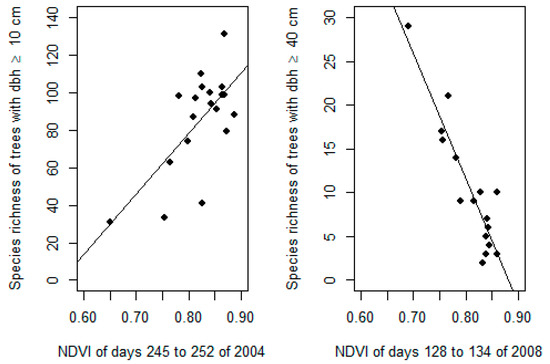
Figure 3.
Best correlations found between tree species richness (with a diameter at breast height (dbh) above 10 cm on the left and 40 cm on the right) and individual NDVI scenes selected from a 15-year MODIS NDVI time series using our screening approach.
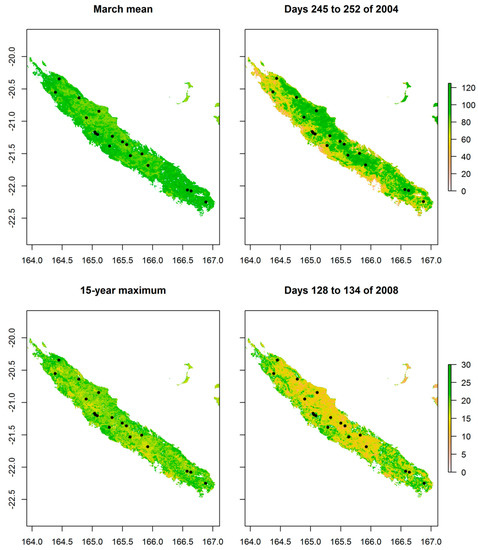
Figure 4.
Species richness of trees with dbh ≥ 10 cm (upper line) and 40 cm (lower line) predicted from basic descriptive statistics derived from a 15-year MODIS NDVI time series (Left Column) and a single carefully selected scene (Right Column) in New Caledonia.
The same screening approach based on EVI did not performed better than that based on NDVI (Figure A1). The best prediction of species richness was taken from days 254 to 260 of 2002 (i.e., also at the end of the dry season) for trees of dbh ≥ 10 cm and explained 39% of the variance (|r| = 0.62; p < 0.01) and taken from days 51 to 57 of 2008 (at the end of the wet season this time) for trees of dbh ≥ 40 cm and explained 59% of the variance (|r| = 0.77; p < 0.001). This approach was also found to provide better predictions of tree species richness than overall, seasonal, annual and monthly statistics based on EVI (Table A1).
4. Discussion
Basic descriptive statistics derived from MODIS NDVI scenes acquired during the wet season were found to be reliable predictors of tree species richness in New Caledonia considering there are currently no maps of species richness in the biodiversity hotspot. Some authors argued that species richness would track average levels of NDVI (e.g., [6,17]) while others rather mentioned an association with the magnitude of seasonal variations or the very most extreme events (e.g., [5,6,14]). In fact, the way in which productivity represents an ecological limit on biodiversity is likely to vary among space, time and species [30]. Yet, simplistic descriptive statistics derived from NDVI time series require a thorough knowledge of how productivity affects species richness patterns (which is seldom the case in practice). Our single-scene screening approach can be useful when the NDVI-species richness relationship remains misunderstood (then in most cases). It assumes that species richness gradients reflect variation in environmental harshness, which remains difficult to anticipate as it may depend on species phenology, the deviation from typical seasonal levels, the sequence of events, the combination with other sources of stress and so forth [31,32].
Many studies have reported significant positive correlations between tree (dbh ≥ 10 cm) species richness or diversity from plots (0.1 to 1 ha) and NDVI in tropical forest ecosystems [7,8,14,17]. NDVI from Landsat can explain between 30% and 40% of the variation in tropical tree species richness within a vegetation type, landscape, or region [7,8,9]. Active remote sensing such as airborne radar has been reported to explain 33% to 44% of the variation in tree species richness [10], while airborne LIDAR can only explain 25% of the variation in tree species richness in tropical forests [11,12]. Our results from MODIS using a similar number of plots and trees with a dbh ≥ 10 cm could explain 47% of the variance. This suggests that MODIS NDVI can be used to predict tree species richness in tropical forest ecosystems when plot data are available.
There has been an increasing interest in quantifying the density and species richness of large trees in the tropics. There is recent evidence that the largest trees (dbh ≥ 70 cm) or 5% of stems account for a majority of above ground biomass of tropical forests [33,34]. Silk et al. [33] found that density of the largest trees explained 70% of the variation in above ground biomass in the pan-tropics. This clearly points to a universality in tropical forests although trees canopies and dbh are generally smaller on islands like New Caledonia due to hurricanes [35]. It is interesting to note the negative correlations between NDVI and large trees. Large trees (dbh ≥ 20 cm) have been noted to reduce species richness under their large canopies and trunks [12]. This pattern may also be occurring in New Caledonia were large trees at the beginning of the dry season have lower NDVI values and reduce the NDVI values of other trees in the canopy and subcanopy. Indeed, a few large trees may be reducing NDVI values of the forest.
Maps of tree species richness in New Caledonia can be used to assess the protected area network in New Caledonia (Figure 5). In particular, areas with high species richness may deserve a high conservation priority and we can provide a first order assessment of tree species richness within protected areas and regions that may be of interest in the future. This case study exemplifies how remote sensing can help to understand patterns of tropical forest biodiversity and provide the basis for adapted conservation strategies in tropical biodiversity hotspots. Further work should examine the potential of NDVI in multivariate biodiversity models to map species composition, other diversity metrics (such as the Shannon index or the Simpson index) or functional traits rather than species richness, which are next steps required to define conservation priorities.
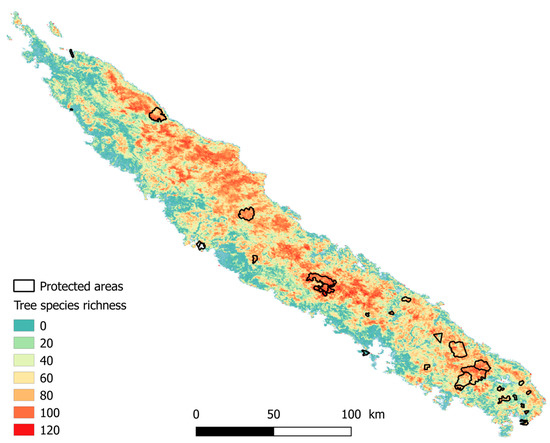
Figure 5.
Species richness of trees with dbh ≥ 10 cm predicted from a single carefully selected scene (days 245 to 252 of 2004) and the protected area network in New Caledonia.
5. Conclusions
We demonstrated that a single meaningful NDVI scene can provide better prediction of species richness than any usual multi-scene statistics or EVI. Given the complexity of the NDVI-species richness relationship, the quality of NDVI-based correlative biodiversity models should therefore be optimized by a more cautious and less systematic use of available time series. Selecting the most appropriate variables to use in biodiversity models is crucial for determining the fate of biodiversity under global change.
Supplementary Materials
The following are available online at http://www.mdpi.com/2072-4292/10/5/698/s1, Table S1: Data of almost 18,000 trees belonging to 452 native species.
Author Contributions
Robin Pouteau conceived the idea, collected and analyzed the data and drafted the paper. Thomas W. Gillespie and Philippe Birnbaum contributed to the writing.
Acknowledgments
We thank the four anonymous referees for their careful reading of the manuscript and their many insightful comments and suggestions. This study is part of the COGEFOR project cofounded by the Direction du Développement Economique et de l’Environnement (DDEE) of the North Province of New Caledonia (convention 16C180), the Centre de coopération Internationale en Recherche Agronomique pour le Développement (CIRAD) and the Institut Agronomique néo-Calédonien (IAC).
Conflicts of Interest
The authors declare no conflict of interest.
Appendix A
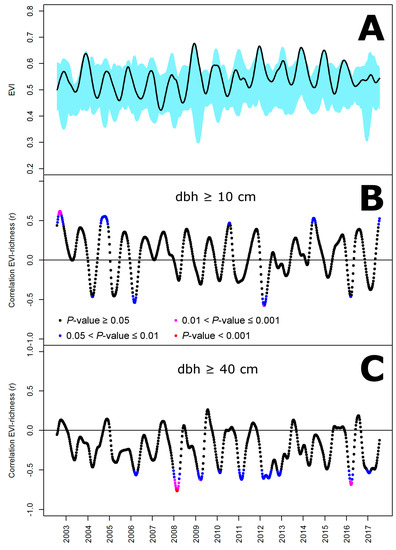
Figure A1.
Temporal variation of MODIS EVI in 19 one-hectare plots in New Caledonia (A) and in its ability to predict species richness of trees with a diameter at breast height (dbh) above 10 cm (B) and 40 cm (C). (A) The black line represents the mean and the blue shaded area the interval within which plot values are found; (B,C) the color set refers to four significance levels of correlation tests.

Table A1.
Correlation between basic descriptive statistics extracted from a 15-year time series of MODIS EVI images produced on six-day intervals and species richness (SR) measured in 19 one hectare plots in New Caledonia. Asterisks refer to the level of significance: 0.05 < p < 0.01 (*); 0.01 < p < 0.001 (**); p < 0.001 (***).
| Statistics | SR (dbh ≥ 10 cm) | SR (dbh ≥ 40 cm) |
|---|---|---|
| Full time-series statistics | ||
| 15-year mean | 0.07 | −0.37 |
| 15-year median | 0.10 | −0.35 |
| 15-year variance | −0.51 * | 0.11 |
| 15-year 1st quartile | 0.16 | −0.36 |
| 15-year 3rd quartile | −0.01 | −0.29 |
| 15-year minimum | 0.19 | −0.51 * |
| 15-year maximum | −0.21 | −0.26 |
| Seasonal statistics | ||
| Wet season mean | −0.15 | −0.50 * |
| Wet season median | −0.13 | −0.48 |
| Wet season variance | −0.25 | 0.37 |
| 15-year 1st quartile | −0.17 | −0.58 * |
| 15-year 3rd quartile | −0.17 | −0.40 |
| Wet season minimum | 0.17 | −0.53 * |
| Wet season maximum | −0.23 | −0.28 |
| Dry season mean | 0.29 | −0.15 |
| Dry season median | 0.29 | −0.15 |
| Dry season variance | −0.46 * | −0.00 |
| 15-year 1st quartile | 0.34 | −0.16 |
| 15-year 3rd quartile | 0.24 | −0.10 |
| Dry season minimum | 0.38 | −0.31 |
| Dry season maximum | 0.06 | −0.17 |
| Annual statistics | ||
| 2002 mean | 0.52 * | 0.09 |
| 2002 variance | 0.04 | 0.25 |
| 2003 mean | 0.25 | −0.21 |
| 2003 variance | −0.13 | 0.09 |
| 2004 mean | 0.18 | −0.25 |
| 2004 variance | −0.59 * | 0.02 |
| 2005 mean | −0.04 | −0.36 |
| 2005 variance | −0.19 | 0.05 |
| 2006 mean | −0.04 | −0.41 |
| 2006 variance | −0.35 | 0.07 |
| 2007 mean | 0.16 | −0.24 |
| 2007 variance | −0.01 | −0.19 |
| 2008 mean | 0.08 | −0.46 |
| 2008 variance | 0.08 | 0.19 |
| 2009 mean | −0.07 | −0.37 |
| 2009 variance | −0.04 | 0.55 * |
| 2010 mean | −0.05 | −0.31 |
| 2010 variance | −0.56 * | −0.23 |
| 2011 mean | 0.07 | −0.27 |
| 2011 variance | −0.56 * | −0.10 |
| 2012 mean | −0.24 | −0.66 ** |
| 2012 variance | 0.16 | 0.19 |
| 2013 mean | 0.03 | −0.23 |
| 2013 variance | −0.39 | −0.10 |
| 2014 mean | 0.24 | −0.27 |
| 2014 variance | −0.36 | −0.11 |
| 2015 mean | 0.09 | −0.17 |
| 2015 variance | −0.00 | 0.14 |
| 2016 mean | 0.01 | −0.41 |
| 2016 variance | −0.31 | 0.34 |
| 2017 mean | −0.13 | −0.55 * |
| 2017 variance | −0.47 * | 0.11 |
| Monthly statistics | ||
| January mean | −0.16 | −0.49 |
| January variance | −0.12 | 0.47 |
| February mean | −0.32 | −0.59 * |
| February variance | 0.02 | 0.40 |
| March mean | −0.37 | −0.61 * |
| March variance | 0.16 | 0.39 |
| April mean | −0.20 | −0.52 * |
| April variance | 0.10 | 0.20 |
| May mean | 0.03 | −0.33 |
| May variance | −0.00 | 0.03 |
| June mean | 0.23 | −0.13 |
| June variance | −0.23 | 0.14 |
| July mean | 0.35 | −0.05 |
| July variance | −0.44 | 0.44 |
| August mean | 0.37 | −0.06 |
| August variance | −0.39 | 0.19 |
| September mean | 0.35 | −0.09 |
| September variance | −0.51 * | −0.09 |
| October mean | 0.27 | −0.17 |
| October variance | −0.54 * | −0.06 |
| November mean | 0.16 | −0.24 |
| November variance | −0.35 | 0.28 |
| December mean | −0.00 | −0.36 |
| December variance | −0.22 | 0.48 |
References
- Bradley, B.A.; Fleishman, E. Can remote sensing of land cover improve species distribution modelling? J. Biogeogr. 2008, 35, 1158–1159. [Google Scholar] [CrossRef]
- He, K.S.; Bradley, B.A.; Cord, A.F.; Rocchini, D.; Tuanmu, M.-N.; Schmidtlein, S.; Turner, W.; Wegmann, M.; Pettorelli, N. Will remote sensing shape the next generation of species distribution models? Remote Sens. Ecol. Conserv. 2015, 1, 4–18. [Google Scholar] [CrossRef]
- Pettorelli, N.; Vik, J.O.; Mysterud, A.; Gaillard, J.-M.; Tucker, C.J.; Stenseth, N.C. Using satellite-derived NDVI to assess ecological responses to environmental change. Trends Ecol. Evol. 2005, 20, 503–510. [Google Scholar] [CrossRef] [PubMed]
- Liang, J.; Crowther, T.W.; Picard, N.; Wiser, S.; Zhou, M.; Alberti, G.; Schulze, E.; McGuire, A.D.; Bozzato, F.; Pretzsch, H.; et al. Positive biodiversity-productivity relationship predominant in global forests. Science 2016, 354. [Google Scholar] [CrossRef] [PubMed]
- Waring, R.H.; Coops, N.C.; Ohmann, J.L.; Sarr, D.A. Interpreting woody plant richness from seasonal ratios of photosynthesis. Ecology 2002, 83, 2964–2970. [Google Scholar] [CrossRef]
- Fairbanks, D.H.K.; McGwire, K.C. Patterns of floristic richness in vegetation communities of California: Regional scale analysis with multi-temporal NDVI. Glob. Ecol. Biogeogr. 2004, 13, 221–235. [Google Scholar] [CrossRef]
- Gillespie, T.W. Predicting woody-plant species richness in tropical dry forests: A case study from South Florida. Ecol. Appl. 2005, 15, 27–37. [Google Scholar] [CrossRef]
- Feeley, K.J.; Gillespie, T.W.; Terborgh, J.W. The utility of spectral indices from Landsat ETM+ for measuring the structure and composition of tropical dry forests. Biotropica 2005, 37, 508–519. [Google Scholar] [CrossRef]
- Cayuela, L.; Benayas, J.M.; Justel, A.; Salas-Rey, J. Modelling tree diversity in a highly fragmented tropical montane landscape. Glob. Ecol. Biogeogr. 2006, 15, 602–613. [Google Scholar] [CrossRef]
- Gillespie, T.W.; Saatchi, S.; Pau, S.; Bohlman, S.; Giorgi, A.P.; Lewis, S. Towards quantifying tree species richness in tropical forests. Int. J. Remote Sens. 2008, 30, 1629–1634. [Google Scholar] [CrossRef]
- Wolf, J.A.; Fricker, G.A.; Meyer, V.; Hubbell, S.P.; Gillespie, T.W.; Saatchi, S.S. Plant species richness is associated with canopy height and topography in a Neotropical forest. Remote Sens. 2012, 4, 4010–4021. [Google Scholar] [CrossRef]
- Fricker, G.A.; Wolfe, G.; Saatchi, S.S.; Gillespie, T.W. Predicting variation of tree species richness in tropical forest landscapes using high spatial resolution remote sensing. Ecol. Appl. 2015, 25, 1776–1789. [Google Scholar] [CrossRef] [PubMed]
- Wang, R.; Gamon, J.A.; Montgomery, R.A.; Townsend, P.A.; Zygielbaum, A.I.; Bitan, K.; Tilman, D.; Cavender-Bares, J. Seasonal variation in the NDVI-species richness relationship in a prairie grassland experiment (Cedar Creek). Remote Sens. 2016, 8, 128. [Google Scholar] [CrossRef]
- Cumming, S.G.; Stralberg, D.; Lefevre, K.L.; Sólymos, P.; Bayne, E.M.; Fang, S.; Fontaine, T.; Mazerolle, D.; Schmiegelow, F.K.A.; Song, S.J. Climate and vegetation hierarchically structure patterns of songbird distribution in the Canadian boreal region. Ecography 2014, 37, 137–151. [Google Scholar] [CrossRef]
- Youngentob, K.N.; Yoon, H.J.; Stein, J.; Lindenmayer, B.D.; Held, A.A. Where the wild things are: Using remotely sensed forest productivity to assess arboreal marsupial species richness and abundance. Divers. Distrib. 2015, 21, 977–990. [Google Scholar] [CrossRef]
- Pettorelli, N.; Ryan, S.; Mueller, T.; Bunnefeld, N.; Jedrzejewska, B.; Lima, M.; Kausrud, K. The Normalized Difference Vegetation Index (NDVI): Unforeseen successes in animal ecology. Clim. Res. 2011, 46, 15–27. [Google Scholar] [CrossRef]
- Pau, S.; Gillespie, T.W.; Wolkovich, E.M. Dissecting NDVI-species richness relationships in Hawaiian dry forests. J. Biogeogr. 2012, 39, 1678–1686. [Google Scholar] [CrossRef]
- Šímová, I.; Storch, D. The enigma of terrestrial primary productivity: Measurements, models, scales and the diversity-productivity relationship. Ecography 2017, 40, 239–252. [Google Scholar] [CrossRef]
- Pouteau, R.; Bayle, E.; Blanchard, E.; Birnbaum, P.; Cassan, J.-J.; Hequet, V.; Ibanez, T.; Vandrot, H. Accounting for the indirect area effect in stacked species distribution models to map species richness in a montane biodiversity hotspot. Divers. Distrib. 2015, 21, 1929–1938. [Google Scholar] [CrossRef]
- Météo-France. Atlas Climatique de la Nouvelle-Calédonie; Météo-France: Noumea, New Caledonia, 2007. [Google Scholar]
- Jaffré, T. The relationship between ecological diversity and floristic diversity in New Caledonia. Biodivers. Lett. 1993, 1, 82–87. [Google Scholar] [CrossRef]
- Jaffré, T.; Rigault, F.; Munzinger, J. La végétation. In Atlas de la Nouvelle-Calédonie; Bonvallot, J., Gay, J.-C., Habert, E., Eds.; IRD-Congrès de la Nouvelle-Calédonie: Marseille, France, 2012; pp. 73–76. [Google Scholar]
- Morat, P.; Jaffré, T.; Tronchet, F.; Munzinger, J.; Pillon, Y.; Veillon, J.-M.; Chapolin, M. The taxonomic database ‘FLORICAL’ and characteristics of the indigenous flora of New Caledonia. Adansonia 2012, 3, 177–219. [Google Scholar]
- Jaffré, T.; Veillon, J.-M. Étude floristique et structurale de deux forêts denses humides sur roches ultrabasiques en Nouvelle-Calédonie. Adansonia 1991, 4, 243–273. [Google Scholar]
- Jaffré, T.; Veillon, J.-M. Structural and floristic characteristics of a rain forest on schist in New Caledonia: A comparison with an ultramafic rain forest. Adansonia 1995, 17, 201–226. [Google Scholar]
- Ibanez, T.; Blanchard, E.; Hequet, V.; Keppel, G.; Laidlaw, M.; Pouteau, R.; Vandrot, H.; Birnbaum, P. High endemism and stem density distinguish New Caledonian from other high-diversity rainforests in the Southwest Pacific. Ann. Bot. 2017, 121, 25–35. [Google Scholar] [CrossRef] [PubMed]
- Ter Steege, H.; Pitman, N.C.A.; Sabatier, D.; Baraloto, C.; Salomão, R.P.; Guevara, J.E.; Phillips, O.L.; Castilho, C.V.; Magnusson, W.E.; Molino, J.-F.; et al. Hyperdominance in the Amazonian tree flora. Science 2013, 342, 1243092. [Google Scholar] [CrossRef] [PubMed]
- University of Natural Resources and Life Sciences, Vienna. Available online: http://ivfl-info.boku.ac.at/ (accessed on 4 January 2018).
- Vuolo, F.; Mattiuzzi, M.; Klisch, A.; Atzberger, C. Data service platform for MODIS Vegetation Indices time series processing at BOKU Vienna: Current status and future perspectives. Proc. SPIE 2012, 8538. [Google Scholar] [CrossRef]
- Wiens, J.J. The causes of species richness patterns across space, time, and clades and the role of “ecological limits”. Q. Rev. Biol. 2011, 86, 75–96. [Google Scholar] [CrossRef] [PubMed]
- Marks, C.O.; Muller-Landau, H.C.; Tilman, D. Tree diversity, tree height and environmental harshness in eastern and western North America. Ecol. Lett. 2016, 19, 743–751. [Google Scholar] [CrossRef] [PubMed]
- Marks, C.O.; Muller-Landau, H.C.; Tilman, D. Tree diversity in relation to maximum tree height: Evidence for the harshness hypothesis of species diversity gradients. Ecol. Lett. 2017, 20, 398–399. [Google Scholar] [CrossRef] [PubMed]
- Slik, J.W.; Paoli, G.; McGuire, K.; Amaral, I.; Barroso, J.; Bastian, M.; Blanc, L.; Bongers, F.; Boundja, P.; Clark, C.; et al. Large trees drive forest aboveground biomass variation in moist lowland forests across the tropics. Glob. Ecol. Biogeogr. 2013, 22, 1261–1271. [Google Scholar] [CrossRef]
- Bastin, J.F.; Barbier, N.; Réjou-Méchain, M.; Fayolle, A.; Gourlet-Fleury, S.; Maniatis, D.; de Haulleville, T.; Baya, F.; Beeckman, H.; Beina, D.; et al. Seeing Central African forests through their largest trees. Sci. Rep. 2015, 5, 13156. [Google Scholar] [CrossRef] [PubMed]
- Blanchard, E.; Birnbaum, P.; Ibanez, T.; Boutreux, T.; Antin, C.; Ploton, P.; Vincent, G.; Pouteau, R.; Vandrot, H.; Hequet, V.; et al. Contrasted allometries between stem diameter, crown area and tree height in five tropical biogeographic areas. Trees Struct. Fonct. 2016, 6, 1953–1968. [Google Scholar] [CrossRef]
© 2018 by the authors. Licensee MDPI, Basel, Switzerland. This article is an open access article distributed under the terms and conditions of the Creative Commons Attribution (CC BY) license (http://creativecommons.org/licenses/by/4.0/).