Abstract
The characteristics of aerosol optical depth (AOD) over the Tibetan Plateau (TP) were analyzed using 8-year (from January 2007 to December 2014) Cloud-Aerosol LiDAR and Infrared Pathfinder Satellite Observation (CALIPSO) level 2 aerosol layer products. Firstly, the overall feature of AOD over the Tibetan Plateau was investigated, including the seasonal diversities of AODS (the sum of AODs from all aerosol layers), and A (the amounts of aerosol layers). Then we deeply studied the characteristics of AOD within the lowest aerosol layer over TP, including the seasonal variations of AOD1 (The AOD of the first aerosol layer), HB1 (the height of the first aerosol layer base), TL1 (the thickness of the first aerosol layer) and PAOD1 (The AOD proportion of the first aerosol layer). The AODS was generally low (<0.2) in the main body of TP in each season. The value of A was lower (~1–1.5) than other areas around the TP, indicating that the main body of TP generally had only one aerosol layer. The HTT (height of the highest aerosol layer top) was higher in spring (~8 km) and summer (~9 km), and lower in fall (~6.5 km) and winter (~6.5 km). The PAOD1 was high in each season except spring. The high PAOD1 values (>0.9) indicated that the aerosols were mainly concentrated in the lowest layer in summer, fall, and winter in the main body of TP. In spring, the PAOD1 value was relatively low (~0.7–0.85) and the distribution exhibited obvious differences between the southern (~0.85) and the northern (~0.75) TP, which appeared to be consistent with A. Most of the aerosol loads in summer were concentrated in the lowest aerosol layer with high aerosol loads. Most of the aerosol loads in fall and winter were also concentrated in the lowest aerosol layer, but with low aerosol loads.
1. Introduction
Located in eastern Eurasia, the Tibetan Plateau (TP), with an average elevation of about 4000 m, is the highest region on earth [1,2]. There are several large, high mountain ranges including the Himalayas, the Transhimalaya, the Nyainqentanglha, and the Kunlun located in the TP [3]. Due to special topographic features, the surface can absorb a large amount of solar radiation, which can affect the surface heat flux of water [4,5]. The thermal forcing of the TP can greatly influence and control the east and the south Asian monsoon systems [6,7]. Several deserts, including the Taklamakan Desert in the north, the Gobi Desert in the east, and Middle Eastern desert in the southwest, surround the TP. The high dust aerosol content in the desert is likely to affect the aerosol composition and concentrations of the TP [8,9]. The Indo-Gangetic plain, located to the south of the TP, has high aerosol content and also influences the aerosols of the TP [2]. Therefore, studying the optical and distribution characteristics of aerosols over TP is important [10,11,12,13,14].
The TP plays a central role in climatology of the region, and it was chosen as an ideal location to monitor the long-term changes of the global environment and evaluate various impacts caused by human activities [12,13,14]. Experiments on the aerosol characteristics of the TP have been conducted in several previous studies [8,14,15,16,17,18,19], for example, the Taklamakan and Gobi deserts become the main sources of dust aerosols which can be transported to the surrounding areas in spring, including the TP [20,21,22]. Under the action of prevailing southwest winds, these aerosols sometimes can also be transmitted to the central TP from South Asia [23]. The Himalayas prevent most black carbon (BC) aerosols from entering into the TP, but the Yarlung Tsangpo River valley can act as a channel for transmission of pollutants [24]. In addition, a natural north-south divide of aerosols exists in the middle of the TP [25,26,27,28]. During the monsoon season, the southern and northern regions of the TP are controlled by different climate systems resulting in variations in the characteristics of aerosols over the north and south TP [25,26,27]. The main aerosol types were dust and polluted dust over the TP [28,29,30,31], and the peripheral natural and local sources of aerosol emissions over TP could greatly impact the regional atmospheric environment [9,29,30], for example, in South Asia, the atmospheric brown cloud phenomenon results from burning biomass and fossil fuel consumption can lead to environmental degradation [32,33]. In TP, carbon aerosols can reduce the amount of surface solar radiation, heating the atmosphere and reducing the hydrologic cycle [32]. Nevertheless, previous aerosol work in TP was mainly focused on dust-derived elements and their deposition fluxes, more investigation is needed to understand the aerosol compositions and its effects on regional and global climate. Therefore, it is still very important to study the aerosol characteristics and related environmental effects in TP [10,11,12].
Despite their low content, aerosols over TP have unique characteristics [34]. In this study, the seasonal characteristics and vertical distributions of aerosol layers over TP were studied based on the Cloud-Aerosol LiDAR and Infrared Pathfinder Satellite Observation (CALIPSO). The accurate optical thickness, layer amount, the height of the lowest aerosol layer base, and the height of the highest aerosol layer top were first investigated using the CALIPSO data across eight years. It was found that only one aerosol layer existed in the main body of the TP. Subsequently, we also studied the lowest aerosol layer aerosol optical depth over the TP, specifically its proportion and the layer thickness.
2. Materials and Methods
CALIPSO satellite was launched on 28 April 2006, with the sun-synchronous orbit. The orbit altitude is 705 km and the orbital inclination is 98°. CALIPSO is part of the “A-train” constellation with a repeat cycle of 16 days. CALIPSO passes the equator at 13:30 LST (local solar time) [35]. It provides high-resolution vertical profile information for aerosols and clouds which can be used to study the effect of aerosols and clouds on climate forcing as well as direct and indirect cloud feedback [35,36]. The Cloud-Aerosol LiDAR with Orthogonal Polarization (CALIOP), a type of double wavelength orthogonal polarization elastic backscatter LiDAR, is carried on CALIPSO. Its working wavelengths are 532 nm and 1064 nm, and the 532 nm wavelength is equipped with a polarized channel. The repetition frequency of the laser is 20.16 HZ and the Q-switch can provide ~20 ns pulse width. The original laser wavelength is 1064 nm with pulse energy of 220 mJ. After doubling the frequency, the laser can generate a wavelength of 532 nm with pulse energy of 110mJ. A beam expander device was installed to reduce the divergence angle of the laser beam. CALIOP can work continuously on a global scale to provide high temporal-spatial resolution information on clouds and aerosols [37].
CALIPSO level 1 product includes LiDAR calibration data and level 2 data was obtained using automatic layer detection algorithm based on level 1 data [35,36]. The level 2 aerosol layer products had a horizontal resolution of 5 km and described the spatial position and the classification information of aerosol layers such as aerosol subclasses [31,38]. Level 2 aerosol profile products mainly provided the vertical profile information for backscatter, polarization, and extinction coefficients of the feature layer [37]. In this study, level 2 aerosol layer products were used. The level 2 products can store up to eight layers of information for aerosols and 10 layers of information for clouds.
Parameters used in this study include layer amounts, the height of the lowest aerosol layer base, the height of the highest aerosol layer top and the aerosol layer optical depth at each aerosol layer at 532 nm with an uncertainty less than 3, because the aerosol optical depth less than 3 was precise and can meet the requirements in this study [37,38]. Additionally, the null values and values less than or equal to zero were eliminated. The data were resampled to 1° × 1° grid. We used the dataset on cloud-free conditions (30%) for day and night, and the resampling method was the mean values of each valid sample in the 1 × 1 deg grid. The study area was located at 25°~45°N and 65°~110°E. This area covered the entire TP, the Tarim basin, and the northern Indian peninsula (Figure 1). We defined four seasons: spring (March to May), summer (June to August), fall (September to November), and winter (December to February). The detailed description of used parameter is shown in Table 1.
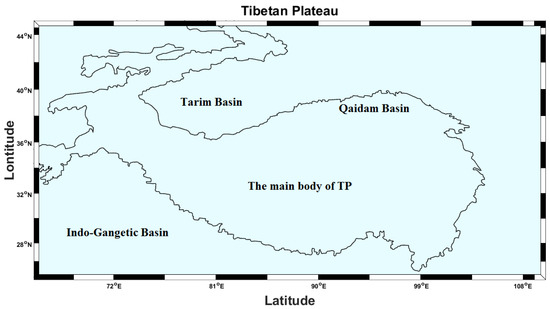
Figure 1.
The geographical locations of the TP.

Table 1.
Description of used parameters in this study.
3. Results and Discussion
3.1. The Overall Characteristics of Aerosol Optical Depth (AOD) and Aerosol Layers over the TP
Figure 2 showed the seasonal maps of the samples for TP in this study. It can be observed that the sample values were low in the main body of TP for each season. The sample values were high in Indian Ganges River basin, especially in fall and winter. The sample values of the Tarim and Qaidam basins were medium and become larger in fall and winter. The sample values might be related to our quality control rules, regional terrain, and environment, which can lead to low sample values in the main body of the TP [14,39]. Figure 3 showed the seasonal maps of the AODS over the TP. In this study, the AODS represented the sum of AOD for each aerosol layer excluding the molecular part. Figure 3 showed seasonal variations in AODS observed in the study area. The seasonal mean AODS for the ~8-year study period were 0.25, 0.28, 0.21, and 0.19 in spring, summer, fall, and winter, respectively for the whole TP. These results were consistent with those of Xu et al. [22]. In the study by Xu et al. [22], the AOD values for spring and summer were less than ~0.50 over the TP, and the AOD values for fall and winter were less than 0.25, which were a little higher than our results [28]. This difference could be attributed to the equipment differences between CALIPSO and a multi-angle imaging spectrometer. In our study, the AOD was high over the Tarim basin in spring (~0.65) and summer (~0.55) and became low in fall and winter, but still higher than the main body of the TP. The underlying surface cover type was the Taklamakan Desert and the main aerosol type in the Tarim basin was dust. High dust aerosol load can lead to high AOD, especially during sandstorm outbreaks in the spring season [28].
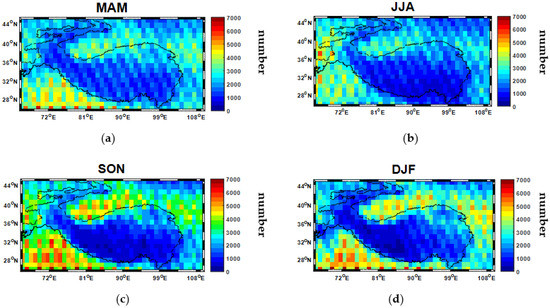
Figure 2.
Seasonal maps of the samples over TP in this study: (a) spring, (b) summer, (c) fall, and (d) winter over the eight-year data period from 2007 to 2014 (The map is gridded at 1°). Each pixel represented the number of valid samples in the study.
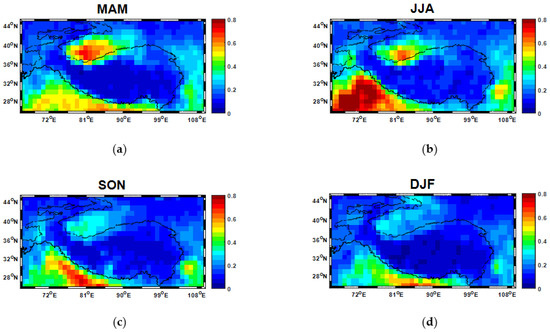
Figure 3.
Seasonal maps of the AODS over the TP: (a) spring, (b) summer, (c) fall, and (d) winter over the eight-year data period from January 2007 to December 2014 (The AOD is at 532 nm and the map is gridded at 1°).
In Figure 3, the AODS was generally low (<0.2) in the main body of the TP in each season, because fewer aerosol loads existed there and the TP acted as a natural barrier leading to low aerosol load in the main body of the TP [13,40]. The highest AODS was found over the Qaidam basin in spring (~0.3) and summer (~0.3), which was consistent with the results of Xu et al. [22]. Frequent dust storms existed in the Tarim basin in spring and dust aerosols could be transported to the main body of TP, especially to the Qaidam basin, thus contributing to the high AODS [28,34,41,42,43]. Fossil fuel combustion and industrial emissions also existed over the Qaidam basin and could potentially contribute to the high aerosol loads [42,44,45]. High AODS values observed over the entire northern Indian peninsula in spring (~0.55) and particularly in summer (~0.75). In fall (~0.65) and winter (~0.5), high AODS mainly existed on the southern edge of the TP. Unlike the Tarim basin, the aerosol types in the Indo-Gangetic plain were mainly polluted continental aerosols, smoke, and polluted dust [28,34,46]. In the northern Indo-Gangetic plain, the occurrence of polluted dust was higher than the dust [28,40]. Additionally, higher smoke aerosols also occurred in the adjacent regions of the southern edge of the TP [13,28]. High local anthropogenic emissions leading to high aerosol loading in the Indo-Gangetic plain are also likely to contribute to the high AODS [2,28,47].
In Figure 4, each pixel represents the seasonal mean of aerosol layers amounts at 1° spatial resolution during the ~8 years of the study period. In the main body of the TP, the values of aerosol layer amounts were lower (~1–1.5) than other areas around the TP for each season. This could be due to the low aerosol loadings in the high-altitude terrain. Additionally, this phenomenon also indicated that the main body of the TP had only one layer of aerosol for most of the time. The value of aerosol layer amounts in spring was ~1.8, which was higher than other seasons due to frequent dust events in the Tarim basin [28]. As a result, the dust could climb over the northern edge of TP to arrive at the main body of the TP due to atmospheric circulation, thus leading to a high value of aerosol layer amounts in the Tarim basin and the main body of TP. Northern areas of the TP could be used as an alternative channel for aerosols transport from the troposphere to the stratosphere in spring and dust aerosols can be transported easily from the northern edge to the main body of TP in spring and summer. On the other hand, polluted dust also existed over the TP and had a relatively larger thickness in spring and summer, which could have contributed to the relatively high aerosol layer amounts over the main body of TP in spring [28].
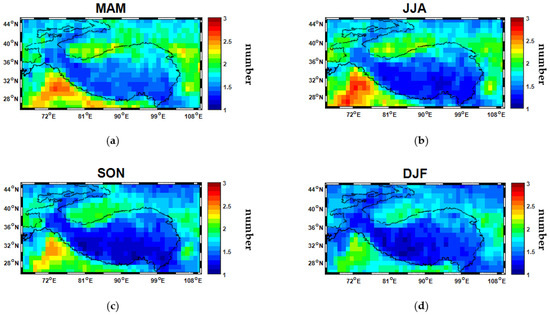
Figure 4.
Seasonal maps of the aerosol layer amounts over the TP: (a) spring, (b) summer, (c) fall, and (d) winter over the eight-year data period January 2007 to December 2014 (The AOD is at 532 nm and the map is gridded at 1°).
The value of aerosol layer amounts in the Tarim basin (~2.2) and the Indian Ganges River basin (~2.8) were high in spring and summer and relatively low (~2) in fall and winter. The Tarim basin and the Indian Ganges River basin, unlike the main body of the TP, did not have a plateau-like mountainous terrain, the aerosol load was much higher than that in TP. Additionally, the atmospheric convection is known to be stronger in warm seasons, leading to higher occurrences of atmospheric stratification, especially in the monsoon season [48,49]. In summer, more smoke existed over the Indo-Gangetic plain and the less-soluble aerosol composition can be lifted up to the troposphere [47]. Subsequently, this part of aerosol can be transported away from the Indo-Gangetic plain under the action of strong upper tropospheric winds. This phenomenon could also contribute to high aerosol layer amounts in the Indian Ganges River basin in summer.
It was interesting to note that the aerosol layer amounts in the main body of TP were slightly higher in spring than in summer, however, as shown in Figure 3, AODS was a little lower in spring than in summer. This phenomenon revealed that the mean AOD in each aerosol layer was a little lower in spring than in summer. In summary, AODS and the aerosol layer amounts in the TP were higher in spring and summer than in the other seasons, which was mainly due to seasonal variations of atmospheric conditions and characteristics of the regional aerosol distributions [28].
Figure 5 showed the seasonal variations of the height of the lowest aerosol layer base over TP; it was much higher in the main body of TP than that in the surrounding regions in each season, due to the high-altitude terrain in the TP. The height of the lowest aerosol layer base in the main body of the TP was high in summer (~7 km) and relatively low in fall (~5.5 km) and winter (~5.5 km). The height of the lowest aerosol layer base in Indian Ganges River basin was below 2 km in each season and did not show obvious seasonal variations. The height of the lowest aerosol layer base showed slight seasonal variations in the Tarim basin, where the summer (~3 km) and spring (~2.5 km) had higher values than fall (~1 km) and winter (~1 km). The height of the lowest aerosol layer base was ~4 km in spring, summer, and fall over the Qaidam basin and were a little low in winter (~3.5 km), thus exhibiting values lower than those over the main body of the TP.
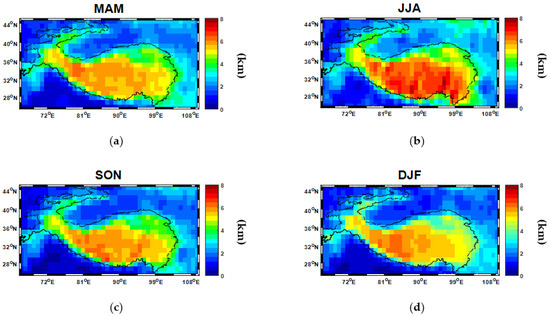
Figure 5.
Seasonal maps of the lowest aerosol layer base over the TP: (a) spring, (b) summer, (c) fall, and (d) winter over the eight-year data period from January 2007 to December 2014 (The AOD is at 532 nm and the map is gridded at 1°).
Figure 6 showed the heights of the highest aerosol layer top in each season, which was ~8 km, ~9 km, ~6.5 km, and ~6.5 km in spring, summer, fall, and winter, respectively. The highest values were observed in summer, followed by spring. Xu et al. [22] reported dust as the main aerosol type in the main body of the TP. The dust layer had the greatest depth in spring (11–12 km), followed by summer (8–10 km). The dust and polluted dust layers had more thickness in spring and summer and had relatively low altitudes (less than 8 km) over the TP in fall and winter, which was consistent with our results [28]. Frequent dust activities and low precipitation can be conducive to transport of aerosols to the upper troposphere and the stratosphere over the northern TP [13,28]. Vernier et al. [50] showed that the non-volcanic aerosol layers can reach up to the altitude of 13~18 km over the TP during the Asian summer monsoon [50,51]. On the other hand, smoke from local emissions had high loads in the central TP in summer and smoke layers could also suspend at an altitude of 12 km over the TP in summer, likely contributing to the high value of aerosol layer height in summer [28].
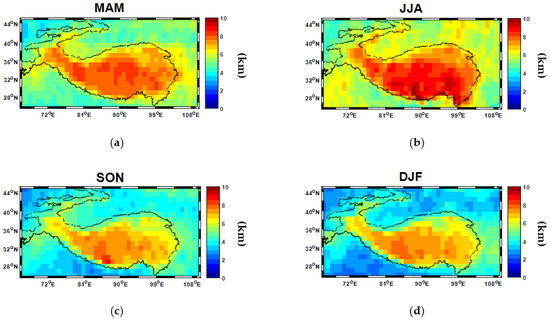
Figure 6.
Seasonal maps of the highest aerosol layer top over the TP: (a) spring, (b) summer, (c) fall, and (d) winter over the eight-year data period from January 2007 to December 2014 (The AOD is at 532 nm and the map is gridded at 1°).
The height of the highest aerosol layer top had strong season variations in the Tarim basin, where the summer (~6.5 km) and spring (~6 km) had higher values than fall (~4 km) and winter (~3.5 km). Xu et al. [22] showed that dust can be generated and lofted over Tarim basin and be extended to 6–8 km over the northern Indian peninsula in spring. In the Indian Ganges River basin, the summer (~6 km) and spring (~5 km) had higher values than fall (~3.5 km) and winter (~2.5 km). The height of the highest aerosol layer top had strong seasonal variations in the Indian Ganges River basin. This was different from the results of the height of the lowest aerosol layer base in Figure 5, which did not have obvious seasonal variations in the Indian Ganges River basin. Xu et al. [22] reported that the aerosol types in the Indian Ganges River basin were mainly smoke and polluted dust. The height of the smoke aerosol layer in summer in the Indian Ganges River basin was higher than in other seasons, while the height of the polluted dust layer was less than 4 km in fall and winter [28].
3.2. The Characteristics of the Lowest Aerosol Layer over the TP
Since the main body of the TP has only one layer of aerosol for most time and the aerosol near the earth’s surface in the planetary boundary layer has important effects on radiative forcing and human health [52,53,54]. It was valuable and interesting to study the characteristics of the lowest aerosol layer over the TP. Figure 7 showed the seasonal maps of the lowest aerosol layer AOD (AOD1) over the TP. The AOD1 also showed certain seasonal variations, which was similar with the AODS as shown in Figure 3. The AOD1 values were lower than the AODS. In the main body of the TP, the AOD1 was generally low (<0.1) across the four seasons. This could be attributed to the low aerosol loading on-plateau, especially in the lowest layer. The AOD1 was also high over the Tarim basin in spring (~0.5) and summer (~0.4) and became lower in fall (~0.2) and winter (~0.2). The lowest layer, mainly in the Taklamakan Desert, was near the underlying surface over the Tarim basin. High dust aerosol loading in the lowest layer can lead to high AOD1, especially in spring [28,46]. As shown in Figure 7, the AOD1 had high value in Indo-Gangetic plain in each season, especially in summer (~0.5). In fall (~0.4) and winter (~0.4), high AOD1 mainly existed in the southern edge of TP. Additionally, high aerosol loading, including polluted continental aerosols, smoke, and polluted dust, existed in Indo-Gangetic plain. The higher occurrence of smoke existed in the southern edge of adjacent areas of TP. High aerosol loading in the Indo-Gangetic plain in the lowest aerosol layer could have contributed to the higher AOD1 in this case [2,28,47].
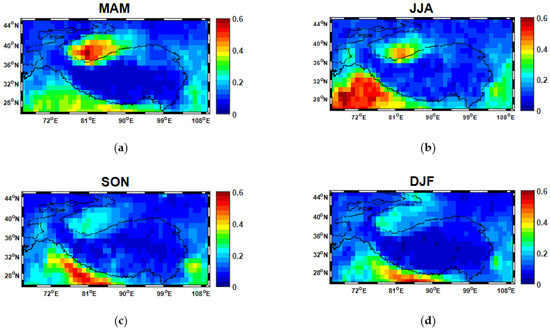
Figure 7.
Seasonal maps of the lowest aerosol layer AOD (AOD1) over the TP: (a) spring, (b) summer, (c) fall, and (d) winter over the eight-year data period from January 2007 to December 2014 (The AOD is at 532 nm and the map is gridded at 1°).
Figure 8 showed the seasonal maps of AOD proportion of the lowest aerosol layer (PAOD1) over TP. In the main body of TP, the PAOD1 value was generally high in each season excepted spring. The high proportion value (>0.9) indicated that the aerosols were mainly concentrated in the lowest layer in summer, fall, and winter. In spring, the proportion value was relatively low (~0.7–0.85) and the distribution exhibited obvious differences between the southern and northern TP. The northern TP had low values (~0.75) and the southern TP had high values (~0.85). The demarcation runs from east to west across the TP and it was located at 33~35°N in the center of the TP, which appeared to be in accord with the aerosol layer amounts in Figure 4. This phenomenon revealed that the northern TP had more aerosol layers than the southern TP in spring. In the northern TP, above the lowest aerosol layer, higher aerosol layers existed, which could have led to the low PAOD1. The northern part of TP had lower altitudes and the southern edge of TP had relatively high altitudes [28,40]. Therefore, it was easy for aerosols to be transported to the northern TP than the southern TP. Additionally, the Kunlun and Tanggula mountains in the main body of TP acted as natural barriers which resist aerosols when they pass across the northern edge. Subsequently, it was difficult for the aerosols to spread further southward. Consequently, the aerosol loading is higher in the northern TP than the southern TP [55,56]. On the other hand, the northern and southern Asian monsoonal system meet around 34~35°N in central TP [28]. The atmospheric circulation was in favor of dust entrainment, vertical lofting, and horizontal transport [8]. The vertical atmospheric circulations and strong updrafts can promote the aerosols to separate into more layers in the northern TP in spring. To summarize, the terrain and wind can lead to the high aerosol layer amounts in the northern TP and can result in the low PAOD1 in the northern TP in spring. In summer, the aerosol load was also relatively high (shown in Figure 3) in the main body of the TP. The high PAOD1 meant that most aerosol loads concentrated in the lowest aerosol layer in summer with high aerosol loads. On the contrary, in fall and winter, the aerosol load was low (shown in Figure 3) in the main body of TP, but the PAOD1 were still high in both seasons. This phenomenon showed that most aerosol loads also concentrated in the lowest aerosol layer in fall and winter.
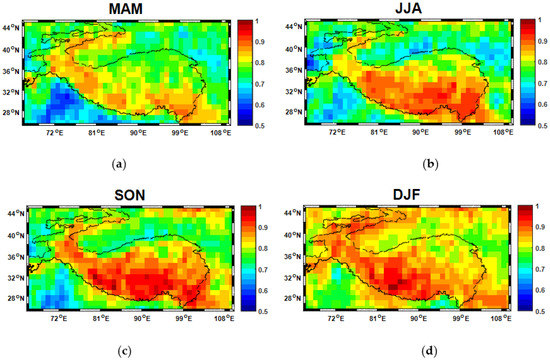
Figure 8.
Seasonal maps of the proportion of the lowest aerosol layer AOD (PAOD1) over the TP: (a) spring, (b) summer, (c) fall, and (d) winter over the eight-year data period from January 2007 to December 2014 (The AOD is at 532 nm and the map is gridded at 1°).
In the Tarim and the Indian Ganges River basins, the PAOD1 were primarily lower than those in the main body of the TP for all seasons, except winter. The aerosol layer amounts were high in the off-plateau terrains, which lead to the low PAOD1. On the other hand, the PAOD1 was lower in the Indian Ganges River basin in comparison with Tarim basin in each season. This meant that the aerosol layer amounts were higher in the Indian Ganges River basin than those in the Tarim basin in each season as shown in Figure 3. In winter, high PAOD1 values existed not only in the main body of TP but also in the Tarim and the Indian Ganges River basins. PAOD1 in the main body of TP was almost equal to that in the Tarim basin in winter. This revealed that the aerosol layer amounts were low and the whole aerosols almost existed in the lowest layer with low aerosol loads (Figure 7), leading high PAOD1 in winter.
Additionally, it was necessary to further calculate the lowest aerosol layer thickness (TL1) over the TP considering the lowest aerosol layer base (Figure 5). Figure 9 shows the maps of TL1 over the TP in each season. The TL1 revealed certain seasonal variations in the study region. The TL1 were lower in the main body of the TP than that in the Tarim and the Indian Ganges River basins for all seasons except winter. The TL1 in the main body of the TB was ~1.5 km, ~1.5 km, ~1 km, and ~1 km in spring, summer, fall, and winter, respectively. The TL1 were higher in both Indian Ganges River basin (~2.3 km) and the Tarim basin (~1.8 km) in summer, followed by spring. This could be due to higher aerosol loadings and strong atmospheric convection in spring and summer. In the lowest aerosol layer, aerosols can be easily lifted in the upper atmosphere in summer and spring. The TL1 values were all below 1 km and had no obvious difference in winter for the whole study area, which might be due to the cold climate there.
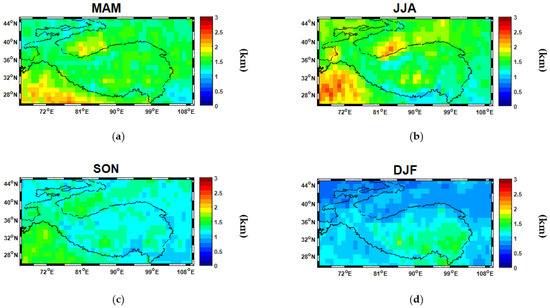
Figure 9.
Seasonal maps of the lowest aerosol layer thickness (TL1) over the TP: (a) spring, (b) summer, (c) fall, and (d) winter over the eight-year data period from January 2007 to December 2014 (The AOD is at 532 nm and the map is gridded at 1°).
3.3. The Correlations of Aerosol Properties over the TP
To better understand the spatiotemporal characteristics of aerosols over TP, the correlations between the aerosol parameters in different seasons and sub-regions were investigated. In this part, we divided the TP into three sub-regions: TB (Tarim Basin), MTP (The main body of TP) and IGB (Indo-Gangetic Basin) to conduct the analysis. Figure 10 showed the correlation between AOD1 and TL1, generally, there were logarithmic positive correlations in above three sub-regions, indicating that the thicker the TL1, the greater the AOD1 values. This was consistent with our routine understanding, because AOD is the integral of the extinction coefficient at distance, the thicker the TL1, the larger the integral distance, and then the greater the AOD values.
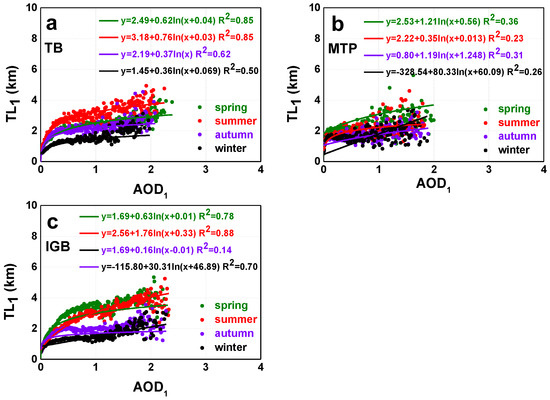
Figure 10.
The correlations between AOD1 and the lowest aerosol layer thickness (TL1) over TP. (a) is for TB, (b) for MTP, and (c) for IGB.
In the TB sub-region, the correlation coefficients were larger in spring (0.85) and summer (0.85), and relative smaller in fall (0.62) and winter (0.50). The reason may be the higher aerosol loadings in spring and summer (Figure 3), resulting in larger AOD1 values (Figure 7); the TL1 also increased with the dust aerosols, leading to a good positive correlation between TL1 and AOD1. In the IGB sub-region, there was a similar situation as that in TB, the R2 of spring (0.78) and summer (0.88) was larger, and it was smaller in fall (0.14) and winter (0.70), because IGB was also polluted by the aerosol loadings (including polluted continental aerosols, smoke in the lowest aerosol layer) in summer and spring (Figure 7). In MTP region, the correlation coefficients were less than 0.4 in each season, which may due to the relatively lower aerosol loadings in this area (Figure 3 and Figure 7).
In addition, the maximum TL1 in winter (Figure 10) was much smaller (~2 km) than that in other three seasons (Figure 9), and the AOD1 was also low in winter over TB. However, the AOD1 in winter was larger than the other three seasons (with the same TL1 values), which indicated that the concentration of the extinction coefficient profile of aerosol in winter was greater than that in other three seasons. In the same way, the concentration of the extinction coefficient of TB in summer was lower than that of winter, but the maximum TL1 is larger (~5 km) in summer, which resulted in a larger AOD1 in summer over TB. This phenomenon was also evident in IGB, the maximum TL1 in spring and summer were larger (~5 km), while the TL1 in fall and winter were smaller (3 km). However, AOD1 in fall and winter was larger than that in other three seasons, indicating that the concentration of the extinction coefficient profile of aerosols in fall and winter was greater than that of the other three seasons.
Figure 11 showed the correlations between A and PAOD1, there were significant logarithmic negative correlation (R2 were larger than 0.97) in TB, MTP and IGB regions, indicating that the higher the A, the lower the PAOD1. It was easy to understand that the more aerosol layers, the greater the AODS. Since PAOD1 was defined as the quotient of AOD1 and AODS, the larger the denominator AODS, the smaller the PAOD1. There were obvious positive linear correlations between A and HHT in all sub-regions of TP (Figure 12), R2 values reached 0.8 in each season for above regions. This revealed that the more aerosol layers (A), the higher the HHT, because the more aerosol layers (A), the thicker of the aerosol layer in the whole atmosphere, resulting in the higher HHT.
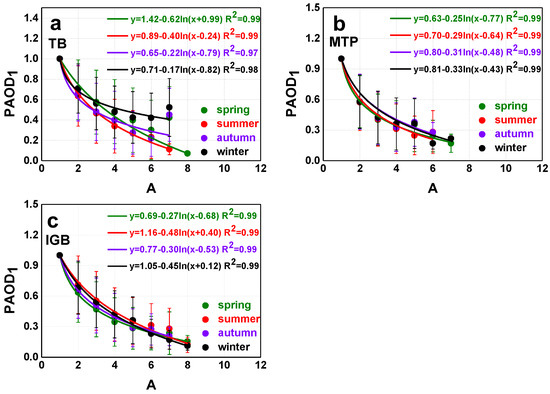
Figure 11.
The correlations between PAOD1 and layer amount (A) over TP. (a) is for TB, (b) for MTP, and (c) for IGB.
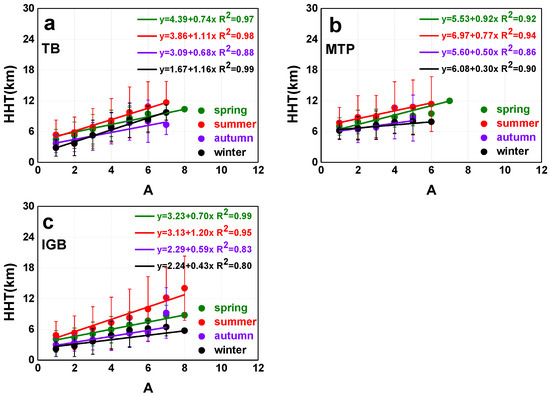
Figure 12.
The correlations between height of the highest aerosol layer top (HHT) and layer amount (A) over TP. (a) is for TB, (b) for MTP, and (c) for IGB.
4. Conclusions
The optical and distribution characteristics of the aerosol layers, especially the lowest aerosol layer over TP were studied in this study. The seasonal variations of the aerosol all layers AOD, layer amounts, the height of the lowest aerosol layer base, the height of the highest aerosol layer top, the lowest aerosol layer AOD, and its proportion and the lowest layer thickness were investigated over the TP using eight years CALIPSO level 2 layer product.
The AODS was generally low (<0.2) in each season in the main body of TP because fewer aerosols existed on-plateau than off-plateau. The value of aerosol layer amounts showed that the main body of the TP mostly had only one aerosol layer for most of the time. Aerosol particles existed at lower altitudes in fall and winter than spring and summer. This could be due to strong atmospheric convection in spring and summer and dust aerosols can be easily lifted in the upper atmosphere in summer and spring.
In the main body of TP, the AOD1 was generally low (<0.1) in the four seasons. This was due to low aerosol loading on-plateau, especially in the lowest layer. The PAOD1 was generally high in all seasons, except spring. The high PAOD1 value (>0.9) indicated that the aerosols were mainly concentrated in the lowest layer in summer, fall, and winter. In spring, the PAOD1 value was relatively low (~0.7–0.85) and the distribution exhibited obvious differences between the southern and northern TP. The demarcation runs east to west across the TP and it was located at 33–35°N in the middle of the plateau, which appeared to be in accord with the aerosol layer amounts. In summer, most of the aerosol loads concentrated in the lowest aerosol layer with high aerosol loads. In fall and winter, most of the aerosol loads concentrated in the lowest aerosol layer with low aerosol loads. The correlations between the aerosol parameters in different seasons indicated that the AOD1 had positive and negative correlations with the lowest aerosol layer thickness and layer amount, respectively, and the highest aerosol layer top was positively related with the layer amount over different sub-regions of TP. In all, our above study could provide certain scientific understandings on aerosol optical properties over the TP.
Author Contributions
M.Z. and L.W. conceived and designed the experiments; M.Z. performed the experiments; Z.Z. and G.G. analyzed the data; M.B. contributed analysis tools; M.Z. wrote the paper; L.W. and M.B. revised the manuscript.
Funding
This research was funded by the key scientific research project of Henan institutions of higher learning grant number [18B170007], the Nanyang Normal University scientific research project (Program No. ZX2017014), the Nanyang science and technology project (2017JCQY017), National Natural Science Foundation of China (No. 41601044), the Special Fund for Basic Scientific Research of Central Colleges, China University of Geosciences, Wuhan (No.CUG15063, CUGL170401 and CUGCJ1704), and the Natural Science Foundation for Distinguished Young Scholars of Hubei Province of China (No. 2016CFA051).
Acknowledgments
We thank the NASA Langley Research Center for providing the experimental data.
Conflicts of Interest
The authors declare no conflict of interest.
References
- Tapponnier, P.; Zhiqin, X.; Roger, F.; Meyer, B.; Arnaud, N.; Wittlinger, G.; Jingsui, Y. Oblique stepwise rise and growth of the Tibet Plateau. Science 2001, 294, 1671–1677. [Google Scholar] [CrossRef] [PubMed]
- Gautam, R.; Hsu, N.C.; Tsay, S.C.; Lau, K.M.; Holben, B.; Bell, S.; Smirnov, A.; Li, C.; Hansell, R.; Ji, Q. Accumulation of aerosols over the Indo-Gangetic plains and southern slopes of the Himalayas: Distribution, properties and radiative effects during the 2009 pre-monsoon season. Atmos. Chem. Phys. Discuss. 2011, 11, 12841–12863. [Google Scholar] [CrossRef]
- Zhisheng, A.; Kutzbach, J.E.; Prell, W.L.; Porter, S.C. Evolution of Asian monsoons and phased uplift of the Himalaya-Tibetan plateau since late Miocene times. Nature 2001, 411, 62–66. [Google Scholar] [CrossRef] [PubMed]
- Ma, Y.; Han, C.; Zhong, L.; Wang, B.; Zhu, Z.; Wang, Y.; Zhang, L.; Meng, C.; Xu, C.; Amatya, P.M. Using MODIS and AVHRR data to determine regional surface heating field and heat flux distributions over the heterogeneous landscape of the Tibetan plateau. Theor. Appl. Climatol. 2014, 117, 643–652. [Google Scholar] [CrossRef]
- Ma, Y.; Zhu, Z.; Zhong, L.; Wang, B.; Han, C.; Wang, Z.; Wang, Y.; Lu, L.; Amatya, P.M.; Ma, W. Combining MODIS, AVHRR and in situ data for evapotranspiration estimation over heterogeneous landscape of the Tibetan plateau. Atmos. Chem. Phys. 2014, 14, 1507–1515. [Google Scholar] [CrossRef]
- Wu, G.; Liu, Y.; Zhang, Q.; Duan, A.; Wang, T.; Wan, R.; Liu, X.; Li, W.; Wang, Z.; Liang, X. The Influence of Mechanical and Thermal Forcing by the Tibetan Plateau on Asian Climate; Chinese Academy of Sciences: Beijing, China, 2007; pp. 205–208. [Google Scholar]
- Wu, G.; Liu, Y.; Bian, H.; Bao, Q.; Duan, A.; Jin, F.F. Thermal controls on the Asian summer monsoon. Sci. Rep. 2012, 2, 404. [Google Scholar] [CrossRef] [PubMed]
- Ge, J.M.; Huang, J.P.; Xu, C.P.; Qi, Y.L.; Liu, H.Y. Characteristics of Taklimakan dust emission and distribution: A satellite and reanalysis field perspective. J. Geophys. Res. Atmos. 2015, 119, 11772–711783. [Google Scholar] [CrossRef]
- Cong, Z.; Kang, S.; Kawamura, K.; Liu, B.; Wan, X.; Wang, Z.; Gao, S.; Fu, P. Carbonaceous aerosols on the south edge of the Tibetan Plateau: Concentrations, seasonality and sources. Atmos. Chem. Phys. 2015, 14, 1573–1584. [Google Scholar] [CrossRef]
- King, M.D.; Kaufman, Y.J.; Tanré, D.; Nakajima, T. Remote sensing of tropospheric aerosols from space: Past, present, and future. Bull. Am. Meteorol. Soc. 1999, 80, 2229–2260. [Google Scholar] [CrossRef]
- Kaufman, Y.J.; Tanré, D.; Boucher, O. A satellite view of aerosols in the climate system. Nature 2002, 419, 215–223. [Google Scholar] [CrossRef] [PubMed]
- Li, Z.; Li, C.; Chen, H.; Tsay, S.C.; Holben, B.; Huang, J.; Li, B.; Maring, H.; Qian, Y.; Shi, G. East Asian studies of tropospheric aerosols and their impact on regional climate (east-airs): An overview. J. Geophys. Res. Atmos. 2011, 116, 220–237. [Google Scholar]
- Liu, B.; Cong, Z.; Wang, Y.; Xin, J.; Wan, X.; Pan, Y.; Liu, Z.; Wang, Y.; Zhang, G.; Wang, Z. Background aerosol over the Himalayas and Tibetan Plateau: Observed characteristics of aerosol mass loading. Atmos. Chem. Phys. 2017, 17, 449–463. [Google Scholar] [CrossRef]
- Kang, S. Atmospheric aerosol elements over the inland Tibetan Plateau: Concentration, seasonality, and transport. Aerosol Air Qual. Res. 2016, 16, 789–800. [Google Scholar] [CrossRef]
- Xu, B.Q.; Cao, J.J.; Hansen, J.; Yao, T.D.; Joswia, D.R.; Wang, N.L.; Wu, G.J.; Mo, W.; Zhao, H.B.; Wei, Y. Black soot and the survival of Tibetan glaciers. Proc. Natl. Acad. Sci. USA 2009, 106, 22114–22118. [Google Scholar] [CrossRef] [PubMed]
- Ma, Y.; Zhong, L.; Wang, B.; Ma, W.; Chen, X.; Li, M. Determination of land surface heat fluxes over heterogeneous landscape of the Tibetan Plateau by using the MODIS and in situ data. Atmos. Chem. Phys. 2011, 11, 19617–19638. [Google Scholar] [CrossRef]
- Lin, C.; Yang, K.; Qin, J.; Fu, R. Observed coherent trends of surface and upper-air wind speed over China since 1960. J. Clim. 2013, 26, 2891–2903. [Google Scholar] [CrossRef]
- Yao, T.; Thompson, L.; Yang, W.; Yu, W.; Yang, G.; Guo, X.; Yang, X.; Duan, K.; Zhao, H.; Xu, B. Different glacier status with atmospheric circulations in Tibetan Plateau and surroundings. Nat. Clim. Chang. 2012, 2, 663–667. [Google Scholar] [CrossRef]
- Sheng, J.; Wang, X.; Gong, P.; Joswiak, D.R.; Tian, L.; Yao, T.; Jones, K.C. Monsoon-driven transport of organochlorine pesticides and polychlorinated biphenyls to the Tibetan plateau: Three year atmospheric monitoring study. Environ. Sci. Technol. 2013, 47, 3199–3208. [Google Scholar] [CrossRef] [PubMed]
- Liu, Z.; Liu, D.; Huang, J.; Vaughan, M. Airborne dust distributions over the Tibetan plateau and surrounding areas derived from the first year of CALIPSO lidar observations. Atmos. Chem. Phys. 2008, 8, 5045–5060. [Google Scholar] [CrossRef]
- Bucci, S.; Cagnazzo, C.; Cairo, F.; Liberto, L.D.; Fierli, F. Aerosol variability and atmospheric transport in the Himalayan region from CALIOP 2007–2010 observations. Atmos. Chem. Phys. Discuss. 2013, 13, 15271–15299. [Google Scholar] [CrossRef]
- Xu, C.; Ma, Y.; You, C.; Zhu, Z. The regional distribution characteristics of aerosol optical depth over the Tibetan Plateau. Atmos. Chem. Phys. 2015, 15, 15683–15710. [Google Scholar] [CrossRef]
- Kuhlmann, J.; Quaas, J. How can aerosols affect the Asian summer monsoon? Assessment during three consecutive pre-monsoon seasons from CALIPSO satellite data. Atmos. Chem. Phys. 2010, 10, 4673–4688. [Google Scholar] [CrossRef]
- Liu, D.; Wang, Z.; Liu, Z.; Winker, D.; Trepte, C. A height resolved global view of dust aerosols from the first year CALIPSO lidar measurements. J. Geophys. Res. Atmos. 2008, 113, 280–288. [Google Scholar] [CrossRef]
- Huang, J.; Minnis, P.; Yi, Y.; Tang, Q.; Wang, X.; Hu, Y.; Liu, Z.; Ayers, K.; Trepte, C.; Winker, D. Summer dust aerosols detected from CALIPSO over the Tibetan Plateau. Geophys. Res. Lett. 2007, 34, 529–538. [Google Scholar] [CrossRef]
- Xia, X.; Wang, P.; Wang, Y.; Li, Z.; Xin, J.; Liu, J.; Chen, H. Aerosol optical depth over the Tibetan plateau and its relation to aerosols over the Taklimakan Desert. Geophys. Res. Lett. 2008, 35, 96–106. [Google Scholar] [CrossRef]
- Ramanathan, V.; Crutzen, P.J.; Kiehl, J.T.; Rosenfeld, D. Aerosols, climate, and the hydrological cycle. Science 2001, 294, 2119–2124. [Google Scholar] [CrossRef] [PubMed]
- Ramanathan, V.; Chung, C.; Kim, D.; Bettge, T.; Buja, L.; Kiehl, J.T.; Washington, W.M.; Fu, Q.; Sikka, D.R.; Wild, M. Atmospheric brown clouds: Impacts on South Asian climate and hydrological cycle. Proc. Natl. Acad. Sci. USA 2005, 102, 5326–5333. [Google Scholar] [CrossRef] [PubMed]
- Xia, X.; Zong, X.; Cong, Z.; Chen, H.; Kang, S.; Wang, P. Baseline continental aerosol over the central Tibetan Plateau and a case study of aerosol transport from South Asia. Atmos. Environ. 2011, 45, 7370–7378. [Google Scholar] [CrossRef]
- Cao, J.; Tie, X.; Xu, B.; Zhao, Z.; Zhu, C.; Li, G.; Liu, S. Measuring and modeling black carbon (BC) contamination in these Tibetan Plateau. J. Atmos. Chem. 2010, 67, 45. [Google Scholar] [CrossRef]
- Yao, T.; Masson-Delmotte, V.; Gao, J.; Yu, W.; Yang, X.; Risi, C.; Sturm, C.; Werner, M.; Zhao, H.; He, Y. A review of climatic controls on δ18o in precipitation over the Tibetan Plateau: Observations and simulations. Rev. Geophys. 2013, 51, 525–548. [Google Scholar] [CrossRef]
- Tian, L.; Yao, T.; Macclune, K.; White, J.W.C.; Schilla, A.; Vaughn, B.; Vachon, R.; Ichiyanagi, K. Stable isotopic variations in West China: A consideration of moisture sources. J. Geophys. Res. Atmos. 2007, 112, 185–194. [Google Scholar] [CrossRef]
- Wu, G.; Zhang, C.; Xu, B.; Mao, R.; Joswiak, D.; Wang, N.; Yao, T. Atmospheric dust from a shallow ice core from Tanggula: Implications for drought in the central Tibetan Plateau over the past 155 years. Quat. Sci. Rev. 2013, 59, 57–66. [Google Scholar] [CrossRef]
- Zhang, R.; Wang, H.; Qian, Y.; Rasch, P.J.; Easter, R.C.; Ma, P.L.; Singh, B.; Huang, J. Quantifying sources, transport, deposition, and radiative forcing of black carbon over the Himalayas and Tibetan Plateau. Atmos. Chem. Phys. 2015, 15, 77–121. [Google Scholar] [CrossRef]
- Winker, D.M.; Pelon, J.; Coakley, J.A., Jr.; Ackerman, S.A.; Charlson, R.J.; Colarco, P.R.; Flamant, P.; Hoff, R.M.; Kittaka, C. The CALIPSO mission: A global 3D view of aerosols and clouds. Bull. Am. Meteorol. Soc. 2010, 91, 1211–1229. [Google Scholar] [CrossRef]
- Winker, D.M.; Hunt, W.H.; Mcgill, M.J. Initial performance assessment of CALIOP. Geophys. Res. Lett. 2007, 34, 228–262. [Google Scholar] [CrossRef]
- Winker, D.M.; Tackett, J.L.; Getzewich, B.J.; Liu, Z.; Vaughan, M.A.; Rogers, R.R. The global 3-d distribution of tropospheric aerosols as characterized by CALIOP. Atmos. Chem. Phys. 2013, 13, 3345–3361. [Google Scholar] [CrossRef]
- Omar, A.H.; Winker, D.M.; Kittaka, C.; Vaughan, M.A.; Liu, Z.; Hu, Y.; Trepte, C.R.; Rogers, R.R.; Ferrare, R.A.; Lee, K.P. The CALIPSO automated aerosol classification and Lidar Ratio selection algorithm. J. Atmos. Ocean. Technol. 2009, 26, 1994–2014. [Google Scholar] [CrossRef]
- Chen, S.; Fu, S.; Zhuang, L. Temporal and spatial distribution characteristics of atmospheric aerosols in the Tibetan Plateau. Environ. Prot. Technol. 2016. Available online: http://www.en.cnki.com.cn/Article_en/CJFDTOTAL-GZHB201605007.htm (accessed on 30 April 2018).
- Li, C.; Bosch, C.; Kang, S.; Andersson, A.; Chen, P.; Zhang, Q.; Cong, Z.; Bing, C.; Qin, D.; Gustafsson, Ö. Sources of black carbon to the Himalayan–Tibetan Plateau glaciers. Nat. Commun. 2016, 7, 12574. [Google Scholar] [CrossRef] [PubMed]
- Zhang, X.Y.; Gong, S.L.; Shen, Z.X.; Mei, F.M.; Xi, X.X.; Liu, L.C.; Zhou, Z.J.; Wang, D.; Wang, Y.Q.; Cheng, Y. Characterization of soil dust aerosol in China and its transport and distribution during 2001 ACE-Asia: 1. Network observations. J. Geophys. Res. Atmos. 2003, 108, 469–474. [Google Scholar] [CrossRef]
- Zhang, Q.; Streets, D.G.; Carmichael, G.R.; He, K.B.; Huo, H.; Kannari, A.; Klimont, Z.; Park, I.S.; Reddy, S.; Fu, J.S. Asian emissions in 2006 for the NASA INTEX-B mission. Atmos. Chem. Phys. 2009, 9, 5131–5153. [Google Scholar] [CrossRef]
- Wang, X.; Dong, Z.; Zhang, J.; Liu, L. Modern dust storms in China: An overview. J. Arid Environ. 2004, 58, 559–574. [Google Scholar] [CrossRef]
- Streets, D.G.; Bond, T.C.; Carmichael, G.R.; Fernandes, S.D.; He, D.; Klimont, Z.; Nelson, S.M.; Tsai, N.Y.; Wang, M.Q. An inventory of gaseous and primary aerosol emissions in Asia in the year 2000. J. Geophys. Res. Atmos. 2003, 108, 30–31. [Google Scholar] [CrossRef]
- Liu, Z.; Guan, D.; Wei, W.; Davis, S.J.; Ciais, P.; Bai, J.; Peng, S.; Zhang, Q.; Hubacek, K.; Marland, G. Reduced carbon emission estimates from fossil fuel combustion and cement production in China. Nature 2015, 524, 335–338. [Google Scholar] [CrossRef] [PubMed]
- Zhu, C.S.; Cao, J.J.; Hu, T.F.; Shen, Z.X.; Tie, X.X.; Huang, H.; Wang, Q.Y.; Huang, R.J.; Zhao, Z.Z.; Močnik, G. Spectral dependence of aerosol light absorption at an urban and a remote site over the Tibetan Plateau. Sci. Total Environ. 2017, 590–591, 14–21. [Google Scholar] [CrossRef] [PubMed]
- Dey, S.; Girolamo, L.D. A climatology of aerosol optical and microphysical properties over the Indian subcontinent from 9 years (2000&NDASH; 2008) of multiangle imaging spectroradiometer (MISR) data. J. Geophys. Res. Atmos. 2010, 115, 4447–4458. [Google Scholar]
- Fu, R.; Hu, Y.; Wright, J.S.; Jiang, J.H.; Dickinson, R.E.; Chen, M.; Filipiak, M.; Read, W.G.; Waters, J.W.; Wu, D.L. From the cover: Short circuit of water vapor and polluted air to the global stratosphere by convective transport over the Tibetan Plateau. Proc. Natl. Acad. Sci. USA 2006, 103, 5664–5669. [Google Scholar] [CrossRef] [PubMed]
- Randel, W.J.; Park, M.; Emmons, L.; Kinnison, D.; Bernath, P.; Walker, K.A.; Boone, C.; Pumphrey, H. Asian monsoon transport of pollution to the stratosphere. Science 2010, 328, 611–613. [Google Scholar] [CrossRef] [PubMed]
- Vernier, J.P.; Thomason, L.W.; Kar, J. Calipso detection of an Asian Tropopause Aerosol Layer. Geophys. Res. Lett. 2011, 38, 1451–1453. [Google Scholar] [CrossRef]
- Vernier, J.P.; Fairlie, T.D.; Natarajan, M.; Wienhold, F.G.; Bian, J.; Martinsson, B.G.; Crumeyrolle, S.; Thomason, L.W.; Bedka, K.M. Increase in upper tropospheric and lower stratospheric aerosol levels and its potential connection with Asian pollution. J. Geophys. Res. Atmos. 2015, 120, 1608–1619. [Google Scholar] [CrossRef] [PubMed]
- Zhang, W.; Guo, J.; Miao, Y.; Liu, H.; Zhang, Y.; Li, Z.; Zhai, P. Planetary boundary layer height from CALIOP compared to radiosonde over China. Atmos. Chem. Phys. 2016, 16, 1–31. [Google Scholar] [CrossRef]
- Mcgrath-Spangler, E.L.; Denning, A.S. Global seasonal variations of midday planetary boundary layer depth from CALIPSO space-borne LIDAR. J. Geophys. Res. Atmos. 2013, 118, 1226–1233. [Google Scholar] [CrossRef]
- Mcgrath-Spangler, E.L.; Denning, A.S. Estimates of North American summertime planetary boundary layer depths derived from space-borne LIDAR. J. Geophys. Res. Atmos. 2012, 117, D15101. [Google Scholar] [CrossRef]
- Gobbi, G.P.; Angelini, F.; Bonasoni, P.; Verza, G.P. Sunphotometry of the 2006–2007 aerosol optical/radiative properties at the Himalayan Nepal climate observatory—Pyramid (5079 m a.S.L.). Atmos. Chem. Phys. Discuss. 2010, 10, 1193–1220. [Google Scholar] [CrossRef]
- Xu, C.; Ma, Y.M.; Panday, A.; Cong, Z.Y.; Yang, K.; Zhu, Z.K.; Wang, J.M.; Amatya, P.M.; Zhao, L. Similarities and differences of aerosol optical properties between southern and northern sides of the Himalayas. Atmos. Chem. Phys. 2014, 14, 3133–3149. [Google Scholar] [CrossRef]
© 2018 by the authors. Licensee MDPI, Basel, Switzerland. This article is an open access article distributed under the terms and conditions of the Creative Commons Attribution (CC BY) license (http://creativecommons.org/licenses/by/4.0/).