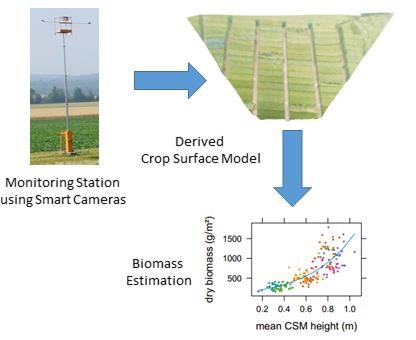
Estimating Barley Biomass with Crop Surface Models from Oblique RGB Imagery


Abstract
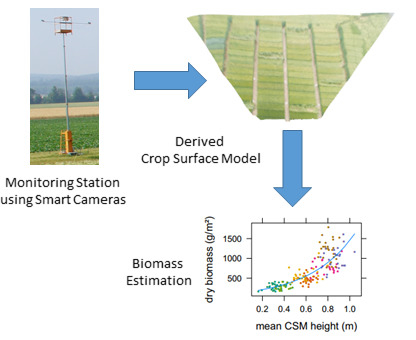
1. Introduction
2. Materials and Methods
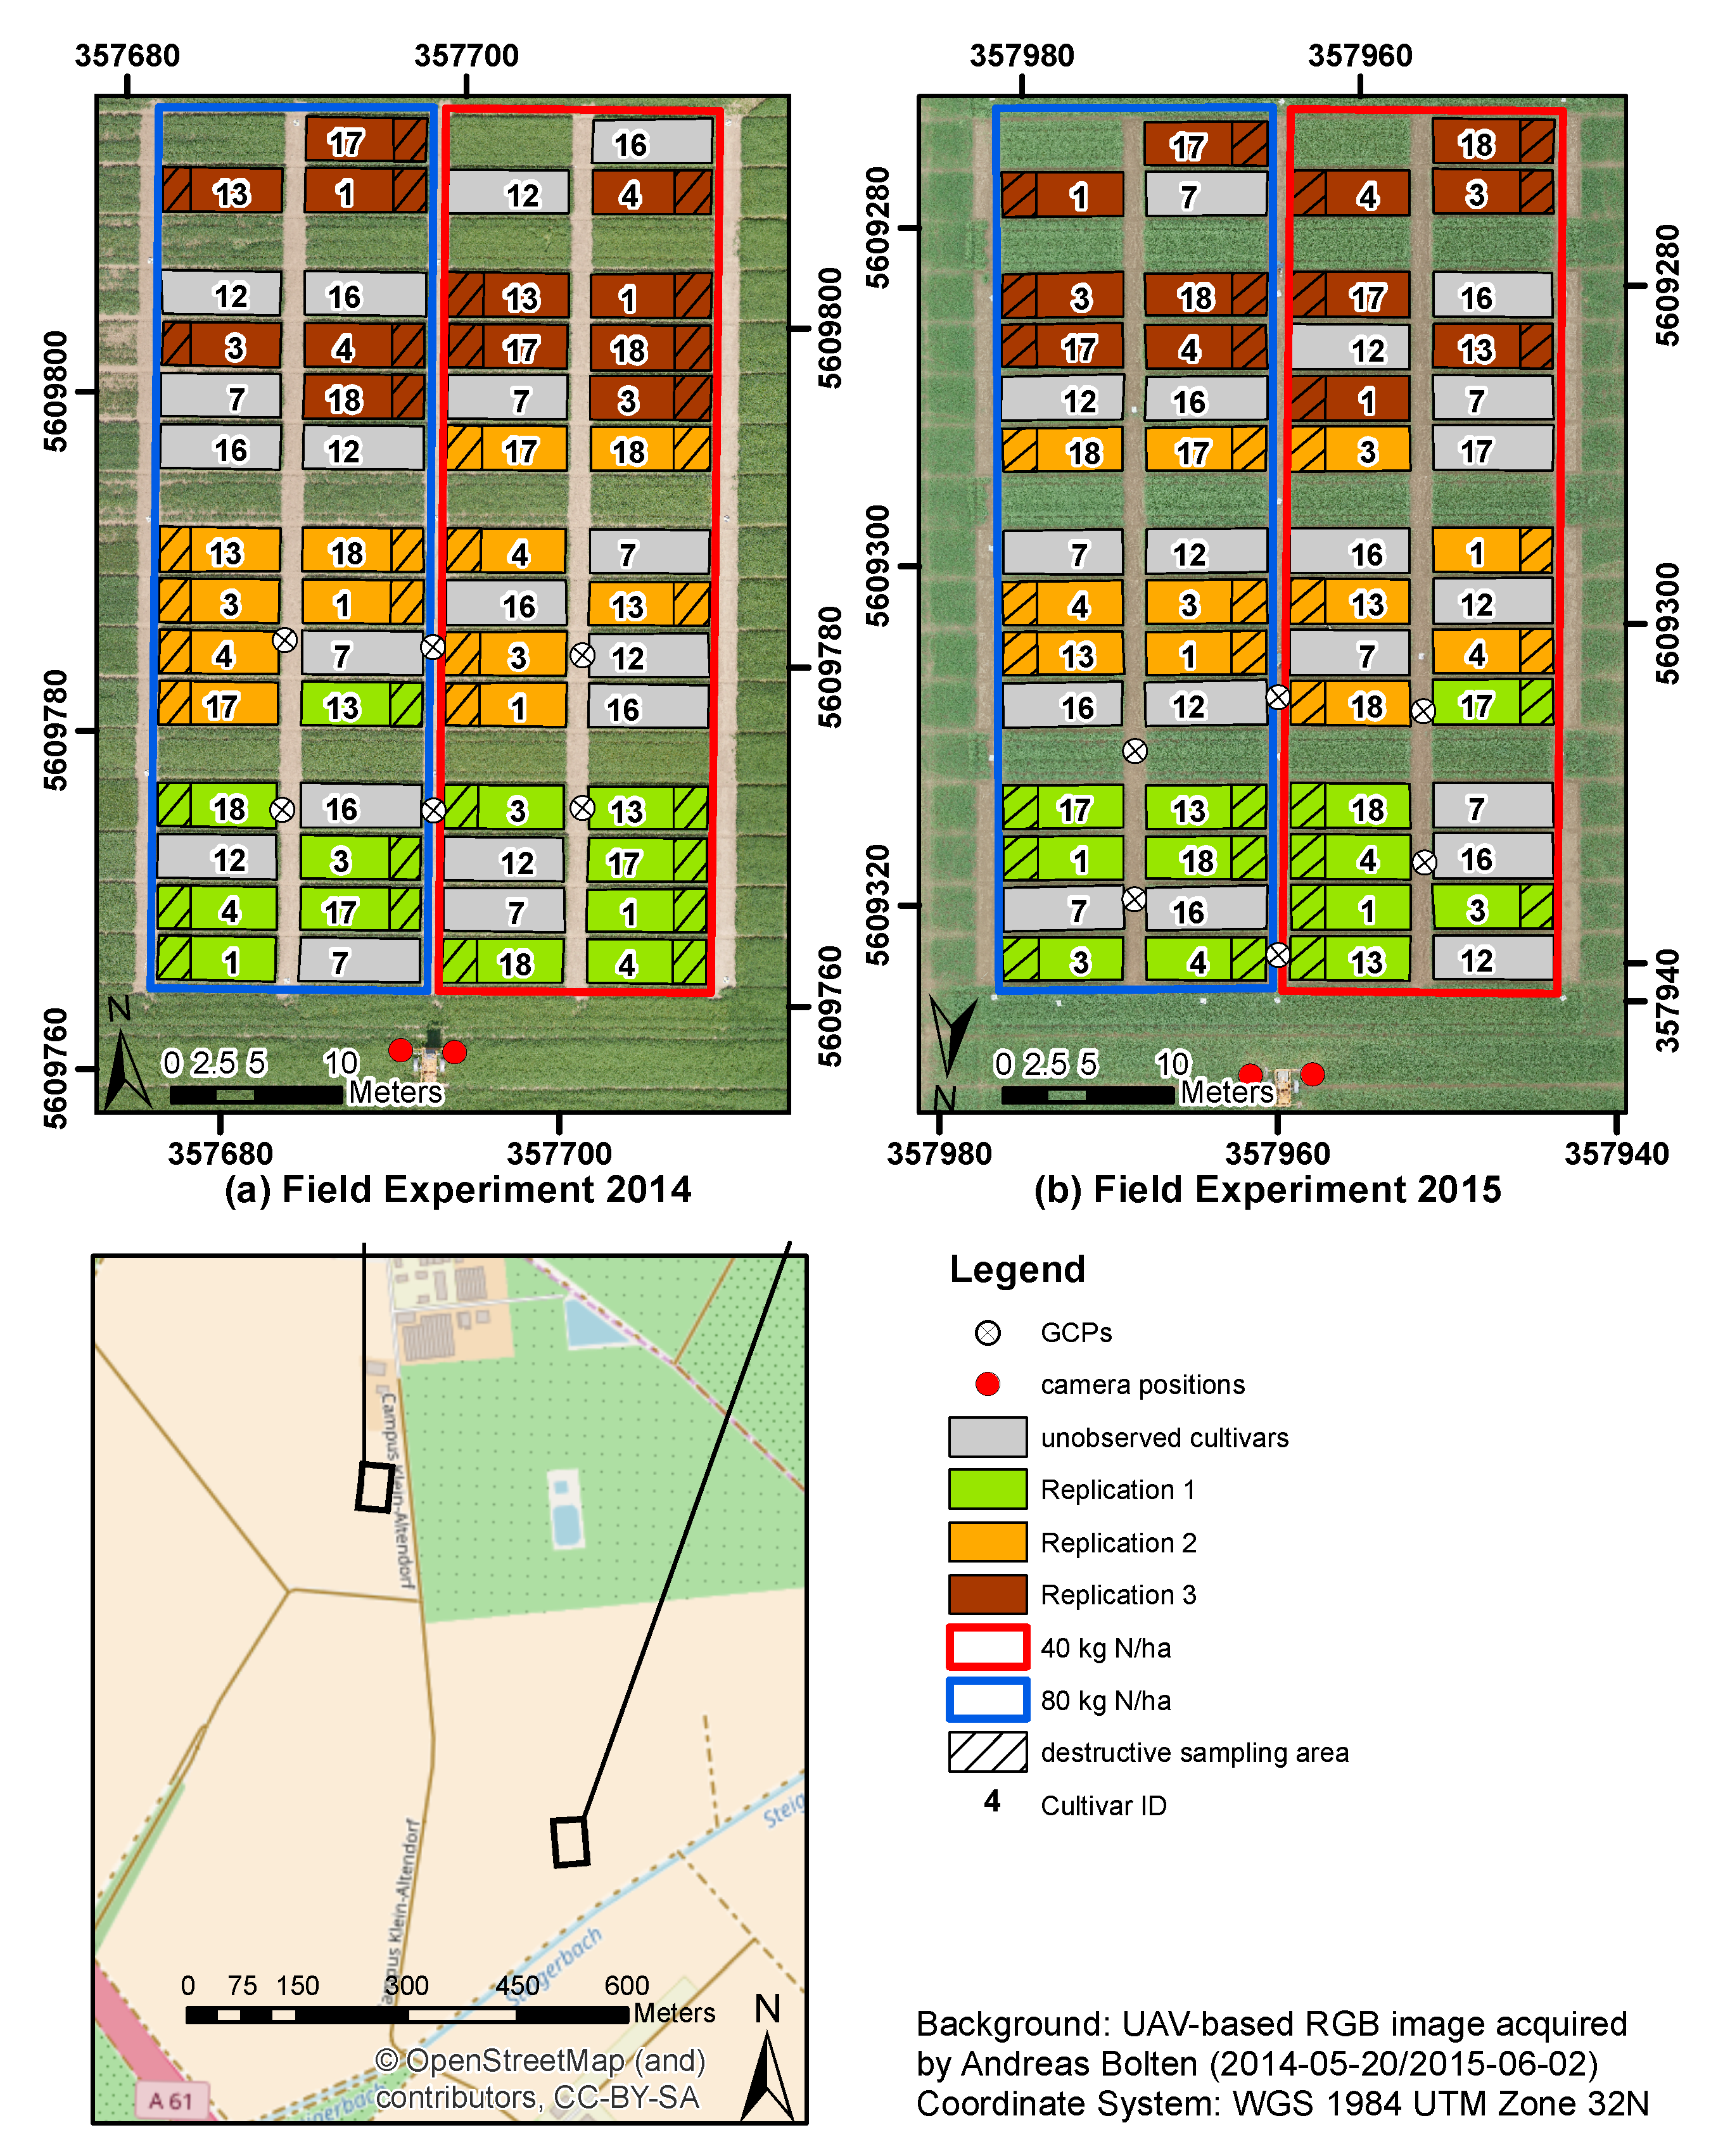
2.1. Study Site
2.2. Plant Height and Biomass Measurements
2.3. Crop Surface Models Derived Using Structure-from-Motion
2.4. Statistical Analysis
- using two replications for calibration and one for validation;
- using one year for calibration and the other for validation; and
- randomly splitting the dataset 70%/30% and using the 70% part for calibration and the 30% part for validation 10,000 times and averaging the results.
3. Results
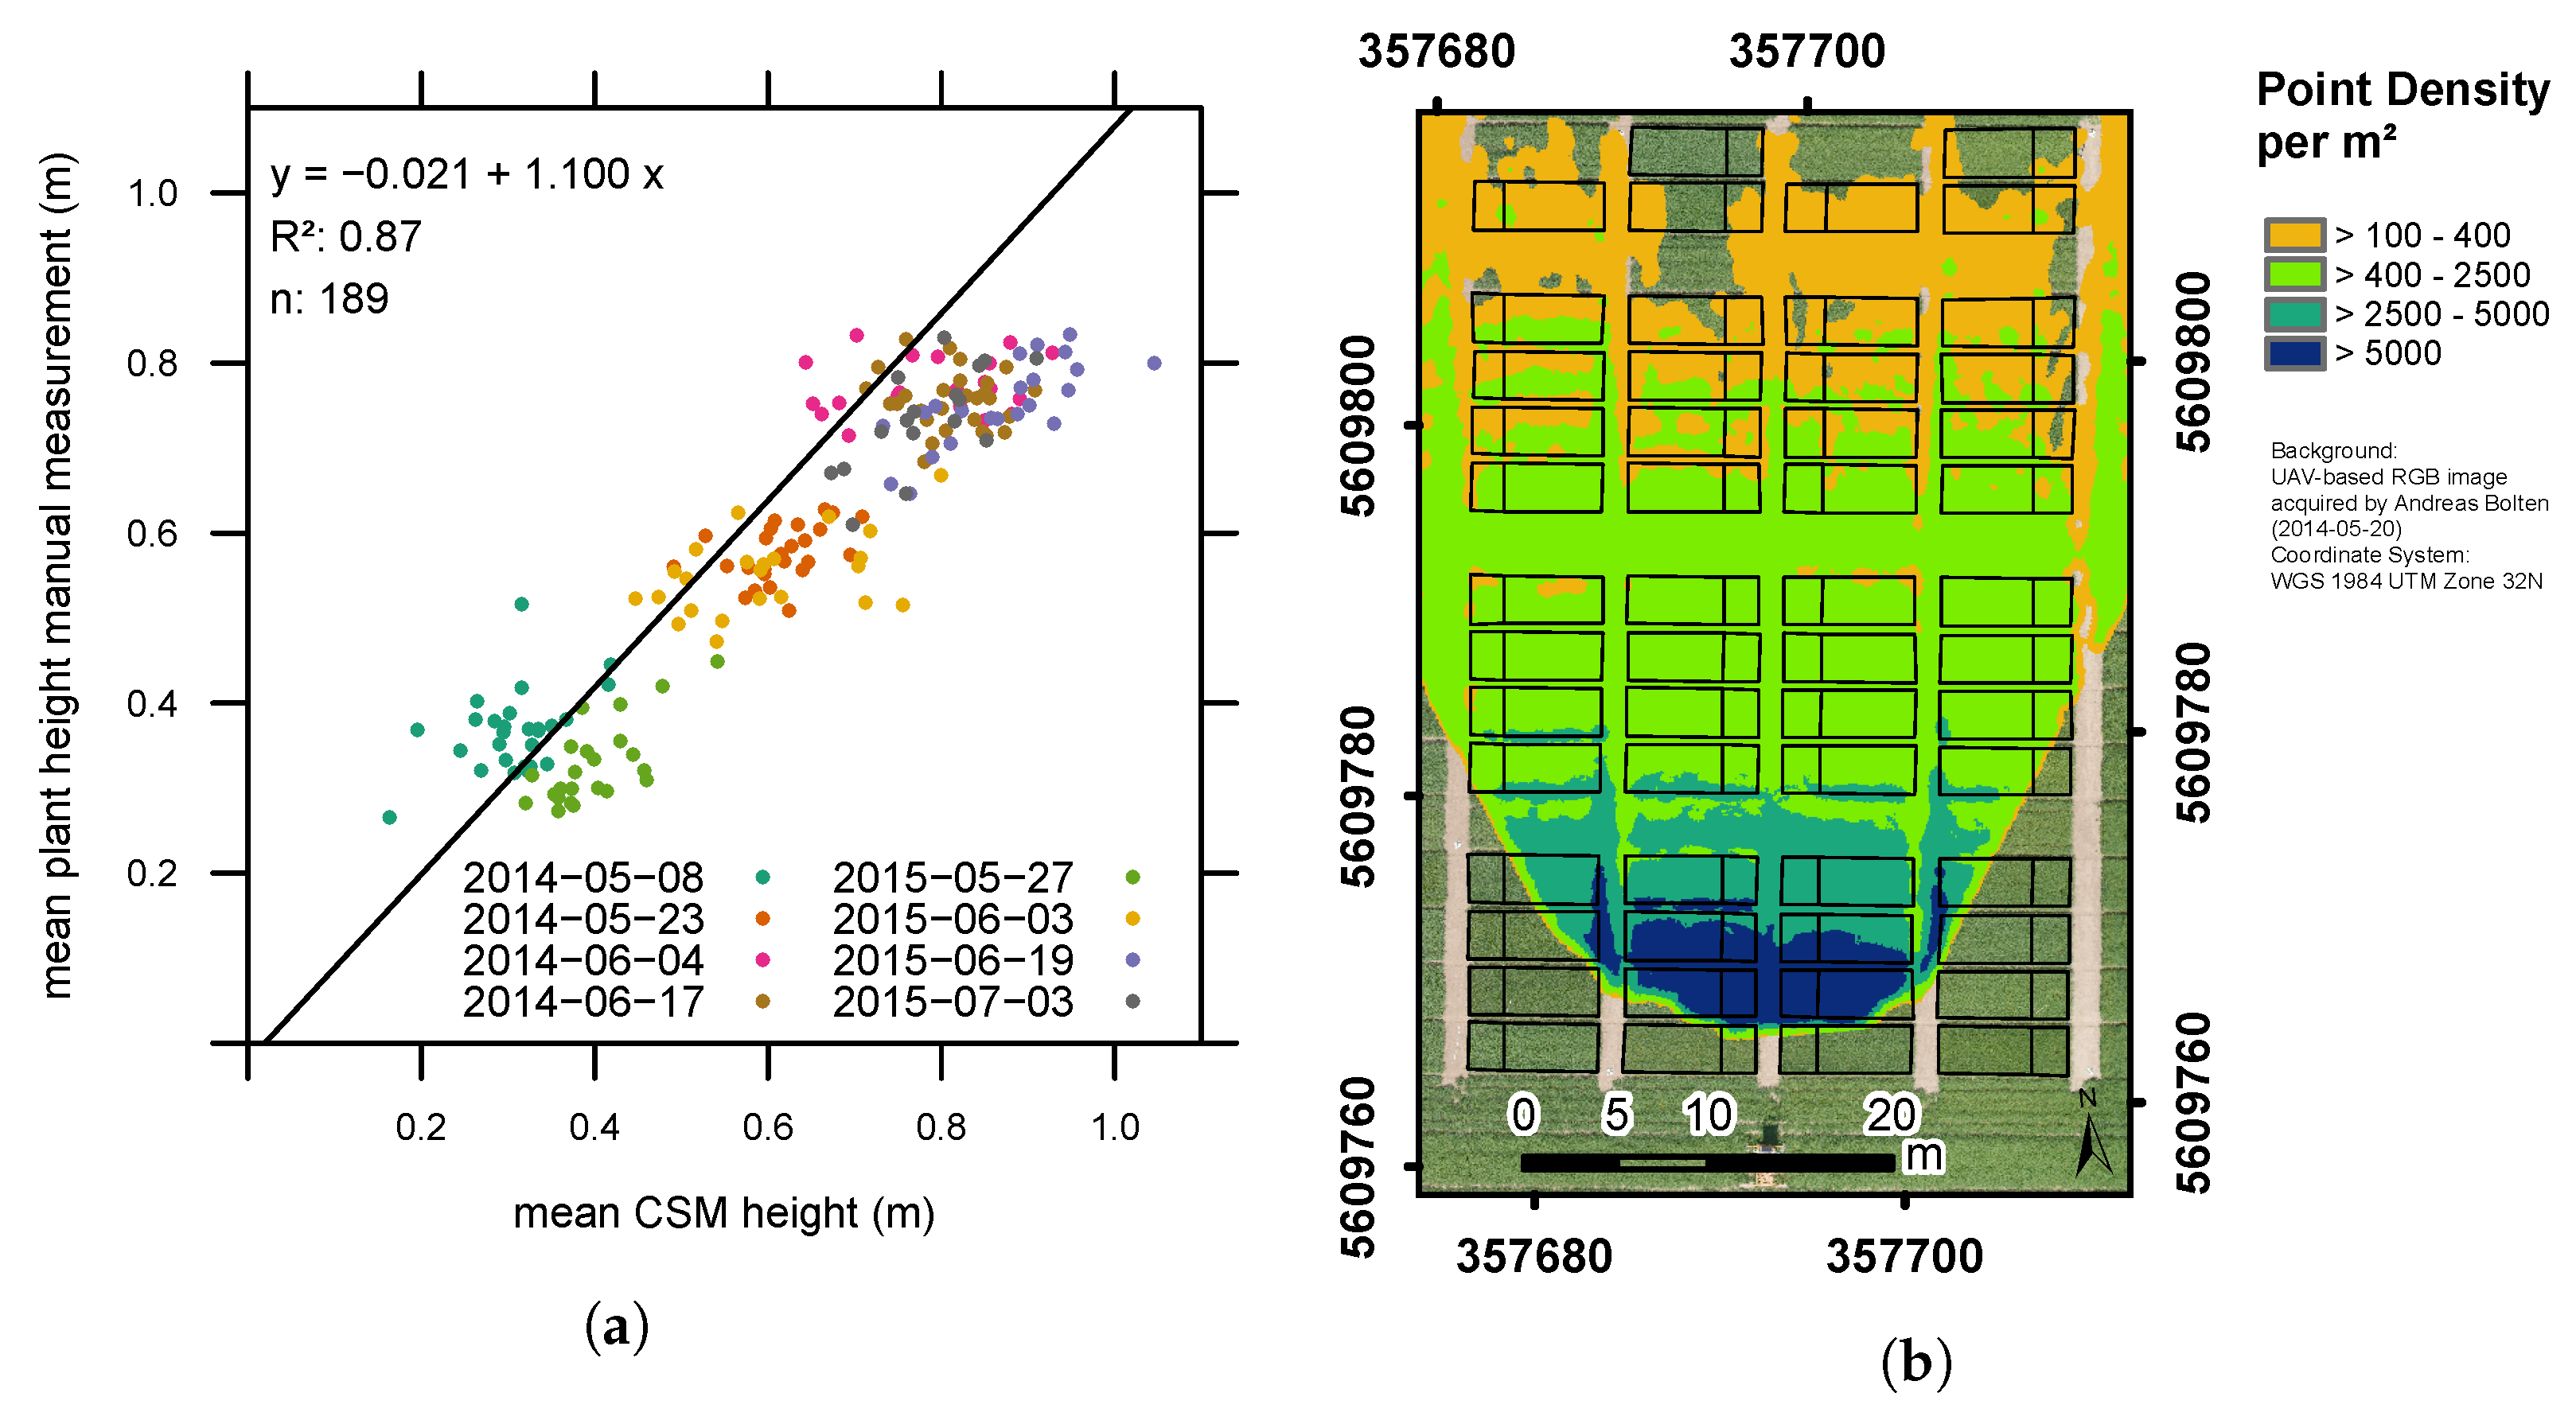
3.1. Plant Height Measurements
3.2. Biomass Estimation
4. Discussion
5. Conclusions
Acknowledgments
Author Contributions
Conflicts of Interest
References
- Bouman, B.A.M.; Goudriaan, J. Estimation of crop growth from optical and microwave soil cover. Int. J. Remote Sens. 1989, 10, 1843–1855. [Google Scholar] [CrossRef] [Scilit]
- Bendig, J.; Yu, K.; Aasen, H.; Bolten, A.; Bennertz, S.; Broscheit, J.; Gnyp, M.L.; Bareth, G. Combining UAV-based plant height from crop surface models, visible, and near infrared vegetation indices for biomass monitoring in barley. Int. J. Appl. Earth Obs. Geoinf. 2015, 39, 79–87. [Google Scholar] [CrossRef] [Scilit]
- Jay, S.; Gorretta, N.; Morel, J.; Maupas, F.; Bendoula, R.; Rabatel, G.; Dutartre, D.; Comar, A.; Baret, F. Estimating leaf chlorophyll content in sugar beet canopies using millimeter- to centimeter-scale reflectance imagery. Remote Sens. Environ. 2017, 198, 173–186. [Google Scholar] [CrossRef] [Scilit]
- Jin, X.; Liu, S.; Baret, F.; Hemerlé, M.; Comar, A. Estimates of plant density of wheat crops at emergence from very low altitude UAV imagery. Remote Sens. Environ. 2017, 198, 105–114. [Google Scholar] [CrossRef] [Scilit]
- Yang, G.; Liu, J.; Zhao, C.; Li, Z.; Huang, Y.; Yu, H.; Xu, B.; Yang, X.; Zhu, D.; Zhang, X.; et al. Unmanned Aerial Vehicle Remote Sensing for Field-Based Crop Phenotyping: Current Status and Perspectives. Front. Plant Sci. 2017, 8, 1111. [Google Scholar] [CrossRef] [Scilit] [PubMed]
- Hoffmeister, D.; Bolten, A.; Curdt, C.; Waldhoff, G.; Bareth, G. High-resolution Crop Surface Models (CSM) and Crop Volume Models (CVM) on field level by terrestrial laser scanning. Proc. SPIE 2010. [Google Scholar] [CrossRef] [Scilit]
- Aasen, H.; Burkart, A.; Bolten, A.; Bareth, G. Generating 3D hyperspectral information with lightweight UAV snapshot cameras for vegetation monitoring: From camera calibration to quality assurance. ISPRS J. Photogramm. Remote Sens. 2015, 108, 245–259. [Google Scholar] [CrossRef] [Scilit]
- Tilly, N.; Aasen, H.; Bareth, G. Fusion of Plant Height and Vegetation Indices for the Estimation of Barley Biomass. Remote Sens. 2015, 7, 11449–11480. [Google Scholar] [CrossRef] [Scilit]
- Lucieer, A.; Turner, D.; King, D.H.; Robinson, S.A. International Journal of Applied Earth Observation and Geoinformation Using an Unmanned Aerial Vehicle ( UAV ) to capture micro-topography of Antarctic moss beds. Int. J. Appl. Earth Obs. Geoinf. 2014, 27, 53–62. [Google Scholar] [CrossRef] [Scilit]
- Bendig, J.; Bolten, A.; Bareth, G. UAV-based Imaging for Multi-Temporal, very high Resolution Crop Surface Models to monitor Crop Growth Variability. Photogramm. Fernerkund. Geoinf. 2013, 6, 551–562. [Google Scholar] [CrossRef] [Scilit]
- Friedli, M.; Kirchgessner, N.; Grieder, C.; Liebisch, F.; Mannale, M.; Walter, A. Terrestrial 3D laser scanning to track the increase in canopy height of both monocot and dicot crop species under field conditions. Plant Methods 2016, 12, 9. [Google Scholar] [CrossRef] [Scilit] [PubMed]
- Bareth, G.; Bendig, J.; Tilly, N.; Hoffmeister, D.; Aasen, H.; Bolten, A. A Comparison of UAV- and TLS-derived Plant Height for Crop Monitoring: Using Polygon Grids for the Analysis of Crop Surface Models (CSMs). Photogramm. Fernerkund. Geoinf. 2016, 2016, 85–94. [Google Scholar] [CrossRef] [Scilit]
- Geipel, J.; Link, J.; Claupein, W. Combined Spectral and Spatial Modeling of Corn Yield Based on Aerial Images and Crop Surface Models Acquired with an Unmanned Aircraft System. Remote Sens. 2014, 11, 10335–10355. [Google Scholar] [CrossRef] [Scilit]
- Andrade-Sanchez, P.; Gore, M.A.; Heun, J.T.; Thorp, K.R.; Carmo-Silva, E.; French, A.N.; Salvucci, M.E.; White, J.W. Development and evaluation of a field-based high-throughput phenotyping platform. Funct. Plant Biol. 2014, 41, 68–79. [Google Scholar] [CrossRef] [Scilit]
- Großkinsky, D.K.; Pieruschka, R.; Svensgaard, J.; Rascher, U.; Christensen, S.; Schurr, U.; Roitsch, T. Phenotyping in the fields: Dissecting the genetics of quantitative traits and digital farming. New Phytol. 2015, 207, 950–952. [Google Scholar] [CrossRef] [Scilit] [PubMed]
- Brocks, S.; Bendig, J.; Bareth, G. Toward an automated low-cost three-dimensional crop surface monitoring system using oblique stereo imagery from consumer-grade smart cameras. J. Appl. Remote Sens. 2016, 10, 046021. [Google Scholar] [CrossRef] [Scilit]
- Madec, S.; Baret, F.; de Solan, B.; Thomas, S.; Dutartre, D.; Jezequel, S.; Hemmerlé, M.; Colombeau, G.; Comar, A. High-Throughput Phenotyping of Plant Height: Comparing Unmanned Aerial Vehicles and Ground LiDAR Estimates. Front. Plant Sci. 2017, 8, 2002. [Google Scholar] [CrossRef] [Scilit] [PubMed]
- Iqbal, F.; Lucieer, A.; Barry, K.; Wells, R. Poppy Crop Height and Capsule Volume Estimation from a Single UAS Flight. Remote Sens. 2017, 9, 647. [Google Scholar] [CrossRef] [Scilit]
- Tilly, N.; Hoffmeister, D.; Cao, Q.; Huang, S.; Lenz-Wiedemann, V.; Miao, Y.; Bareth, G. Multitemporal crop surface models: Accurate plant height measurement and biomass estimation with terrestrial laser scanning in paddy rice. J. Appl. Remote Sens. 2014, 8, 083671. [Google Scholar] [CrossRef] [Scilit]
- Marshall, M.; Thenkabail, P. Developing in situ non-destructive estimates of crop biomass to address issues of scale in remote sensing. Remote Sens. 2015, 7, 808–835. [Google Scholar] [CrossRef] [Scilit]
- Lancashire, P.D.; Bleiholder, H.; Van Den Boom, T.; Langelüddeke, P.; Stauss, R.; Weber, E.; Witzenberger, A. A uniform decimal code for growth stages of crops and weeds. Ann. Appl. Biol. 1991, 119, 561–601. [Google Scholar] [CrossRef] [Scilit]
- Ullman, S. The Interpretation of Structure from Motion. Proc. R. Soc. Lond. Ser. B 1979, 203, 405–426. [Google Scholar] [CrossRef] [Scilit]
- Seitz, S.; Curless, B.; Diebel, J.; Scharstein, D.; Szeliski, R. A Comparison and Evaluation of Multi-View Stereo Reconstruction Algorithms. In Proceedings of the 2006 IEEE Computer Society Conference on Computer Vision and Pattern Recognition (CVPR’06), New York, NY, USA, 17–22 June 2006; Volume 1, pp. 519–528. [Google Scholar]
- Topcon Positioning Systems Inc. HiPer Pro Operator’s Manual. 2006. Available online: https://www.servicestopni.com/resources/top-survey/downloads/HiPerPro_om.pdf (accessed on 8 February 2018).
- Newman, M.C. Regression analysis of log-transformed data: Statistical bias and its correction. Environ. Toxicol. Chem. 1993, 12, 1129–1133. [Google Scholar] [CrossRef]
- Willmott, C.J.; Robeson, S.M.; Matsuura, K. A refined index of model performance. Int. J. Climatol. 2012, 32, 2088–2094. [Google Scholar] [CrossRef] [Scilit]
- Hoffmeister, D.; Waldhoff, G.; Korres, W.; Curdt, C.; Bareth, G. Crop height variability detection in a single field by multi-temporal terrestrial laser scanning. Precis. Agric. 2016, 17, 296–312. [Google Scholar] [CrossRef] [Scilit]
- Moeckel, T.; Safari, H.; Reddersen, B.; Fricke, T.; Wachendorf, M. Fusion of ultrasonic and spectral sensor data for improving the estimation of biomass in grasslands with heterogeneous sward structure. Remote Sens. 2017, 9, 98. [Google Scholar] [CrossRef] [Scilit]
- Hämmerle, M.; Höfle, B. Direct derivation of maize plant and crop height from low-cost time-of-flight camera measurements. Plant Methods 2016, 12, 50. [Google Scholar] [CrossRef] [Scilit] [PubMed]
- Holman, F.H.; Riche, A.B.; Michalski, A.; Castle, M.; Wooster, M.J.; Hawkesford, M.J. High throughput field phenotyping of wheat plant height and growth rate in field plot trials using UAV based remote sensing. Remote Sens. 2016, 8, 1031. [Google Scholar] [CrossRef] [Scilit]
- Watanabe, K.; Guo, W.; Arai, K.; Takanashi, H.; Kajiya-Kanegae, H.; Kobayashi, M.; Yano, K.; Tokunaga, T.; Fujiwara, T.; Tsutsumi, N.; et al. High-Throughput Phenotyping of Sorghum Plant Height Using an Unmanned Aerial Vehicle and Its Application to Genomic Prediction Modeling. Front. Plant Sci. 2017, 8, 421. [Google Scholar] [CrossRef] [Scilit] [PubMed]
- Bendig, J.; Bolten, A.; Bennertz, S.; Broscheit, J.; Eichfuss, S.; Bareth, G. Estimating Biomass of Barley Using Crop Surface Models (CSMs) Derived from UAV-Based RGB Imaging. Remote Sens. 2014, 6, 10395–10412. [Google Scholar] [CrossRef] [Scilit]
- Naito, H.; Ogawa, S.; Valencia, M.O.; Mohri, H.; Urano, Y.; Hosoi, F.; Shimizu, Y.; Chavez, A.L.; Ishitani, M.; Selvaraj, M.G.; et al. Estimating rice yield related traits and quantitative trait loci analysis under different nitrogen treatments using a simple tower-based field phenotyping system with modified single-lens reflex cameras. ISPRS J. Photogramm. Remote Sens. 2017, 125, 50–62. [Google Scholar] [CrossRef] [Scilit]

| Date | Number of Plots with Point Density > 150/m2 (Average Point Density/m2 per Plot) | BBCH | ||
|---|---|---|---|---|
| Morning | Noon | Evening | ||
| 7 May 2014 (55 DAS) | * | n = 23 (991) | n = 25 (1412) | tillering–stem elongation (24–32) |
| 8 May 2014 (56 DAS) | n = 29 (1297) | n = 28 (1324) | n = 30 (1399) | |
| 9 May 2014 (57 DAS) | n = 29 (1271) | n = 17 (1064) | n = 28 (1029) | |
| 26 May 2015 (60 DAS) | * | * | n = 24 (2106) | tillering (21–27) |
| 27 May 2015 (61 DAS) | n = 24 (2077) | n = 23 (2271) | n = 23 (2461) | |
| 1 June 2015 (66 DAS) | n = 20 (1848) | n = 22 (2122) | n = 22 (2146) | booting (41–47) |
| 2 June 2015 (67 DAS) | n = 6 (509) | n = 22 (2143) | n = 10 (509) | |
| 3 June 2015 (68 DAS) | n = 23 (2743) | n = 23 (2451) | n = 22 (2319) | |
| 21 May 2014 (69 DAS) | n = 25 (1185) | n = 23 (1356) | n = 25 (1224) | booting (47–49) |
| 22 May 2014 (70 DAS) | n = 22 (1222) | n = 20 (1443) | n = 17 (1785) | |
| 23 May 2014 (71 DAS) | n = 20 (1368) | n = 26 (1222) | n = 24 (1244) | |
| 17 June 2015 (82 DAS) | n = 22 (2298) | n = 17 (1377) | n = 23 (1608) | inflorescence emergence, heading (51–59) |
| 18 June 2015 (83 DAS) | n = 17 (1415) | n = 21 (1593) | n = 18 (1214) | |
| 19 June 2015 (84 DAS) | n = 16 (944) | n = 22 (1683) | n = 23 (2004) | |
| 4 June 2014 (83 DAS) | n = 26 (1145) | n = 22 (1297) | n = 11 (1136) | inflorescence emergence, heading (52–59) |
| 5 June 2014 (84 DAS) | * | n = 12 (1186) | n = 20 (1267) | |
| 16 June 2014 (95 DAS) | n = 28 (1462) | n = 23 (1404) | n = 27 (1277) | development of fruit (71–75) |
| 17 June 2014 (96 DAS) | n = 27 (1351) | n = 28 (1397) | n = 27 (1407) | |
| 18 June 2014 (97 DAS) | n = 28 (1299) | n = 24 (1061) | n = 27 (1269) | |
| 1 July 2015 (96 DAS) | * | n = 17 (2727) | n = 17 (3108) | development of fruit (73–75) |
| 2 July 2015 (97 DAS) | n = 17 (2159) | n = 17 (1810) | n = 18 (1824) | |
| 3 July 2015 (98 DAS) | n = 17 (3337) | n = 17 (3350) | n = 18 (2016) | |
| Acquisition Time | RMSE (m) | ||
|---|---|---|---|
| morning (n = 194) | 0.81 | 0.09 | 0.77 |
| noon (n = 189) | 0.87 | 0.08 | 0.77 |
| evening (n = 189) | 0.81 | 0.09 | 0.75 |
| Calibration Dataset | ncal | Expon. | Lin. | |||
|---|---|---|---|---|---|---|
| RMSE | RMSE | |||||
| Dry Biomass | ||||||
| Pre Anthesis | Rep. 1, 2 | 116 | 0.74 | 0.27 | 0.70 | 158.6 |
| Rep. 1, 3 | 72 | 0.78 | 0.25 | 0.71 | 169.2 | |
| Rep. 2, 3 | 100 | 0.72 | 0.27 | 0.64 | 173.3 | |
| 2014 | 76 | 0.74 | 0.24 | 0.67 | 129.3 | |
| 2015 | 68 | 0.75 | 0.28 | 0.72 | 181.3 | |
| 70% * | 101 | 0.74 | 0.27 | 0.68 | 166.9 | |
| (std. dev.) | ±0.02 | ±0.01 | ±0.02 | ±8.3 | ||
| Whole Period | Rep. 1, 2 | 135 | 0.73 | 0.30 | 0.62 | 226.3 |
| Rep. 1, 3 | 88 | 0.79 | 0.29 | 0.68 | 225.2 | |
| Rep. 2, 3 | 121 | 0.74 | 0.29 | 0.62 | 224.9 | |
| 2014 | 104 | 0.74 | 0.30 | 0.58 | 250.8 | |
| 2015 | 68 | 0.75 | 0.28 | 0.72 | 181.3 | |
| 70% * | 120 | 0.75 | 0.30 | 0.63 | 227.2 | |
| (std. dev.) | ±0.02 | ±0.01 | ±0.02 | ±10.2 | ||
| Fresh Biomass | ||||||
| Pre Anthesis | Rep. 1, 2 | 116 | 0.47 | 0.27 | 0.46 | 736.1 |
| Rep. 1, 3 | 72 | 0.51 | 0.27 | 0.53 | 723.7 | |
| Rep. 2, 3 | 100 | 0.42 | 0.26 | 0.40 | 736.7 | |
| 2014 | 76 | 0.37 | 0.22 | 0.36 | 563.4 | |
| 2015 | 68 | 0.62 | 0.27 | 0.59 | 799.1 | |
| 70% * | 101 | 0.46 | 0.27 | 0.45 | 734.4 | |
| (std. dev.) | ±0.04 | ±0.01 | ±0.04 | ±36.3 | ||
| Whole Period | Rep. 1, 2 | 152 | 0.48 | 0.27 | 0.44 | 797.0 |
| Rep. 1, 3 | 97 | 0.56 | 0.26 | 0.55 | 744.4 | |
| Rep. 2, 3 | 129 | 0.43 | 0.26 | 0.39 | 790.4 | |
| 2014 | 104 | 0.40 | 0.23 | 0.36 | 700.7 | |
| 2015 | 85 | 0.63 | 0.27 | 0.59 | 799.4 | |
| 70% * | 132 | 0.48 | 0.27 | 0.45 | 784.7 | |
| (std. dev.) | ±0.03 | ±0.01 | ±0.03 | ±29.9 | ||
| Calibration/Validation | nval | Exponential | Linear | |||||||
|---|---|---|---|---|---|---|---|---|---|---|
| Split | RMSE (g/m²) | RE (%) | RMSE (g/m²) | RE (%) | ||||||
| Dry Biomass | ||||||||||
| Pre Anthesis | Rep. 1, 2/Rep. 3 | 28 | 0.77 | 112.57 | 0.72 | 21.88 | 0.58 | 163.32 | 0.60 | 34.08 |
| Rep. 1, 3/Rep. 2 | 72 | 0.63 | 174.77 | 0.70 | 26.40 | 0.65 | 152.31 | 0.71 | 27.42 | |
| Rep. 2, 3/Rep. 1 | 44 | 0.79 | 99.95 | 0.77 | 23.00 | 0.79 | 99.89 | 0.77 | 21.17 | |
| 2014/2015 | 68 | 0.70 | 124.01 | 0.74 | 24.80 | 0.72 | 97.33 | 0.73 | 25.27 | |
| 2015/2014 | 76 | 0.69 | 141.98 | 0.68 | 24.69 | 0.67 | 168.32 | 0.59 | 34.84 | |
| 70%/30% * | 43 | 0.70 | 135.45 | 0.73 | 23.76 | 0.68 | 135.14 | 0.72 | 25.81 | |
| (std. dev.) | ±0.06 | ±16.42 | ±0.03 | ±2.50 | ±0.05 | ±12.62 | ±0.03 | ±2.82 | ||
| Whole Period | Rep. 1, 2/Rep. 3 | 37 | 0.79 | 146.79 | 0.79 | 23.49 | 0.67 | 189.54 | 0.71 | 36.84 |
| Rep. 1, 3/Rep. 2 | 84 | 0.55 | 234.16 | 0.66 | 31.34 | 0.59 | 198.86 | 0.67 | 33.04 | |
| Rep. 2, 3/Rep. 1 | 51 | 0.66 | 149.32 | 0.75 | 25.19 | 0.68 | 146.01 | 0.76 | 23.48 | |
| 2014/2015 | 68 | 0.69 | 190.49 | 0.74 | 27.36 | 0.72 | 151.46 | 0.75 | 27.97 | |
| 2015/2014 | 104 | 0.60 | 173.39 | 0.73 | 25.06 | 0.58 | 195.29 | 0.70 | 32.23 | |
| 70%/30% * | 52 | 0.63 | 184.93 | 0.73 | 26.60 | 0.63 | 177.29 | 0.71 | 29.71 | |
| (std. dev.) | ±0.06 | ±21.37 | ±0.03 | ±2.63 | ±0.05 | ±15.22 | ±0.03 | ±3.05 | ||
| Fresh Biomass | ||||||||||
| Pre Anthesis | Rep. 1, 2/Rep. 3 | 28 | 0.52 | 468.85 | 0.60 | 21.02 | 0.44 | 530.80 | 0.58 | 21.76 |
| Rep. 1, 3/Rep. 2 | 72 | 0.37 | 641.12 | 0.56 | 24.84 | 0.37 | 594.62 | 0.56 | 24.73 | |
| Rep. 2, 3/Rep. 1 | 44 | 0.60 | 352.40 | 0.66 | 26.02 | 0.58 | 360.10 | 0.66 | 25.54 | |
| 2014/2015 | 68 | 0.58 | 312.38 | 0.63 | 31.87 | 0.58 | 268.69 | 0.62 | 32.47 | |
| 2015/2014 | 76 | 0.34 | 689.01 | 0.45 | 22.34 | 0.35 | 769.92 | 0.39 | 25.63 | |
| 70%/30% *,a | 43 | 0.47 | 491.29 | 0.60 | 23.82 | 0.46 | 488.90 | 0.60 | 23.76 | |
| (std. dev.) | ±0.09 | ±74.27 | ±0.05 | ±2.78 | ±0.09 | ±71.65 | ±0.05 | ±2.85 | ||
| Whole Period | Rep. 1, 2/Rep. 3 | 37 | 0.52 | 575.74 | 0.64 | 20.74 | 0.46 | 610.82 | 0.61 | 21.54 |
| Rep. 1, 3/Rep. 2 | 92 | 0.34 | 683.30 | 0.57 | 25.87 | 0.35 | 621.47 | 0.58 | 25.46 | |
| Rep. 2, 3/Rep. 1 | 60 | 0.61 | 355.41 | 0.64 | 24.37 | 0.61 | 358.75 | 0.64 | 23.99 | |
| 2014/2015 | 85 | 0.57 | 348.26 | 0.64 | 29.46 | 0.58 | 313.45 | 0.64 | 29.82 | |
| 2015/2014 | 104 | 0.35 | 784.93 | 0.49 | 23.80 | 0.35 | 790.85 | 0.48 | 25.14 | |
| 70%/30% *,b | 57 | 0.45 | 536.64 | 0.61 | 23.63 | 0.45 | 521.90 | 0.61 | 23.53 | |
| (std. dev.) | ±0.08 | ±64.09 | ±0.04 | ±2.43 | ±0.07 | ±61.89 | ±0.03 | ±2.42 | ||
© 2018 by the authors. Licensee MDPI, Basel, Switzerland. This article is an open access article distributed under the terms and conditions of the Creative Commons Attribution (CC BY) license (http://creativecommons.org/licenses/by/4.0/).
Share and Cite
Brocks, S.; Bareth, G. Estimating Barley Biomass with Crop Surface Models from Oblique RGB Imagery. Remote Sens. 2018, 10, 268. https://doi.org/10.3390/rs10020268
Brocks S, Bareth G. Estimating Barley Biomass with Crop Surface Models from Oblique RGB Imagery. Remote Sensing. 2018; 10(2):268. https://doi.org/10.3390/rs10020268
Chicago/Turabian StyleBrocks, Sebastian, and Georg Bareth. 2018. "Estimating Barley Biomass with Crop Surface Models from Oblique RGB Imagery" Remote Sensing 10, no. 2: 268. https://doi.org/10.3390/rs10020268
APA StyleBrocks, S., & Bareth, G. (2018). Estimating Barley Biomass with Crop Surface Models from Oblique RGB Imagery. Remote Sensing, 10(2), 268. https://doi.org/10.3390/rs10020268