Article

Monitoring Crop Evapotranspiration and Crop Coefficients over an Almond and Pistachio Orchard Throughout Remote Sensing

1
Efficient Use of Water in Agriculture Program, Institute of Agri-Food, Research and Technolgy (IRTA), Fruitcentre, Parc Científic i Tecnològic de Gardeny, 25003 Lleida, Spain
2
Department of Viticulture and Enology, University of California, Davis, CA 95616, USA
3
Center of Spatial Technologies (CSTARS), Department of Land, Air and Water Resources (LAWR), University of California, Davis, CA 95616, USA
4
Département Optique Théorique et Appliquée (DOTA), ONERA—The French Aerospace Lab, 2 Avenue Edouard Belin, 31000 Toulouse, France
5
Institute for Soil, Water and Environmental Sciences. Agricultural Research Organization (ARO), Volcani Research Center, Bet Dagan 50250, Israel
6
School of Natural Sciences, California State University, Monterey Bay, 100 Campus Center, Seaside, CA 93955, USA
7
University of California, Cooperative Extension, 1031 S. Mt.Vernon Ave., Bakersfield, CA 93397, USA
*
Author to whom correspondence should be addressed.
Remote Sens. 2018, 10(12), 2001; https://doi.org/10.3390/rs10122001
Submission received: 23 October 2018 / Revised: 5 December 2018 / Accepted: 6 December 2018 / Published: 10 December 2018
(This article belongs to the Special Issue Remote Sensing for Crop Water Management)

Abstract

:
In California, water is a perennial concern. As competition for water resources increases due to growth in population, California’s tree nut farmers are committed to improving the efficiency of water used for food production. There is an imminent need to have reliable methods that provide information about the temporal and spatial variability of crop water requirements, which allow farmers to make irrigation decisions at field scale. This study focuses on estimating the actual evapotranspiration and crop coefficients of an almond and pistachio orchard located in Central Valley (California) during an entire growing season by combining a simple crop evapotranspiration model with remote sensing data. A dataset of the vegetation index NDVI derived from Landsat-8 was used to facilitate the estimation of the basal crop coefficient (Kcb), or potential crop water use. The soil water evaporation coefficient (Ke) was measured from microlysimeters. The water stress coefficient (Ks) was derived from airborne remotely sensed canopy thermal-based methods, using seasonal regressions between the crop water stress index (CWSI) and stem water potential (Ψstem). These regressions were statistically-significant for both crops, indicating clear seasonal differences in pistachios, but not in almonds. In almonds, the estimated maximum Kcb values ranged between 1.05 to 0.90, while for pistachios, it ranged between 0.89 to 0.80. The model indicated a difference of 97 mm in transpiration over the season between both crops. Soil evaporation accounted for an average of 16% and 13% of the total actual evapotranspiration for almonds and pistachios, respectively. Verification of the model-based daily crop evapotranspiration estimates was done using eddy-covariance and surface renewal data collected in the same orchards, yielding an R2 ≥ 0.7 and average root mean square errors (RMSE) of 0.74 and 0.91 mm·day−1 for almond and pistachio, respectively. It is concluded that the combination of crop evapotranspiration models with remotely-sensed data is helpful for upscaling irrigation information from plant to field scale and thus may be used by farmers for making day-to-day irrigation management decisions.

1. Introduction

The State of California (CA) has the greatest production of tree nut crops worldwide. Among them, almond acreage is estimated at 940,000 bearing acres and represents a 5.2-billion-dollar industry, with around 1 million tons produced in 2016. CA also produces 98% of the pistachios in the United States and is the second largest producer worldwide with more than 240,000 acres planted producing over 0.27 million tons of pistachios per year [1,2]. Most of these two nut crops are planted in the Central Valley, a region with a hot Mediterranean climate in which agricultural and environmental needs, along with the increasing demand of a growing population, to compete for their share of the limited water resources.
Almonds and pistachios are two high-value crops that have a reputation of being drought tolerant, producing modest yields with very little water [3,4]. However, irrigation is critical in producing high yields of top quality nuts [5,6]. Some research studies agreed that water productivity in almond and pistachio is around 2.4 and 3.6 kg·m3, respectively [7,8]. To produce just these two crops, California needs around 1.7 billion m3 of water per year. Because water resources are becoming scarce in CA and drought periods trend to be more frequent and of longer duration [9], there is an urgent need to continue to reduce water use during agricultural production. The historic drought from 2012 to 2016 increased grower awareness of efficient water use practices and therefore forced them to put into practice irrigation water-saving strategies (e.g., regulated deficit irrigation). However, in order to determine optimal irrigation scheduling and to adopt such strategies efficiently, it is necessary to have reliable methods that provide information about the temporal and spatial variability of crop water requirements and, to understand the seasonal physiological responses to water stress. Therefore, the need for developing simple crop evapotranspiration (ET) modeling approaches with the inclusion of water stress indicators is required to quantify stress under deficit irrigation (DI) applications and for scheduling irrigation [10].
Remote sensing data has been widely used in the assessment of crop ET and crop water stress to obtain spatial information. Reflectance-derived vegetation indices (VI) such as the normalized difference vegetation index (NDVI), have been empirically regressed with basal crop coefficients (Kcb) and applied to a reference ET (ETo) to estimate crop water use, such as with FAO56 [11,12]. Although simple and widely-applied, this method may be too simplistic for crops undergoing deficit-irrigation scheduling because it only accounts for the potential evapotranspiration that a crop would have with no modification in stomatal conductance or crop coefficient (Kc) due to water stress. In addition, these techniques assume that variations in potential crop evapotranspiration (ETc) are linearly related to canopy size, and are not sensitive to crop phenology and canopy architecture [13]. Other techniques are based on combining both thermal and optical data to directly obtain actual crop evapotranspiration (ETa) through energy balance models [14,15,16]. Although these models are able to estimate ETa with fine accuracy, they have limitations because they require the retrieval of a large number of physical parameters and modeling options. In addition, some of these models, such as mapping evapotranspiration at high resolution with internalized calibration (METRIC) [17] or the simplified surface energy balance (SEBAL) [18] model are sensitive to the definition of hot (zero transpiration) and cold (potential transpiration) pixels, which can lead to user subjectivity in defining those anchor pixels.
When moderate crop water stress is imposed, ETa drops below ETc. Traditionally, the adoption of DI strategies have been beneficial for fruit and nut tree species to increase water productivity and fruit quality [8,19,20,21]. DI aims at the partial replacement of water lost to ETc in order to reach specific water deficit thresholds in the soil and plant. However, when dealing with DI in commercial orchards, implementing a water deficit based solely on the ETa/ETc ratio may contain significant errors. These errors are due to (a) possible inaccuracies on ETa and ETc estimations, (b) the lack of knowledge on the particular thresholds below which there is a reduction of transpiration due to water stress, and (c) the difficulty of achieving a spatially-homogenous, targeted soil, or plant water status across the orchard [22]. Spatial differences in soil type and depth, canopy architecture, and fruit load contribute to variations in plant water status within the orchard. In addition, the relative insensitivity of canopy ETa to stomatal closure suggests that approaches based on energy balance models currently used to estimate ETa may fail to detect plant water stress [23]. Therefore, a sensitive physiological indicator that integrates both soil and climatic conditions, and can quantify the impact of stomatal closure on ETa is required in order to determine the influence of environmental and cultural conditions on plant water status. For this reason, some researchers argue that plant-based approaches, whereby plant water status threshold values are imposed, are preferable to ET-based approaches. Among them, midday stem water potential (Ψstem) has been commonly used as a precise plant water status indicator [24,25,26]. Nevertheless, due to major inconveniences in measuring Ψstem manually at large scales, new approaches based on thermal remote sensing imagery have been successfully developed to estimate Ψstem in woody crops [27,28,29]. These approaches regress Ψstem with the crop water stress index (CWSI), which is a function of leaf temperature and can also be defined as (1 − ETa/ETc) [30,31].
Therefore, our hypothesis is that since Ψstem has been successfully regressed with CWSI in many different crops, the seasonal regressions of CWSI-Ψstem for almond and pistachio trees, obtained from airborne thermal imagery, can be used to assess a water stress coefficient (Ks) that can be assimilated into an empirically-based ET model. Accordingly, the objective of this study is to explore the feasibility of using this simple ET-based model to estimate ETa of an almond and pistachio orchard during an entire growing season by combining multispectral and thermal remote sensing imagery. Verification of the estimates of Kc and ETa will be achieved using data obtained with the eddy covariance and surface renewal methods.

2. Materials and Methods

2.1. Study Site

The study site was located in Madera County, Central Valley, California, a few kilometers north of the San Joaquin River (36°49′15.85″N, 120°12′1.20″W; Figure 1). The climate in the region is typically Mediterranean with average annual high and low temperatures of 24.2 and 9.2 °C, respectively, and an average precipitation (1928–2010) of 311 mm that falls predominantly during the winter season (November–March). In 2016, the mean annual temperature, accumulated precipitation and reference evapotranspiration (ETo) were 16.7 °C, 300 and 1357 mm, respectively. Daily maximum solar radiation (Rs) in the area was 347 W·m−2 (DOY 187). Soil is classified as a deep sandy loam (6–14% clay, 67–78% sand), moderate to well drained soils that formed in sandy alluvium from dominantly granitic rocks [32].
Two commercial nut orchards were chosen to estimate crop evapotranspiration during the entire growing season by using remote sensing. The first, was an 18 year-old, 16-ha commercial almond orchard. The orchard was planted with cv. Nonpareil and cv. Carmel, on alternating rows with a dense canopy and high coverage. Trees were planted at a spacing distance of 5.5 m apart and with 7.3 m inter-row. Trees in adjacent rows were offset by one half of the spacing distance. The irrigation system consisted of a single dripline connected to micro-sprinklers (Fan-Jet, Bowsmith, USA), with a 3.5 m wetting radius. Each tree was irrigated at a rate of 38–45 L·h−1. The second orchard was a 14-year-old, 16 ha cv. Kerman cultivar pistachio orchard. Trees were planted at a spacing distance of 5.2 m apart with 5.8 m driveways between tree rows. The irrigation system consisted on two drip lines of eight drippers per tree with a discharge rate of 3.8 L·h−1. The amount of irrigation water applied in the almond and pistachio orchards during the growing season was 898.0 and 762.5 mm, respectively. Irrigation in both orchards was scheduled following the protocol of the nut company. The almond orchard was irrigated weekly with a timing ranging from 2 (beginning of the season) to 70 hours/week (after harvest of cv. Nonpareil). From August through mid-September, the almond orchard was dried for periods of 14 days to enable harvest. In pistachio, irrigation periods ranged from 5 (beginning of the season) to 50 hours·week−1 (late July) and the orchard was dried for a period of 13 days before harvest (early October).

2.2. Field Data

In each orchard, three plots were designed to carry out field measurements. Each plot contained four rows of six trees, and measurements were taken from the four central trees in the two middle rows of each plot (Figure 2). All the other trees in the plot were guard trees. During the thermal airborne campaign days, an additional plot was set up. This additional plot consisted of 10 trees (2 rows of 5 trees) and irrigation was interrupted a week before each image acquisition in order to increase water stress. We also established four plots outside of, but in orchards adjacent to, the primary orchard study plots; two plots each in younger almond and pistachio orchards that contained canopies with a low and medium canopy cover. These adjacent plots were in addition to the higher canopy coverage of the primary orchard study plots and allowed us to better understand the relationship between the NDVI and canopy light interception over a range of canopy sizes.
The volume of water applied in the orchard was measured daily by installing into the dripline of each plot a water meter pulse sensor connected to a CR1000 (Campbell Scientific, UT, USA) datalogger. Soil water content was determined with a neutron probe (Hydroprobe 503DR; CPN International, Inc., Martinez, CA, USA). In each plot, three boreholes perpendicular to the row direction were augured between trees at a distance of 0.9 m each to a depth of 3.0 m using a soil hand auger (AMS, American Falls, ID, USA) and PVC neutron probe access tubes were installed. Readings were taken at 0.3 m depth intervals from the soil surface to a depth of 3.0 m, every one to two weeks. Neutron probe readings for the top 0.9 m, which corresponded to the active root zone observed on excavation, were converted to volumetric soil water content (θv) using a calibration curve that was determined in a previous study conducted in the same orchards [33].
Midday stem water potential (Ψstem) was measured every one to two weeks during the growing season in both orchards following the protocols described by McCutchan and Shackel [34]. All measurements were taken within one hour of solar noon, with four trees measured in each plot, as well as two additional measurements in the almond trees where canopy temperature (Tc) was continuously monitored with non-contact thermal infrared radiometers (IRTs) (Apogee Instruments Inc., Logan, USA). During the days of the thermal airborne campaigns, Ψstem was also measured in ten trees in the additional water-stressed plot. A pressure chamber (3005 series portable plant water status console; Soilmoisture Equipment Corp., Santa Barbara, CA, USA) was used. Shaded leaves were wrapped in plastic bags covered with aluminum foil for one hour prior to the Ψstem measurement.
The fraction of the intercepted PAR (photosynthetically active radiation) solar radiation (fIPAR) and leaf area index (LAI) were measured following identical protocols for both orchards. Measurements were conducted at solar noon every two to four weeks throughout the year during the growing season using a portable ceptometer (AccuPAR model LP-80, Decagon Devices Inc., Pullman, WA, USA). Incident PAR above and below the canopy were measured for each tree. The PAR intercepted by the canopy (fIPAR) was calculated dividing the averaged below canopy PAR (fIPAR below) by the incident PAR taken in full sunlight at an open site with no interference from the canopy (fIPAR above). Daily fIPAR (fIPARd) was calculated by using the hourly model of light interception [35]. The parameter of porosity of Oyarzun’s model was estimated so that the noon fIPAR value of the hourly simulation was equal to that measured in the field. Tree structural parameters such as tree height, crown width perpendicular to and along rows, and branch insertion height were also measured. fIPARd was calculated by integrating the diurnal course of simulated fIPAR. LAI was also obtained from fIPARd, using the approach presented by Campbell and Norman [36] and setting a leaf absorptivity for light at 0.9.

2.3. Remote Sensing Data

A data set consisting of 25 dates of Landsat-8 Level 1 product images for atmospherically-corrected, top of the canopy normalized difference vegetation index (NDVI) covering both orchards was acquired from the USGS. The study orchards fall on two scenes, path/row 42/35 and 43/34, which provided L8 coverage four times each month for the period February to December 2016. The NDVI for each plot and date were extracted from each image using the ArcGIS software (version 10.5.1). Then, in order to remotely estimate fIPARd, the NDVI was regressed against fIPARd and LAI measurements. In addition, the NDVI of the adjacent orchards with younger trees was also obtained and regressed with in-situ measurements of fIPARd. These regressions were used to estimate the daily fraction of intercepted radiation (fIPARd est) over a wider range of canopy closures throughout the growing season and used as input to the model.
The airborne thermal campaign consisted of four flights conducted on 17 May 2016 (DOY 138), 22 June 2016 (DOY 174), 21 July 2016 (DOY 203) and 11 August 2016 (DOY 224). Image acquisition and pre-processing were managed by Ceres Imaging (Oakland, CA, USA; www.ceresimaging.net). Images were acquired between 1:00 and 3:00 p.m. (Pacific Time, PST) (GTM-7) with the thermal sensor FLIR A65 (FLIR Systems, Wilsonville, OR, USA). The image resolution is 640 × 512 pixels, with a field of view (FOV) of 45° × 37° using 13 mm lens. Spectral response was in the range of 7.5–13 µm. The spatial resolutions differ between flights and pixel size ranged from 0.6 to 1.5 meters, due to differences in the flight altitude between dates, which varied from 500 to 1000 meters. These differences in pixel size did not affect the extraction of pure vegetation pixels, since crown area of both crops was significantly greater than the pixel size (Figure 2). In-situ temperature was measured for ground-based calibration targets with a portable IR-gun (Fluke 572 infrared thermometer, Everett, WA, USA). As targets, we used black and white 2.4 × 2.4 m painted panels and 2.0 × 2.0 m inexpensive textile sheets of cotton. In addition, concurrent with image collection, we took temperature measurements of asphalt, concrete, bare soil, and a tomato field located adjacent to the almond orchard. Image orthorectification was completed using ground control points (GCP). The GCP panels were divided into quadrants and painted black and white in opposite corners. The position of the center of each GCP was acquired with a handheld GPS (Global Positioning System) (Geo7x, Trimble GeoExplorer series, Sunnyvale, CA, USA) and pixel-based geo-rectification was done with the software package ENVI 4.7.

2.4. Evapotranspiration Measurements

Crop evapotranspiration was measured with an eddy-covariance (EC) and surface renewal (SR) systems. In both orchards, the flux towers were located close to the experimental plots and facing into the predominant wind direction (west). Both the EC and SR systems were installed in the pistachio orchard, while only a SR was installed in the almond orchard. In the pistachio orchard, the flux tower included the following instrumentation at 6 m over the soil surface: Infrared Gas Analyzer IRGA (LI-7500, LI-COR Inc., Lincoln, NE, USA), three-dimensional sonic anemometer (CSAT3, Campbell Scientific Inc. Logan, UT, USA); a REBS Q7.1 net radiometer (Campbell Sci., Logan, UT, USA); and two FW3 Type-E fine-wire thermocouples (Campbell Sci., Logan, UT, USA). In addition, the ground heat flux was measured using three sets of HFP01-SC soil heat flux plates (Campbell Sci., Logan, UT, USA) and soil temperature averaging sensors (TCAV, Campbell Scientific Inc., Logan, UT, USA). The sensible heat flux (H) was obtained from the 3D sonic anemometer on a half-hour basis. Instrumentation in the almond orchard was installed at 9 m above the ground and consisted of the following: Kipp & Zonen NR Lite 2 net radiometer, two FW3 Type-E fine-wire thermocouples (Campbell Sci., Logan, UT, USA) and two non-contact SI-121 thermal-infrared radiometer sensors (IRTs) (Apogee Instruments Inc., Logan, USA). The latter were installed at 1.5 m above the canopy of two almond trees, positioned with a 45° angle and ensuring that the targeted area was pure canopy vegetation. The sensor has a narrow 18° half-angle field of view and a response time of 0.6 seconds. We used the same instrumentation as in the pistachio orchard to measure the ground heat flux in the almond orchard.
The SR is an alternative and inexpensive approach to EC for measuring sensible heat flux density (H) [37,38]. Although this system requires only a fast-response air temperature sensor, it needs to be calibrated [37]. The calibration factor alpha is obtained from the slope of the regression between a standard H (generally taken as eddy covariance measurements) forced through the origin versus uncalibrated surface renewal sensible heat flux measurements [39]. In this study, the alpha weighting factors (α) were obtained from another flux tower installed in an almond orchard located in Belridge (CA, USA) (35°30′25.47″N, 119°40′04.99″W). Almond tree from that orchard were of similar age and structural properties as those from our study site, and α was obtained from available data of both EC and SR [23,40]. Monthly averaged data for the period 2008–2011 was used to calibrate the H obtained from the SR system installed in the almond orchard (Table 1). Latent heat flux (LE) of both orchards was then estimated as a residual of the energy balance (LE=Rn-G-H). The averaged values of H and LE were calculated and recorded with an output frequency of 30 min and converted to ETa (ETaobs) by dividing LE by 2.45 MJ·mm−1 of water vaporized. Daily calculations of ETaobs were used to validate the empirically-based ET-model approach developed in this study to estimate almond and pistachio ETa.
Agrometeorological data was acquired from the CIMIS network of weather stations of California [41]. The study site is located between two weather stations in the San Joaquin Valley: Madera (#188; Lat/Long: 37.02°N, 120.15°W), and Westlands (#105; Lat/Long: 36.63°N, 120.38°W). Thus, data from both stations was averaged to provide the weather input data sets and reference ETo. In addition, air temperature (Ta) for each orchard was obtained from the FW3 type-E fine-wire thermocouples, installed in each flux tower.

2.5. Estimates of Actual Crop Evapotranspiration (ETa) and Coefficients

The actual crop evapotranspiration (ETa) was calculated as
ETa = ETo (Kcb Ks + Ke + Kcc)
where, Kcb is the basal crop coefficient from the dual crop coefficient approach, which essentially represents transpiration under non-water limited conditions [42]; Ks is a water stress coefficient, Ke is the soil water evaporation coefficient, and Kcc is the crop cover coefficient. The actual crop coefficient (Ka), which is considered as the ratio of actual to reference evapotranspiration, was calculated as
Ka = Kcb Ks + Ke + Kcc
It is widely acknowledged that the fraction of crop intercepted radiation (fIPAR) is a major determinant of the basal crop coefficient (Kcb) [43,44]. As previously described in Section 2.3, fIPARd was derived throughout the growing season by regressing it with the reflectance vegetation index NDVI, which was acquired from Landsat-8. Since we could not find any study that presented the fIPARd-Kcb response for almonds, it has been assumed in this study that this regression is similar to that developed for peach trees, another Prunus species [44]. Marsal et al. [44] used Cropsyst to simulate the seasonal patterns of fIPARd, ETc, Kcb and Ψstem for peach trees; we borrowed Equation 4 from Marsal et al. to estimate almond Kcb from fIPARd. For pistachio, Kcb was empirically derived using the crop coefficients (Kc) from Goldhamer et al. [45] and deducting the weekly averaged Ke derived in this study. Then, to obtain the Kcb as function of fIPARd, we used the relationship between crop evapotranspiration (ET) with the percent area shaded by the canopy developed by Fereres et al. [46], and assuming that fIR was equivalent to shaded proportion. An empirical polynomial relationship relating fIPAR with fIPARd was developed (R2 = 0.57, n = 93) using all measurements conducted in the pistachio plots throughout the growing season (Equation 3).
fIPARd_pist = −2.981 (fIPAR)2 + 3.452 (fIPAR) − 0.37
Then, Kcb for both crops was calculated as
Kcb_alm = −0.982(fIPARd)2 + 2.559(fIPARd) − 0.474
Kcb_pist = −0.324 (fIPARd_pist)2 + 1.721(fIPARd_pist) + 0.045
The water stress coefficient (Ks) was retrieved from canopy thermal-based methods. The methodology consisted on the seasonal estimation of Ks from measurements of Ψstem, which were conducted in each plot every one to two weeks, and using the seasonal regressions obtained between the remotely sensed crop water stress index (CWSI) and Ψstem. Then, the Ks was obtained as
Ks = 1 − CWSI
In order to calculate the CWSI for almonds, canopy temperature (Tc) of two almond trees was continuously monitored from mid-April to October 2016 with two infrared radiometer (IRT) sensors. Tc was recorded every minute and stored as 30-min averages and these data were used to calculate the almond baseline of the CWSI. The empirical CWSI was calculated as [30], which can be represented as
C W S I = ( T c T a ) ( T c T a ) L L ( T c T a ) U L ( T c T a ) L L
where Tc − Ta is the difference between canopy and air temperature; (TcTa)LL is the lower limit of (TcTa) of a canopy which is transpiring at the potential rate, and (TcTa)UL the expected differential in the case of a non-transpiring canopy.
The non-water stressed baseline (NWSB) was obtained by regressing half-hourly values of (TcTa) against vapor pressure deficit (VPD) from 2:00 to 3:00 p.m. Only data within two days after each irrigation event, which had wind speed below 6 m·s−1, were used in the assessment of the NWSB. The (TcTa)LL was then obtained taking the minimum values of Tc − Ta for each VPD. The upper limit (TcTa)UL was obtained by solving the NWSB regression equation for VPD=0, then correcting for the difference in vapor pressure induced by the difference in temperature Tc − Ta. As previously reported by Bellvert et al. [28], a phenological response was identified in the NWSB. Therefore, data was separated between early phenological stages (from April to beginning of July) and late stages (from early July to harvest at the end of August). In pistachio, CWSI was calculated using the baselines developed by Testi et al. [47]. Air temperature (Ta) was obtained from the fine-wire thermocouples and relative humidity (RH) was obtained using a Watchdog 1000 series micro station (Spectrum Technologies, 3600, IL, USA) installed in each orchard. On the four dates of the thermal airborne campaign, the CWSI was then calculated in those trees where Ψstem was measured and the regression between both parameters was acquired for each day. Crown-averaged temperatures for each tree were extracted and converted to CWSI by using image processing methods.
Soil evaporation was measured with simple microlysimeters (ML). ML were made by cutting commercial PVC pipe and closing the bottom end with caps. These were positioned in a PVC pipe outer casing installed into the soil. Dimensions of each ML were 0.12 m in height and 0.0974 m of internal diameter. Three and four ML were installed in the soil wetted area of each plot of the almond and pistachio orchard, respectively. In the almond orchard, microlysimeters were positioned half-way between a tree and micro-sprinkler, separated by a distance of 0.92 m from each. In the pistachio orchard, two ML were positioned on either side of the middle tree, between drip emitters. Measurements were conducted seven times throughout the growing season and each time, the ML measurements were weighted for two to three consecutive days. The procedure consisted on removing the ML from the soil taking care to preserve the structure of the extracted and remaining soil. Then, in order to ensure that only water evaporation from the ML was measured, soil clinging from the external surfaces of the ML was removed. Soil evaporation (Esoil) and the soil water evaporation coefficient (Ke) were calculated by the relationship
E s o i l = Δ M M L A M L × A w e t   mm · day 1
K e = E s o i l E T o
where, ∆MML is microlysimeter daily variation of mass (grams); AML is microlysimeter surface area with a value of 74.55 cm2 (1 mm of evaporation corresponded therefore to 0.007455 liters or 7.455 g of water evaporated); Awet is wetted soil area (%); and ETo is daily evapotranspiration (mm).
The wetted soil area around a tree was measured using a measuring tape. The procedure consisted of dividing the tree spacing area into four quadrants and measuring the percentage of wetted area in each quadrant. Ke was calculated during the growing season based on the number of days after each irrigation event. Evaporation after a rainfall event was considered in the same way as an irrigation event, but where the entire soil surface was completely wetted, Awet was considered equal to the spacing per tree.
The cover crop coefficient (Kcc) was obtained as
K c c = C C w SD ( G C )
where, CCw is cover crop width (m), which was measured every two to three weeks, SD represents the spacing distance, and GC is the percentage of green cover, which was estimated visually.

3. Results and Discussion

3.1. Stem Water Potential and Volumetric Soil Water Content

The seasonal pattern of stem water potential (Ψstem) and volumetric soil water content (θv) is presented in Figure 3. Before harvest, Ψstem values ranged between −0.8 to −1.6 MPa and between −0.5 to −1.4 MPa for almond and pistachio, respectively (Figure 3a). Ψstem of both crops decreased through the season, reaching minimum values at harvest. Minimum Ψstem values for almonds were −3.3 MPa, coinciding with the end of the drying period. Ψstem of both crops also showed a clear response to θv, yielding coefficients of determination (R2) of 0.89 and 0.74 for almonds and pistachios, respectively. Soil texture in both orchards was sandy loam, with 19.5% and 10.3% of soil water content respectively at field capacity and wilting point across the entire soil profile [48]. Similarly to Ψstem, θv across both sites decreased throughout the season, except for a slight increase in the θv just before harvest due to an irrigation event, which increased the Ψstem values to the same level as those measured in pistachios (Figure 3b). The θv in the pistachio orchard at the top 0.9 m was slightly higher than in the almond orchard throughout the growing season. Therefore, the lower θv in the almond orchard may explain, in part, the reason why Ψstem values were lower.

3.2. Seasonal Trends of NDVI

Relevant canopy biophysical parameters involved in canopy transpiration can be described by the NDVI [49]. The seasonal trend of NDVI indicated an initial phase of linear increase, followed by a plateau with a slight decreasing trend over time (Figure 4a). Significant differences in seasonal patterns were observed between almond and pistachio. These differences can be explained by differences in the fraction of ground cover. The NDVI in the almond orchard peaked before the pistachio, explained by an earlier vegetative growth in almonds. Maximum NDVI values were 0.86 (DOY 80) and 0.63 (DOY 112) for almond and pistachio, respectively. The slight decrease in the NDVI throughout the season was more notable in the almond orchard probably because of senescence of the cover crop, while the NDVI in the pistachio orchard remained quite constant until the end of harvest. After harvest, a noticeable decrease in the NDVI was explained by a reduction in the leaf area resulting from leaf senescence as well as tree shaking.
In woody crops, potential canopy transpiration has usually been derived from the NDVI through estimates of the leaf area index (LAI) or the fraction of intercepted radiation [50,51]. Other studies have used data from eddy-covariance flux towers to relate the NDVI to in-situ measurements of Kcb [52,53]. In this study, the NDVI was linearly correlated with the fIPARd over its entire range, (R2 of 0.88 and 0.96 for pistachio and almond, respectively; Figure 4b). The little shift in this regression indicated that, for any given value of the fIPARd, the NDVI was slightly higher in almonds than in pistachios. This can probably be explained by a cover crop or even a leaf angle effect. While the pistachio orchard had bare soil, most of the almond orchards had cover crop (i.e., weeds) between rows, in part, because the almond orchard was irrigated by micro-sprinklers, whereas the pistachio orchard was irrigated via drip irrigation under the trees. The regression with LAI, however, was non-linear and, above LAI values of ~2, the NDVI tended to saturate and became less sensitive to variations in LAI (Figure 4c). This saturation effect has been widely reported in many studies.

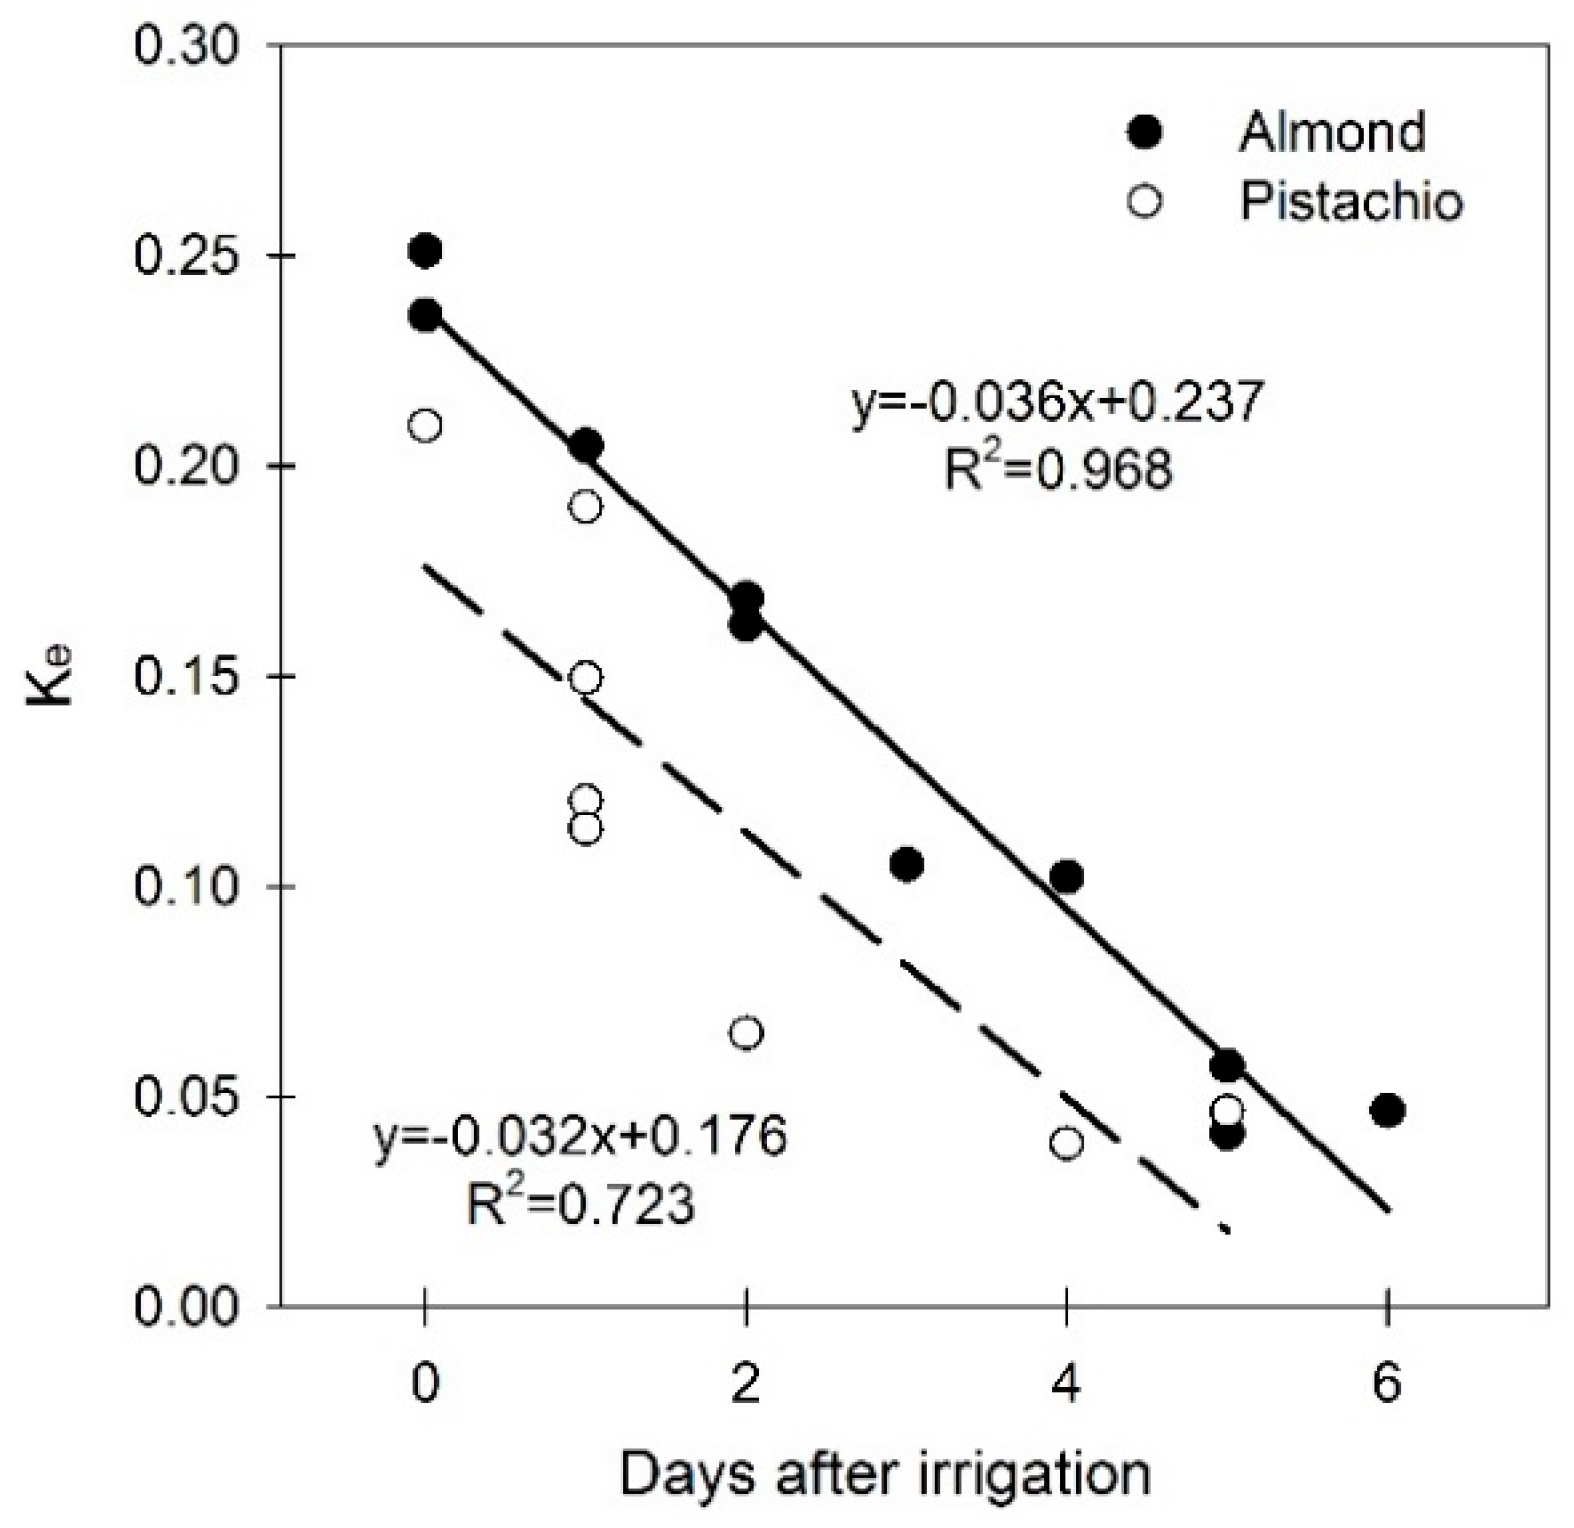
3.3. Soil Water Evaporation Coefficient (Ke)

Ke was measured from mid-April to mid-August, when tree foliage had reached full development. Data showed that Ke was dependent on the irrigation frequency and system. In both orchards, irrigation was scheduled on a weekly basis and particularly during the summer, with long irrigation events ranging from 24 to 36 consecutive hours. Therefore, Ke declines daily following each irrigation event (Figure 5). On the same day of an irrigation event, Ke corresponded to maximum values of 0.24 and 0.18 for almond and pistachio, respectively. The shifting of soil evaporation between both orchards was explained by the irrigation system. The micro-sprinkler irrigation system installed in the almond orchard corresponded with a higher wetted soil surface, and consequently, a higher soil evaporation rate in comparison to the drip irrigation system in the pistachio orchard. Comparing the accumulated soil evaporation on a weekly basis, it was estimated that the pistachio orchard evaporated up to 35% less than the almond orchard. Some studies have found that Esoil in a drip-irrigated almond orchard (canopy cover (CC) = 63%, irrigation at full replacement of ET) accounted for 23.6% of ETc, on average, during the growing season [54]. On the other hand, Iniesta et al. [55] reported Esoil losses that amounted to 30% of seasonal ETc for fully-irrigated pistachios (CC = 57%) with a micro-sprinkler system. In our study, Esoil for the growing season accounted for an average of 16.1 and 13.1% of ETa for almonds and pistachios, respectively (Table 2). Overall, Esoil depends on the type of irrigation system, irrigation frequency, fraction of radiation reaching the soil surface, atmospheric evaporative demand (ETo) and soil infiltration rate [56]. Therefore, variations in reported Esoil values can be explained by variations in these parameters. For instance, dissimilarities in Esoil comparing our almond orchard and results of the pistachio orchard reported by Iniesta et al. [55] might be explained by differences in canopy cover. Both orchards were irrigated with a micro-sprinkler system, but the almond average canopy cover (~85%) was higher than the pistachios, reducing therefore the amount of radiation reaching the soil surface, and thus Esoil.

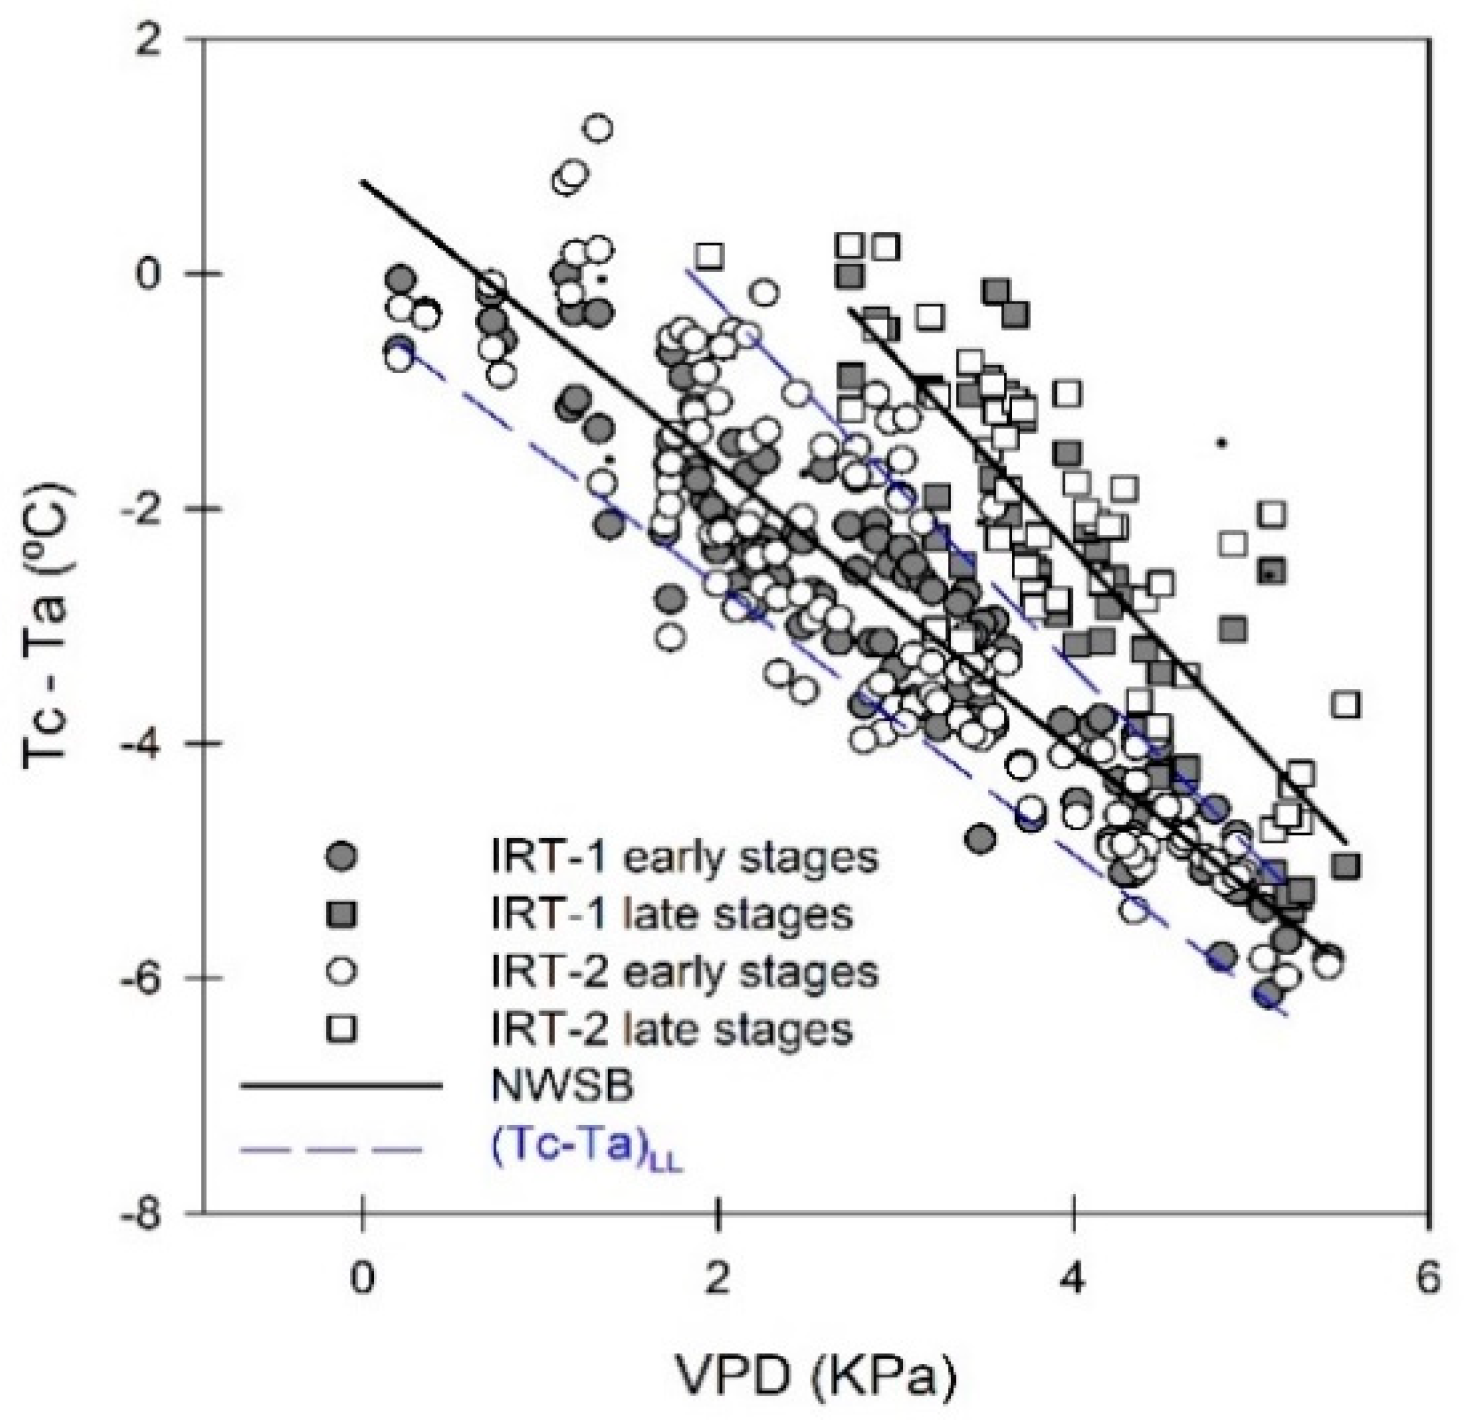
3.4. Crop Water Stress Index (CWSI)

The non-water-stressed baseline (NSWB) of almonds relies on the relationship between Tc − Ta and VPD. This regression was significant and Tc − Ta tends to decrease as VPD increases (Figure 6). However, a seasonal effect was also detected, indicating the necessity to distinguish between two different seasonal responses. During the early growth stages (DOY 106 to 188), data from both IRTs agreed and followed the same pattern, which indicated a lower intercept in the relationship between Tc − Ta vs. VPD in comparison to the later growing stages (DOY 189 to 228; harvest). This implies that for a given increase in VPD, early growth stages, which corresponded to vegetative growth (shell expansion and hardening), had more transpirational cooling than the kernel and post-kernel filling stages. Since significant differences in fIPARd were not detected during the middle of the growing season (from DOY 100 to 228), the seasonal changes in this relationship could be explained either by a decline in the atmospheric evaporative demand due to a reduction in the radiation load, or by leaf aging which influenced leaf loss and hydraulic functioning.
Jackson [31,57] showed that the NWSB of a crop is a function of VPD, wind speed, incoming radiation, and crop resistances (both aerodynamic and surface). Although the data analyzed corresponds only to days with wind speeds below 6 m s−1, and under clear sky conditions, the amount of energy available for evapotranspiration varies throughout the growing season. Usually, the seasonal pattern of solar radiation (Rs), starts to decline after the summer solstice, coinciding with the kernel-filling stage (DOY 188). This decrease in the radiation load could result in a reduction in the dissipation of sensible heat (H) and latent flux (LE). Thus, transpiration can be reduced beyond that achieved solely by stomatal closure, explaining the higher intercept of the NWSB during the kernel-filling stage.
Another explanation might be related to a seasonal decrease in transpiration rate, controlled by stomatal closure, and associated with changes in the hormonal balance, leaf aging or the loss of leaf hydraulic functioning [58,59,60]. Espadafor et al. [59] showed a slight drop in the ratio between daily transpiration and fraction of intercepted radiation (KT/fIPARd) just before harvest, which was explained by the coincidence of the latency period of shoot growth in summer with a low fruit load; which probably decreased the transpiration rate of the tree. A decrease in the gas exchange rate in fully-irrigated almonds during kernel-filling stage was also reported in different studies [54,61]. It seems, therefore, that the stomatal response can be dependent on the phenological stage, and that the kernel-filling stage typically follows a more conservative strategy, which avoids high water loss due to partial stomatal closure [62]. Nevertheless, more studies are necessary to get better understanding of the seasonal responses of transpiration in almonds.
In pistachios, the NWSB was obtained from Testi et al. [47], which developed the following baseline for the period mid-June to the end of September: Tc − Ta= −1.33VPD + 2.44. Therefore, in contrast to the seasonal response detected in the almond NWSB’s, a single baseline was used in pistachio throughout the season, which had an y-intercept in between those seasonal relationships developed for almonds in this study.
The seasonal pattern of the CWSI, which was calculated using Tc from the two IRTs installed on the almond trees, can be observed in Figure 7. CWSI ranged from zero to one throughout the growing season, with sharp peaks before irrigation events and dropping close to zero once irrigation was applied. The sandy loam soils of this orchard have little capacity to retain water, thus the low frequency of irrigation events caused large oscillations of water status within a week. At the beginning of the season, CWSI was unreasonably high for some specific days and there were large differences between both IRTs. On those days, VPD was low, and because under these circumstances the difference between (Tc − Ta)UL and (Tc − Ta)LL is very small, the signal-to-noise ratio to calculate CWSI is small, so CWSI at these times may contain significant sources of error. The CWSI reached maximum values in mid-July, when the atmospheric demand was high and for a few weeks, the amount of water applied was not enough to supply all crop water demand. Also, during the drying period prior to harvest, irrigation was intentionally cut off for 14 days and CWSI peaked at a maximum value of 0.8. Upon the resumption of irrigation during the post-harvest stage, CWSI recovered again. Measurements of Ψstem in those trees agreed with CWSI, showing a significant regression with a R2 of 0.89 (data not shown). However, this regression only used data from those days in the middle of the growing season with a VPD higher than 2.3 KPa and did not contain those measurements collected at the beginning of the season (DOY 108, 116, and 131). Bellvert et al. [28] also showed in grapevines that VPD values below 2.3 KPa had a negative effect on the CWSI-Ψstem relationship.

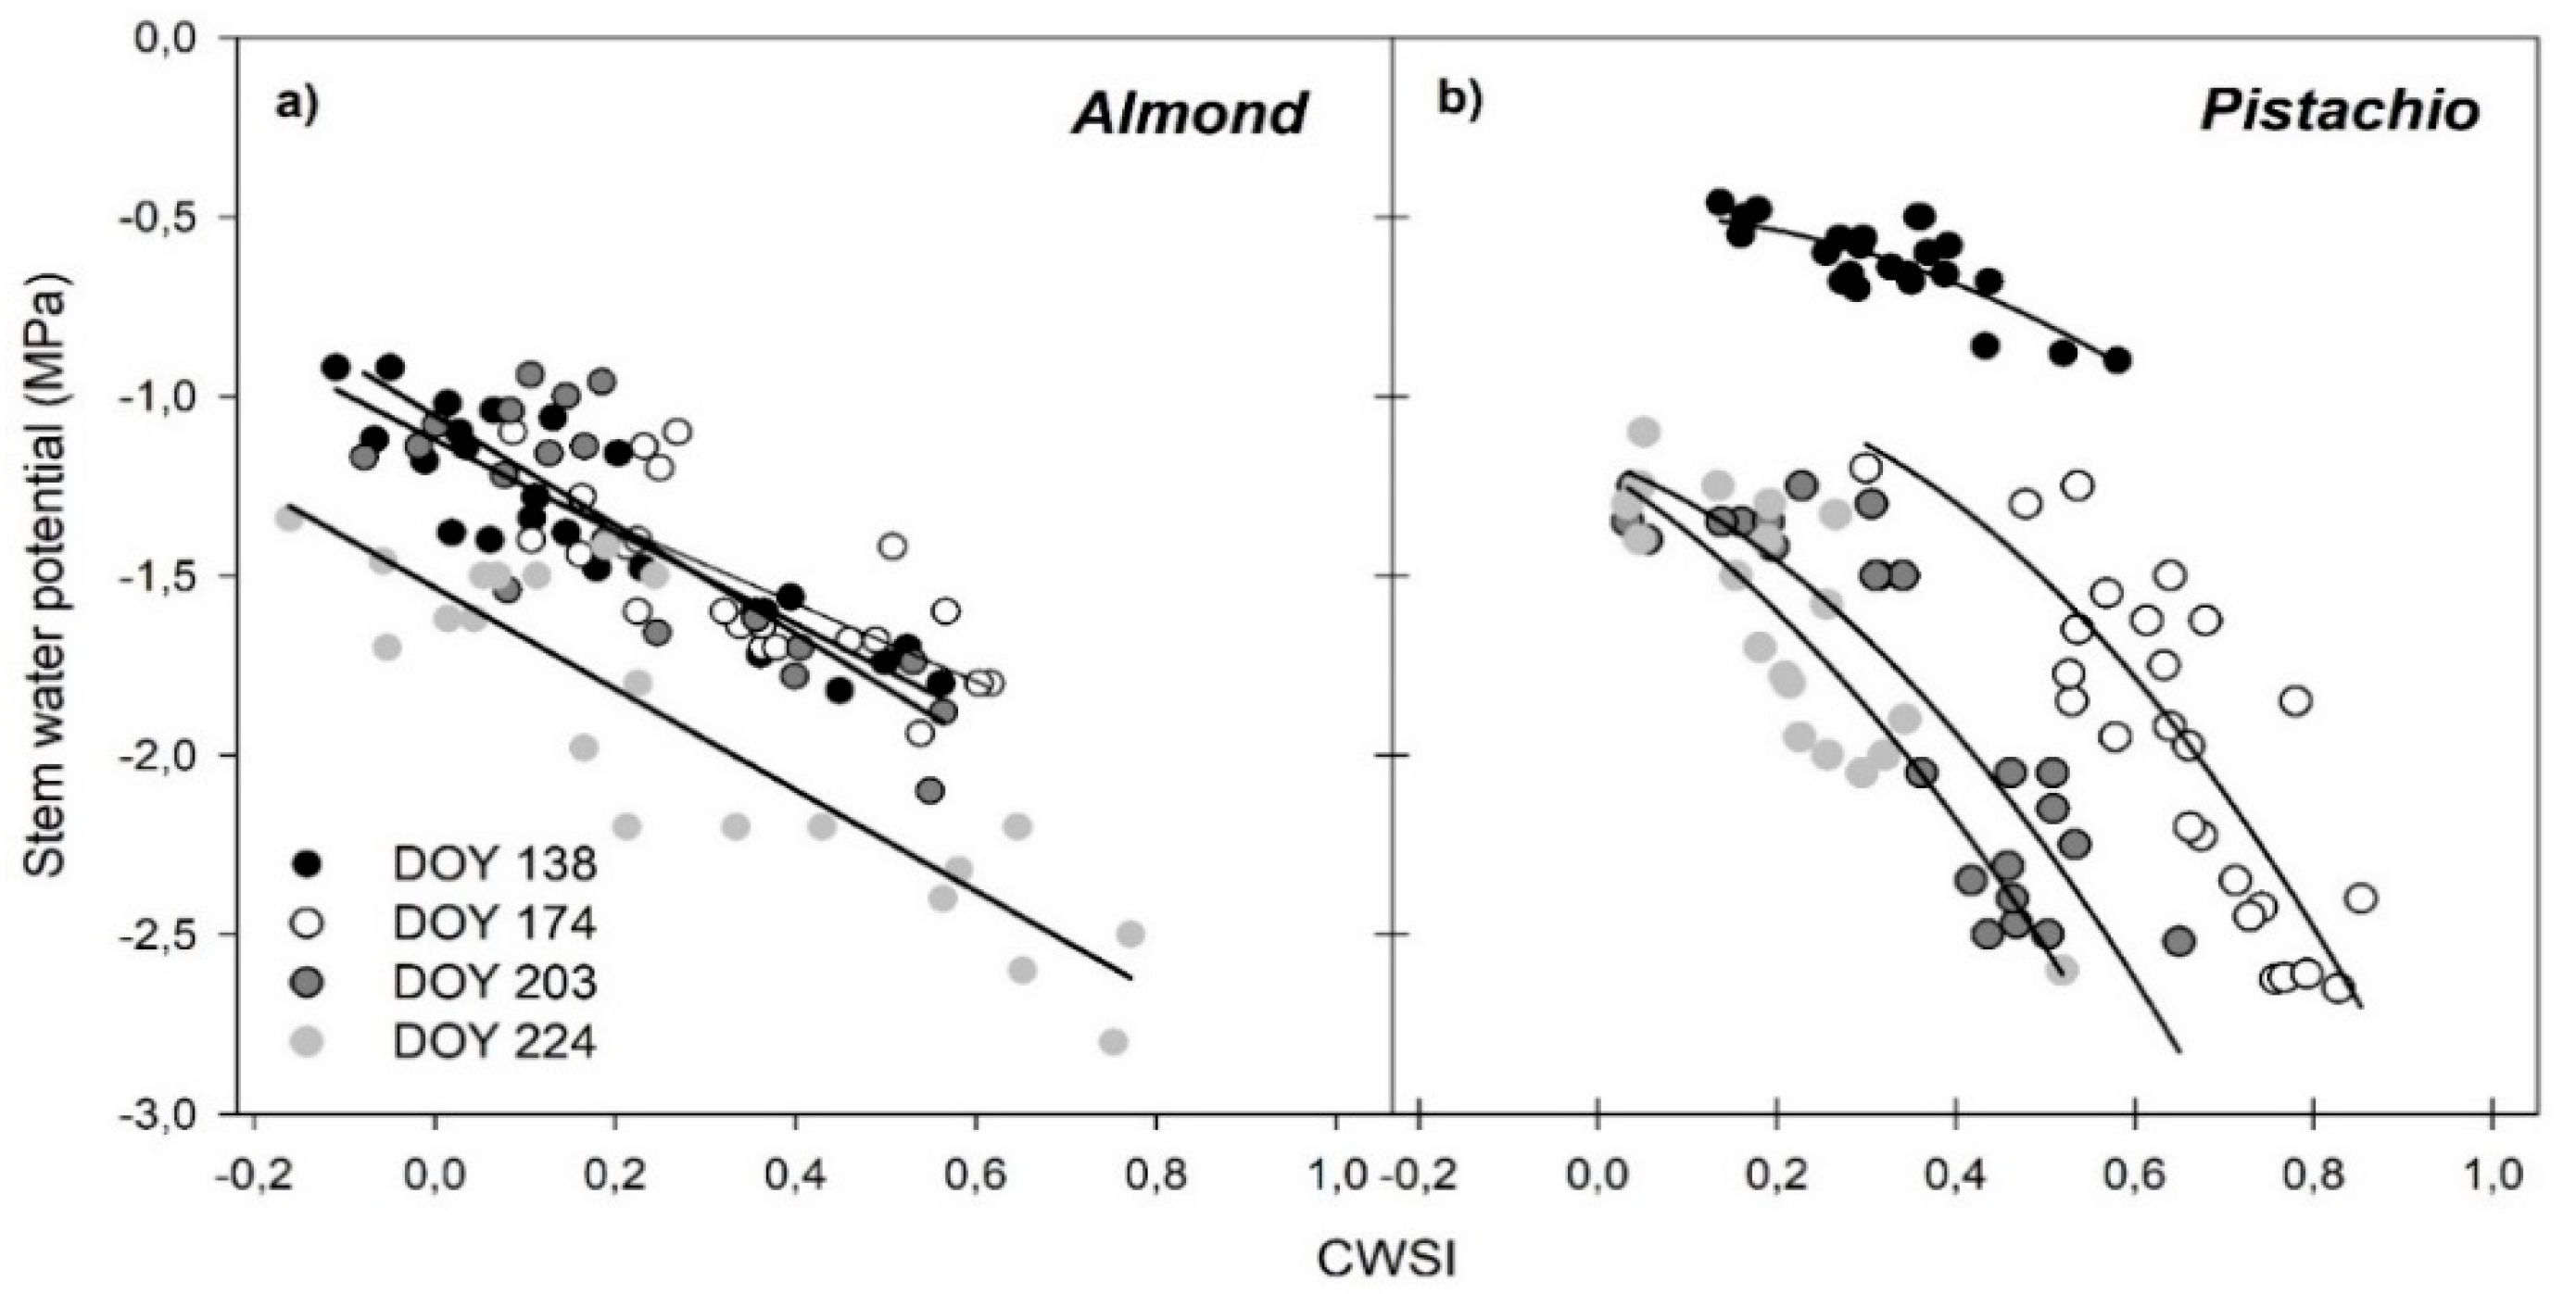
3.5. Regressions of Remotely Sensed CWSI with Stem Water Potential (Ψstem)

The remotely sensed CWSI was regressed with Ψstem for the four thermal image acquisition days and in both crops (Figure 8). In almonds, the regression followed a linear model and R2 ranged from 0.54 to 0.82 (Figure 8a). The shape of the relationships indicated that transpiration continuously decreases as Ψstem declines. Similar responses have been reported in almond [63,64]. There were no seasonal differences in the regression among the first three image acquisition days (DOY 138, 174, and 203), and Ψstem corresponded to −1.05 MPa and −2.48 MPa, when the crop was fully transpiring (CWSI = 0) and under complete stomatal closure (CWSI = 1), respectively. However, the flight of the 11 August (DOY 224) was significantly different from the others, showing a lower intercept. At that moment, Ψstem corresponded to −1.53 MPa and −2.94 MPa, respectively at full transpiration and complete stomatal closure. Seasonal differences in the CWSI-Ψstem regressions due to osmotic potential and leaf turgor seasonal changes have been also described in other crops [28,29]. Across the growing season, the CWSI was slightly negative when corresponding measurements of Ψstem were high. This phenomenon is not unusual and has been reported in previous studies, which explain that it corresponds to observations of Tc lying below the established (Tc − Ta)LL [47,65]. Also, the variability of within-tree crown temperature and techniques used to extract pure vegetation pixels (including shaded and sunlit areas, branches, and pixels affected by background soil), plays a role in the accuracy of CWSI estimates [66].
In contrast, the pistachio regressions between CWSI and Ψstem followed a curvilinear response (Figure 8b). R2 ranged from 0.61 to 0.77 and clear seasonal differences were detected in the CWSI-Ψstem regressions, which might probably be explained by hydraulic conductance and leaf osmotic potential changes [67,68,69,70]. As this crop developed, a given value of CWSI corresponded to more negative Ψstem values. The flight conducted in DOY 138 showed the highest Ψstem values, indicating, at that period, a low osmotic adjustment for recently expanded leaves. The Ψstem required to close stomata (−1.73 MPa) was also higher than in later stages. On the other hand, a completely different response was detected for the other three image acquisition dates (DOY 174, 203, and 224), characterized by a more anisohydric behavior, due to a lower efficiency at controlling Ψstem through stomatal closure. The estimated minimum Ψstem at which stomatal conductance (gs) approached or equaled zero (CWSI = 1) were −3.40, −4.60 and −5.00 MPa, respectively for DOY 174, 203, and 224. In this respect, these values were similar to those reported by Behboudian et al. [71], who also established that when Ψleaf reached extremely low values of −5.0 to −6.0 MPa, leaves were still able to continue photosynthetic activity. Germana [72] reported the outstanding capacity of pistachio trees for leaf thermoregulation and significant transpiration of water at higher levels of water stress. Other studies have also described a seasonal stomatal response in pistachio trees, where at the shell hardening stage, the stomatal opening is substantial and prolonged during the day, and a more conservative strategy later in the season which reduces water loss due to partial stomatal closure during the kernel filling stage [62]. Similarly, Gijón et al. [73] indicated a higher degree of osmotic adjustment during the shell hardening stage, suggesting that some physiological changes are occurring at that stage. These trends could not be confirmed with our data, where the CWSI-Ψstem regressions at shell hardening (DOY 174) and kernel filling (DOY 203 and 224) had similar slopes and different y-intercepts.

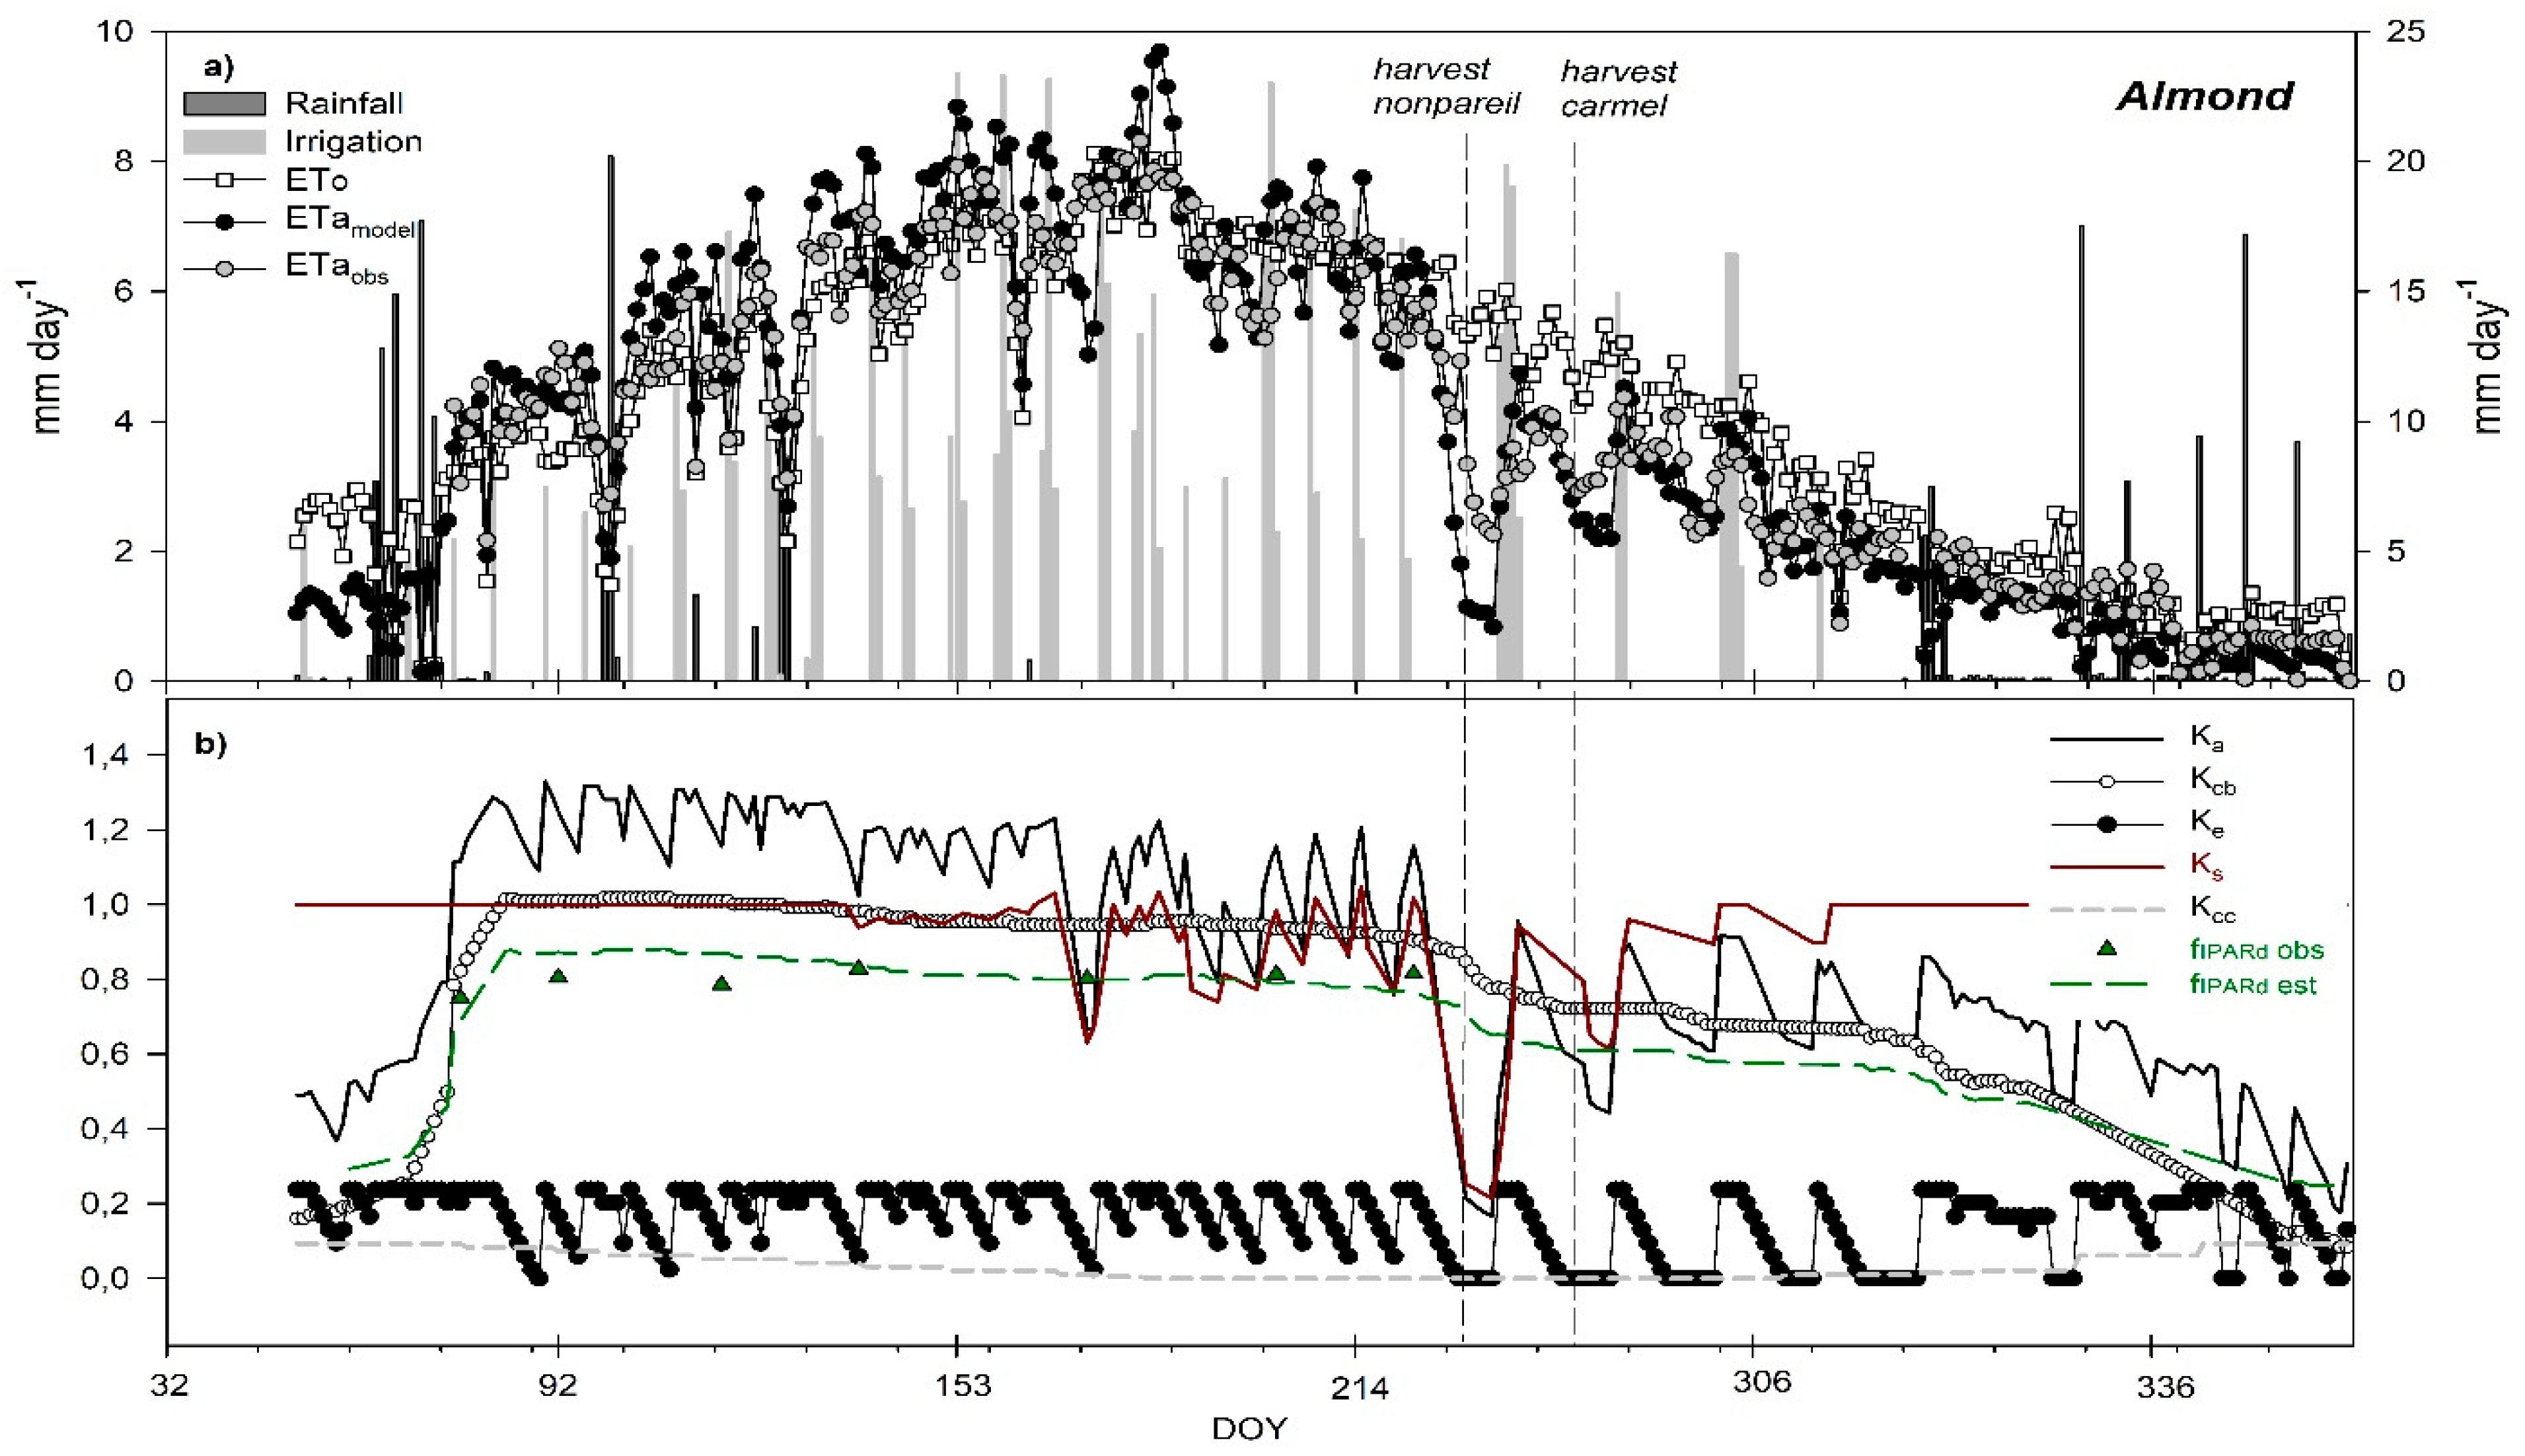
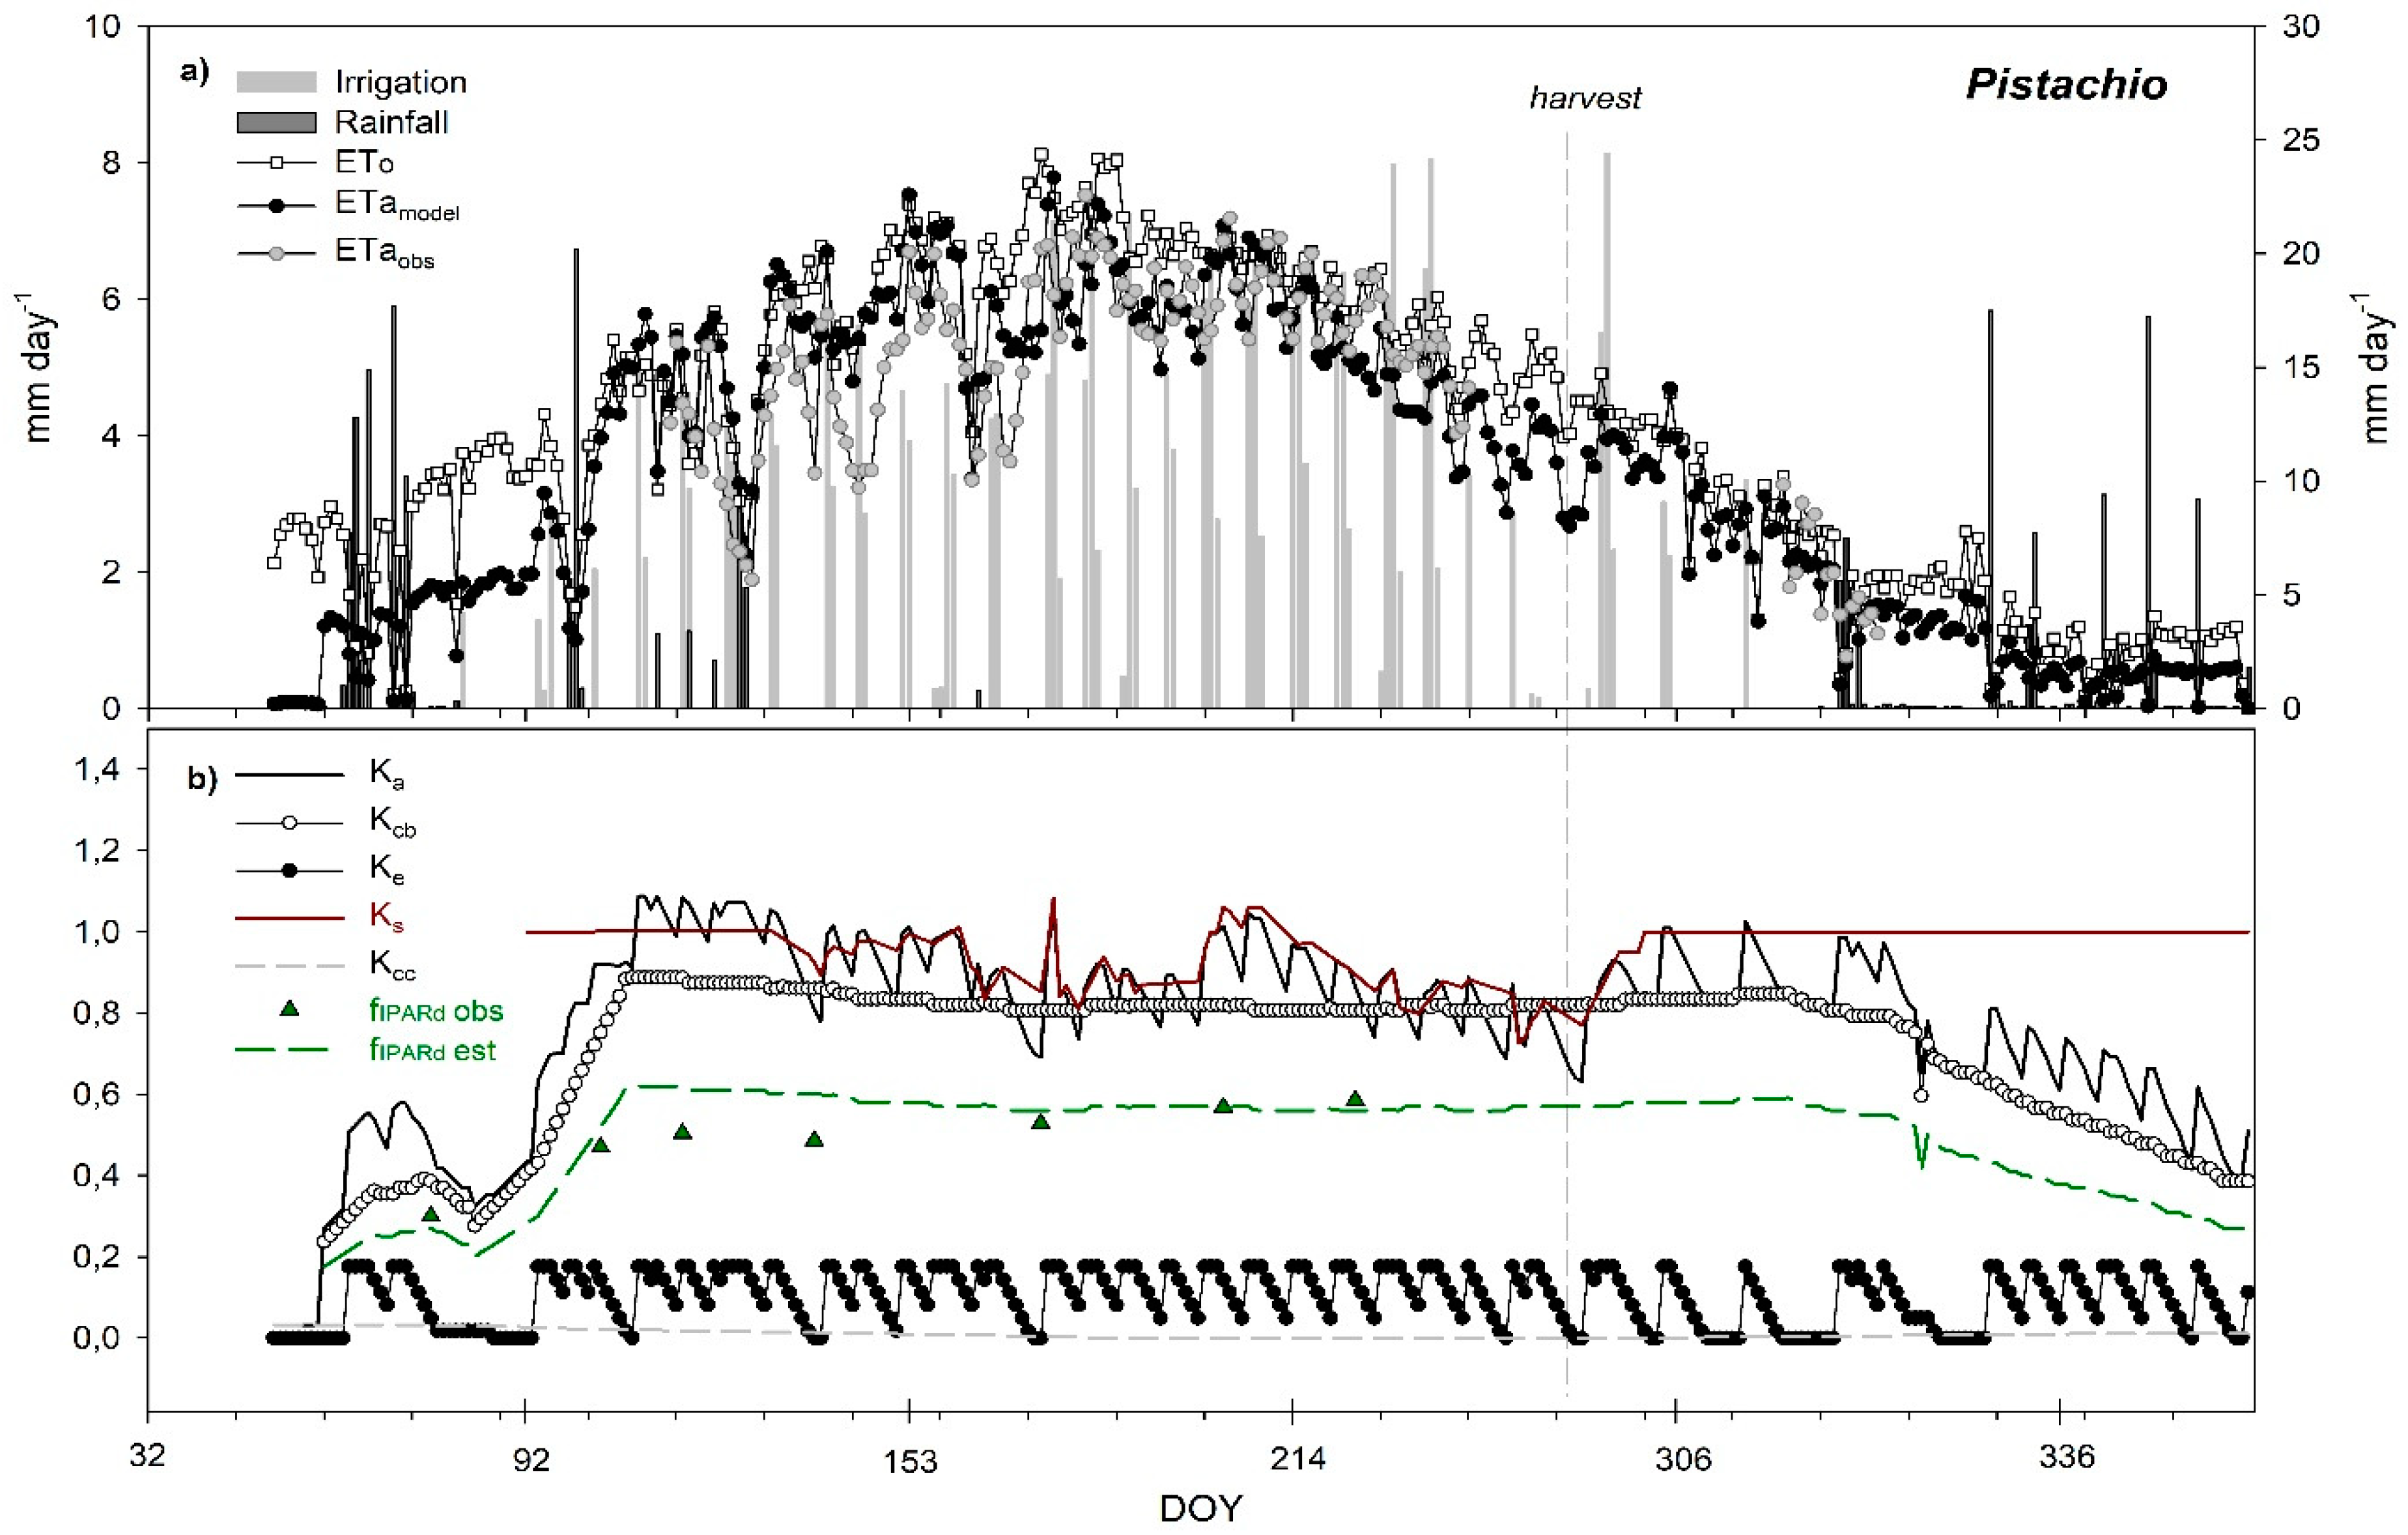
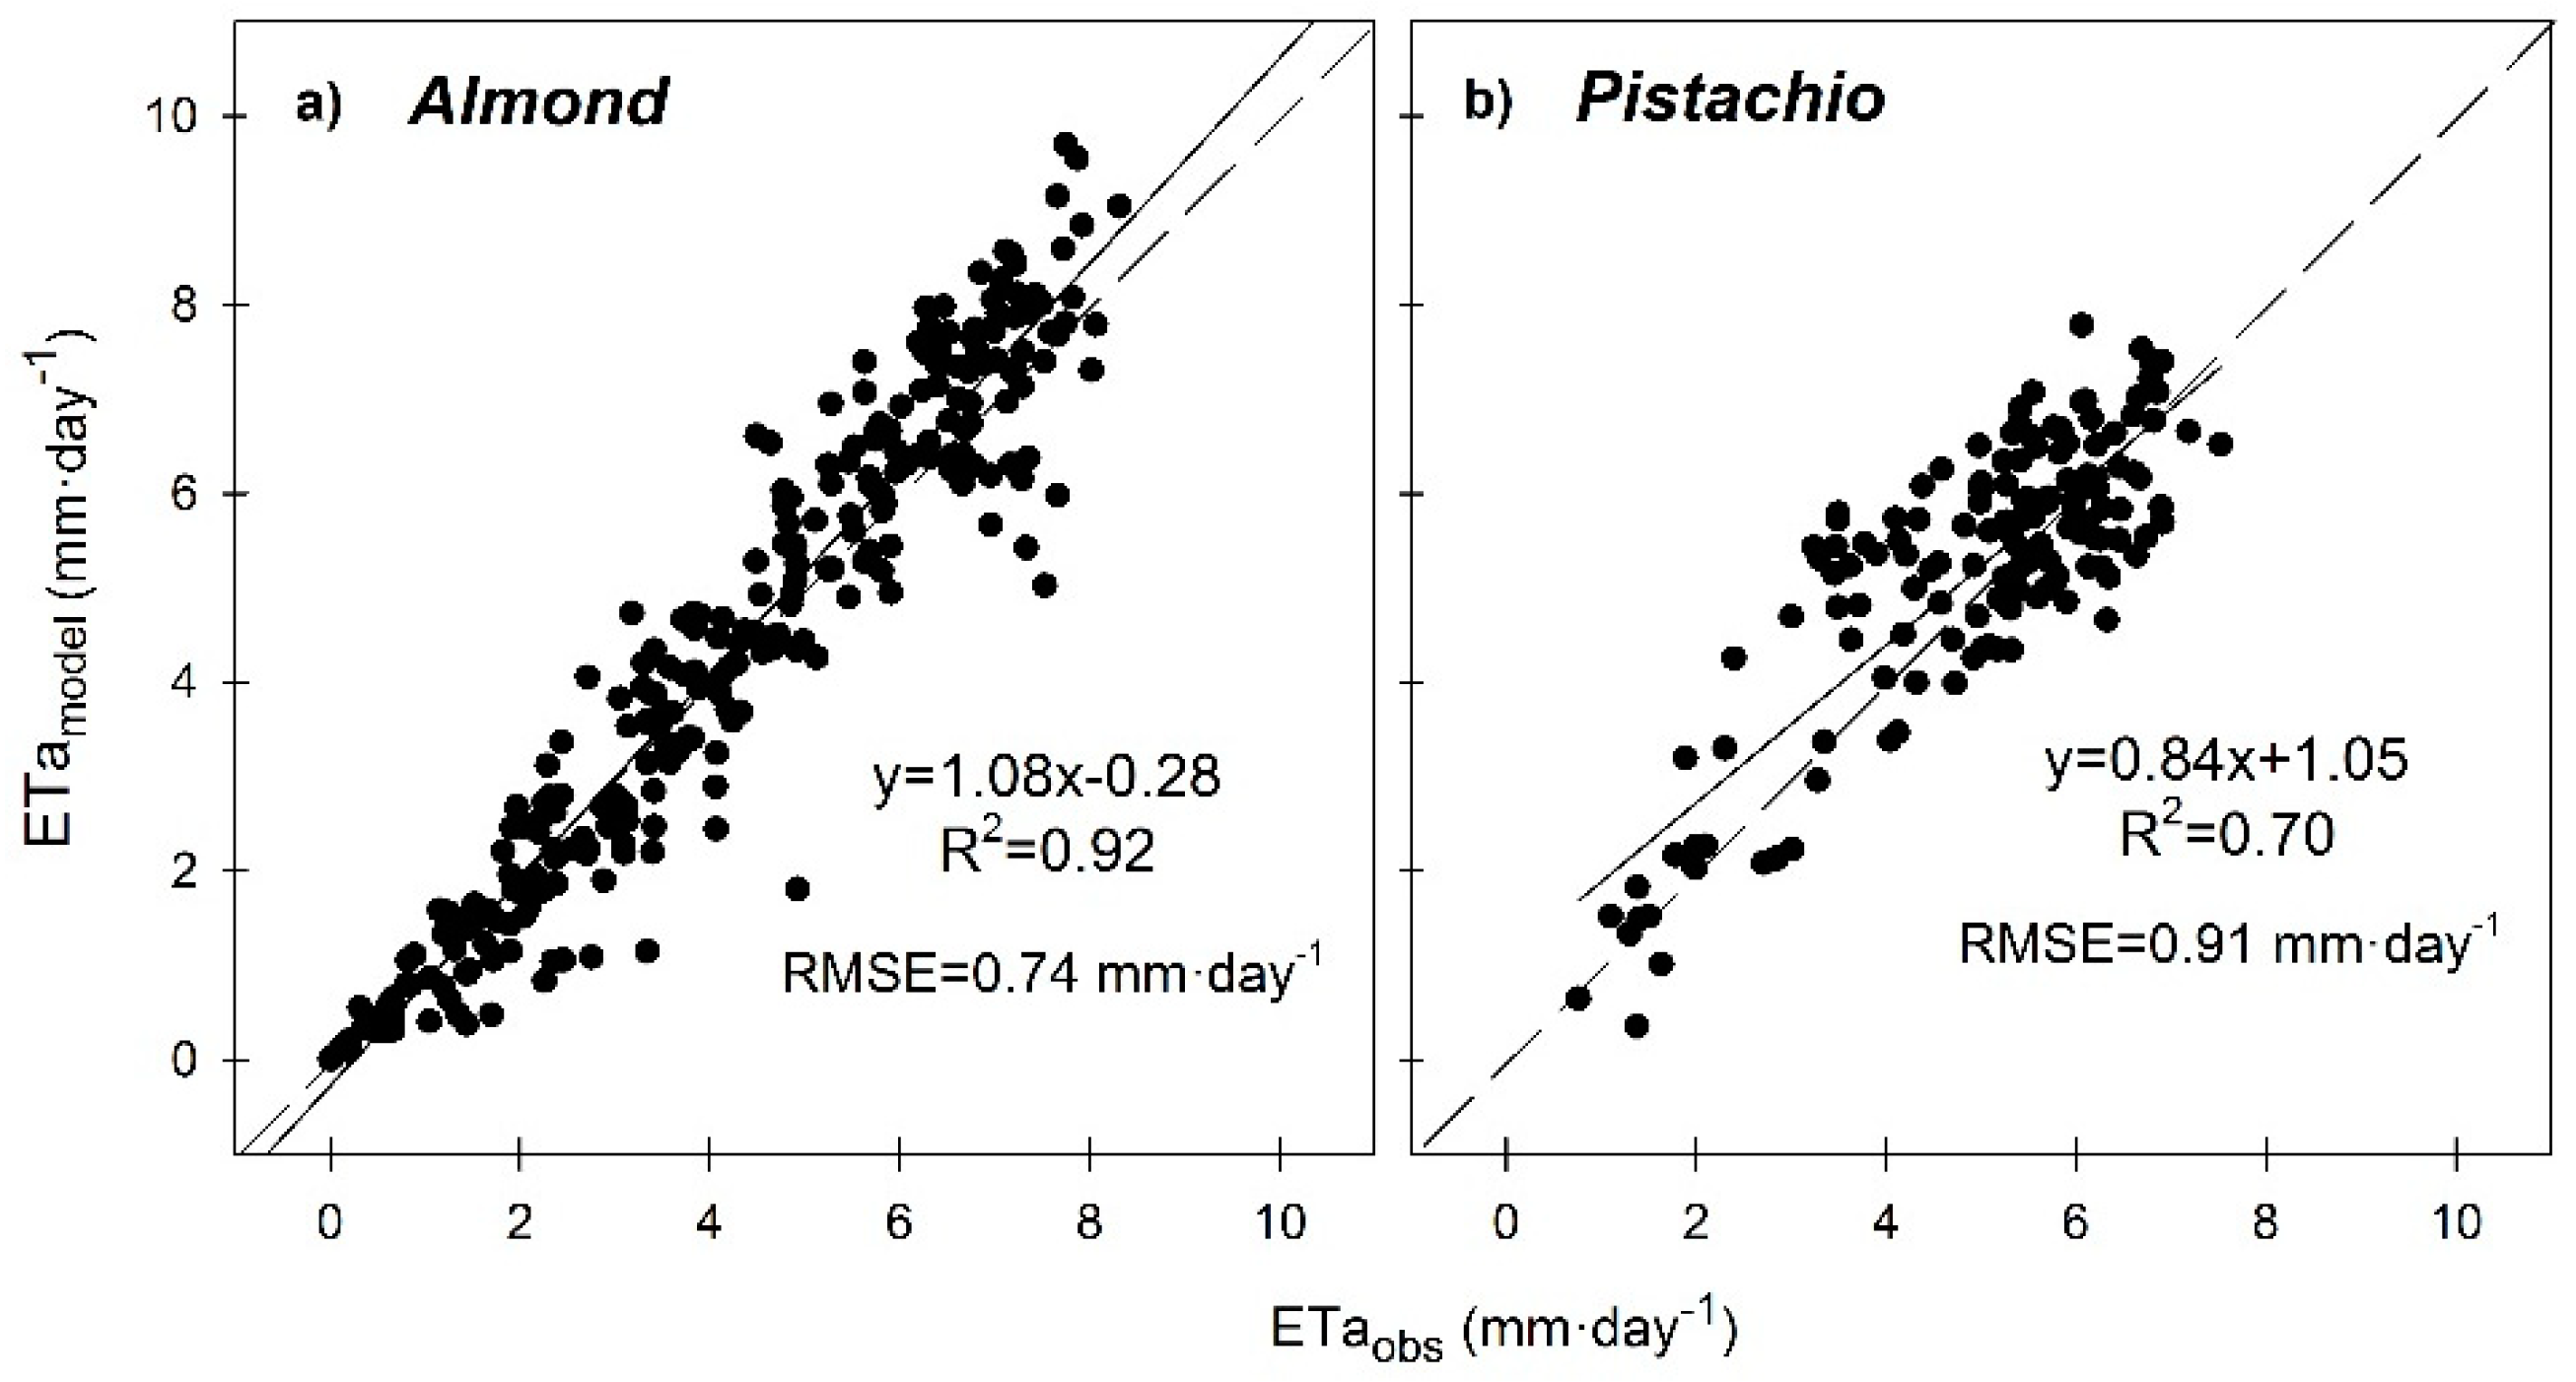
3.6. Seasonal Trend of Crop Evapotranspiration

Total estimated actual crop evapotranspiration (ETa) water consumption during the growing season, from DOY 61 to DOY 335, was 1194.9 and 1021.5 mm for almond and pistachio, respectively (Table 2); the cumulative ETo and rainfall were 1242 and 156.2 mm for the same period. The difference between water used through evapotranspiration and that applied through irrigation and rainfall accounted for 140.7 and 102.8 mm for almond and pistachio, respectively. This corresponded to the averaged amount of water stored in a sandy loam soil for all of the growing season. As previously mentioned, the amount of water loss due to soil evaporation (Esoil) accounted for 16.1% and 13.1% for almond and pistachio, respectively. On the other hand, the water consumption coming from vegetation ground cover (CC) was almost negligible, being 2.20% and 0.84% of total ETa for almond and pistachio, respectively.
The seasonal trend of both modelled and observed (flux tower data) actual crop evapotranspiration (ETamodel, ETaobs) is shown for the almond (Figure 9a) and pistachio (Figure 10a) orchards. In almonds, crop evapotranspiration increased sharply from early March to mid-July, when maximum values of ~8.5 mm·day−1 were achieved. After mid-July, ETamodel, ETaobs, and ETo dropped progressively until the end of the season. The decrease in ETa starting on DOY 226 corresponded with the drying period at harvest. During that period, transpiration declined to minimum values of 2.2 mm day−1 when the cv. Nonpareil and cv. Carmel were harvested, which corresponded to a measured Ψstem of −3.3 MPa. Although both ETamodel and ETaobs dropped during periods of low Ψstem, values of modelled ET (ETamodel) were lower than ETaobs. This phenomenon was observed to occur several times throughout the growing season (i.e., DOY 99, 100, 126, 162, 172, 193, 205, and 220), suggesting that either the model exaggerates water stress, or that it may be difficult to quantify water stress in almond using energy balance techniques. Spinelli et al. [23] suggested a similar conclusion. They argued that the unresponsiveness of LE to reductions in canopy conductance during periods of low Ψstem could be due to the influence of aerodynamic conductance (ga) [74], as well as the overriding contribution of LE coming from shaded leaves within a canopy, which respond less dramatically to water stress. The same study also indicated that because the response of LE to gs depends on ga, stress-related reductions in ET are more likely on a high wind speed day (high ga), than during a low ga (calm) day. Although these hypotheses may offer potential insights, this aspect deserves more attention in further studies. Moreover, this singularity was not seen in pistachios, though unfortunately we did not have the flux data needed throughout the growing season to confirm it, particularly during the drying harvest period. Crop evapotranspiration in pistachios followed the same trend as almonds, but ETa was slightly lower (Figure 10a). Maximum values reached to ~7.5 mm·day−1 (DOY 179).
After each irrigation event in the almond orchard, the actual crop coefficient (Ka) peaked to maximum values of 1.3 at full-development, which progressively decreased to minimum values at harvest (Figure 9b). Similar values were reported in mature almond trees [75,23]. However, values differ from those reported by Allen and Pereira [76] and Garcia-Tejero et al. [77], which indicated maximum values of 1.1 for the same period, although the latter study was conducted in younger trees. Ka also reflected weekly oscillations due to changes in water stress and Ke, which declined following each irrigation event. During harvest, modelled Ks was 0.2 indicating the presence of a drying period, which aligns with the observed depression of Ψstem during this period. The Kcb followed the same behavior as fIPARd, increasing it from DOY 50 to 85, when it reached maximum values of ~1.0. After that, Kcb followed a flat response until just before harvest, when a slight decrease in the estimated fraction of intercepted radiation (fIPARd est) was observed, probably due to start of leaf senescence. Kcb for almonds was derived from Marsal et al. [44], which showed that the modelled CropSyst [78] parameter Kcfc was the factor that linked fIPARd with Kcb. Therefore, Kcb from our study is comparable with the KT obtained by Espadafor et al. [59], which compared the parameter Kcfc with KT/fIPARd, and reported maximum KT values of 1.02 in almonds with 85 % of fIPARd.
In pistachio, Ka reached maximum values of 1.10 (DOY 120), coinciding with irrigation events, and reflecting rapid canopy development (Figure 10b). Maximum Ka values continued in the range 0.9–1.1 during July and August followed by a decline starting on DOY 320 due to leaf senescence. Similar values were reported by Goldhamer et al. [3] for mature pistachio trees with greater than 60 percent of canopy cover, although Kc values shown by Kanber et al. [79] were slightly lower. Kcb followed the same trend, increasing from 0.3 in April (DOY 90) to a maximum value of 0.9 in May (DOY 122) until leaf senescence. Despite irrigation being cut off for few days just before harvest, Ks did not decrease as much as in almonds, and minimum reported values reached to 0.65.

4. Conclusions and Perspective

We conclude from this study that remote sensing approaches based on the combination of simple ET-based models and thermal-based plant water status indicators can guide irrigation management. The simple ET model can be applicable at field scales, showing a high linear correlation near the 1:1 line and yielding a RMSE between measured and modeled daily ETa of 0.74 and 0.91 mm·day−1 for almond and pistachio, respectively (Figure 11). We have provided evidence that a dense time series of satellite-based multispectral images could be used in an operational way to estimate the basal crop coefficients (Kcb) in heterogeneous crops, based on empirical regressions with crop biophysical parameters such as LAI or fIPARd. This study also demonstrated that seasonal soil evaporation accounted for 13% to 16% of total ETc, reaching maximum rates immediately after rain and irrigation events, and depending in part, on the type of irrigation system.
In the absence of a useful, practical, and affordable tool for the grower to measure plant water status of an entire orchard, we have shown that thermal-based remote sensing can be successfully used to determine the water stress coefficient (Ks). The CWSI-Ψstem relationship (where Ks = 1 − CWSI) showed a temporally-variable seasonal response for both crops with r2 ranging from 0.54 to 0.82. These regressions can be used in irrigation scheduling of almond and pistachio, if Ψstem is either measured or estimated and a specific threshold value is selected.
Despite these results, the high cost and operational limitations of the acquisition of high resolution thermal imagery across the growing season demonstrates a significant constraint in using these technologies operationally for scheduling irrigation. Therefore, we suggest that future studies should focus on the use of decision-oriented crop models, which are fed by remote sensing data, and have the ability to spatially simulate crop water status and water requirements across the season. Sentinel (2 and 3) satellites of the European Space Agency (ESA) currently offer multispectral imagery every five days at 20 m resolution and thermal imagery at 1 km resolution on a daily basis. While most of scientific community agrees about the necessity of having a high-resolution thermal mission for agricultural purposes, new advances in image sharpening and data assimilation techniques can also be used to obtain thermal information at higher resolution and to use this information to feed crop models.

Author Contributions

J.B., L.P., and D.R.S. conceived and designed the experiments; J.B. had the lead in the field research, conducted experiments, analyzed the data, and drafted the manuscript; K.A., S.B., and L.P helped in the field campaign; and B.L.S contributed in the calibration of the surface renewal data in almonds with the alpha weighting factors. All authors provided comments and revisions.

Funding

This research was funded by the California Department of Food and Agriculture (CDFA), grant number SCB15046.

Acknowledgments

This study was funded by the California Department of Food & Agriculture (CDFA) under the Specialty Crop Block Grant Program, through the project ‘Real-time irrigation metrics for improved water use efficiency in orchards and vineyards’ (SCB15046). The authors also gratefully acknowledge the insights of Rebekah Vaughn and Christine Stockert from the Department of Viticulture and Enology of UC Davis, for their collaboration during the field campaign and Michael Whiting and the Center for Spatial Technologies and Remote Sensing (CSTARS) of the Department of Land, Air and Water Resources of UC Davis, for their contribution in the image corrections and to borrow us the field equipment.

Conflicts of Interest

The authors declare no conflict of interest.

References

  1. California Department of Food and Agriculture (CDFA). California Agricultural Statistics Review 2016–2017. 2017. Available online: https://www.cdfa.ca.gov/Statistics/PDFs/2016-17AgReport.pdf (accessed on 12 July 2018).
  2. California Legislative Information. Assembly Bill No. 1067. 2017; Chapter 49. Available online: https://leginfo.legislature.ca.gov/faces/billTextClient.xhtml?bill_id=201720180AB1067 (accessed on 12 July 2018).
  3. Goldhamer, D.A.; Kjelgren, R.; Williams, R.; Beede, R. Water use requirements of pistachio trees and response to water stress. In Proceedings of the National conference on advances in evapotranspiration, Chicago, IL, USA, 16–17 December 1985; pp. 216–273. [Google Scholar]
  4. Fereres, E.; Goldhamer, D.A. Irrigation of deciduous fruit and nut trees. In Irrigation of Agricultural Crops; Stewart, B.A., Nielsen, D.R., Eds.; Agronomy Monograph 30; American Society of Agronomy: Madison, WI, USA, 1990; pp. 987–1017. [Google Scholar]
  5. Goldhamer, D.A.; Viveros, M.; Salinas, M. Regulated deficit irrigation in almonds: Effects of variations in applied water and stress timing on yield and yield components. Irrig. Sci. 2006, 24, 101–114. [Google Scholar] [CrossRef]
  6. Goldhamer, D.A.; Fereres, E. Establishing an almond water production function for California using long-term yield response to variable irrigation. Irrig. Sci. 2017, 35, 169–179. [Google Scholar] [CrossRef]
  7. Goldhamer, D.A. Irrigation Scheduling. In Almond Production Manual; Micke, W.C., Ed.; Division of Agriculture and Natural Resources, University of California: Davis, CA, USA, 1996; pp. 171–178. [Google Scholar]
  8. Goldhamer, D.A.; Beede, R. Regulated deficit irrigation effects on yield, nut quality and water-use efficiency of mature pistachio trees. J. Hortic. Sci. Biotechnol. 2004, 79, 538–545. [Google Scholar] [CrossRef]
  9. AghaKouchak, A.; Cheng, L.; Mazdiyasni, O.; Farahmand, A. Global warming and changes in risk of concurrent climate extremes: Insights from the 2014 California drought. Geophys. Res. Lett. 2014, 41, 8847–8852. [Google Scholar] [CrossRef] [Green Version]
  10. Ferreira, M.I. Stress coefficients for soil water balance combined with water stress indicators for irrigation scheduling of woody crops. Horticulturae 2017, 3, 38. [Google Scholar] [CrossRef]
  11. Calera, A.; Campos, I.; Osann, A.; D’Urso, G.; Menenti, M. Remote sensing for crop water management: From ET modelling to services for the end users. Sensors 2017, 17, 1104. [Google Scholar] [CrossRef]
  12. Johnson, L.F.; Trout, T.J. Satellite NDVI assisted monitoring of vegetable crop evapotranspiration in California’s San Joaquin Valley. Remote Sens. 2012, 4, 439–455. [Google Scholar] [CrossRef]
  13. Nieto, N.; Sandholt, I.; Olander, R.; Guzinski, R.; Bellvert, J.; Boye, L.; Blüthgen, J.; Bondo, T. Review of Remote Sensing for Evapotranspiration Models; Sentinels for Evapotranspiration project (4000121772/17/I-NB). 2018. Available online: http://esa-sen4et.org/outputs/methodology-review/ (accessed on 11 February 2018).
  14. Bastiaanssen, W.; Menenti, M.; Feddes, R.; Holtslag, A. A remote sensing surface energy balance algorithm for land (SEBAL): 1. Formulation. J. Hydrol. 1998, 212, 198–212. [Google Scholar] [CrossRef]
  15. Kustas, W.P.; Norman, J.M. Evaluation of soil and vegetation heat flux predictions using a simple two-source model with radiometric temperatures for partial canopy cover. Agric. Meteorol. 1999, 94, 13–29. [Google Scholar] [CrossRef]
  16. Allen, R.G.; Irmak, A.; Trezza, R.; Hendrickx, J.M.H.; Bastiaanssen, W.; Kjaersgaard, J. Satellite-based ET estimation in agriculture using SEBAL and METRIC. Hydrol. Process. 2011, 25, 4011–4027. [Google Scholar] [CrossRef]
  17. Allen, R.; Tasumi, M.; Trezza, R. Satellite-Based Energy Balance for Mapping Evapotranspiration with Internalized Calibration (METRIC)-Model. J. Irrig. Drain. Eng. 2007, 133, 380–394. [Google Scholar] [CrossRef]
  18. Senay, G.B.; Budde, M.; Verdin, J.P.; Melesse, A.M. A coupled remote sensing and simplified surface energy balance approach to estimate actual evapotranspiration from irrigated fields. Sensors 2007, 7, 979–1000. [Google Scholar] [CrossRef]
  19. López, G.; Echevarria, G.; Bellvert, J.; Mata, M.; Behboudian, M.H.; Girona, J.; Marsal, J. Water stress for a short period before harvest in nectarine: Yield, fruit composition, sensory quality, and consumer acceptance of fruit. Sci. Hortic. 2016, 211, 1–7. [Google Scholar] [CrossRef]
  20. Moriana, A.; Orgaz, F.; Pastor, M.; Fereres, E. Yield responses of mature olive orchard to water deficits. J. Am. Soc. Hortic. Sci. 2003, 123, 425–431. [Google Scholar]
  21. Galindo, A.; Collado-González, J.; Griñán, I.; Centeno, A.; Martín-Palomo, M.J.; Girón, I.F.; Rodríguez, P.; Cruz, Z.N.; Hemmi, H.; Carbonell-Barrachina, A.A.; et al. Deficit irrigation and emergint fruit crops as strategy to save water in Mediterranean semiarid agrosystems. Agric. Water Manag. 2018, 202, 311–324. [Google Scholar] [CrossRef]
  22. Blanco, V.; Domingo, R.; Pérez-Pastor, A.; Blaya-Ros, P.J.; Torres-Sánchez, R. Soil and plant water indicators for deficit irrigation management of field-grown sweet cherry trees. Agric. Water Manag. 2018, 208, 83–94. [Google Scholar] [CrossRef]
  23. Spinelli, G.M.; Snyder, R.L.; Sanden, B.L.; Shackel, K.A. Water stress causes stomatal closure but does not reduce canopy evapotranspiration in almond. Agric. Water Manag. 2016, 168, 11–22. [Google Scholar] [CrossRef]
  24. McCutchan, H.; Schackel, K.A. Stem-water potential as a sensitivity of water stress (Prunus domestica L.). J. Am. Soc. Hortic. Sci. 1992, 117, 607–611. [Google Scholar]
  25. Garnier, E.; Berger, A. Testing water potential in peach trees as an indicator of water stress. J. Hortic. Sci. 1985, 60, 47–56. [Google Scholar] [CrossRef]
  26. Choné, X.; Cornelis, V.L.; Dubourdieu, D.; Gaudillères, J.P. Stem water potential is a sensitive indicator of grapevine water status. Ann. Bot. 2001, 87, 477–483. [Google Scholar] [CrossRef]
  27. González-Dugo, V.; Zarco-Tejada, P.; Nicolas, E.; Nortes, P.A.; Alarcon, J.J.; Intrigliolo, D.S.; Fereres, E. Using high resolution UAV thermal imagery to assess the variability in the water status of five fruit tree species within a commercial orchard. Precis. Agric. 2013, 14, 660–678. [Google Scholar] [CrossRef]
  28. Bellvert, J.; Marsal, J.; Girona, J.; Zarco-Tejada, P.J. Seasonal evolution of crop water stress index in grapevine varieties determined with high-resolution remote sensing thermal imagery. Irrig. Sci. 2015, 33, 81–93. [Google Scholar] [CrossRef]
  29. Bellvert, J.; Marsal, J.; Girona, J.; González-Dugo, V.; Fereres, E.; Ustin, S.; Zarco-Tejada, P.J. Airborne thermal imagery to detect the seasonal evolution of plant water status in peach, nectarine and Saturn peach orchards. Special issue: Remote Sensing in Precision Agriculture. Remote Sens. 2016, 8, 39. [Google Scholar] [CrossRef]
  30. Idso, S.B.; Jackson, R.D.; Pinter, P.J.; Reginato, R.J.; Hatfield, J.L. Normalizing the stress-degree day parameter for environmental variability. Agric. Meteorol. 1981, 24, 45–55. [Google Scholar] [CrossRef]
  31. Jackson, R.D.; Idso, S.B.; Reginato, R.J.; Pinter, P.J. Canopy temperature as a crop water stress indicator. Water Resour. Res. 1981, 17, 1133–1138. [Google Scholar] [CrossRef]
  32. SoilWeb—Interactive map of USDA-NCSS soil survey data for locations throughout most of the U.S. Calif. Soil Resour. Lab UC Davis UC-ANR Collab. with USDA Nat. Resour. Conserv. Serv. 2015. Available online: https://casoilresource.lawr.ucdavis.edu/soilweb-apps/ (accessed on 12 July 2018).
  33. Baram, S.; Couvreur, V.; Harter, T.; Brown, P.H.; Hopmans, J.W.; Smart, D.R. Assessment of orchard N losses to groundwater with vadose zone monitoring network. Agric. Water Manag. 2016, 172, 83–95. [Google Scholar] [CrossRef]
  34. McCutchan, H.; Shackel, K.A. Stem water potential as a sensitive indicator of water stress in prune trees (Prunus domestica L. cv French). J. Am. Soc. Hortic. Sci. 1992, 117, 607–611. [Google Scholar]
  35. Oyarzun, R.A.; Stöckle, C.O.; Whiting, M.D. A simple approach to modeling radiation interception by fruit-tree orchards. Agric. For. Meteorol. 2007, 142, 12–24. [Google Scholar] [CrossRef]
  36. Norman, J.M.; Campbell, G.S. Canopy structure. In Plant Physiological Ecology: Field Methods and Instrumentation; Pearcy, R.W., Mooney, H.A., Ehleringer, J.R., Rundel, P.W., Eds.; Chapman and Hall: New York, NY, USA, 1989; pp. 301–325. [Google Scholar]
  37. Paw, U.; Qiu, K.T.J.; Su, H.B.; Watanabe, T.; Brunet, Y. Surface renewal analysis: A new method to obtain scalar fluxes without velocity data. Agric. Meteorol. 1995, 74, 119–137. [Google Scholar]
  38. Castellví, F.; Snyder, R.L. Sensible heat flux estimates using surface renewal analysis: A study case over a peach orchard. Agric. Meteorol. 2009, 149, 1397–1402. [Google Scholar] [CrossRef]
  39. Shapland, T.M.; Snyder, R.L.; Paw, U.K.T.; McElrone, A.J. Thermocouple frequency response compensation leads to convergence of the surface renewal alpha calibration. Agric. Meteorol. 2014, 189–190, 36–47. [Google Scholar] [CrossRef]
  40. Spinelli, G.M.; Snyder, R.L.; Sanden, B.L.; Gilbert, M.; Shackel, K.A. Low and variable atmospheric coupling in irrigated almond (Prunus dulcis) canopies indicates a limited influence of stomata on orchard evapotranspiration. Agric. Water Manag. 2018, 196, 57–65. [Google Scholar] [CrossRef]
  41. California irrigation management information system (CIMIS). Available online: https://cimis.water.ca.gov/ (accessed on 12 July 2018).
  42. Allen, R.G.; Pereira, L.S.; Raes, D.; Smith, M. Crop Evapotranspiration-Guidelines for Computing Crop Water Requirements; FAO: Rome, Italy, 1998; p. 297. [Google Scholar]
  43. Picón-Toro, J.; González-Dugo, V.; Uriarte, D.; Mancha, L.A.; Testi, L. Effects of canopy size and water stress over the crop coefficient of a “Tempranillo” vineyard in south-western Spain. Irrig. Sci. 2012, 30, 419–432. [Google Scholar] [CrossRef] [Green Version]
  44. Marsal, J.; Johnson, S.; Casadesús, J.; Lopez, G.; Girona, J.; Stöckle, C. Fraction of canopy intercepted radiation related differently with crop coefficient depending on the season and the fruit tree species. Agric. Meteorol. 2014, 184, 1–11. [Google Scholar] [CrossRef]
  45. Goldhamer, D.A. Tree water requirements & regulated deficit irrigation. In Pistachio Production Manual, 4th ed.; Beede, R.H., Freeman, M.W., Haviland, D.R., Holtz, B.A., Kallsen, C.E., Eds.; University of California: Davis, CA, USA, 2005; Available online: http://fruitsandnuts.ucdavis.edu/dsadditions/Pistachio_Manual_2005/ (accessed on 12 July 2018).
  46. Fereres, E.; Martinich, D.A.; Aldrich, T.M.; Castel, J.R.; Holzapfel, E.; Schulbach, H. Drip irrigation saves money in young almond orchards. Calif. Agric. 1982, 36, 12–13. [Google Scholar]
  47. Testi, L.; Goldhamer, D.A.; Iniesta, F.; Salinas, M. Crop water stress index is a sensitive water stress indicator in pistachio trees. Irrig. Sci. 2008, 26, 395–405. [Google Scholar] [CrossRef] [Green Version]
  48. Saxton, K.E.; Rawls, W.J.; Romberger, J.S.; Papendick, R.I. Estimating generalized soil water characteristics from texture. Trans. ASAE 1986, 50, 1031–1035. [Google Scholar] [CrossRef]
  49. Rocha, J.; Perdiao, A.; Melo, R.; Henriques, C. Remote Sensing Based Crop Coefficients for Water Management in Agriculture. In Sustainable Development—Authoritative and Leading Edge Content for Environmental Management; Curkovic, S., Ed.; IntechOpen Limited: London, UK, 2012; Chapter 8; pp. 167–191. [Google Scholar] [CrossRef]
  50. Zarate-Valdez, J.L.; Whiting, M.L.; Lampinen, B.D.; Metcalf, S.; Ustin, S.; Brown, P.H. Prediction of leaf area index in almonds by vegetation indexes. Comp. Electr. Agric. 2012, 85, 24–32. [Google Scholar] [CrossRef]
  51. Guillén-Climent, M.L.; Zarco-Tejada, P.J.; Villalobos, F.J. Estimating radiation interception in an olive orchard using physical models and multispectral airborne imagery. Isr. J. Plant Sci. 2012, 60, 107–121. [Google Scholar] [CrossRef] [Green Version]
  52. Campos, I.; Neale, C.M.U.; Calera, A.; Balbontin, C.; González-Piqueras, J. Assessing satellite-based basal crop coefficients for irrigated grapes (Vitis vinifera L.). Agric. Water Manag. 2010, 98, 45–54. [Google Scholar] [CrossRef]
  53. Odi-Lara, M.; Campos, I.; Neale, C.M.U.; Ortega-Farias, S.; Poblete-Echeverria, C.; Balbontin, C.; Calera, A. Estimating Evapotranspiration of an Apple Orchard Using a Remote Sensing–Based Soil Water Balance. Remote Sens. 2016, 8, 253. [Google Scholar] [CrossRef]
  54. López-López, M.; Espadafor, M.; Testi, L.; Lorite, I.J.; Orgaz, F.; Fereres, E. Yield response of almond trees to transpiration deficits. Irrig. Sci. 2018, 36, 111–120. [Google Scholar] [CrossRef]
  55. Iniesta, F.; Testi, L.; Goldhamer, D.A.; Fereres, E. Quantifying reductions in consumptive water use under regulated dèficit irrigation in pistachio (Pistacia vera L.). Agric. Water Manag. 2008, 95, 877–886. [Google Scholar] [CrossRef]
  56. Bonachela, S.; Orgaz, F.; Villalobos, F.J.; Fereres, E. Measurement and simulation of evaporation from soil in olive orchards. Irrig. Sci. 1999, 18, 205–211. [Google Scholar] [CrossRef]
  57. Jackson, R.D. Canopy temperature and crop water stress. In Advances in Irrigation; Hillel, D., Ed.; Academic Press: New York, NY, USA, 1982; pp. 43–85. [Google Scholar]
  58. Klein, I.; Esparza, G.; Weinbaum, S.A.; DeJong, T.M. Effects of irrigation deprivation during the harvest period on leaf persistence and function in mature almond trees. Tree Physiol. 2001, 21, 1063–1072. [Google Scholar] [CrossRef] [Green Version]
  59. Espadafor, M.; Orgaz, F.; Testi, L.; Lorite, I.J.; Villalobos, F.J. Transpiration of young almond trees in relation to intercepted radiation. Irrig. Sci. 2015, 33. [Google Scholar] [CrossRef]
  60. Hernández-Santana, V.; Rodríguez-Dominguez, C.M.; Fernández, J.E.; Diaz-Espejo, A. Role of leaf hydraulic conductance in the regulation of stomatal conductance in almond and olive in response to water stress. Tree Physiol. 2016, 36, 725–735. [Google Scholar] [CrossRef] [Green Version]
  61. Rahimi-Eichi, V. Water use efficiency in almonds (Prunus dulcis (Mill.) D.A. Webb. Master’s Thesis, School of Agriculture, Food and Wine, Faculty of Science, University of Adelaide, Adelaide, Australia, July 2013. Available online: https://digital.library.adelaide.edu.au/dspace/bitstream/2440/87112/8/02whole.pdf (accessed on 12 July 2018).
  62. Memmi, H.; Couceiro, J.F.; Gijón, C.; Pérez-López, D. Impacts of water stress, environment and rootstocks on the diurnal behavior of stem water potential and leaf conductance in pistachio (Pistachio vera L.). Span. J. Agric. Res. 2016, 14, 2. [Google Scholar] [CrossRef]
  63. Castel, J.R.; Fereres, E. Responses of young almond trees to two drought periods in the field. J. Hortic. Sci. 1982, 57, 175–187. [Google Scholar] [CrossRef]
  64. Torrecillas, A.; Ruiz-Sanchez, M.C.; Leon, A.; Garcia, A.L. Stomatal response to leaf water potential in almond trees under drip irrigated and non irrigated conditions. Plant and Soil 1988, 112, 151–153. [Google Scholar] [CrossRef]
  65. González-Dugo, V.; Goldhamer, D.; Zarco-Tejada, P.J.; Fereres, F. Improving the precision of irrigation in a pistachio farm using an unmanned airborne thermal system. Irrig. Sci. 2014, 33, 43–52. [Google Scholar] [CrossRef] [Green Version]
  66. Camino, C.; Zarco-Tejada, P.J.; González-Dugo, V. Effects of Heterogeneity within Tree Crowns on Airborne-Quantified SIF and the CWSI as Indicators of Water Stress in the Context of Precision Agriculture. Remote Sens. 2018, 10, 604. [Google Scholar] [CrossRef]
  67. Hsiao, T.G. Plant responses to water stress. A. Rev. Plant Physiol. 1973, 24, 519–570. [Google Scholar] [CrossRef]
  68. Turner, N.C. Stomatal behavior and water status of maize, sorghum, and tobacco under field conditions. II. At low soil water potential. Plant Physiol. 1974, 53, 360–365. [Google Scholar] [CrossRef] [PubMed]
  69. Begg, J.E.; Tonnet, M.L. Osmotic adjustment of sorghum and sunflower crops in response to water deficits and its influence on the water potential at which stomata close. Aust. J. PL Physiol. 1978, 5, 597–608. [Google Scholar]
  70. Hinckley, T.M.; Duhme, F.; Hinckey, A.R.; Richter, H. Water relations of drought-hardy shrubs: osmotic potential and stomatal reactivity. Pl. Cell. Environ. 1980, 3, 131–140. [Google Scholar]
  71. Behboudian, M.H.; Walker, R.R.; Törökfalvy, E. Effects of water stress and salinity on photosynthesis of pistachio. Sci. Hort. 1986, 29, 251–261. [Google Scholar] [CrossRef]
  72. Germana, C. The response of pistachio trees to water stress as affected by two different rootstocks. Acta Hort. 1997, 449, 513–519. [Google Scholar] [CrossRef]
  73. Gijón, M.C.; Gimenez, C.; Perez-López, D.; Guerrero, J.; Couceiro, J.F.; Moriana, A. Water relations of pistachio (Pistacia vera L.) as affected by phenological stages and water regimes. Sci. Hortic. 2011, 128, 415–422. [Google Scholar]
  74. Jarvis, P. Coupling of transpiration to the atmosphere in horticultural crops: the omega factor. In ISHS Acta Horticulturae 171, Proceedings of the I International Symposium on Water Relations in Fruit Crops, Pisa, Italy, 3–5 September 1984; ISHS; University of Wisconsin: Madison, WI, USA, 1985. [Google Scholar]
  75. Stevens, R.M.; Ewenz, C.M.; Grigson, G.; Conner, S.M. Water use by an irrigated almond orchard. Irrig. Sci. 2012, 30, 189–200. [Google Scholar] [CrossRef]
  76. Allen, R.G.; Pereira, L.S. Estimating crop coefficients from fraction of ground cover and height. Irrig. Sci. 2009, 28, 17–34. [Google Scholar] [CrossRef]
  77. García-Tejero, I.F.; Hernández, A.; Rodríguez, V.M.; Ponce, J.R.; Ramos, V.; Muriel, J.L.; Durán-Zuazo, V.H. Estimating almond crop coefficients and physiological response to water stress in semiarid environments (SW Spain). J. Agr. Sci. Tech. 2015, 1, 1255–1266. [Google Scholar]
  78. Stöckle, C.O.; Donatelli, M.; Nelson, R. CropSyst, a cropping systems simulation model. Eur. J. Agron. 2003, 18, 289–307. [Google Scholar] [CrossRef] [Green Version]
  79. Kanber, R.; Yazar, A.; Ónder, S.; Köksal, H. Irrigation response of pistachio (Pistacia vera L.). Irrig. Sci. 1993, 14, 7–14. [Google Scholar] [CrossRef]
Figure 1. Study area (red squares) shown as: (a) true color image of Central Valley (California) from Google Earth; (b) thermal mosaic of the almond (36°49′12.59″N; 120°12′38.30″W) and pistachio (36°50′26.68″N; 120°13′31.80″W) orchard acquired on the 11th August 2016, and (c) detailed thermal mosaic of both orchards indicating the location of the flux towers.
Remotesensing 10 02001 g001
Figure 2. Images from the airborne flight on July 21, 2016 showing the crowns of individual trees in our almond (upper) and pistachio (lower) study plots (yellow trapezoid). Images on the left (a,a’) are RGB photos of the almond and pistachio study orchards, in the middle (b,b’) are false-color near infrared images and images on the right (c,c’) are the thermal images showing the extraction of pure vegetation pixels to estimate canopy temperature.
Remotesensing 10 02001 g002
Figure 3. Seasonal trends of averaged (a) stem water potential (Ψstem), and (b) volumetric soil water content (θv) in the top 0.9 m of the soil profile in the three plots of the almond and pistachio. Dashed lines indicated harvest dates for almond (the two lines indicated the harvest for cvs. Nonpareil and Carmel) and pistachios.
Remotesensing 10 02001 g003
Figure 4. (a) Seasonal trends of the normalized difference vegetation index (NDVI), (b) relationships between NDVI and daily fraction of intercepted radiation (fIPARd), and (c) relationship between NDVI and leaf area index (LAI), for the almond and pistachio orchard, obtained from Landsat-8 imagery.
Remotesensing 10 02001 g004
Figure 5. Relationship between the soil water evaporation coefficient (Ke) and the number of days after each irrigation event, in the almond (micro-sprinkler irrigation) and pistachio (drip irrigation) orchards.
Remotesensing 10 02001 g005
Figure 6. Seasonal response of Tc − Ta to VPD in mature almond trees, using data from two infrared temperature sensors (IRT-1 and IRT-2). The linear regression equations for the non-water stress baselines (NWSB) at the early (DOY 106-190) and late (DOY 191-221) growth stages were y = −1.248x + 0.922 and y = −2.011x + 5.518, respectively. The regression equations for the lower limit (Tc − Ta)LL at the same dates were y = −1.088x − 0.413 and y = −1.553x + 2.860.
Remotesensing 10 02001 g006
Figure 7. Seasonal evolution of the CWSI in mature almond trees, obtained by air and canopy temperature measurements at 14:00h. CWSI was calculated using the baselines shown in Figure 6.
Remotesensing 10 02001 g007
Figure 8. Seasonal relationships between the remotely-sensed CWSI and measured stem water potential (Ψstem) for (a) almond and (b) pistachio trees, corresponding to dates of 17th May (DOY 138), 22 June (DOY 174), 21 July (DOY 203), and 11 August (DOY 224). Equations and coefficients of determination (r2) of the regressions were as follows: in almond, y = −1.281x − 1.122, R2 = 0.82 (DOY 138), y = −1.084x − 1.144, R2 = 0.54 (DOY 174), y = −1.517x − 1.054, R2 = 0.70 (DOY 203), y = −1.409x − 1.533, R2 = 0.80 (DOY 224); and pistachio, y = −1.246x2 + 0.005x − 0.489, R2 = 0.61 (DOY 138), y =− 3.051x2 + 0.723x − 1.112, R2 = 0.70 (DOY 174), y = −2.539x2 − 0.883x − 1.179, R2 = 0.77 (DOY 203), y = −2.264x2 − 1.537x − 1.201, R2 = 0.74 (DOY 224).
Remotesensing 10 02001 g008
Figure 9. Seasonal trends of the different parameters contributing to evapotranspiration of the almond orchard: (a) ETamodel and ETaobs (flux tower) throughout the growing season along with ETo, rainfall and irrigation; (b) modeled actual crop coefficient (Ka), basal crop coefficient (Kcb), soil water evaporation coefficient (Ke), water stress coefficient (Ks), cover crop coefficient (Kcc), and the observed (fIPARd obs) and estimated (fIPARd est) daily fraction of intercepted radiation.
Remotesensing 10 02001 g009
Figure 10. Seasonal trend of the different parameters contributing to evapotranspiration of the pistachio orchard: (a) ETamodel and ETaobs (flux tower) throughout the growing season along with ETo, rainfall and irrigation; (b) modeled actual crop coefficient (Ka), basal crop coefficient (Kcb), soil water evaporation coefficient (Ke), water stress coefficient (Ks), cover crop coefficient (Kcc), and the observed (fIPARd obs) and estimated (fIPARd est) daily fraction of intercepted radiation.
Remotesensing 10 02001 g010
Figure 11. Comparison between observed (flux towers) and modelled actual daily evapotranspiration (ETaobs, ETamodel) in (a) almonds and (b) pistachios.
Remotesensing 10 02001 g011
Table 1. Monthly averaged alpha weighting factors (α+ and α-) for mature almonds located in Belridge (CA, USA) during the period 2008-2011. Source: Blake Sanden, Cooperative Extension at the University of California, Davis.
FebMarAprMayJuneJulyAugSepOctNov
α+0.8810.8010.6770.6770.6770.6500.6700.8490.8330.878
α-0.3160.2010.2060.2060.2060.2000.2200.2260.1830.153
Table 2. Values of reference evapotranspiration (ETo), rainfall, irrigation, modeled actual evapotranspiration (ETamodel) and transpiration (Tmodel), soil evaporation (Esoil) and ground cover crop water consumption (CC), all in mm, during the growing season (from DOY 61 to 335) for almond and pistachio.
AlmondPistachio
ETo (mm)1242
Rainfall (mm)156.2
Irrigation (mm)898.0762.5
ETamodel (mm)1194.91021.5
Tmodel (mm)975.7878.9
Esoil (mm)192.9134.0
CC (mm)26.38.6
Water loss in Esoil (%)16.113.1

