Evaluating MODIS Dust-Detection Indices over the Arabian Peninsula


Abstract
1. Introduction
1.1. Previous Work
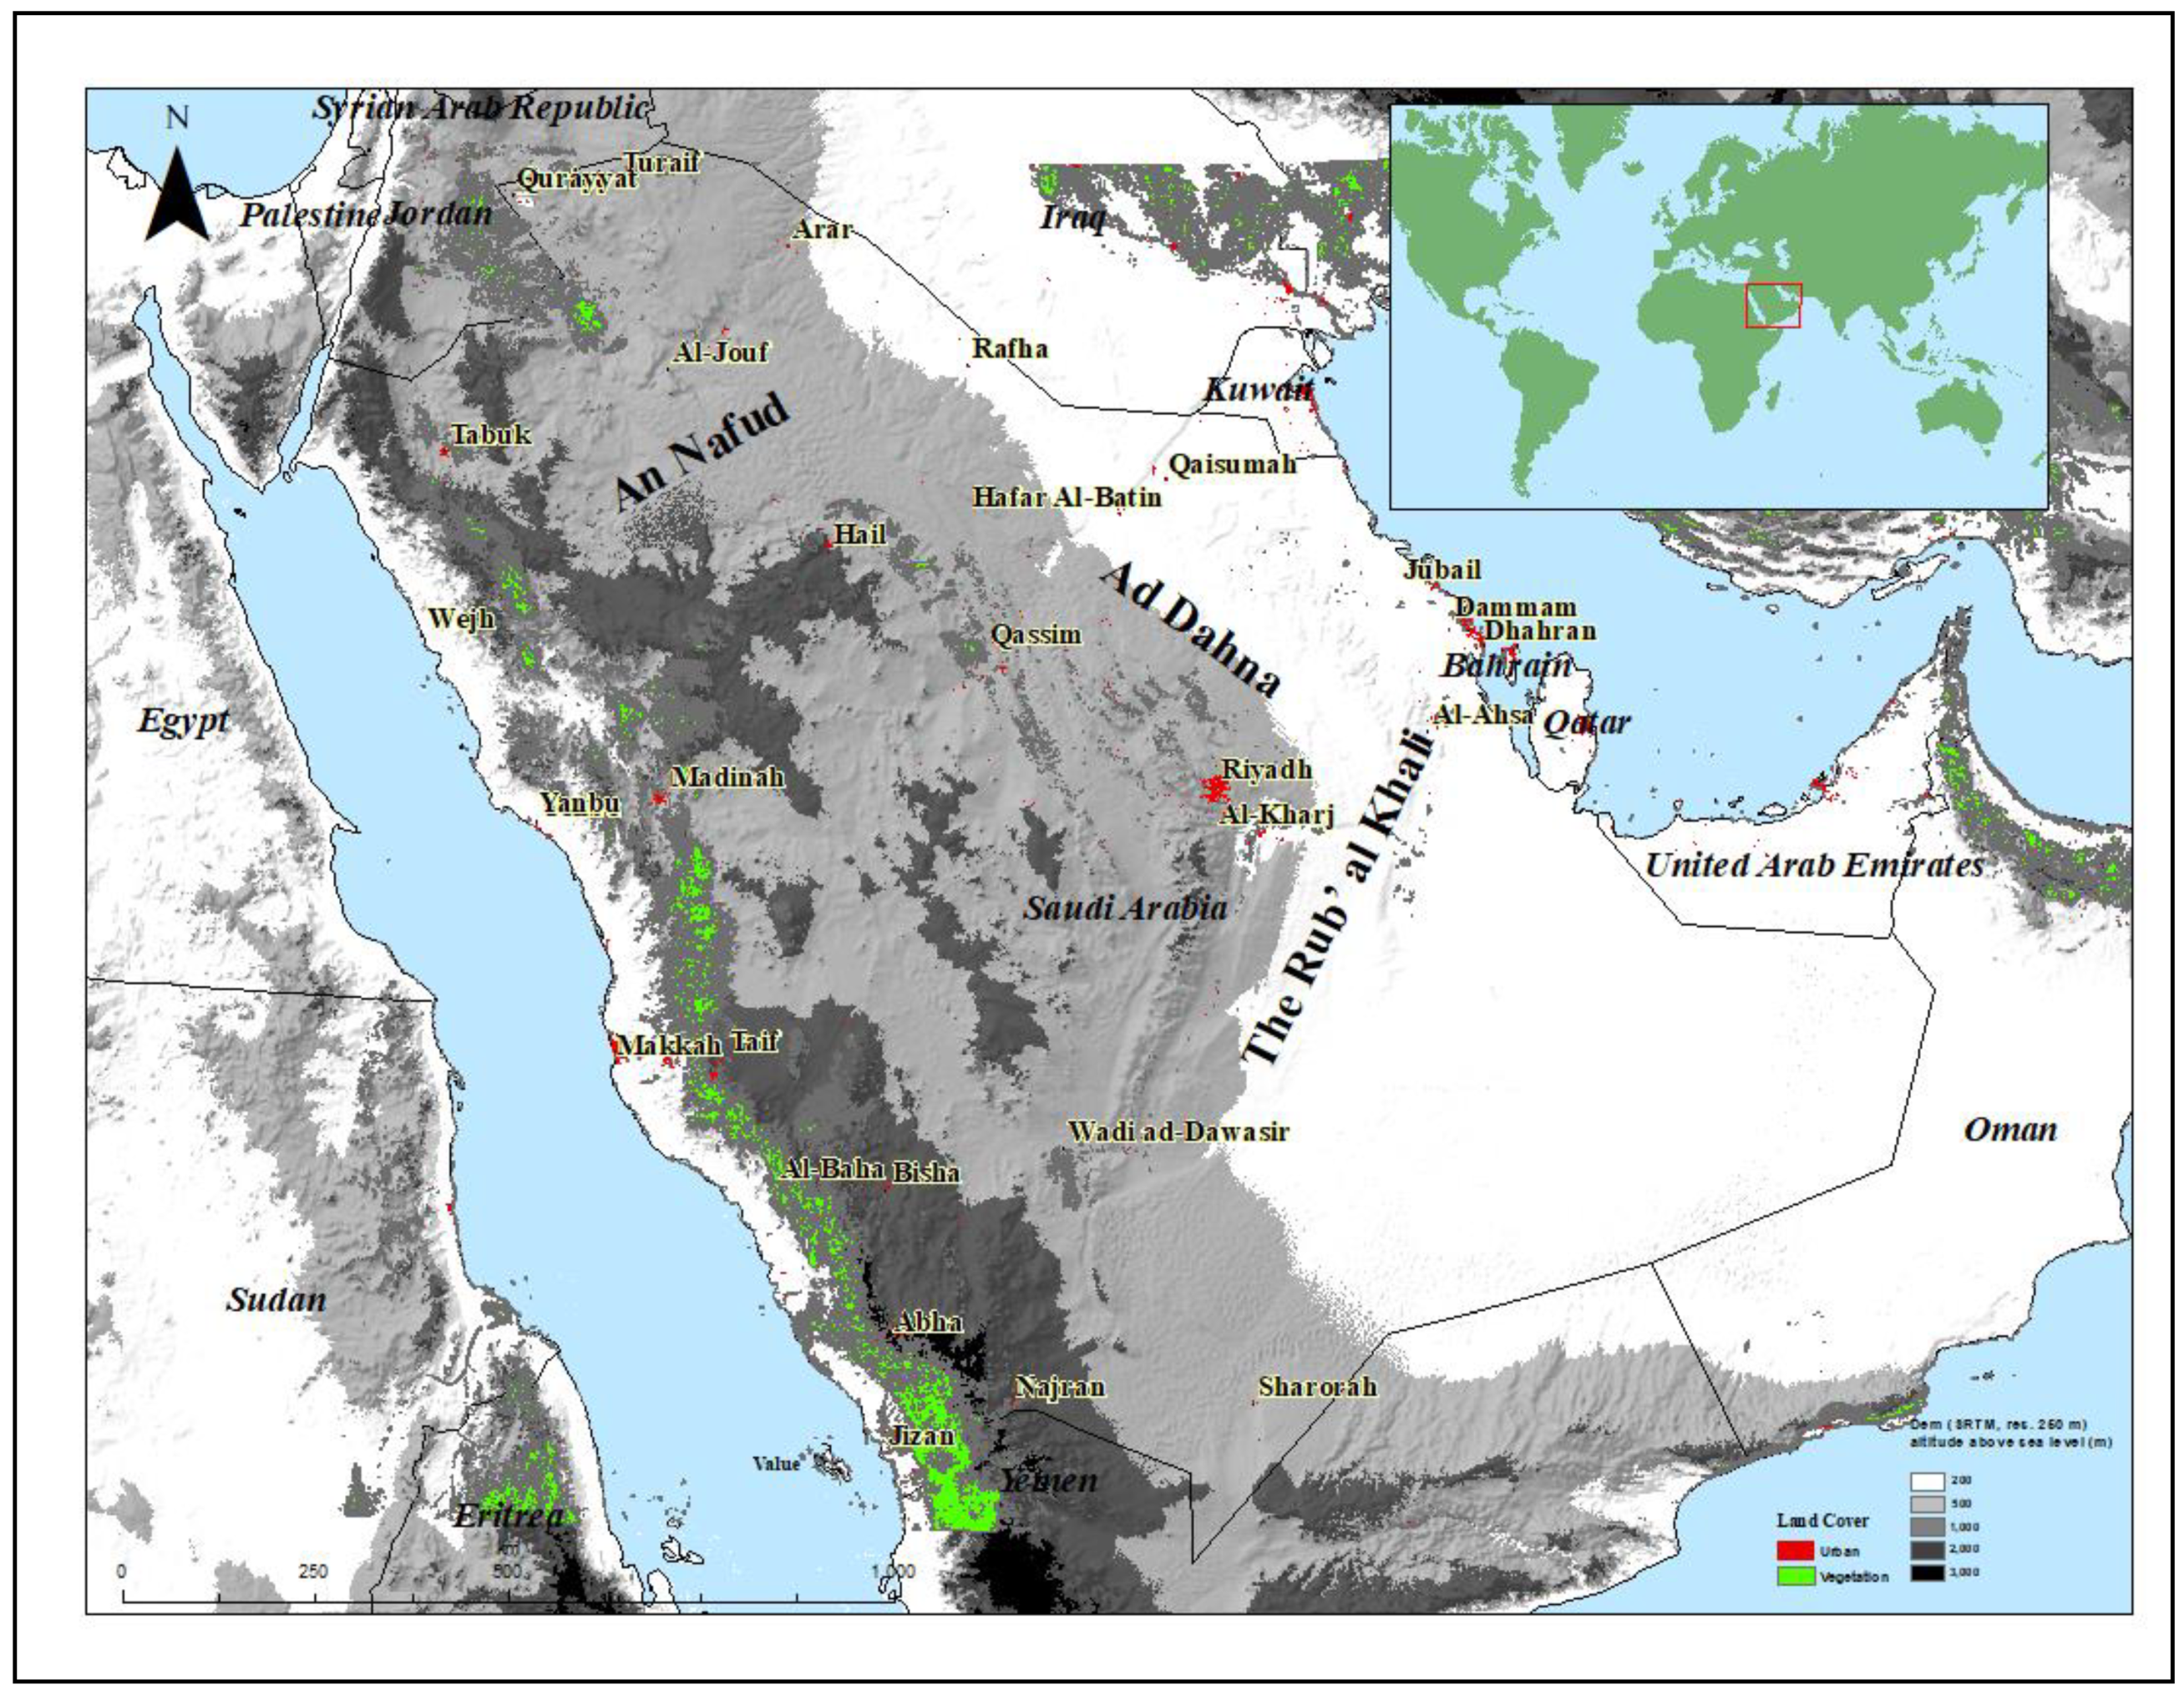
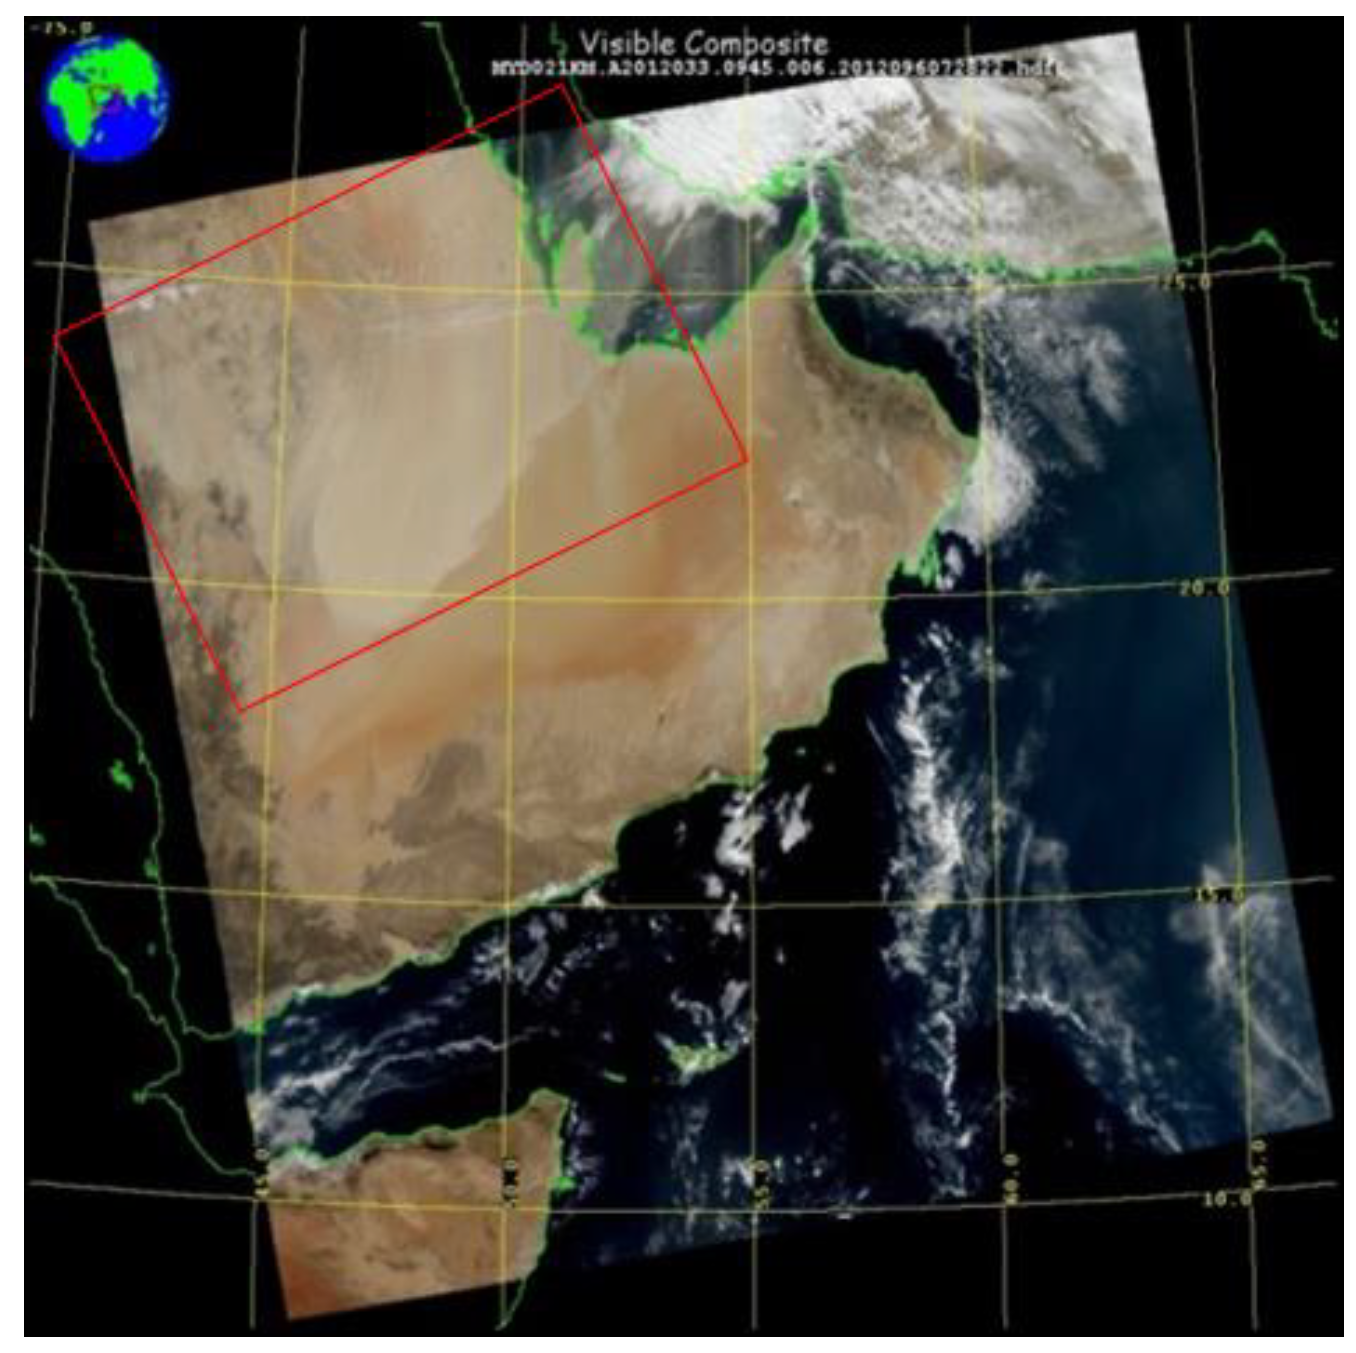
1.2. Study Area
2. Materials and Methods
2.1. Moderate Resolution Imaging Spectroradiometer (MODIS) Images
2.1.1. MODIS Cloud Mask
2.1.2. MODIS Land Cover
2.1.3. MODIS
2.2. Statistical Analysis
3. Results
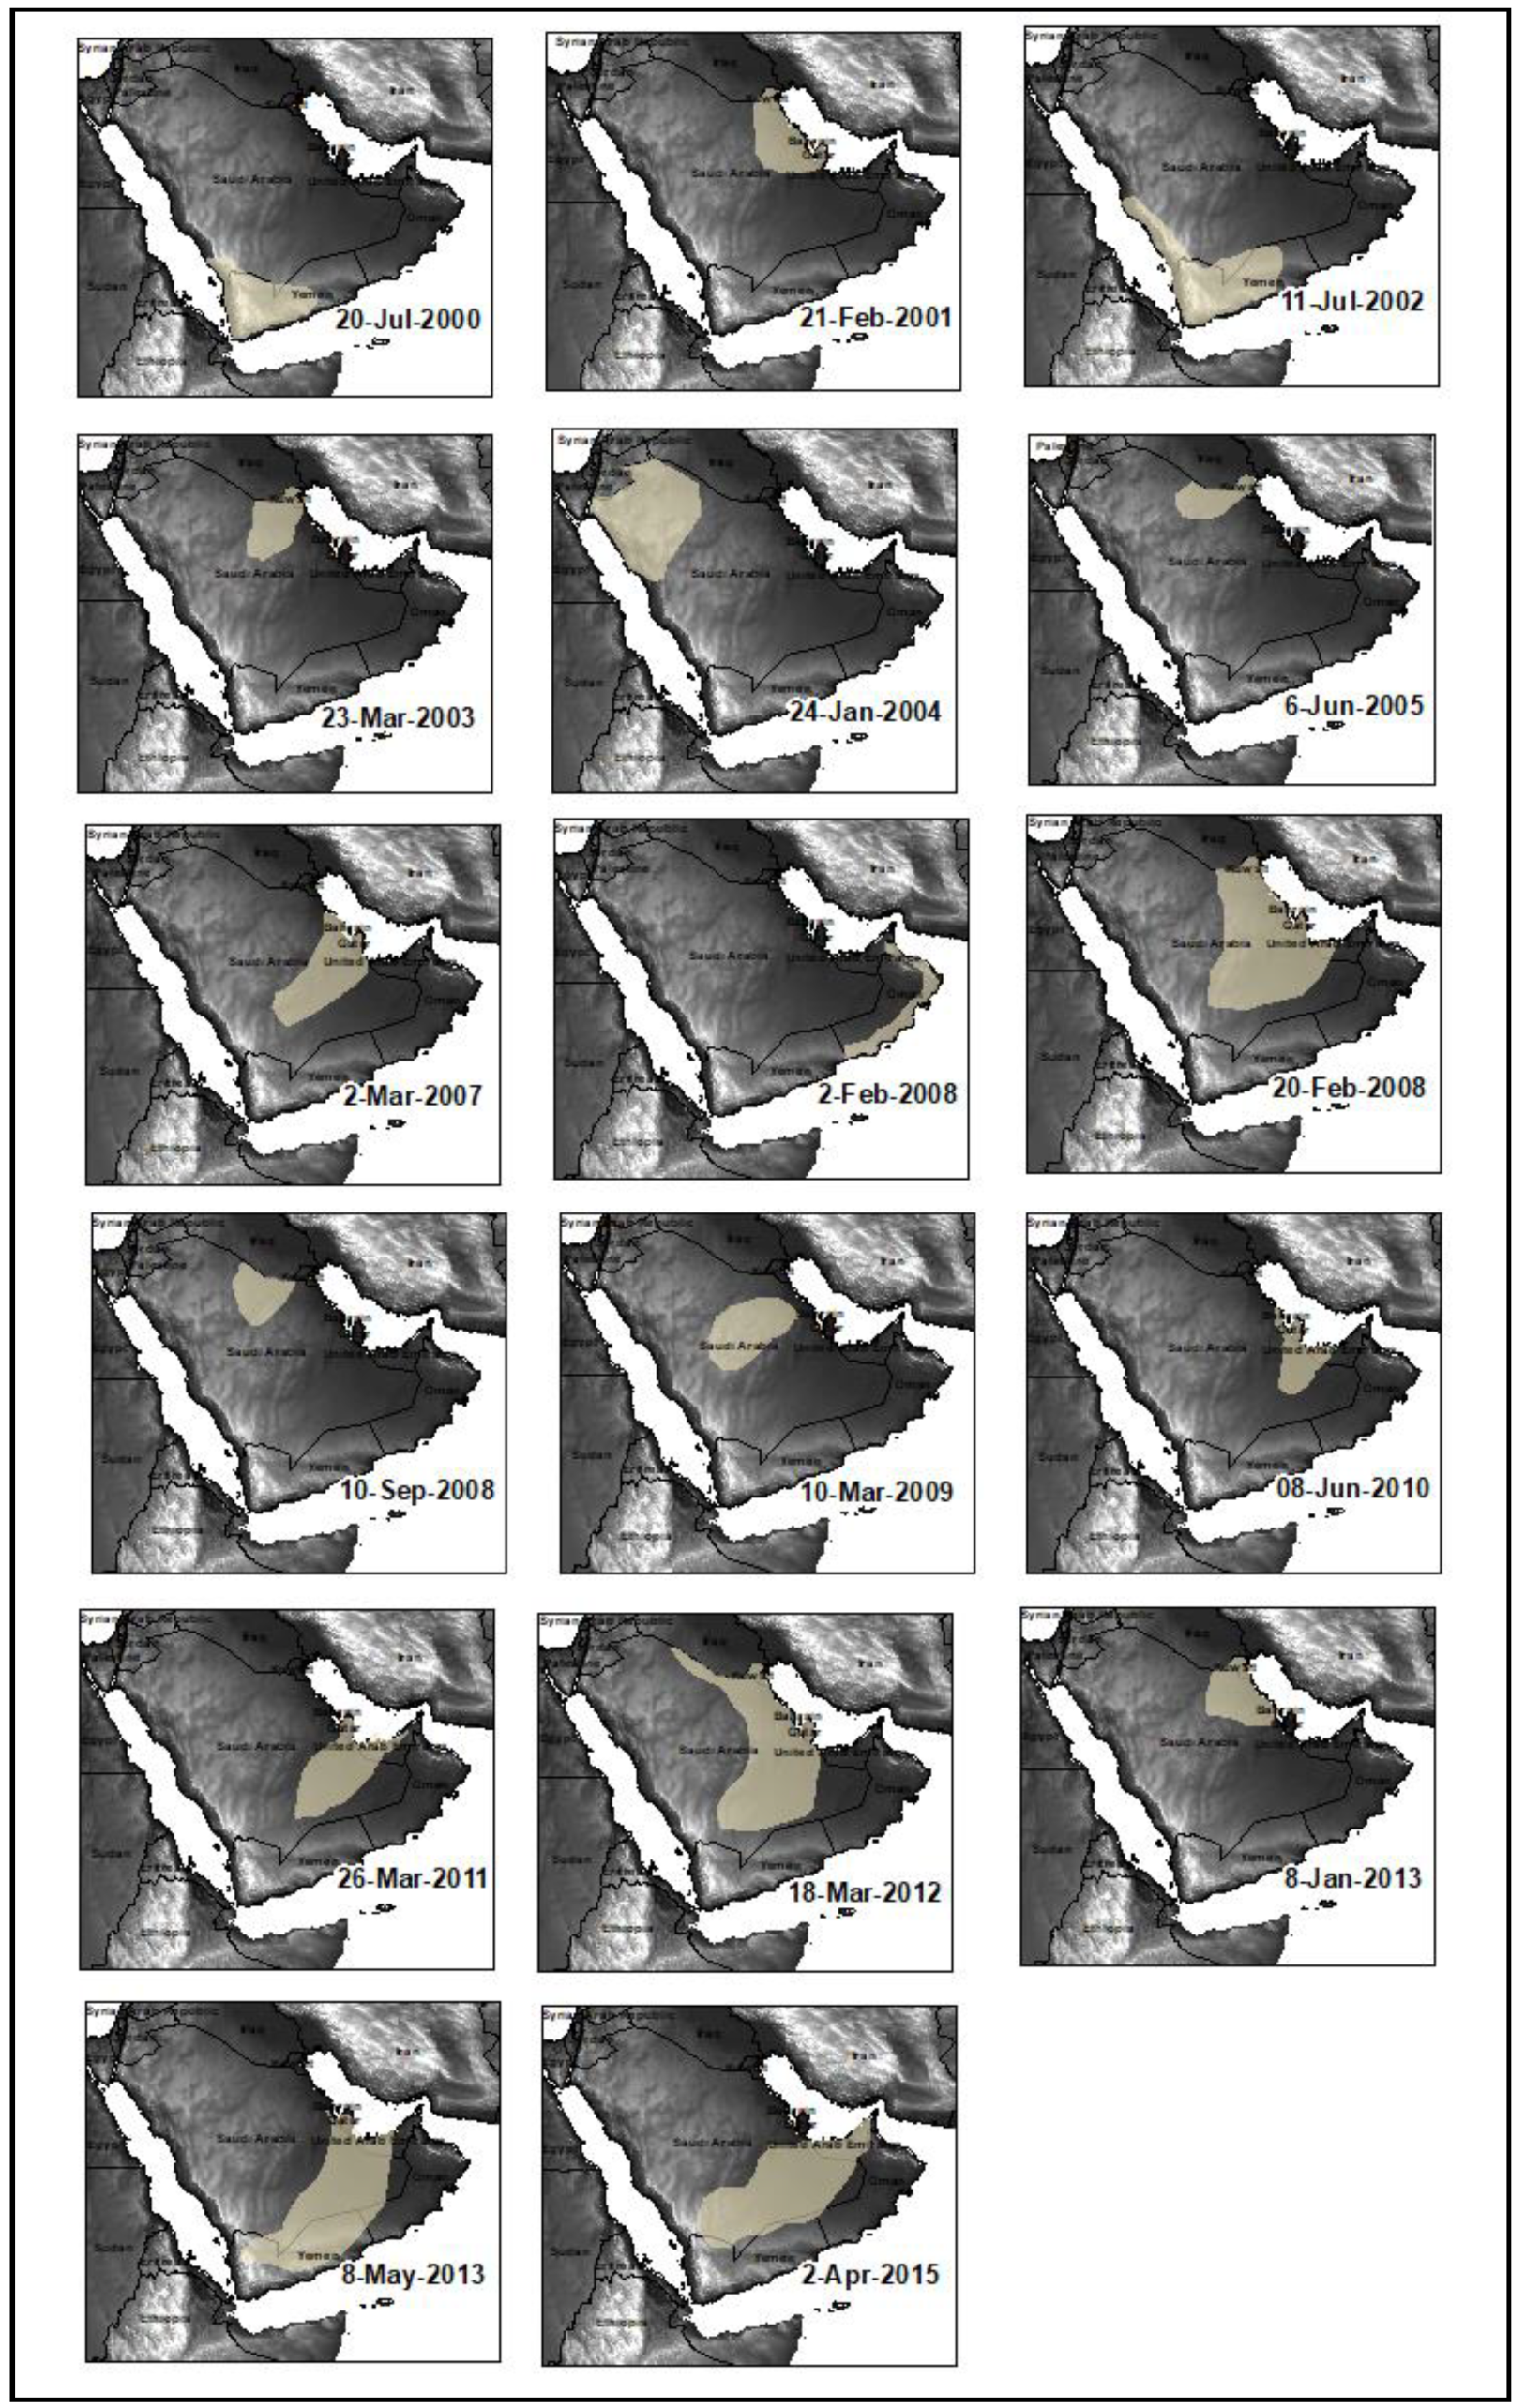
3.1. Dust Detection Validation
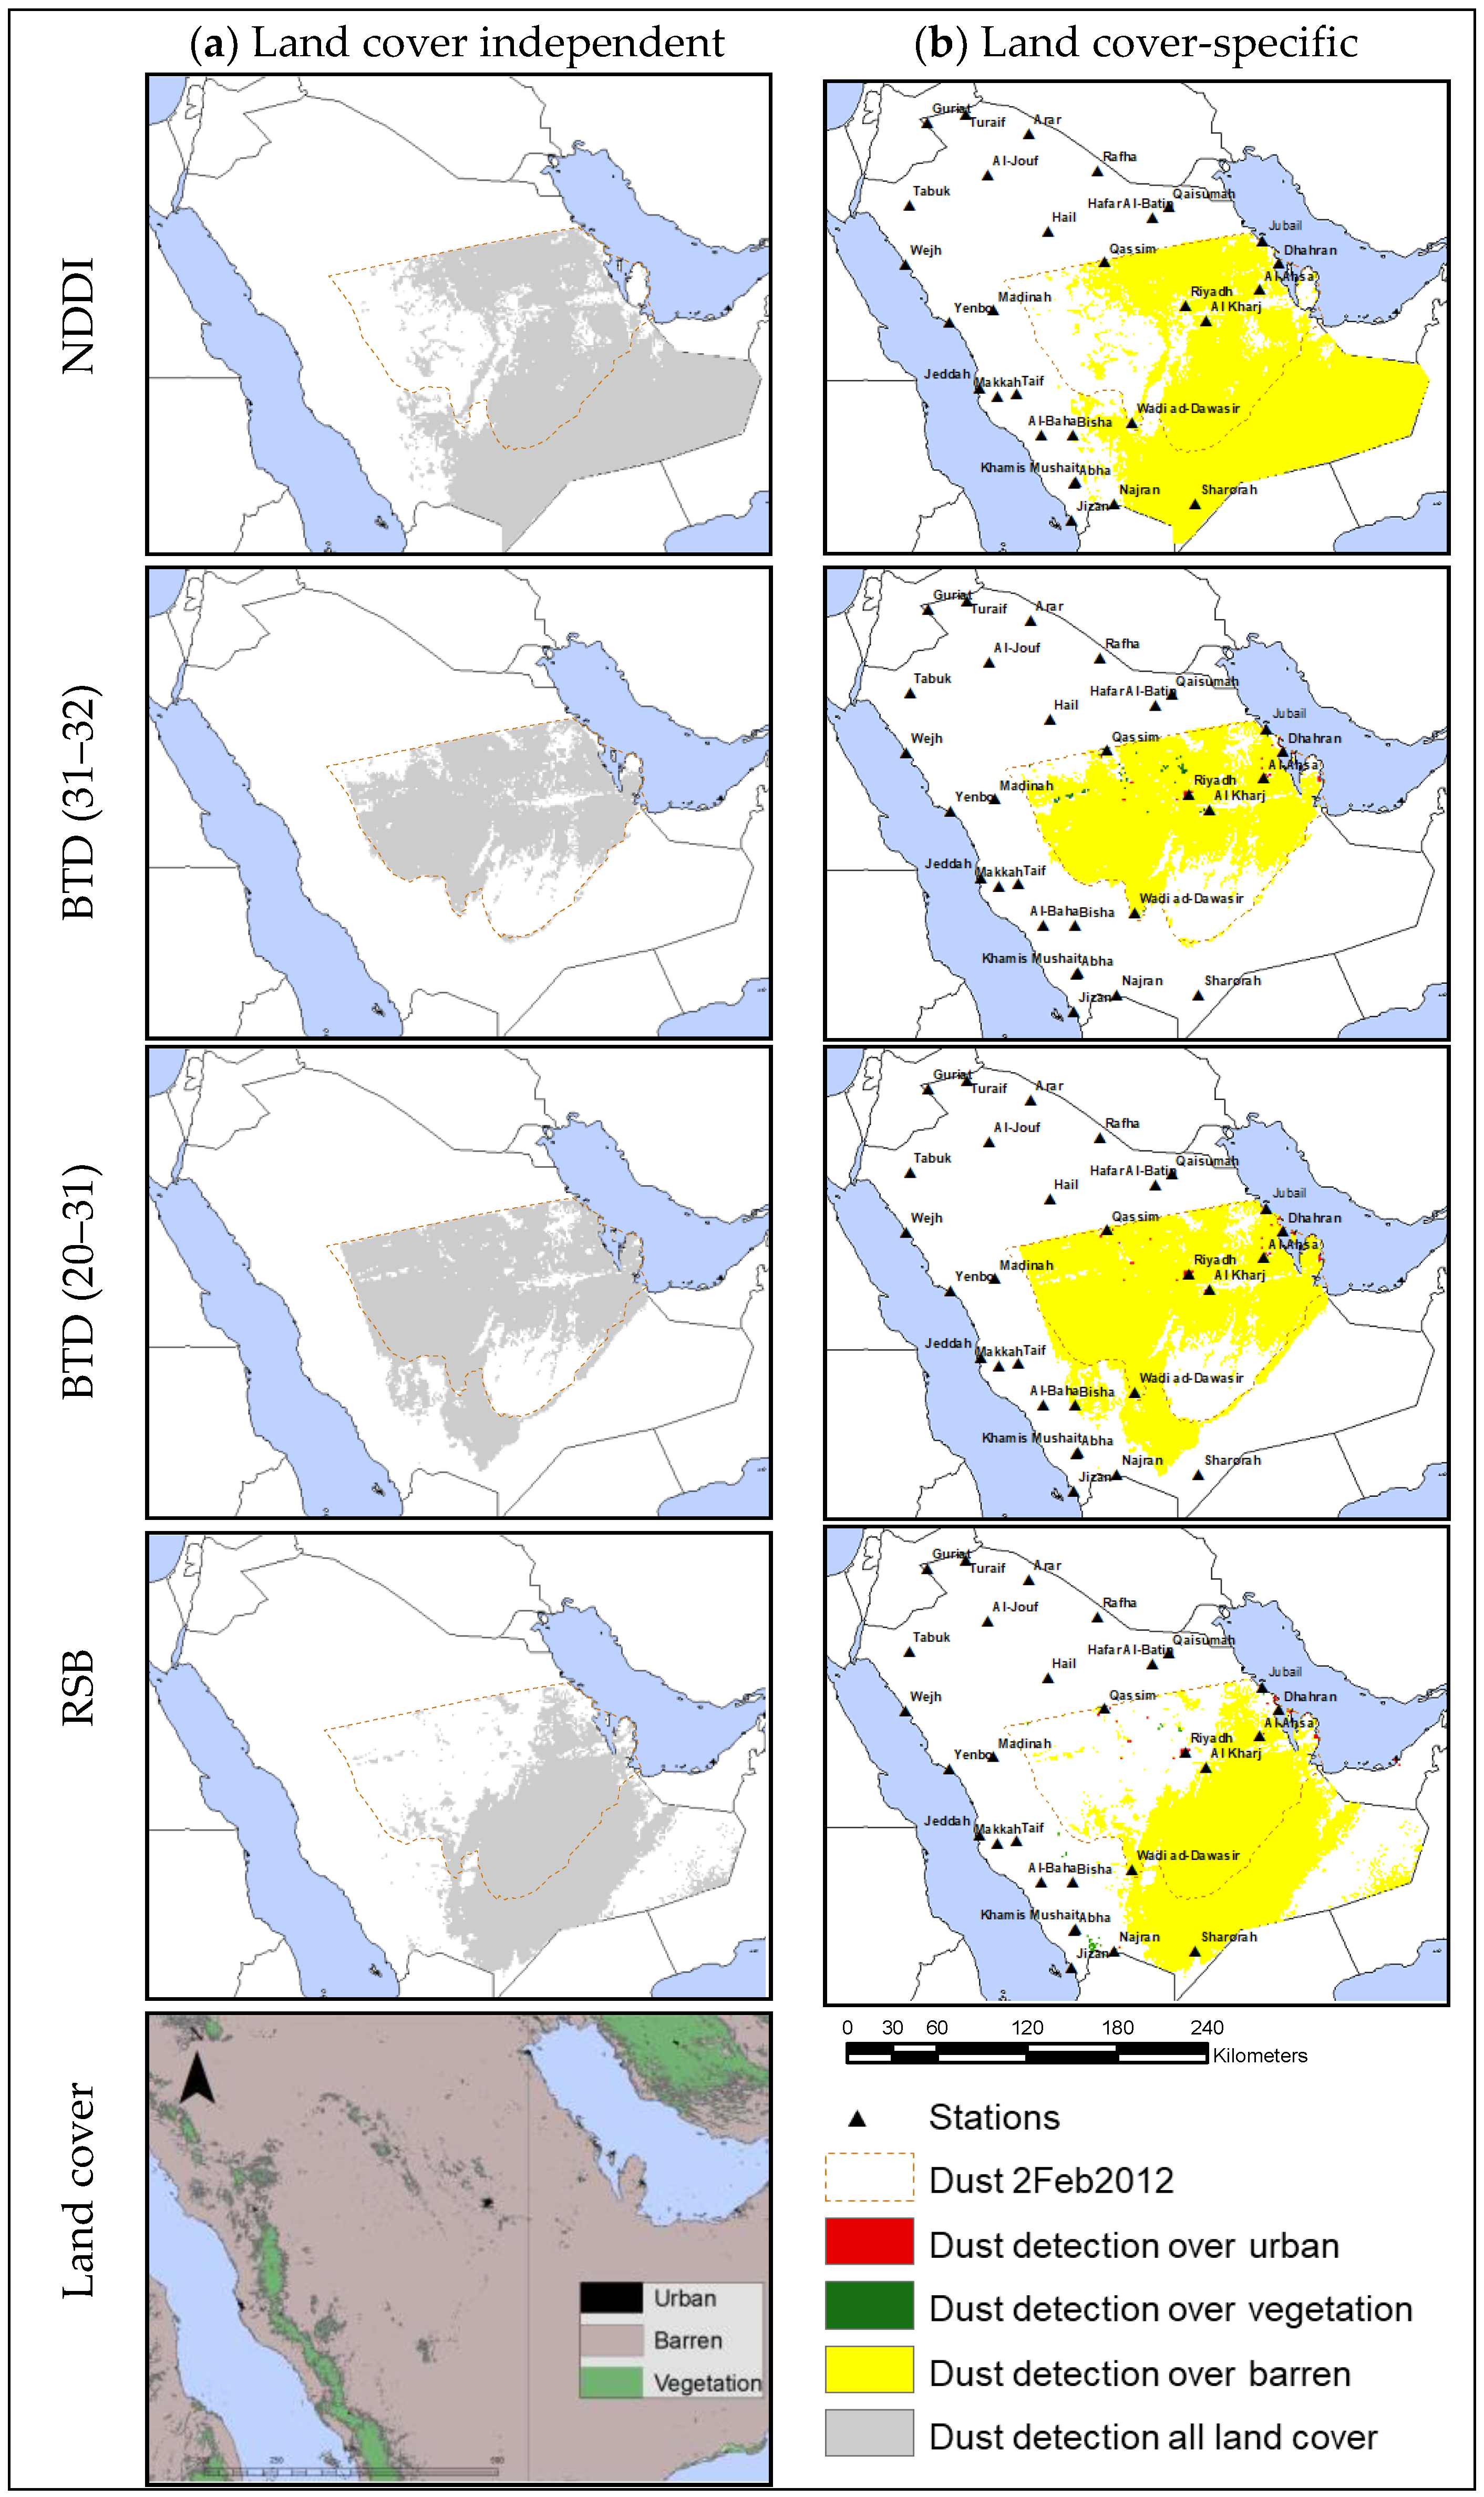
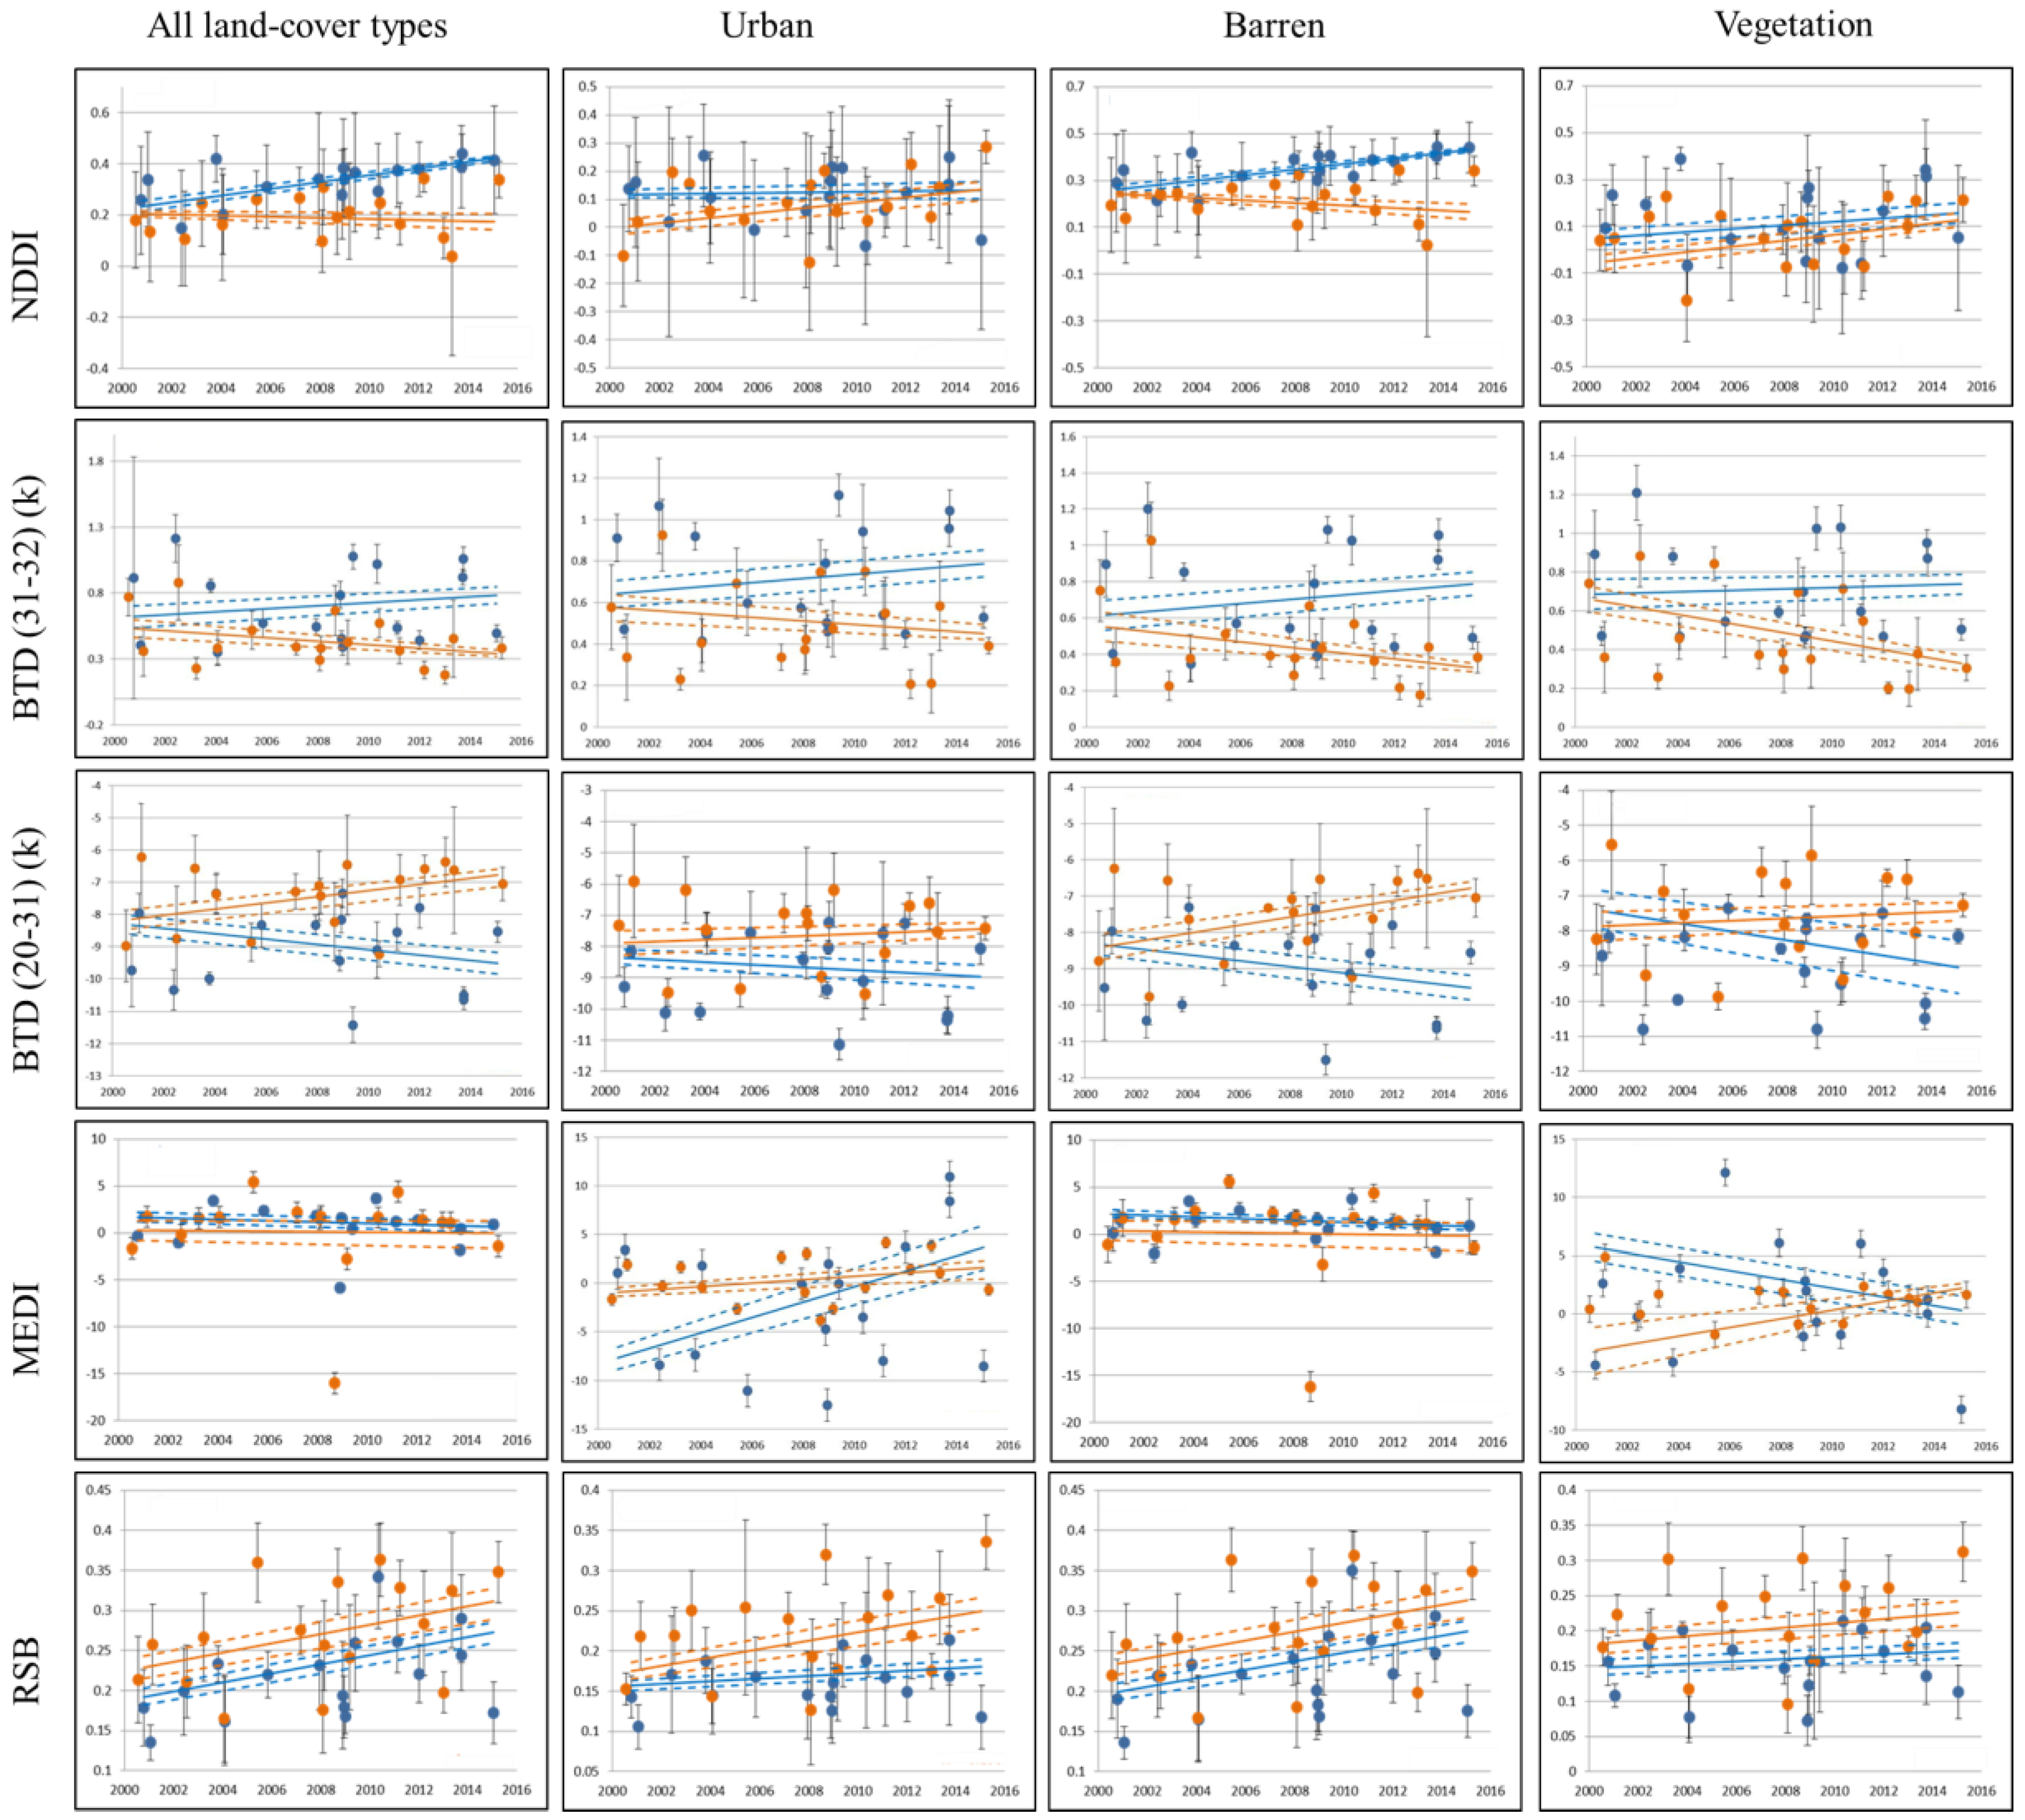
3.2. Land Cover Independent Analysis
3.3. Land Cover-Specific Analysis
4. Discussion
4.1. Validation
4.2. Land Cover Independent
4.2.1. NDDI
4.2.2. BTD
4.2.3. MEDI
4.2.4. RSB
4.3. Land Cover Specific Analysis
4.3.1. Urban
4.3.2. Barren
4.3.3. Vegetation
5. Conclusions
Author Contributions
Funding
Acknowledgments
Conflicts of Interest
References
- Goudie, A.S. Dust storms: Recent developments. J. Environ. Manag. 2009, 90, 89–94. [Google Scholar] [CrossRef] [PubMed]
- Goudie, A.; Middleton, N.J. Desert Dust in the Global System; Springer Science & Business Media: Berlin, Germany, 2006. [Google Scholar]
- WMO. Climate and Land Degradation; World Meteorological Organization: Geneva, Switzerland, 2005. [Google Scholar]
- Baddock, M.C.; Strong, C.L.; Murray, P.S.; McTainsh, G.H. Aeolian dust as a transport hazard. Atmos. Environ. 2013, 71, 7–14. [Google Scholar] [CrossRef]
- Goudie, A.S.; Middleton, N.J. Saharan dust storms: Nature and consequences. Earth Sci. Rev. 2001, 56, 179–204. [Google Scholar] [CrossRef]
- Middleton, N.J. Desert dust hazards: A global review. Aeolian Res. 2017, 24, 53–63. [Google Scholar] [CrossRef]
- Furman, H.K.H. Dust storms in the Middle East: Sources of origin and their temporal characteristics. Indoor Built Environ. 2003, 12, 419–426. [Google Scholar] [CrossRef]
- Alsharan, A.S.; Rizk, Z.A.; Nairn, A.E.M.; Bakhit, D.W.; Alhajari, S.A. (Eds.) Hydrogeology of an Arid Region: The Arabian Gulf and Adjoining Areas; Elsevier: New York, NY, USA; Amsterdam, The Netherlands, 2001. [Google Scholar]
- Edgell, H.S. Arabian Deserts: Nature, Origin and Evolution; Springer Science & Business Media: Dordrecht, The Netherlands, 2006. [Google Scholar]
- Alharbi, B.H.; Maghrabi, A.; Tapper, N. The March 2009 dust event in Saudi Arabia: Precursor and supportive environment. Bull. Am. Meteorol. Soc. 2013, 94, 515–528. [Google Scholar] [CrossRef]
- Maghrabi, A.; Alharbi, B.; Tapper, N. Impact of the March 2009 dust event in Saudi Arabia on aerosol optical properties, meteorological parameters, sky temperature and emissivity. Atmos. Environ. 2011, 45, 2164–2173. [Google Scholar] [CrossRef]
- WMO. Establishing a WMO Sand and Dust Storm Warning Advisory and Assessment System Regional Node for West Asia: Current Capabilities and Needs; WMO Technical Report; World Meteorological Organization: Geneva, Switzerland, 2013. [Google Scholar]
- Yu, Y.; Notaro, M.; Liu, Z.; Kalashnikova, O.; Alkolibi, F.; Fadda, E.; Bakhrjy, F. Assessing temporal and spatial variations in atmospheric dust over Saudi Arabia through satellite, radiometric, and station data. J. Geophys. Res. Atmos. 2013, 118. [Google Scholar] [CrossRef]
- Chavez, P.S., Jr.; Mackinnon, D.J.; Reynolds, R.L.; Velasco, M. Monitoring dust storms and mapping landscape vulnerability to wind erosion using satellite and ground-based digital images. Arid Lands Newsl. 2002, 51, 1–8. [Google Scholar]
- Alpert, P.; Ganor, E. Sahara mineral dust measurements from TOMS: Comparison to surface observations over the Middle East for the extreme dust storm, 14–17 March 1998. J. Geophys. Res. Atmos. 2001, 106, 18275–18286. [Google Scholar] [CrossRef]
- Barkan, J.; Kutiel, H.; Alpert, P. Climatology of dust sources in North Africa and the Arabian Peninsula, based on TOMS data. Indoor Built Environ. 2004, 13, 407–419. [Google Scholar] [CrossRef]
- Chiapello, I.; Prospero, J.M.; Herman, J.R.; Hsu, N.C. Detection of mineral dust over the North Atlantic Ocean and Africa with the Nimbus 7 TOMS. J. Geophys. Res. Atmos. 1999, 104, 9277–9291. [Google Scholar] [CrossRef]
- Herman, J.R.; Bhartia, P.K.; Torres, O.; Hsu, C.; Seftor, C.; Celarier, E. Global distribution of UV-absorbing aerosols from Nimbus 7/TOMS data. J. Geophys. Res. Atmos. 1997, 102, 16911–16922. [Google Scholar] [CrossRef]
- Prospero, J.M.; Ginoux, P.; Torres, O.; Nicholson, S.E.; Gill, T.E. Environmental characterization of global sources of atmospheric soil dust identified with the Nimbus 7 Total Ozone Mapping Spectrometer (TOMS) absorbing aerosol product. Rev. Geophys. 2002, 40. [Google Scholar] [CrossRef]
- Brindley, H.E.; Russell, J.E. Improving GERB scene identification using SEVIRI: Infrared dust detection strategy. Remote. Sens. Environ. 2006, 104, 426–446. [Google Scholar] [CrossRef]
- Schepanski, K.; Tegen, I.; Laurent, B.; Heinold, B.; Macke, A. A new Saharan dust source activation frequency map derived from MSG-SEVIRI IR-channels. Geophys. Res. Lett. 2007, 34. [Google Scholar] [CrossRef]
- Schmetz, J.; Pili, P.; Tjemkes, S.; Just, D.; Kerkmann, J.; Rota, S.; Ratier, A. An introduction to Meteosat second generation (MSG). Bull. Am. Meteorol. Soc. 2002, 83, 977–992. [Google Scholar] [CrossRef]
- Turner, W.; Spector, S.; Gardiner, N.; Fladeland, M.; Sterling, E.; Steininger, M. Remote sensing for biodiversity science and conservation. Trends Ecol. Evol. 2003, 18, 306–314. [Google Scholar] [CrossRef]
- Karimi, N.; Moridnejad, A.; Golian, S.; Vali Samani, J.M.; Karimi, D.; Javadi, S. Comparison of dust source identification techniques over land in the Middle East region using MODIS data. Can. J. Remote. Sens. 2012, 38, 586–599. [Google Scholar] [CrossRef]
- Kaufman, Y.J.; Koren, I.; Remer, L.A.; Tanré, D.; Ginoux, P.; Fan, S. Dust transport and deposition observed from the Terra—Moderate Resolution Imaging Spectroradiometer (MODIS) spacecraft over the Atlantic Ocean. J. Geophys. Res. Atmos. 2005, 110. [Google Scholar] [CrossRef]
- Miller, S.D. A consolidated technique for enhancing desert dust storms with MODIS. Geophys. Res. Lett. 2003, 30. [Google Scholar] [CrossRef]
- Samadi, M.; Boloorani, A.D.; Alavipanah, S.K.; Mohamadi, H.; Najafi, M.S. Global dust Detection Index (GDDI): A new remotely sensed methodology for dust storms detection. J. Environ. Health Sci. Eng. 2014, 12, 20. [Google Scholar] [CrossRef] [PubMed]
- Yue, H.; He, C.; Zhao, Y.; Ma, Q.; Zhang, Q. The brightness temperature adjusted dust index: An improved approach to detect dust storms using MODIS imagery. Int. J. Appl. Earth Obs. Géoinf. 2017, 57, 166–176. [Google Scholar] [CrossRef]
- Mallon, D.P. Global hotspots in the Arabian Peninsula. Zool. Middle East 2011, 54, 13–20. [Google Scholar] [CrossRef]
- De Pauw, E. An Agroecological Exploration of the Arabian Peninsula; ICARDA: Aleppo, Syearia, 2002; p. 77. [Google Scholar]
- Vincent, P. Saudi Arabia: An Environmental Overview; Taylor & Francis/Balkema: London, UK, 2008; p. 309. [Google Scholar]
- Baltaci, H. Spatial and temporal variation of the extreme Saharan dust event over Turkey in March 2016. Atmosphere 2017, 8, 41. [Google Scholar] [CrossRef]
- White, D.A. The MODIS Conversion Toolkit (MCTK) User’s Guide; ITT Visual Information Solutions: Boulder, CO, USA, 2007. [Google Scholar]
- Merchant, C.J.; Embury, O.; Le Borgne, P.; Bellec, B. Saharan dust in nighttime thermal imagery: Detection and reduction of related biases in retrieved sea surface temperature. Remote Sens. Environ. 2006, 104, 15–30. [Google Scholar] [CrossRef]
- Sokolik, I.N. The spectral radiative signature of wind-blown mineral dust: Implications for remote sensing in the thermal IR region. Geophys. Res. Lett. 2002, 29, 7-1–1-4. [Google Scholar] [CrossRef]
- Darmenov, A.; Sokolik, I.N. Identifying the regional thermal-IR radiative signature of mineral dust with MODIS. Geophys. Res. Lett. 2005, 32, 1–5. [Google Scholar] [CrossRef]
- Roskovensky, J.K.; Liou, K.N. Differentiating airborne dust from cirrus clouds using MODIS data. Geophys. Res. Lett. 2005, 32. [Google Scholar] [CrossRef]
- Qu, J.J.; Hao, X.; Kafatos, M.; Wang, L. Asian dust storm monitoring combining Terra and Aqua MODIS SRB measurements. IEEE Geosci. Remote Sens. Lett. 2006, 3, 484–486. [Google Scholar] [CrossRef]
- Moridnejad, A.; Karimi, N.; Ariya, P.A. Newly desertified regions in Iraq and its surrounding areas: Significant novel sources of global dust particles. J. Arid Environ. 2015, 116, 1–10. [Google Scholar] [CrossRef]
- Ackerman, S.A.; Strabala, K.I.; Menzel, W.P.; Frey, R.A.; Moeller, C.C.; Gumley, L.E. Discriminating clear sky from clouds with MODIS. J. Geophys. Res. Atmos. 1998, 103, 32141–32157. [Google Scholar] [CrossRef]
- Martins, J.V.; Tanré, D.; Remer, L.; Kaufman, Y.; Mattoo, S.; Levy, R. MODIS cloud screening for remote sensing of aerosols over oceans using spatial variability. Geophys. Res. Lett. 2002, 29. [Google Scholar] [CrossRef]
- Friedl, M.A.; Sulla-Menashe, D.; Tan, B.; Schneider, A.; Ramankutty, N.; Sibley, A.; Huang, X. MODIS Collection 5 global land cover: Algorithm refinements and characterization of new datasets. Remote. Sens. Environ. 2010, 114, 168–182. [Google Scholar] [CrossRef]
- Ackerman, S.A. Remote sensing aerosols using satellite infrared observations. J. Geophys. Res. Atmos. 1997, 102, 17069–17079. [Google Scholar] [CrossRef]
- Legrand, M.; Plana-Fattori, A.; N’Doumé, C. Satellite detection of dust using the IR imagery of Meteosat: 1. Infrared difference dust index. J. Geophys. Res. 2001, 106, 18251–18274. [Google Scholar] [CrossRef]
- Komeilian, H.; Ganjidoust, H.; Khodadadi, A. Parametric analysis for dust plumes modeling using MODIS data over Khuzestan Province, Iran. Environment 2014, 2, 6. [Google Scholar]
- Park, S.S.; Kim, J.; Lee, J.; Lee, S.; Kim, J.S.; Chang, L.S.; Ou, S. Combined dust detection algorithm by using MODIS infrared channels over East Asia. Remote. Sens. Environ. 2014, 141, 24–39. [Google Scholar] [CrossRef]
- Hansell, R.A.; Ou, S.C.; Liou, K.N.; Roskovensky, J.K.; Tsay, S.C.; Hsu, C.; Ji, Q. Simultaneous detection/separation of mineral dust and cirrus clouds using MODIS thermal infrared window data. Geophys. Res. Lett. 2007, 34, L11808. [Google Scholar]
- Li, X.; Song, W. Dust storm detection based on Modis Data. In Proceedings of the International Conference on Geo-spatial Solutions for Emergency Management and the 50th Anniversary of the Chinese Academy of Surveying and Mapping, Beijing, China, 14–19 September 2009; pp. 169–172. [Google Scholar]
- Levy, R.C.; Remer, L.A.; Kleidman, R.G.; Mattoo, S.; Ichoku, C.; Kahn, R.; Eck, T.F. Global evaluation of the Collection 5 MODIS dark-target aerosol products over land. Atmos. Chem. Phys. 2010, 10, 10399–10420. [Google Scholar] [CrossRef]
- Wang, D.; Morton, D.; Masek, J.; Wu, A.; Nagol, J.; Xiong, X.; Wolfe, R. Impact of sensor degradation on the MODIS NDVI time series. Remote Sens. Environ. 2012, 119, 55–61. [Google Scholar] [CrossRef]
- Sayer, A.M.; Hsu, N.C.; Bettenhausen, C.; Jeong, M.J.; Meister, G. Effect of MODIS Terra radiometric calibration improvements on Collection 6 Deep Blue aerosol products: Validation and Terra/Aqua consistency. J. Geophys. Res. Atmos. 2015, 120, 12157–12174. [Google Scholar] [CrossRef]
- Casey, K.A.; Polashenski, C.M.; Chen, J.; Tedesco, M. Impact of MODIS sensor calibration updates on Greenland Ice Sheet surface reflectance and albedo trends. Cryosphere 2017, 11, 1781–1795. [Google Scholar] [CrossRef]
- AlSarmi, S.; Washington, R. Recent observed climate change over the Arabian Peninsula. J. Geophys. Res. Atmos. 2011, 116. [Google Scholar] [CrossRef]
- Almazroui, M.; Islam, M.N.; Jones, P.D.; Athar, H.; Rahman, M.A. Recent climate change in the Arabian Peninsula: Seasonal rainfall and temperature climatology of Saudi Arabia for 1979–2009. Atmos. Res. 2012, 111, 29–45. [Google Scholar] [CrossRef]
- Donat, M.G.; Peterson, T.C.; Brunet, M.; King, A.D.; Almazroui, M.; Kolli, R.K.; Nada, T.A.A. Changes in extreme temperature and precipitation in the Arab region: Long-term trends and variability related to ENSO and NAO. Int. J. Clim. 2014, 34, 581–592. [Google Scholar] [CrossRef]
- Abahussain, A.A.; Abdu, A.S.; Al-Zubari, W.K.; El-Deen, N.A.; Abdul-Raheem, M. Desertification in the Arab Region: Analysis of current status and trends. J. Arid Environ. 2002, 51, 521–545. [Google Scholar] [CrossRef]
- Amin, A.A. The extent of desertification on Saudi Arabia. Environ. Geol. 2004, 46, 22–31. [Google Scholar] [CrossRef]
- Sen, Z. Desertification and climate change: Saudi Arabian case. Int. J. Glob. Warm. 2013, 5, 270–281. [Google Scholar] [CrossRef]
- Alqurashi, A.F.; Kumar, L. Land use and land cover change detection in the Saudi Arabian desert cities of Makkah and Al-Taif using satellite data. Adv. Remote. Sens. 2014, 3, 106–119. [Google Scholar] [CrossRef]
- Rahman, M.T. Detection of land use/land cover changes and urban sprawl in Al-Khobar, Saudi Arabia: An analysis of multi-temporal remote sensing data. ISPRS Int. J. GeoInf. 2016, 5, 15. [Google Scholar] [CrossRef]
- Kaskaoutis, D.G.; Kharol, S.K.; Sinha, P.R.; Singh, R.P.; Badarinath, K.V.S.; Mehdi, W.; Sharma, M. Contrasting aerosol trends over South Asia during the last decade based on MODIS observations. Atmos. Meas. Tech. 2011. [Google Scholar] [CrossRef]
- Aili, A.; Oanh, N.T.K.; Abuduwaili, J. Variation Trends of Dust Storms in Relation to Meteorological Conditions and Anthropogenic Impacts in the Northeast Edge of the Taklimakan Desert, China. Open J. Air Pollut. 2016, 5, 127–143. [Google Scholar] [CrossRef]


| Stations | In Situ | NDDI | BTD (31–32) | BTD (20–31) | RSB |
|---|---|---|---|---|---|
| Barren | |||||
| Riyadh | * | √ | √ | √ | X |
| Wadi al-Dawasir | * | √ | X | X | √ |
| Al-Ahsa | * | √ | √ | √ | √ |
| Dammam | * | √ | √ | √ | √ |
| Jubail | * | √ | √ | √ | √ |
| Al-Kharj | * | √ | √ | √ | X |
| Qassim | * | √ | √ | √ | X |
| Dawadmi | * | √ | √ | √ | X |
| Bahrain | * | √ | √ | √ | √ |
| Qatar | - | X | √ | √ | √ |
| Urban | |||||
| Riyadh | * | + | √ | √ | X |
| Wadi al-Dawasir | * | + | X | X | X |
| Al-Ahsa | * | + | √ | √ | √ |
| Dammam | * | + | √ | √ | √ |
| Jubail | * | + | √ | √ | √ |
| Al-Kharj | * | + | √ | √ | √ |
| Qassim | * | + | √ | √ | √ |
| Dawadmi | * | + | √ | √ | √ |
| Bahrain | * | + | √ | √ | √ |
| Qatar | - | + | √ | √ | √ |
| NDDI | BTD (31–32) | BTD (20–31) | MEDI | RSB (2–18) | |
|---|---|---|---|---|---|
| All land cover | 0.000 ** | 0.002 ** | 0.002 ** | 0.758 | 0.005 ** |
| Urban | 0.381 | 0.005 ** | 0.015 * | 0.210 | 0.002 ** |
| Barren | 0.000 ** | 0.002 ** | 0.003 ** | 0.868 | 0.000 ** |
| Vegetation | 0.049 * | 0.006 ** | 0.007 ** | 0.943 | 0.001 ** |
| Slope Coeff ± SE | NDDI | BTD (31–32) | BTD (20–31) | MEDI | RSB (2–18) | |||||
|---|---|---|---|---|---|---|---|---|---|---|
| (Year−1) | Non-Dust | Dust | Non-Dust | Dust | Non-Dust | Dust | Non-Dust | Dust | Non-Dust | Dust |
| All land cover | 0.0109± 0.0035 ** | −0.0042± 0.0050 | 0.0008 ± 0.0164 | −0.0174 ± 0.0100 ° | −0.0261 ± 0.0708 | 0.0733 ± 0.0548 | −0.0473 ± 0.1252 | −0.0536 ± 0.2658 | 0.0054 ± 0.0026 * | 0.0062 ± 0.0033 ° |
| Urban | −0.0019 ± 0.0056 | 0.0097 ± 0.0058 ° | 0.0023± 0.01452 | −0.0083 ± 0.01181 | −0.0055 ± 0.0719 | 0.0072± 0.0679 | 0.2668 ± 0.3839 | 0.1041 ± 0.1326 | 0.0015 ± 0.0016 | 0.0051± 0.0030 ° |
| Barren | 0.0101 ± 0.0031 ** | −0.0035± 0.0050 | 0.0001 ± 0.0164 | −0.0198 ± 0.01120 ° | −0.0310 ± 0.0713 | 0.0842 ± 0.0591 | −0.0276 ± 0.0891 | −0.0777 ± 0.2704 | 0.0050 ± 0.0027 ° | 0.0060 ± 0.0033 ° |
| Vegetation | 0.0057± 0.0086 | 0.0063 ± 0.0070 | −0.0050 ± 0.0142 | −0.0210 ± 0.0116 ° | −0.0075 ± 0.0671 | 0.0183 ± 0.0730 | −0.0980 ± 0.2719 | 0.1960 ± 0.2625 | 0.0011 ± 0.0024 | 0.0031 ± 0.0035 |
© 2018 by the authors. Licensee MDPI, Basel, Switzerland. This article is an open access article distributed under the terms and conditions of the Creative Commons Attribution (CC BY) license (http://creativecommons.org/licenses/by/4.0/).
Share and Cite
Albugami, S.; Palmer, S.; Meersmans, J.; Waine, T. Evaluating MODIS Dust-Detection Indices over the Arabian Peninsula. Remote Sens. 2018, 10, 1993. https://doi.org/10.3390/rs10121993
Albugami S, Palmer S, Meersmans J, Waine T. Evaluating MODIS Dust-Detection Indices over the Arabian Peninsula. Remote Sensing. 2018; 10(12):1993. https://doi.org/10.3390/rs10121993
Chicago/Turabian StyleAlbugami, Sarah, Steven Palmer, Jeroen Meersmans, and Toby Waine. 2018. "Evaluating MODIS Dust-Detection Indices over the Arabian Peninsula" Remote Sensing 10, no. 12: 1993. https://doi.org/10.3390/rs10121993
APA StyleAlbugami, S., Palmer, S., Meersmans, J., & Waine, T. (2018). Evaluating MODIS Dust-Detection Indices over the Arabian Peninsula. Remote Sensing, 10(12), 1993. https://doi.org/10.3390/rs10121993