Abstract
The transition from a command to a market economy resulted in widespread cropland abandonment across the former Soviet Union during the 1990s. Spatial patterns and determinants of abandonment are comparatively well understood for European Russia, but have not yet been assessed for the vast grain belt of Western Siberia, situated in the Eurasian forest steppe. This is unfortunate, as land-use change in Western Siberia is of global significance: Fertile black earth soils and vast mires store large amounts of organic carbon, and both undisturbed and traditional cultural landscapes harbor threatened biodiversity. We compared Landsat images from ca. 1990 (before the break-up of the Soviet Union) and ca. 2015 (current situation) with a supervised classification to estimate the extent and spatial distribution of abandoned cropland. We used logistic regression models to reveal important determinants of cropland abandonment. Ca. 135,000 ha classified as cropland around 1990 were classified as grassland around 2015. This suggests that ca. 20% of all cropland remain abandoned ca. 25 years after the end of the Soviet Union. Abandonment occurred mostly at poorly drained sites. The likelihood of cropland abandonment increased with decreasing soil quality, and increasing distance to medium-sized settlements, roads and railroads. We conclude that soil suitability, access to transport infrastructure and availability of workforce are key determinants of cropland abandonment in Western Siberia.
1. Introduction
Cropland abandonment affects ecosystems, their services and biodiversity, and human well-being [1]. Therefore, understanding the nature and determinants (sensu [2]) of land abandonment is important. Abandonment can result in reduced water availability, higher wildfire risk [3,4], increased soil erosion [5,6], and the loss of agro-biodiversity [6,7]. However, abandonment, when followed by natural vegetation succession, may also allow the recovery of ecosystems, their services and biodiversity [7,8,9,10]. Abandonment changes vegetation and soil [11] and can lead to increased carbon sequestration [12,13]. It also affects socio-economic processes such as land access, rural outmigration and employment opportunities and can lead to a perceived loss of cultural landscapes [7,14,15,16]. Furthermore, a decrease in the area farmed in one region can cause increases in agricultural production and cropland expansion elsewhere, potentially threatening vulnerable ecological systems and their functions and services [17].
A large body of evidence exists that examines spatial patterns and determinants of land abandonment [18,19,20,21]. Study methods comprise the analysis of governmental inventory and census data [22], interviews with land users [23], the interpretation of remote sensing data such as aerial and satellite images [24,25,26], or a combination [18,19,27]. The latter approach has gained importance recently, as the availability of satellite images (such as the complete Landsat archive) and their spatial resolution has increased massively and rapidly.
Abandoned cropland is often situated in isolated and remote agricultural areas [19,21,28], characterized by unfavorable biophysical conditions. These might be areas with low precipitation, at high elevations, areas prone to soil erosion with steep slopes, or low soil quality [6,21]. However, abandonment also occurs in areas highly suitable for farming [24]. In some areas, cropland abandonment is associated with landowner characteristics [7]. Labor force as well as market accessibility are also important determinants of cropland abandonment [20,29]. Small-scale farms are more likely to be abandoned than larger enterprises in some parts of Europe [28].
However, the determinants of cropland abandonment remain insufficiently understood in many regions because of the complex relationship between its socio-economic and environmental dimensions. A better understanding of abandonment determinants is crucial to provide guidance for land-use policies [19] and identify priority areas e.g., for re-cultivation [30] or biodiversity conservation [31].
The former Soviet Union is a global hotspot of cropland abandonment [32,33]. After the break-up of the Soviet Union in 1991, the collective farming system collapsed due to a transition from a planned to a market economy [34]. A termination of the state support and a sharp decline in the rural population due to out-migration resulted in the abandonment of more than 45 million ha of arable lands across Russia within a decade [33].
Spatial patterns and determinants of cropland abandonment in the former Soviet Union have been studied in European Russia [19], Ukraine and Kazakhstan [30,32,35]. In contrast, no assessment has been published yet for the massive Western Siberian “grain belt,” which comprises more than 20% of Russia’s arable land and therefore significantly contributes to Russia’s food security [36]. The grain-producing areas are mostly situated in the forest steppe, a transition zone between the steppes of Kazakhstan and the boreal forests of Siberia. The land has been used by livestock-breeding tribes since ca. 7000 years BP [37]. Agriculture was widespread already in the 18th century [22], but remained patchy and unproductive until Khrushchevs “Virgin Land Campaign” in 1953–1961, when ca. 460,000 km2 of pristine grasslands in northern Kazakhstan and Russia were converted into cropland [38].
The poor understanding of the extent of cropland abandonment and its determinants across Western Siberia is unfortunate, as Western Siberia is a region of global importance for key ecosystem functions and services. The extensive mires and humus-rich Chernozem soils of Western Siberia store a large proportion of the global soil carbon [39]. Due to low human population density and a high proportion of natural habitats, Western Siberia has also been a safe haven for biodiversity reaching a diversity and abundance that is long gone from many Western European countries [40,41]. Compared to the European parts of the former Soviet Union, growing conditions are different due to a shorter vegetation period and a harsher climate [42]. Given the importance of the region, a better understanding of the patterns in and determinants of cropland abandonment is necessary, in order to identify areas where future cropland expansion and intensification might happen.
We aimed (i) to assess changes in cropland area from the end of the Soviet period (around 1990) to recent times (around 2015), (ii) to determine spatial patterns in cropland abandonment and (iii) to reveal the main biophysical and socio-economic determinants of cropland abandonment.
2. Data and Methods
2.1. Study Area
The study area comprises seven regions of Russia’s Tyumen province (Tyumenskaya oblast) (Figure 1), totaling 24,453 km2. The study area is predominantly located in the forest-steppe ecozone but touches the pre-taiga along its northern margin [43]. The topography is flat, and elevation ranges from 80 to 120 m above sea level [42]. The climate is highly continental with warm, semi-humid summers and cold and relatively dry winters, and a vegetation period of ca. 160 days [42]. The mean July temperature is 18.7 °C, the mean January temperature −17 °C, and the annual mean is 1.7 °C [44]. Mean annual precipitation ranges from 400 to 500 mm, but drought years occur regularly [44]. Chernozems and Phaeozems are the main soil types used for agriculture [42]. The study area has a poorly developed road network, and only larger towns and cities are connected by tarmac roads, with all major settlements located along the Trans-Siberian Railway and a parallel road [45,46]. Population density is very low with on average 6.2 people/km2 [47]. Arable farming is dominated by summer crops, mainly spring wheat and fodder crops. Large agricultural enterprises prevail (farming dozens to several 100 ha [36]). The latter can be divided into state (state agricultural and forestry farms) and corporate (collective farms, joint-stock companies, etc.). Small plots of land are in private ownership [47].
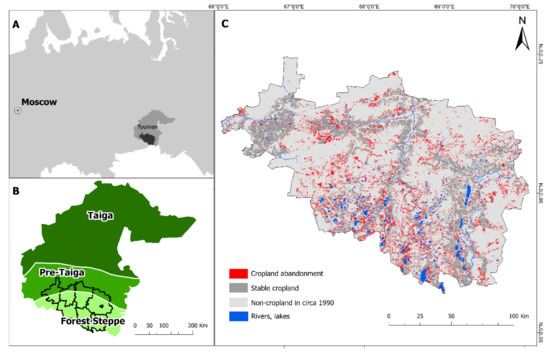
Figure 1.
Location of Tyumen province and the study area (darker grey area, panel A), ecozones of Tyumen region (B), and change map from the remote sensing classifications for ca. 1990 and ca. 2015, highlighting areas of cropland abandonment and stable cropland (C).
2.2. Mapping Land-Use Land-Cover (LULC) Change
We used Landsat TM 4 and 5 and Landsat 8 OLI satellite imagery from four footprints in the Worldwide Reference System-2 (WRS-2 path/row 158/20, 158/21 and 159/20, 159/21, downloaded from the U.S. Geological Survey, http://glovis.usgs.gov/) to assess agricultural land-cover change between ca. 1990 and ca. 2015. The selection of satellite imagery was based primarily on the availability of multiple images from different seasons per time step investigated. We were interested to compare two main periods of land use in the area, namely the last years of the Soviet Union with a peak in cropland area, and the current situation. Therefore, we considered Landsat images of the period 1987 to 1991 (hereafter ‘ca. 1990’) and for 2014 to 2016 (hereafter ‘ca. 2015’).
Only cloud-free images were used. To capture changes in vegetation phenology, images from the end of May, from June, July and early August were downloaded because these are the times of year when spectral differences between cropland and grassland are most pronounced in the study region [48,49]. Due to the flat terrain, additional topographic correction of the systematically terrain-corrected Landsat images (Level 1T product) was not necessary in our study area. As the training data were derived from the classified image, atmospheric correction was also not necessary [48,50]. All scenes were geo-referenced to a Universal Transverse Mercator map projection. Six spectral bands (excluding the thermal band) at 30 m resolution including 1–5 and 7 of the TM (for ca. 1990) and 2–7 of the OLI (for ca. 2015) sensors were then stacked to one multispectral image for each respective period.
To define land use across the study area and assemble training data for the classification, we built a georeferenced database from various sources. For the classification representing ca. 2015, we used information from very high-resolution satellite images (QuickBirdTM and WorldViewTM images available via GoogleEarthTM and BingTM mapping services). For the classification representing ca. 1990, we used land-use information that was available from Soviet topographic maps scaled 1:100,000 (issued in the late 1980s). On these images, LULC was classified by authors JK and NH, who had extensive field experience in the study region and were confident to identify sown, worked, harvested and abandoned cropland. Used cropland was identified based on image texture, visible tramlines and visible agricultural machinery. Abandoned cropland was identified from characteristic patchy vegetation patterns visible on high-resolution images. Additionally, we relied on detailed land-use information collected at 612 georeferenced points (with GPS coordinates) in the field in the periods May to July 2013 and May to July 2014 (for details see [51]). As the study region was too large and some areas were difficult to access due to the poor road network, random sampling across the entire area was not possible. Instead, the 612 points were placed at random into two 20 × 20 km study areas, one in the center of the studied region, and one in the south [51].
A randomized selection of ca. 50% of all points in the database were used as training sites for the classification of the Landsat images, the other half was retained for validation. We used a supervised classification and applied a maximum likelihood classifier in ERDAS Imagine 2013 to classify the satellite images into six classes of LULC for each period: Cropland (C), Forest (F), Grassland (G), Wetland (WL), Open Water (W) and Others (including bare soils, salt-covered shores of saline lakes, urban areas, industrial zones, roads, and settlements). Afterwards, we applied a 3 × 3 kernel majority filter to minimize the “salt-and-pepper effect,” i.e., lump areas of a class that were equal or smaller than 1 ha into larger clusters.
We assessed classification accuracy by generating stratified random points for the classified images. For both periods, independent training sites were used to assess the accuracy of each LULC map based on the data set retained for validation purposes. The population of pixels was first stratified by land-cover class, and a number of pixel observations was randomly selected in each class, with a minimum of 50 observations per category [52]. A confusion matrix was produced and overall accuracy, user’s accuracy (commission error), producer’s accuracy (omission error) and the Kappa coefficient were calculated [52,53].
LULC changes that had occurred between ca. 1990 and ca. 2015 were assessed via post-classification map comparisons [54]. We produced a cropland abandonment map by overlaying two LULC maps, where cropland abandonment was defined as those pixels that were classified as cropland around 1990, but classified as grassland in ca. 2015. Other LULC change processes were also quantified (e.g., conversions from grassland to forest, from wetland to grassland, from forest to cropland, bare soils, from cropland to artificial surfaces), but not considered in further analysis as they were mostly of minor extent and not in the focus of our research question. Post-classification processing was done in ArcMap version 10.2 and QGIS version 2.8.
2.3. Exploring Determinants of Cropland Abandonment
We used binary logistic regression, i.e., Generalized Linear Models (GLMs) with a binomial error distribution and a logit link to explore determinants of cropland abandonment [19,20,27,29]. As we were interested in quantifying uncertainty in the determinants and to reduce spatial autocorrelation, we did not use all pixels for analysis, but sampled 2402 sample points randomly across the change classes stable cropland and abandoned cropland (i.e., grassland on former cropland) from the LULC change map, with a minimum distance of 700 m between points to further reduce spatial autocorrelation [27,55]. The response variable was presence or absence of abandonment at a random point, i.e., a class transition from cropland to grassland (abandonment, 1), or a lack of transition (stable cropland, 0). We compiled a set of spatially explicit variables (biophysical and socioeconomic predictors) that we expected to influence spatial patterns of cropland abandonment, and that were extracted from GIS layer at each sample point. Selection was based on data availability, existing hypotheses on important determinants, and our own field experience incl. interviews with major stakeholders from agriculture [56].
We anticipated that most of the cropland abandonment would have happened on the poorest soils. Soil type was used as a proxy for agricultural suitability and yield potential [57] and extracted for each sampling point from a province-wide soil map scaled 1:300,000 [58] that was digitized manually in ArcMap 10.2. Soil types were grouped into four suitability classes: High, moderate, low and very low soil quality. The categorization of soil types was based on their suitability for crop production, drainage capacity [59], and prevalence under cropland in the study region (based on a random sample of 450 soil profiles, [60]). Chernozem and Phaeozem soils were classified as having a high suitability for crop production due to their very favorable physical attributes and their high nutrient and soil organic matter content. Luvisols and Albeluvisols were classified as having moderate suitability, as organic matter contents are much lower than in Chernozems and Phaeozems. Arenosols have unfavorable pH, soil water and nutrient potentials and were therefore classified as being of moderate suitability. Fluvisols and Gleysols were assigned to the same category due to temporary flooding and stagnant waters. Soils that are hardly suitable for cropping without extensive melioration, namely solonetz soils and histosols (wet and nutrient-poor soils) are contained in class “very poor.”
We anticipated that independent of soil type, crop fields near forest edges would have a higher probability of abandonment as they are often less suitable for crop production than large, contiguous fields [29,61]. Forest cover was about 25% across the study area, and woodland occurs as small patches of birch and pine forest. Fields close to forests are often shaded, which can result in reduced productivity. Additionally, abundant seeds from woody plants might increase the weed load [29]. Therefore, we also included the Euclidean distance to the nearest forest edge as potential predictor of abandonment to examine the effect of forest proximity on cropland abandonment. The distance to the nearest forest edge was calculated using a forest mask derived from the 1990 LULC map.
We furthermore anticipated that the widespread deterioration of transport infrastructure after the collapse of the Soviet Union limited access to remote crop fields, and that this might have triggered cropland abandonment in remote regions. Infrastructure was also considered a proxy of access to local and regional markets, storage facilities and resulting overall transport costs [19,35,62]. We therefore included distance to roads and railroads, which provide access to labor and services, as potential predictors of cropland abandonment [19,21]. Roads and railway lines were extracted as GIS layers from OpenStreetMap [46] and updated using an official road map of Tyumen province [45] scaled 1:200,000 and Google Earth. We considered only tarmac roads for distance calculation because we assumed that these roads were the most important ones for the transport of agricultural goods.
Similarly, we assumed that the pronounced rural outmigration across the study area [56] might have led to decreased workforce availability, availability of agricultural services and a decrease in regional markets and consumer demand. We therefore anticipated that the likelihood of cropland abandonment would increase with increasing distance from larger towns (usually the administrative centers of the rayons), and also tested this for all settlements with more than 500 inhabitants. The data on settlement location and size were extracted from OpenStreetMap and supplemented with population census data from the Federal State Statistics Service of the Tyumen Region [47,63]. Population census data from the late 1980s was used that mirrored the situation before cropland abandonment started.
For all distance variables, we calculated the Euclidian distance of every pixel in the LULC change map to the respective infrastructure. We did not include land-use policies, structural characteristics in agriculture and demographic conditions such as agricultural subsidies, farm size, labor availability, or human migration as predictor variables because of a lack of data. All layers were resampled to 30 m resolution to match the LULC maps derived from the Landsat satellite images.
For analysis, we first fitted univariate logistic regression models, i.e., models examining an association of each potential determinant with cropland abandonment separately. Those variables for which a significant relationship with cropland abandonment was suggested in univariate models were then included in a full model. We also aimed to find the most parsimonious model with the highest explanatory power. We therefore compared models containing all possible combinations of variables (including an intercept-only model without any variables) using an automated procedure (function ‘dredge’ implemented in R package ‘MuMIn’, [64]). To avoid multi-collinearity, we first tested for correlation among variables, but there were no strong correlations (Pearson’s r > 0.7, [65]). Models within 2 AIC units of that with the smallest AIC were considered as receiving equal support from the data. Relative variable importance w+(j) was calculated as the sum of Akaike weights over all models including the respective explanatory variable [66]. Hosmer–Lemeshow tests were used to assess the goodness of fit. Model calibration and refinement were assessed with Nagelkerke’s R2 [67]. The discriminative power of the models was evaluated by calculating the area under the curve (AUC) of the receiver operating characteristic (ROC) plots [68] using implementations in the R packages ‘fmsb’ [69] and ‘pROC’ [70]. All statistical analyses were performed in R 3.5.1 [71].
3. Results
3.1. Accuracy of the LULC Maps
Overall classification accuracy for the separate LULC maps was high (1990: 88%, κ = 0.84; 2015: 91.60%, κ = 0.90). Forest areas were classified with a high user’s and producer’s accuracy both on the 1990 and 2015 LULC maps (>90%), whereas accuracies for cropland and grassland were slightly lower (Table 1 and Table 2). The LULC change map had an overall classification accuracy of 89% (Table 3).

Table 1.
Confusion matrix for ca. 1990 with overall accuracy, producer’s accuracy (PA), and user’s accuracy (UA).
Table 2.
Confusion matrix for ca. 2015 with overall accuracy, PA, and UA.
Table 3.
Confusion matrix for the land-use land-cover (LULC) change map with overall accuracy, PA, and UA.
3.2. Spatial Patterns of Cropland Abandonment
The most important LULC change was the abandonment of arable land that manifested as a transition of cropland to grassland in the classification across the study area (Figure 1). The area farmed for crops declined by 22.3% between circa 1990 and 2015, equaling a decrease of 136,030 ha while grassland expanded by 19.6% (186,967 ha). An increase in grassland resulted mainly from the conversion of cropland while forest cover declined only by 5.6%. Changes in the classes “Open Water,” “Wetland” and “Others” were lower, with an increase of 10%, 8.4% and 14% respectively.
3.3. Determinants of Cropland Abandonment
All explanatory variables were significant determinants of cropland abandonment in univariate logistic regression models, with the exception of distance to nearest forest edge (Figure 2).
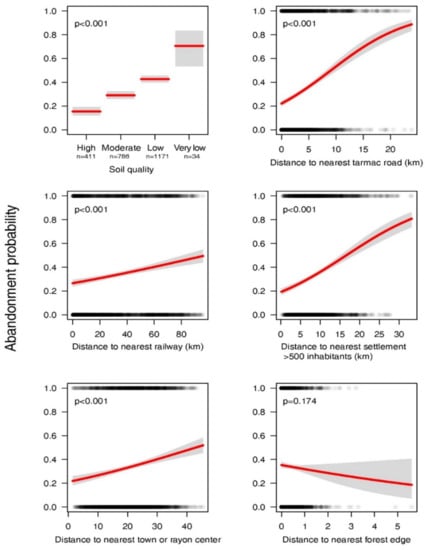
Figure 2.
Predictions of cropland abandonment probability from univariate logistic regression models. p-values indicate significant associations between abandonment probability and the respective variable. Models are plotted with standard errors (grey intervals). The data is overplotted (0—samples of stable cropland, 1—samples of abandoned cropland).
Soil suitability, distance to tarmac roads and railways, and distance to settlements with more than 500 inhabitants were important determinants of cropland abandonment (Table 4). Positive coefficients of the four variables suggested that cropland was more likely to have been abandoned on less fertile soils with lower transport accessibility and increasing distance to settlements with more than 500 inhabitants (Figure 2). The total amount of abandoned cropland increased with decreasing soil quality (Figure 3). Of the cropland on soils classified as being of high quality, only 3% was abandoned, on those classified as being of medium quality, 17%, of poor quality 31% and of very poor quality 55% of all fields.
Table 4.
Regression coefficients β (±1 SE), p-values, odds ratios and spatial resolution used for odds ratio calculation for the full model. The full model contained all variables that had a significant relationship with cropland abandonment in univariate regression models. The model fitted the data well (Hosmer–Lemeshow test, χ2 = 9.212, df = 8, p = 0.325), but there was a lot of unexplained variation (Nagelkerke’s R2 = 0.15). The discriminative ability of the model was fair (AUC = 0.7).
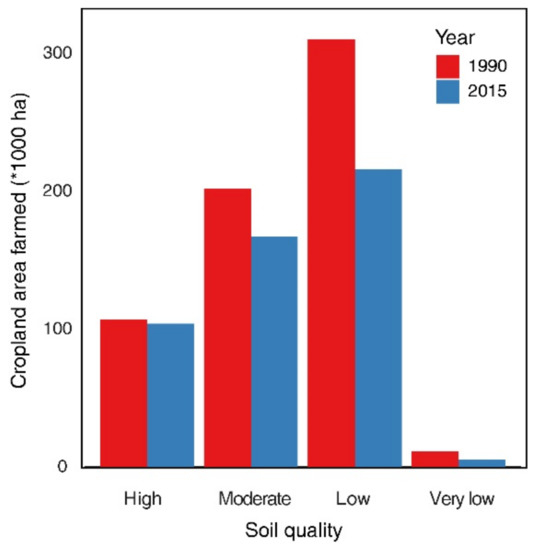
Figure 3.
Area of farmed cropland per soil quality category in 1990 and 2015.
The full logistic regression model containing all variables except distance to forest edge fitted the data much better than an intercept-only model with an AIC difference of 259.8 units (Table 4). The model fitted the data well (Hosmer–Lemeshow test, χ2 = 9.212, df = 8, p = 0.325), but a moderate Nagelkerke’s R2 of 0.15 suggested there was some unexplained variation. This was perhaps due to influential, unrecorded variables. The discriminative ability of the model was fair (AUC = 0.7).
Model selection based on AIC suggested that there was one single best model that contained soil quality, distance to nearest railway, distance to nearest tarmac road and distance to settlement with more than 500 inhabitants. Removing any of these variables resulted in a decrease of the AIC by more than six units (Table 5). An intercept-only model had an AIC of 259.8 units higher than the best model. Variable importance assessed from the AICs was again high for the above mentioned four significant variables in the global model (Table 5).
Table 5.
Competing models of cropland abandonment whose Akaike weights wi sum up to 0.95, and an intercept-only model for comparison. Regression coefficients β ± 1 SE are given for all variables. A ‘+’ sign denotes a categorical variable that is included in the model. AIC—Akaike’s Information Criterion, ΔAIC—difference in AIC to the best model, wi—Akaike weights, w+(j)—variable importance, AUC—area under the curve of a receiver operator characteristic (ROC) plot, R2N—Nagelkerke’s R2, p (HL)—p-value of the Hosmer and Lemeshow goodness of fit test.
4. Discussion
We show that cropland abandonment after the collapse of the Soviet Union happened over large areas in the Western Siberian grain belt, and detected a cropland-to-grassland conversion rate of over 20% across a large study area in Tyumen province. Both biophysical and socio-economic factors were important determinants of cropland abandonment in Western Siberia: The likelihood of cropland abandonment was highest on the poorest soils, and in remote areas with poor road network and infrastructure access.
Our findings confirm the general trends and patterns of post-Soviet land abandonment in other regions [30,32,33,34]. However, the current proportion of cropland abandonment in our study area is lower than reported for the European part of Russia [19], Western Ukraine [72], and Northern Kazakhstan [30]. This might be due to the fact that some abandoned cropland was recultivated earlier than in other parts of Russia [36]. It might also be related to the proximity of the flourishing Russian oil and gas industries north of the Tyumen region in Khanty-Mansiysk and Yamalo-Nenets Autonomous Regions that provided markets and investments for food production in the south of the Tyumen province [36]. Another factor may be the comparatively high soil quality in the study region with a considerable amount of fertile Chernozem soils [60] that might have led to lower abandonment rates than in other, marginal regions.
Patterns in crop abandonment are determined by a mix of biophysical, ecological and socio-economic factors that can differ according to local land-use history, climate, and landscape composition [7,73]. A correlation between abandonment likelihood and soil quality was also evident in neighboring Kazakhstan [30], western Ukraine [72]. In the Soviet era, the area of arable land increased significantly under the specific conditions of the Soviet economy [74], pushing crop cultivation into less suitable, marginal or isolated areas. A prominent example for that is the “Virgin Lands Campaign” from 1953–1961 when more than 35 million ha of virgin steppe in northern Kazakhstan and Western Siberia were plowed for mainly wheat cultivation within just seven years [74]. Sites of limited suitability for cropping such as gleyic and wet organic soils, or sandy, nutrient-poor podzolic soils were cultivated [75]. Soil quality is decisive for farmers regarding expected yields and a certain level of income from farming. Therefore, for profit reasons under market conditions, poor soils were more often abandoned, while arable cultivation was maintained on soils with higher quality. In European Russia, a strong determinant of cropland abandonment was yield [19]. Meanwhile, soil pH as one characteristic of cultivation suitability was a rather weak determinant [19], perhaps due to the fact that the soil pH gradient was much shallower than in our study area.
Our results also suggest that not only soil quality but also the accessibility and remoteness of fields are major correlates of cropland abandonment in Western Siberia. With increasing distance of crop fields to tarmac, railways and rural settlements, the likelihood of abandonment significantly increased. Hence, the now emerging land-use pattern resembles the von Thünen patterns [19,34], unlike in the Soviet era. In the von Thünen framework, land rent is constrained by land quality and distance to markets [76]. Therefore, fields with poor soil quality at sites with low accessibility are characterized by the smallest profit margins. The lack of capital due to lost government subsidies after the break-up of the Soviet Union might have led to a concentration of capital and labor inputs on the better accessible arable land (i.e., closer to roads, populated places). Compared to the European part of Russia, accessibility is generally much poorer in Western Siberia [77] and might thus cause high agricultural production costs in remote areas.
The distance to settlements with more than 500 inhabitants was significantly positively associated with the likelihood of cropland abandonment. This outcome is consistent with other studies from the European part of Russia [19] and from other post-communist countries such as Albania [55] and Slovakia [21]. This finding may also be explained by the fact that in our region settlements with more than 500 inhabitants already represent important infrastructure. They might provide substantial support for agricultural activities such as logistics, technical services, labor, and accessibility to markets and consumers [77]. The distance to towns and rayon centers was of minor importance in explaining the likelihood of cropland abandonment in our analysis. This was unexpected, as larger towns were less affected by outmigration due to higher living standards und should therefore offer workforce. Larger settlements are also characterized by increased demand for produce from agriculture and therefore better market opportunities, so are more attractive for larger agricultural companies.
Cropland abandonment often happens closer to forest edges [19,29,61], which is perhaps the result of poorer soil quality closer to forest edges. Additionally, in fragmented landscapes such as the forest steppe of Siberia, fields in areas with more woods are smaller and more difficult to access and farm due to their irregular shape. We did not find an effect of distance to forest on cropland abandonment probability, which could perhaps be explained by the long history of farming in the region [78], and its adaptation to a patchy landscape of small birch groves and grasslands. In European Russia, where distance to forest edge was a determinant of abandonment [19], forests usually occurred as large compact blocks indicating areas with less favorable soil conditions for crop production.
In our analyses, the models fitted the data well, but the explained variance and discriminative power were rather low, compared to similar studies from Switzerland [29], European Russia [19], and South America [61]. This might point to the fact that we did not consider important socio-economic determinants of rural processes such as rural outmigration, which is pronounced in the study area and leads to a lack of farm workers and skilled agricultural technicians in certain areas [56].
Official statistical data on land use and socio-economics were limited in spatial resolution for our study area. This did not allow us to develop municipality-level models. Dividing the study area into smaller spatial units could increase spatial homogeneity and improve the explanatory power of models [29]. Fortunately, our study area is quite homogeneous regarding to biophysical conditions (see Section 2.1) which buffers the shortcomings of a large-scale analysis.
The Russian economy has been recovering since around the year 2003 [79]. In addition, the global demand for food, fodder and biofuels has dramatically increased in recent years and will further increase in the future [80]. Policies have been issued to recover the agricultural production in Russia and Western Siberia [81]. Ca. 5.2% (2.3 million ha) of Russia’s abandoned land had already been recultivated in 2008 [82]. In 2017 alone, a further 650,000 ha were recultivated, and there are political incentives to return up to 10 million ha into production [83]. However, this will only be possible with state and regional subsidies, with estimated costs of ca. 64 million Euro per 200,000 ha recultivated land [84]. As we show here, abandoned land is situated mostly in areas of poor soil quality that are difficult to access, so transport costs might be too high to generate revenue in these areas. The extent of future recultivation is therefore difficult to predict. Furthermore, there are trade-offs in re-cultivating abandoned cropland [32]. In our study area, ecosystem services such as greenhouse gas mitigation potential [85,86] and carbon sequestration [60] benefitted from cropland abandonment. Positive biodiversity responses to cropland abandonment in Western Siberia and adjacent Kazakhstan have also been shown, e.g., for grassland plants [51], grasshoppers [41] and birds [87]. Closing yield gaps on existing cropland has been suggested as an alternative for Russia [88], but might result in increased use of fertilizer and pesticides, which are the default option in intensification. Future agricultural strategies should therefore also consider self-sufficiency of the rural population and local food production in less intensive systems. Indeed, a slight increase in semi-subsistence farming has been observed in Western Siberia in recent years [81].
5. Conclusions
The former Soviet Union is a global hotspot of cropland abandonment, and the so-called Western Siberian grain belt is particularly interesting in this regard. We identified the scale of cropland abandonment, its spatial patterns and the regional determinants of cropland abandonment in cereal belt in the south of Western Siberia. Our results revealed 20% cropland abandoned over 25 years (1990–2015) and both biophysical and socio-economic factors were important determinants of cropland abandonment. In particular, less fertile soils, poorer transport accessibility and larger distances to larger rural settlements were linked to higher proportions of abandoned agriculture in Western Siberia. Therefore, the current land-use pattern in Western Siberia has shifted toward market-based principles, when compared to the Soviet era. We also showed that Landsat images are well suited to detect cropland abandonment in forest-steppe areas with a classification accuracy of almost 90%.
Author Contributions
H.N. and N.H. conceived and designed the experiments; H.N. and J.K. analyzed the data; N.H. and A.V. validated the results and contributed to data analysis. The first manuscript draft was prepared by H.N.; N.H. and J.K. contributed to the writing. All authors commented on the manuscript.
Funding
This work was conducted as part of project SASCHA (‘Sustainable land management and adaptation strategies to climate change for the Western Siberian grain belt’), funded by the German Government, Federal Ministry of Education and Research within their Sustainable Land Management funding framework (funding reference 01LL0906). The Vietnamese Government Scholarship programme (911 Project) funded the first author’s Ph.D. study. We acknowledge support by Open Access Publication Fund of University of Muenster.
Acknowledgments
The authors are grateful to the U.S. Geological Survey (http://glovis.usgs.gov) for providing the Landsat data. We thank Daniel Müller, Alexander Prishchepov and two anonymous reviewers for valuable suggestions on earlier drafts of the manuscript.
Conflicts of Interest
The authors declare no conflict of interest.
References
- Foley, J.A. Global Consequences of Land Use. Science 2005, 309, 570–574. [Google Scholar] [CrossRef] [PubMed]
- Meyfroidt, P. Approaches and terminology for causal analysis in land systems science. J. Land Use Sci. 2016, 11, 501–522. [Google Scholar] [CrossRef]
- Ursino, N.; Romano, N. Wild forest fire regime following land abandonment in the Mediterranean region. Geophys. Res. Lett. 2014, 41, 8359–8368. [Google Scholar] [CrossRef]
- Navarro, L.M.; Pereira, H.M. Rewilding Abandoned Landscapes in Europe. Ecosystems 2012, 15, 900–912. [Google Scholar] [CrossRef]
- Stanchi, S.; Freppaz, M.; Agnelli, A.; Reinsch, T.; Zanini, E. Properties, best management practices and conservation of terraced soils in Southern Europe (from Mediterranean areas to the Alps): A review. Quat. Int. 2012, 265, 90–100. [Google Scholar] [CrossRef]
- MacDonald, D.; Crabtree, J.; Wiesinger, G.; Dax, T.; Stamou, N.; Fleury, P.; Gutierrez Lazpita, J.; Gibon, A. Agricultural abandonment in mountain areas of Europe: Environmental consequences and policy response. J. Environ. Manag. 2000, 59, 47–69. [Google Scholar] [CrossRef]
- Benayas, J.R.; Martins, A.; Nicolau, J.M.; Schulz, J.J. Abandonment of agricultural land: An overview of drivers and consequences. CAB Rev. Perspect. Agric. Vet. Sci. Nutr. Nat. Resour. 2007, 2. [Google Scholar] [CrossRef]
- Queiroz, C.; Beilin, R.; Folke, C.; Lindborg, R. Farmland abandonment: Threat or opportunity for biodiversity conservation? A global review. Front. Ecol. Environ. 2014, 12, 288–296. [Google Scholar] [CrossRef]
- Hölzel, N.; Haub, C.; Ingelfinger, M.P.; Otte, A.; Pilipenko, V.N. The return of the steppe large-scale restoration of degraded land in southern Russia during the post-Soviet era. J. Nat. Conserv. 2002, 10, 75–85. [Google Scholar] [CrossRef]
- Kamp, J.; Reinhard, A.; Frenzel, M.; Kämpfer, S.; Trappe, J.; Hölzel, N. Farmland bird responses to land abandonment in Western Siberia. Agric. Ecosyst. Environ. 2018, 268, 61–69. [Google Scholar] [CrossRef]
- Houghton, R.A.; Goodale, C.L. Effects of land-use change on the carbon balance of terrestrial ecosystems. In Geophysical Monograph Series; DeFries, R.S., Asner, G.P., Houghton, R.A., Eds.; American Geophysical Union: Washington, DC, USA, 2004; Volume 153, pp. 85–98. ISBN 978-0-87590-418-4. [Google Scholar]
- Kuemmerle, T.; Olofsson, P.; Chaskovskyy, O.; Baumann, M.; Ostapowicz, K.; Woodcock, C.E.; Houghton, R.A.; Hostert, P.; Keeton, W.S.; Radeloff, V.C. Post-Soviet farmland abandonment, forest recovery, and carbon sequestration in western Ukraine. Glob. Chang. Biol. 2011, 17, 1335–1349. [Google Scholar] [CrossRef]
- Schierhorn, F.; Müller, D.; Beringer, T.; Prishchepov, A.V.; Kuemmerle, T.; Balmann, A. Post-Soviet cropland abandonment and carbon sequestration in European Russia, Ukraine, and Belarus. Glob. Biogeochem. Cycles 2013, 27, 1175–1185. [Google Scholar] [CrossRef]
- Aide, T.M. Ecology: Enhanced: Globalization, Migration, and Latin American Ecosystems. Science 2004, 305, 1915–1916. [Google Scholar] [CrossRef]
- Munroe, D.K.; van Berkel, D.B.; Verburg, P.H.; Olson, J.L. Alternative trajectories of land abandonment: Causes, consequences and research challenges. Curr. Opin. Environ. Sustain. 2013, 5, 471–476. [Google Scholar] [CrossRef]
- Raj Khanal, N.; Watanabe, T. Abandonment of Agricultural Land and Its Consequences: A Case Study in the Sikles Area, Gandaki Basin, Nepal Himalaya. Mt. Res. Dev. 2006, 26, 32–40. [Google Scholar] [CrossRef]
- Lambin, E.F.; Meyfroidt, P. Global land use change, economic globalization, and the looming land scarcity. Proc. Natl. Acad. Sci. USA 2011, 108, 3465–3472. [Google Scholar] [CrossRef]
- Levers, C.; Schneider, M.; Prishchepov, A.V.; Estel, S.; Kuemmerle, T. Spatial variation in determinants of agricultural land abandonment in Europe. Sci. Total Environ. 2018, 644, 95–111. [Google Scholar] [CrossRef]
- Prishchepov, A.V.; Müller, D.; Dubinin, M.; Baumann, M.; Radeloff, V.C. Determinants of agricultural land abandonment in post-Soviet European Russia. Land Use Policy 2013, 30, 873–884. [Google Scholar] [CrossRef]
- Hatna, E.; Bakker, M.M. Abandonment and Expansion of Arable Land in Europe. Ecosystems 2011, 14, 720–731. [Google Scholar] [CrossRef]
- Pazúr, R.; Lieskovský, J.; Feranec, J.; Otahel, J. Spatial determinants of abandonment of large-scale arable lands and managed grasslands in Slovakia during the periods of post-socialist transition and European Union accession. Appl. Geogr. 2014, 54, 118–128. [Google Scholar] [CrossRef]
- Ramankutty, N.; Foley, J.A. Estimating historical changes in global land cover: Croplands from 1700 to 1992. Glob. Biogeochem. Cycles 1999, 13, 997–1027. [Google Scholar] [CrossRef]
- Zhang, Y.; Li, X.; Song, W. Determinants of cropland abandonment at the parcel, household and village levels in mountain areas of China: A multi-level analysis. Land Use Policy 2014, 41, 186–192. [Google Scholar] [CrossRef]
- Löw, F.; Prishchepov, A.; Waldner, F.; Dubovyk, O.; Akramkhanov, A.; Biradar, C.; Lamers, J. Mapping Cropland Abandonment in the Aral Sea Basin with MODIS Time Series. Remote Sens. 2018, 10, 159. [Google Scholar] [CrossRef]
- Alcantara, C.; Kuemmerle, T.; Prishchepov, A.V.; Radeloff, V.C. Mapping abandoned agriculture with multi-temporal MODIS satellite data. Remote Sens. Environ. 2012, 124, 334–347. [Google Scholar] [CrossRef]
- Sluiter, R.; de Jong, S.M. Spatial patterns of Mediterranean land abandonment and related land cover transitions. Landsc. Ecol. 2007, 22, 559–576. [Google Scholar] [CrossRef]
- Müller, D.; Kuemmerle, T.; Rusu, M.; Griffiths, P. Lost in transition: Determinants of post-socialist cropland abandonment in Romania. J. Land Use Sci. 2009, 4, 109–129. [Google Scholar] [CrossRef]
- Baldock, D. Farming at the Margins: Abandonment or Redeployment of Agricultural Land in Europe; Institute for European Environmental Policy: London, UK, 1996; ISBN 978-90-5242-368-5. [Google Scholar]
- Gellrich, M.; Baur, P.; Koch, B.; Zimmermann, N.E. Agricultural land abandonment and natural forest re-growth in the Swiss mountains: A spatially explicit economic analysis. Agric. Ecosyst. Environ. 2007, 118, 93–108. [Google Scholar] [CrossRef]
- Kraemer, R.; Prishchepov, A.V.; Müller, D.; Kuemmerle, T.; Radeloff, V.C.; Dara, A.; Terekhov, A.; Frühauf, M. Long-term agricultural land-cover change and potential for cropland expansion in the former Virgin Lands area of Kazakhstan. Environ. Res. Lett. 2015, 10, 054012. [Google Scholar] [CrossRef]
- Grau, H.R.; Aide, T.M. Globalization and land-use transitions in Latin America. Ecol. Soc. 2008, 13, 2. [Google Scholar] [CrossRef]
- Meyfroidt, P.; Schierhorn, F.; Prishchepov, A.V.; Müller, D.; Kuemmerle, T. Drivers, constraints and trade-offs associated with recultivating abandoned cropland in Russia, Ukraine and Kazakhstan. Glob. Environ. Chang. 2016, 37, 1–15. [Google Scholar] [CrossRef]
- Lesiv, M.; Schepaschenko, D.; Moltchanova, E.; Bun, R.; Dürauer, M.; Prishchepov, A.V.; Schierhorn, F.; Estel, S.; Kuemmerle, T.; Alcántara, C.; et al. Spatial distribution of arable and abandoned land across former Soviet Union countries. Sci. Data 2018, 5, 180056. [Google Scholar] [CrossRef]
- Ioffe, G.; Nefedova, T.; Zaslavsky, I. From Spatial Continuity to Fragmentation: The Case of Russian Farming. Ann. Assoc. Am. Geogr. 2004, 94, 913–943. [Google Scholar] [CrossRef]
- Smaliychuk, A.; Müller, D.; Prishchepov, A.V.; Levers, C.; Kruhlov, I.; Kuemmerle, T. Recultivation of abandoned agricultural lands in Ukraine: Patterns and drivers. Glob. Environ. Chang. 2016, 38, 70–81. [Google Scholar] [CrossRef]
- Kühling, I.; Broll, G.; Trautz, D. Spatio-temporal analysis of agricultural land-use intensity across the Western Siberian grain belt. Sci. Total Environ. 2016, 544, 271–280. [Google Scholar] [CrossRef]
- Zhilich, S.; Rudaya, N.; Krivonogov, S.; Nazarova, L.; Pozdnyakov, D. Environmental dynamics of the Baraba forest-steppe (Siberia) over the last 8000 years and their impact on the types of economic life of the population. Quat. Sci. Rev. 2017, 163, 152–161. [Google Scholar] [CrossRef]
- Wesche, K.; Ambarlı, D.; Kamp, J.; Török, P.; Treiber, J.; Dengler, J. The Palaearctic steppe biome: A new synthesis. Biodivers. Conserv. 2016, 25, 2197–2231. [Google Scholar] [CrossRef]
- Smith, L.C. Siberian Peatlands a Net Carbon Sink and Global Methane Source Since the Early Holocene. Science 2004, 303, 353–356. [Google Scholar] [CrossRef]
- Mathar, W.P.; Kämpf, I.; Kleinebecker, T.; Kuzmin, I.; Tolstikov, A.; Tupitsin, S.; Hölzel, N. Floristic diversity of meadow steppes in the Western Siberian Plain: Effects of abiotic site conditions, management and landscape structure. Biodivers. Conserv. 2016, 25, 2361–2379. [Google Scholar] [CrossRef]
- Weking, S.; Kämpf, I.; Mathar, W.; Hölzel, N. Effects of land use and landscape patterns on Orthoptera communities in the Western Siberian forest steppe. Biodivers. Conserv. 2016, 25, 2341–2359. [Google Scholar] [CrossRef]
- Selezneva, N.S. Lesostep (Forest steppe). In Fiziko-Geografičeskoe Rajonirovanie Tjumenskoj Oblasti (Physical geography of the Oblast Tyumen); Gwodezkij, N.A., Ed.; Izdatelstvo MGU: Moscow, Russia, 1973. (In Russian) [Google Scholar]
- Olson, D.M.; Dinerstein, E.; Wikramanayake, E.D.; Burgess, N.D.; Powell, G.V.N.; Underwood, E.C.; D’amico, J.A.; Itoua, I.; Strand, H.E.; Morrison, J.C.; et al. Terrestrial Ecoregions of the World: A New Map of Life on Earth. BioScience 2001, 51, 933. [Google Scholar] [CrossRef]
- Degefie, D.T.; Fleischer, E.; Klemm, O.; Soromotin, A.V.; Soromotina, O.V.; Tolstikov, A.V.; Abramov, N.V. Climate extremes in South Western Siberia: Past and future. Stoch. Environ. Res. Risk Assess. 2014, 28, 2161–2173. [Google Scholar] [CrossRef]
- Roskartografiya. Multi-Volume Road Atlas of Russia: Tyumen Province, Scale 1:200,000; Smolensk Poligrafic Combinate: Smolensk, Russia, 2008. (In Russian) [Google Scholar]
- OpenStreetMap Contributors Planet Dump. 2015. Available online: http://planet.osm.org (accessed on 6 December 2018).
- TYUMSTAT. Tyumenstat—Territorial Authority of the Federal State Statistics Service of the Tyumen Region; Russia, 2015. Available online: http://tumstat.gks.ru/ (accessed on 30 December 2015).
- Terentieva, I.E.; Glagolev, M.V.; Lapshina, E.D.; Sabrekov, A.F.; Maksyutov, S. Mapping of West Siberian taiga wetland complexes using Landsat imagery: Implications for methane emissions. Biogeosciences 2016, 13, 4615–4626. [Google Scholar] [CrossRef]
- Tillmann, C. Supervised Classification and Change Detection of Agricultural Land Use in the Forest Steppe Zone of West Siberia Using Multitemporal Satellite Imagery. Master’s Thesis, University of Münster (WWU), Münster, Germany, 2012. [Google Scholar]
- Song, C.; Woodcock, C.E.; Seto, K.C.; Lenney, M.P.; Macomber, S.A. Classification and Change Detection Using Landsat TM Data: When and How to correct Atmospheric Effects? Remote Sens. Environ. 2001, 75, 230–244. [Google Scholar] [CrossRef]
- Kämpf, I.; Mathar, W.; Kuzmin, I.; Hölzel, N.; Kiehl, K. Post-Soviet recovery of grassland vegetation on abandoned fields in the forest steppe zone of Western Siberia. Biodivers. Conserv. 2016, 25, 2563–2580. [Google Scholar] [CrossRef]
- Congalton, R.G. A review of assessing the accuracy of classifications of remotely sensed data. Remote Sens. Environ. 1991, 37, 35–46. [Google Scholar] [CrossRef]
- Olofsson, P.; Foody, G.M.; Herold, M.; Stehman, S.V.; Woodcock, C.E.; Wulder, M.A. Good practices for estimating area and assessing accuracy of land change. Remote Sens. Environ. 2014, 148, 42–57. [Google Scholar] [CrossRef]
- Coppin, P.; Jonckheere, I.; Nackaerts, K.; Muys, B.; Lambin, E. Review ArticleDigital change detection methods in ecosystem monitoring: A review. Int. J. Remote Sens. 2004, 25, 1565–1596. [Google Scholar] [CrossRef]
- Müller, D.; Munroe, D.K. Changing Rural Landscapes in Albania: Cropland Abandonment and Forest Clearing in the Postsocialist Transition. Ann. Assoc. Am. Geogr. 2008, 98, 855–876. [Google Scholar] [CrossRef]
- Griewald, Y.; Clemens, G.; Kamp, J.; Gladun, E.; Hölzel, N.; von Dressler, H. Developing land use scenarios for stakeholder participation in Russia. Land Use Policy 2017, 68, 264–276. [Google Scholar] [CrossRef]
- Gregorich, E.G.; Carter, M.R. (Eds.) Soil Quality for Crop Production and Ecosystem Health; Elsevier: Amsterdam, The Netherlands; New York, NY, USA, 1997; ISBN 978-0-444-81661-0. [Google Scholar]
- Karetin, L.N.; Gadzhiev, I.M. Soil Map of the South of Tyumen Province 1:300,000 (Reference Year 1989); Omsk Map Factory: Omsk, Russia, 1992. [Google Scholar]
- FAO. World Soil Resource Reports—World Reference Base for Soil Resources 2014: International Soil Classification System for Naming Soils and Creating Legends for Soil Maps (Update 2015); FAO: Rome, Italy, 2015; Volume 106, ISBN 978-92-5-108369-7. [Google Scholar]
- Wertebach, T.-M.; Hölzel, N.; Kämpf, I.; Yurtaev, A.; Tupitsin, S.; Kiehl, K.; Kamp, J.; Kleinebecker, T. Soil carbon sequestration due to post-Soviet cropland abandonment: Estimates from a large-scale SOC field inventory. Glob. Chang. Biol. 2017. [Google Scholar] [CrossRef]
- Díaz, G.I.; Nahuelhual, L.; Echeverría, C.; Marín, S. Drivers of land abandonment in Southern Chile and implications for landscape planning. Landsc. Urban Plan. 2011, 99, 207–217. [Google Scholar] [CrossRef]
- Chomitz, K.M.; Gray, D.A. Roads, Land Use, and Deforestation: A Spatial Model Applied to Belize. World Bank Econ. Rev. 1996, 10, 487–512. [Google Scholar] [CrossRef]
- Demoscope Weekly. All-Union Population Census of 1989; Institute of Demography at the National Research University, Higher School of Economics, Russia, 1989. Available online: http://www.demoscope.ru/weekly/ssp/rus89_reg1.php (accessed on 18 July 2016). (In Russian).
- Barton, K. MuMIn: Multi-model Inference. R Package. 2012. Available online: https://cran.r-project.org/web/packages/MuMIn/MuMIn.pdf (accessed on 6 December 2018).
- Dormann, C.F.; Elith, J.; Bacher, S.; Buchmann, C.; Carl, G.; Carré, G.; Marquéz, J.R.G.; Gruber, B.; Lafourcade, B.; Leitão, P.J.; et al. Collinearity: A review of methods to deal with it and a simulation study evaluating their performance. Ecography 2013, 36, 27–46. [Google Scholar] [CrossRef]
- Burnham, K.P.; Anderson, D.R. (Eds.) Model Selection and Multimodel Inference; Springer: New York, NY, USA, 2002; ISBN 978-0-387-95364-9. [Google Scholar]
- Nagelkerke, N.J.D. A Note on a General Definition of the Coefficient of Determination. Biometrika 1991, 78, 691–692. [Google Scholar] [CrossRef]
- Hanley, J.A.; McNeil, B.J. A method of comparing the areas under receiver operating characteristic curves derived from the same cases. Radiology 1983, 148, 839–843. [Google Scholar] [CrossRef]
- Nakazawa, M. Package ‘fmsb’. R package: Functions for Medical Statistics Book with Some Demographic Data. 2017. Available online: https://cran.r-project.org/web/packages/fmsb/fmsb.pdf (accessed on 6 December 2018).
- Robin, X.; Turck, N.; Hainard, A.; Tiberti, N.; Lisacek, F.; Sanchez, J.-C.; Müller, M. pROC: An open-source package for R and S+ to analyze and compare ROC curves. BMC Bioinform. 2011, 12, 77. [Google Scholar] [CrossRef]
- R Core Team. R: A Language and Environment for Statistical Computing; Foundation for Statistical Computing: Vienna, Austria, 2016; ISBN 3-900051-07-0. [Google Scholar]
- Baumann, M.; Kuemmerle, T.; Elbakidze, M.; Ozdogan, M.; Radeloff, V.C.; Keuler, N.S.; Prishchepov, A.V.; Kruhlov, I.; Hostert, P. Patterns and drivers of post-socialist farmland abandonment in Western Ukraine. Land Use Policy 2011, 28, 552–562. [Google Scholar] [CrossRef]
- Van Vliet, J.; de Groot, H.L.F.; Rietveld, P.; Verburg, P.H. Manifestations and underlying drivers of agricultural land use change in Europe. Landsc. Urban Plan. 2015, 133, 24–36. [Google Scholar] [CrossRef]
- McCauley, M. Khrushchev and the Development of Soviet Agriculture: The Virgin Land Programme, 1953–1964; Holmes & Meier Publishers: New York, NY, USA, 1976; ISBN 978-0-8419-0283-1. [Google Scholar]
- Josephson, P.; Dronin, N.; Mnatsakanian, R.; Cherp, A.; Efremenko, D.; Larin, V. An Environmental History of Russia; Cambridge University Press: Cambridge, UK, 2013; ISBN 978-1-139-02104-3. [Google Scholar]
- Carla, M.W. Von Thünen’s Isolated State; Pergamon Press: Oxford, UK, 1966. [Google Scholar]
- Portnov, B.A. Cities of Siberia, Russia: Urban Physical Environment and its Evaluation by City Dwellers. In Focus on Urban and Regional Economics; Nova Science Publishers: Hauppauge, NY, USA, 2006; pp. 65–88. ISBN 1-59454-740-8. [Google Scholar]
- Zakh, V.A.; Ryabogina, N.E.; Chlachula, J. Climate and environmental dynamics of the mid- to late Holocene settlement in the Tobol–Ishim forest-steppe region, West Siberia. Quat. Int. 2010, 220, 95–101. [Google Scholar] [CrossRef]
- World of Information (Firm); International Chamber of Commerce. Europe Review 2003/04: The Economic and Business Report; Kogan Page: London, UK, 2003; ISBN 978-0-7494-4067-1. [Google Scholar]
- FAO. FAO Statistical Pocketbook 2015: World Food and Agriculture; FAO: Rome, Italy, 2015; ISBN 978-92-5-108802-9. [Google Scholar]
- Stupak, N. Adaptation of Russian agriculture to climatic variability: The role of federal and provincial policies. Environ. Sci. Policy 2017, 68, 10–19. [Google Scholar] [CrossRef]
- Werger, M.J.A.; Staalduinen, M.A. (Eds.) Eurasian Steppes: Ecological Problems and Livelihoods in a Changing World; Springer: Dordrecht, The Netherlands, 2012; ISBN 978-94-007-3886-7. [Google Scholar]
- Russia Returned 650,000 Hectares of Abandoned Cropland to Cultivation in 2017—Tkachev. 2017. Available online: http://www.interfax.com/newsinf.asp?y=2014&m=7&d=17&pg=2&id=799973 (accessed on 7 January 2018).
- Russland will Mehr als 2 Millionen Hektar Ackerfläche Urbar Machen. 2018. Available online: https://www.topagrar.com/news/Home-top-News-Russland-will-mehr-als-2-Millionen-Hektar-Ackerflaeche-urbar-machen-9127132.html (accessed on 25 March 2018). (In German).
- Kämpf, I.; Hölzel, N.; Störrle, M.; Broll, G.; Kiehl, K. Potential of temperate agricultural soils for carbon sequestration: A meta-analysis of land-use effects. Sci. Total Environ. 2016, 566–567, 428–435. [Google Scholar] [CrossRef]
- Fleischer, E.; Khashimov, I.; Hölzel, N.; Klemm, O. Carbon exchange fluxes over peatlands in Western Siberia: Possible feedback between land-use change and climate change. Sci. Total Environ. 2016, 545–546, 424–433. [Google Scholar] [CrossRef]
- Kamp, J.; Urazaliev, R.; Donald, P.F.; Hölzel, N. Post-Soviet agricultural change predicts future declines after recent recovery in Eurasian steppe bird populations. Biol. Conserv. 2011, 144, 2607–2614. [Google Scholar] [CrossRef]
- Schierhorn, F.; Faramarzi, M.; Prishchepov, A.V.; Koch, F.J.; Müller, D. Quantifying yield gaps in wheat production in Russia. Environ. Res. Lett. 2014, 9, 084017. [Google Scholar] [CrossRef]
© 2018 by the authors. Licensee MDPI, Basel, Switzerland. This article is an open access article distributed under the terms and conditions of the Creative Commons Attribution (CC BY) license (http://creativecommons.org/licenses/by/4.0/).