Variation of Individual Location Radiance in VIIRS DNB Monthly Composite Images
Abstract
1. Introduction
- seasonal variations in vegetation and snow cover [18];
- atmospheric parameters such as aerosol content [19];
- shift in the ground footprint of pixels and/or differing pixels used in building monthly or annual composites [20];
- changes in the sensitivity or errors in calibration of the imaging sensor [21];
- the presence or absence of temporary (e.g., seasonal) lighting [23];
2. Methods
2.1. Selection of Sites
- Downtowns One site was selected from each of the most populous cities in each of the 50 US states (based on US Census data from 2010 [37]). The DNB imagery was examined together with Google Maps imagery to identify an urban area where the DNB data was relatively smooth (i.e., not a “hot spot”).
- Suburbs Similar to downtown, except that a suburban (mainly residential) location was chosen.
- Stadium The 20 largest stadiums by capacity used by the National Football League (as reported in Wikipedia) were selected, as were the 5 largest sports stadiums in Canada [42].
- Bridges The longest 21 bridges in the USA, the 3 longest bridges in Canada, and the Ambassador bridge crossing between the two countries were selected (as reported in Wikipedia’s “list of longest bridges”). The location to analyze was set at the midpoint of each bridge’s span.
- Prisons Maximum security prisons were examined in order of prison populations [45], and 25 prisons that are well separated from other light sources in the DNB data were selected.
- Wilderness areas The 20 largest wilderness areas in the USA [47] were selected, and a point was placed at the geometric center of the wilderness area. As these areas were all in the American West and Alaska, 5 points in the largest wilderness areas in the eastern USA were also selected.
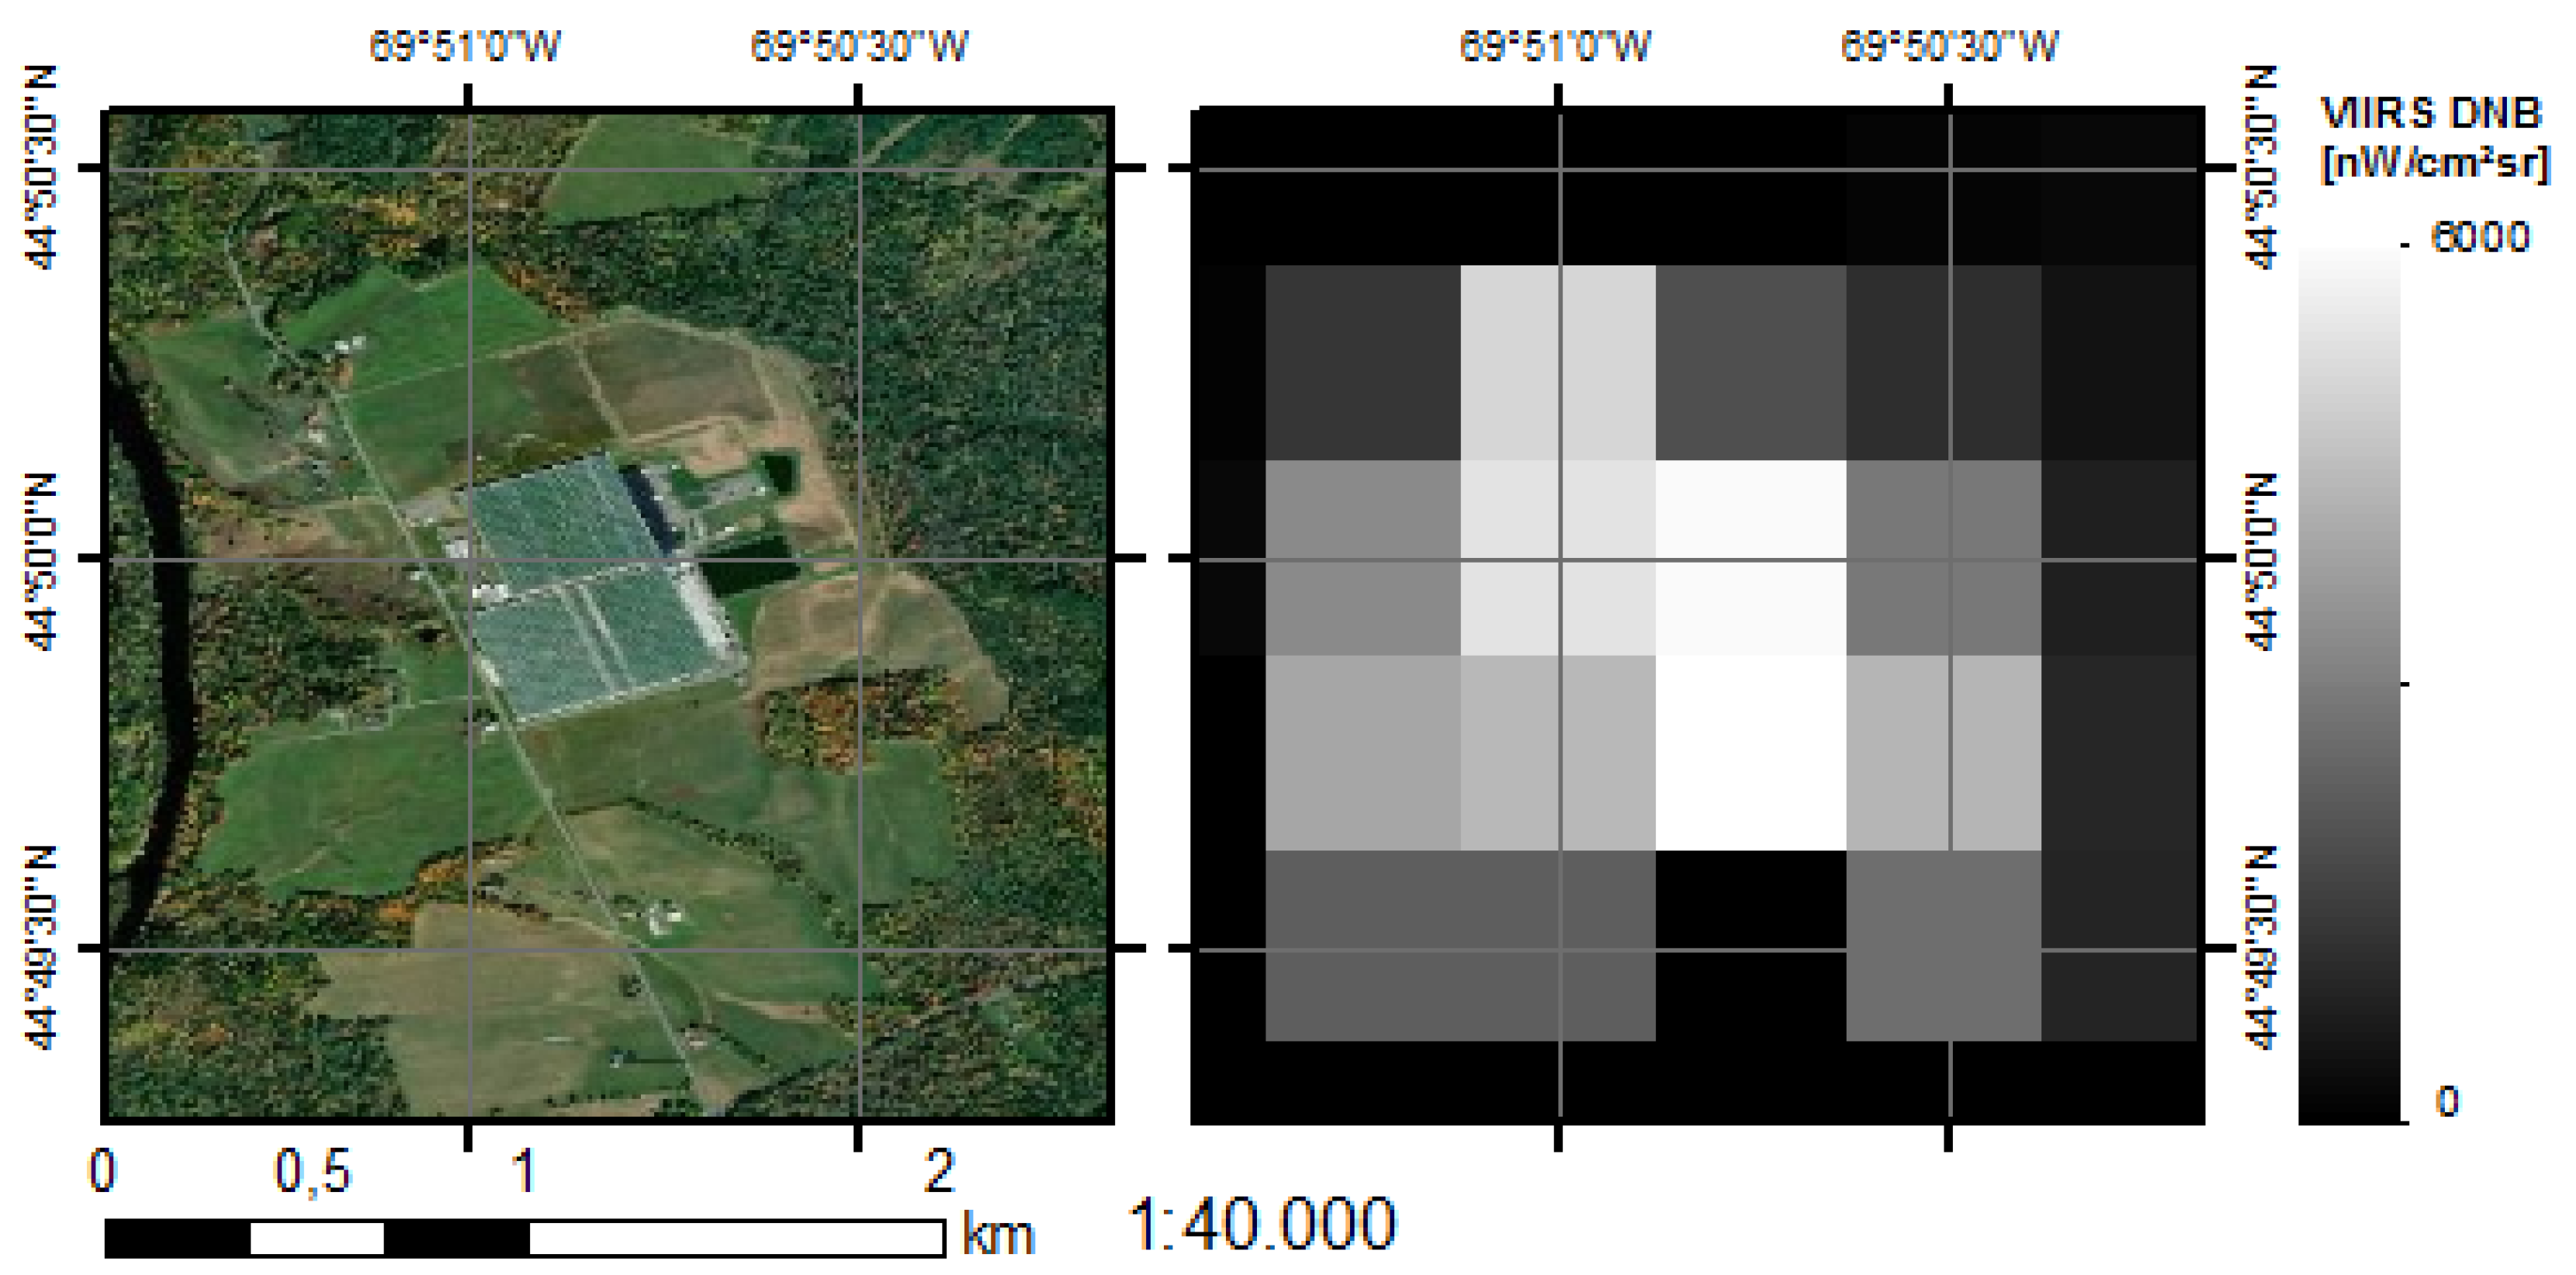
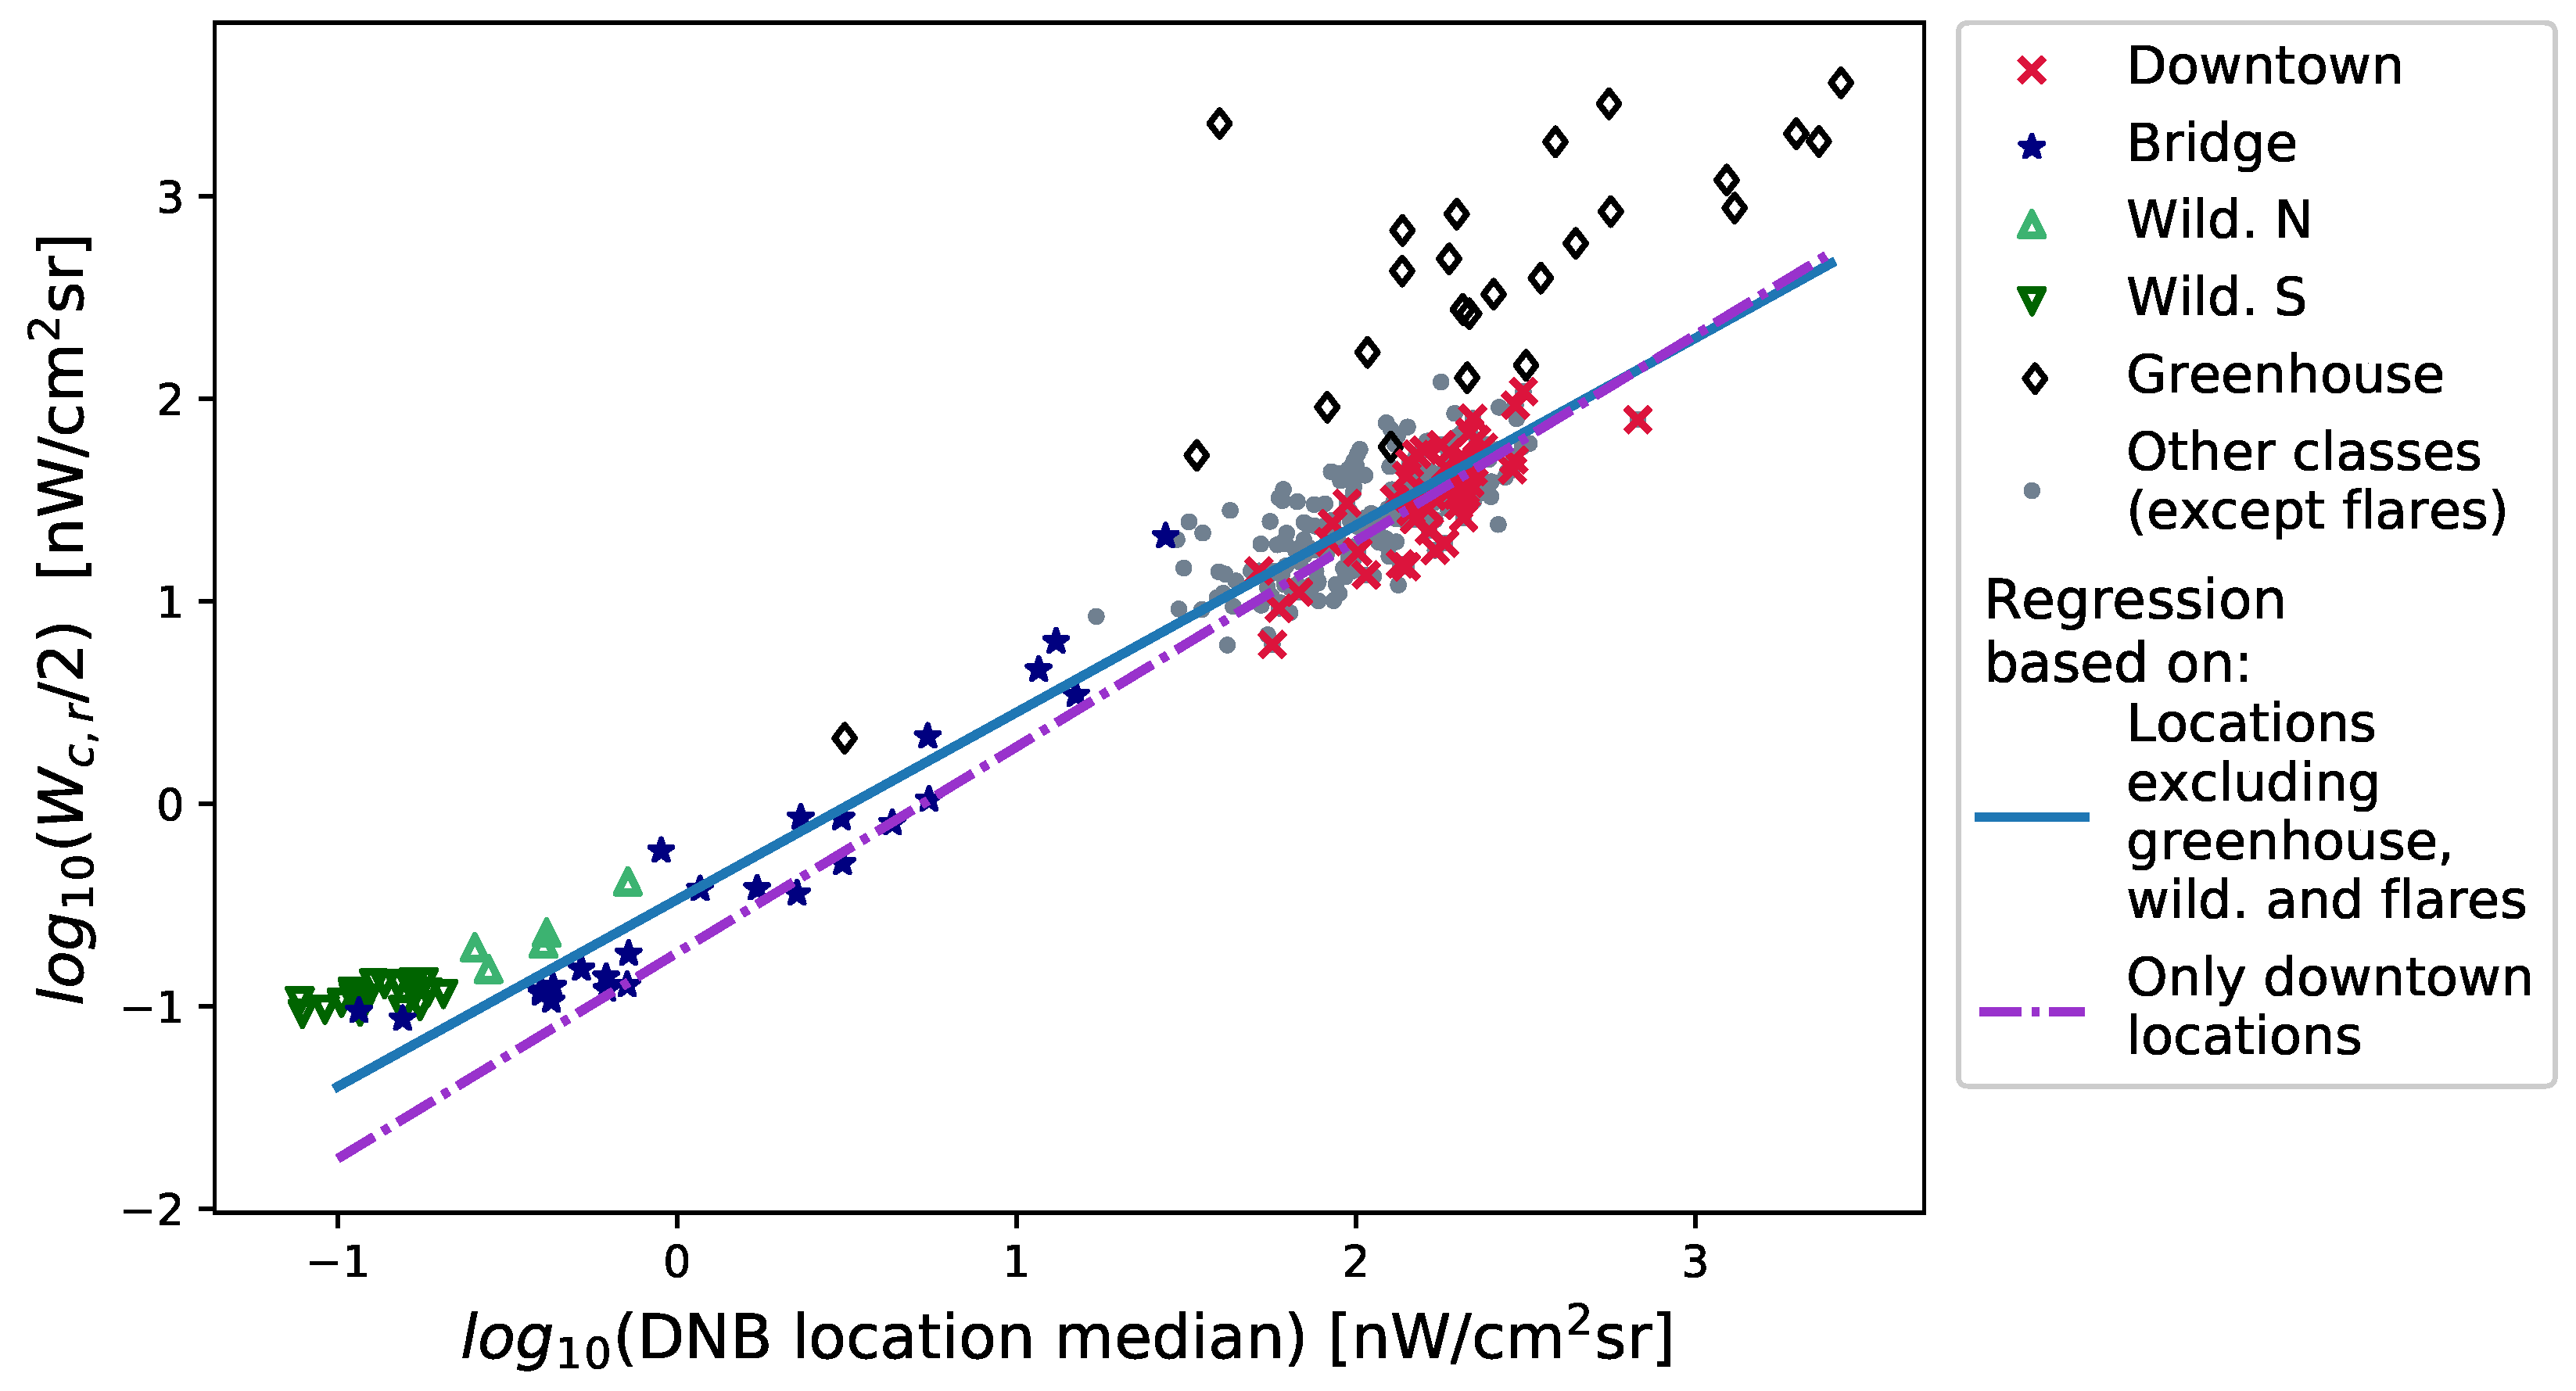
- Greenhouses Greenhouses were identified by searching for extraordinarily bright areas well separated from urban areas in the DNB data and by examining what buildings were present in Google Maps imagery. Large greenhouses typically appear as rectangular buildings or groups of buildings with transparent roofs. Greenhouses are among the brightest of all objects visible in the DNB data, with observed radiances often in the thousands of nW/cmsr (Figure 2).
2.2. Night Light Data
2.3. Analysis
3. Results and Discussion
3.1. Stability of Lighting Classes
3.2. Temporal Correlations at Geographically Separated Sites
3.3. Stability of Gas Flaring
3.4. Seasonal Changes
3.5. Understanding DNB Time Series
4. Conclusions
Supplementary Materials
Author Contributions
Funding
Acknowledgments
Conflicts of Interest
Abbreviations
| ASCII | American Standard Code for Information Interchange |
| c | class (e.g., airport or suburb) |
| DNB | Visible Infrared Imaging Radiometer Suite Day/Night Band |
| Radiance observed at a site by the DNB in nW/cmsr | |
| Median radiance at a given site | |
| NOAA | National Oceanic and Atmospheric Administration |
| Relative monthly radiance | |
| s | site |
| 15.9–84.1 percentile range of the relative monthly radiance for all sites in a given class | |
| 15.9–84.1 percentile range of the monthly radiance in nW/cmsr for a single site |
References
- Elvidge, C.D.; Baugh, K.E.; Kihn, E.A.; Kroehl, H.W.; Davis, E.R. Mapping city lights with nighttime data from the DMSP Operational Linescan System. Photogramm. Eng. Remote Sens. 1997, 63, 727–734. [Google Scholar]
- Lu, H.; Zhang, M.; Sun, W.; Li, W. Expansion Analysis of Yangtze River Delta Urban Agglomeration Using DMSP/OLS Nighttime Light Imagery for 1993 to 2012. ISPRS Int. J. Geo-Inf. 2018, 7, 52. [Google Scholar] [CrossRef]
- Zhu, X.; Ma, M.; Yang, H.; Ge, W. Modeling the spatiotemporal dynamics of gross domestic product in China using extended temporal coverage nighttime light data. Remote Sens. 2017, 9, 626. [Google Scholar] [CrossRef]
- Jiang, W.; He, G.; Long, T.; Liu, H. Ongoing Conflict Makes Yemen Dark: From the Perspective of Nighttime Light. Remote Sens. 2017, 9, 798. [Google Scholar] [CrossRef]
- Levin, N.; Ali, S.; Crandall, D. Utilizing remote sensing and big data to quantify conflict intensity: The Arab Spring as a case study. Appl. Geogr. 2018, 94, 1–17. [Google Scholar] [CrossRef]
- Li, X.; Li, D.; Xu, H.; Wu, C. Intercalibration between DMSP/OLS and VIIRS night-time light images to evaluate city light dynamics of Syria’s major human settlement during Syrian Civil War. Int. J. Remote Sens. 2017, 38, 5934–5951. [Google Scholar] [CrossRef]
- Gaston, K.J.; Duffy, J.P.; Bennie, J. Quantifying the erosion of natural darkness in the global protected area system. Conserv. Biol. 2015, 29, 1132–1141. [Google Scholar] [CrossRef] [PubMed]
- Guetté, A.; Godet, L.; Juigner, M.; Robin, M. Worldwide increase in Artificial Light At Night around protected areas and within biodiversity hotspots. Biol. Conserv. 2018, 223, 97–103. [Google Scholar] [CrossRef]
- Kyba, C.C.; Mohar, A.; Pintar, G.; Stare, J. Reducing the environmental footprint of church lighting: Matching facade shape and lowering luminance with the EcoSky LED. Int. J. Sustain. Light. 2017, 19, 132. [Google Scholar] [CrossRef]
- Kyba, C.C.; Kuester, T.; de Miguel, A.S.; Baugh, K.; Jechow, A.; Hölker, F.; Bennie, J.; Elvidge, C.D.; Gaston, K.J.; Guanter, L. Artificially lit surface of Earth at night increasing in radiance and extent. Sci. Adv. 2017, 3, e1701528. [Google Scholar] [CrossRef]
- Ghosh, T.; Powell, R.L.; Elvidge, C.D.; Baugh, K.E.; Sutton, P.C.; Anderson, S. Shedding light on the global distribution of economic activity. Open Geogr. J. 2010, 3, 147–160. [Google Scholar]
- Ghosh, T.; Elvidge, C.D.; Sutton, P.C.; Baugh, K.E.; Ziskin, D.; Tuttle, B.T. Creating a global grid of distributed fossil fuel CO2 emissions from nighttime satellite imagery. Energies 2010, 3, 1895–1913. [Google Scholar] [CrossRef]
- Jean, N.; Burke, M.; Xie, M.; Davis, W.M.; Lobell, D.B.; Ermon, S. Combining satellite imagery and machine learning to predict poverty. Science 2016, 353, 790–794. [Google Scholar] [CrossRef] [PubMed]
- Kyba, C.; Ruhtz, T.; Lindemann, C.; Fischer, J.; Hölker, F. Two camera system for measurement of urban uplight angular distribution. In Proceedings of the International Radiation Symposium (IRC/IAMAS) Radiation Processes in the Atmosphere and Ocean (IRS2012), Berlin, Germany, 6–10 August 2012; AIP Publishing: Melville, NY, USA, 2013; Volume 1531, pp. 568–571. [Google Scholar]
- Tong, K.P. On Observations of Artificial Light at Night from Ground and Space. Ph.D. Thesis, Universität Bremen, Bremen, Germany, 2017. [Google Scholar]
- Kyba, C.C.M.; Ruhtz, T.; Fischer, J.; Hölker, F. Red is the New Black: How the Color of Urban Skyglow Varies with Cloud Cover. Mon. Not. R. Astron. Soc. 2012, 425, 701–708. [Google Scholar] [CrossRef]
- Bará, S.; Rodríguez-Arós, Á.; Pérez, M.; Tosar, B.; Lima, R.C.; de Miguel, A.S.; Zamorano, J. Estimating the relative contribution of streetlights, vehicles and residential lighting to the urban night sky brightness. Light. Res. Technol. 2018. [Google Scholar] [CrossRef]
- Levin, N. The impact of seasonal changes on observed nighttime brightness from 2014 to 2015 monthly VIIRS DNB composites. Remote Sens. Environ. 2017, 193, 150–164. [Google Scholar] [CrossRef]
- Fu, D.; Xia, X.; Duan, M.; Zhang, X.; Li, X.; Wang, J.; Liu, J. Mapping nighttime PM2.5 from VIIRS DNB using a linear mixed-effect model. Atmos. Environ. 2018, 178, 214–222. [Google Scholar] [CrossRef]
- Elvidge, C.D.; Baugh, K.; Zhizhin, M.; Hsu, F.C.; Ghosh, T. VIIRS night-time lights. Int. J. Remote Sens. 2017, 38, 5860–5879. [Google Scholar] [CrossRef]
- Zeng, X.; Shao, X.; Qiu, S.; Ma, L.; Gao, C.; Li, C. Stability Monitoring of the VIIRS Day/Night Band over Dome C with a Lunar Irradiance Model and BRDF Correction. Remote Sens. 2018, 10, 189. [Google Scholar] [CrossRef]
- Román, M.O.; Wang, Z.; Sun, Q.; Kalb, V.; Miller, S.D.; Molthan, A.; Schultz, L.; Bell, J.; Stokes, E.C.; Pandey, B.; et al. NASA’s Black Marble nighttime lights product suite. Remote Sens. Environ. 2018, 210, 113–143. [Google Scholar] [CrossRef]
- Román, M.O.; Stokes, E.C. Holidays in lights: Tracking cultural patterns in demand for energy services. Earths Future 2015, 3, 182–205. [Google Scholar] [CrossRef] [PubMed]
- Kohiyama, M.; Hayashi, H.; Maki, N.; Higashida, M.; Kroehl, H.; Elvidge, C.; Hobson, V. Early damaged area estimation system using DMSP-OLS night-time imagery. Int. J. Remote Sens. 2004, 25, 2015–2036. [Google Scholar] [CrossRef]
- Cao, C.; Shao, X.; Uprety, S. Detecting light outages after severe storms using the S-NPP/VIIRS day/night band radiances. IEEE Geosci. Remote Sens. 2013, 10, 1582–1586. [Google Scholar] [CrossRef]
- Mann, M.L.; Melaas, E.K.; Malik, A. Using VIIRS day/night band to measure electricity supply reliability: Preliminary results from Maharashtra, India. Remote Sens. 2016, 8, 711. [Google Scholar] [CrossRef]
- Sánchez de Miguel, A.; Zamorano, J.; Gómez Castaño, J.; Pascual, S. Evolution of the energy consumed by street lighting in Spain estimated with DMSP-OLS data. J. Quant. Spectrosc. Radiat. Transfer 2014, 139, 109–117. [Google Scholar] [CrossRef]
- Estrada-García, R.; García-Gil, M.; Acosta, L.; Bará, S.; Sanchez-de Miguel, A.; Zamorano, J. Statistical modelling and satellite monitoring of upward light from public lighting. Light. Res. Technol. 2016, 48, 810–822. [Google Scholar] [CrossRef]
- De Miguel, A.S. Variación Espacial, Temporal y Espectral de la Contaminación Lumınica y Sus Fuentes: Metodologıa y Resultados. Ph.D. Thesis, Universidad Complutense de Madrid, Madrid, Spain, July 2015. [Google Scholar]
- Sánchez de Miguel, A.; Zamorano, J.; Pascual, S.; López Cayuela, M.; Ocaña, F.; Challupner, P.; Gómez Castaño, J.; Fernández-Renau, A.; Gómez, J.; de Miguel, E. ISS nocturnal images as a scientic tool against Light Pollution: Flux calibration and colors. In Highlights of Spanish Astrophysics VII, Proceedings of the X Scientific Meeting of the Spanish Astronomical Society (SEA), Valencia, Spain, 9–13 July 2012; Sociedad Española de Astronomía: Costa del Sol, Spain; Volume 1, pp. 916–919.
- Kyba, C.; Garz, S.; Kuechly, H.; de Miguel, A.S.; Zamorano, J.; Fischer, J.; Hölker, F. High-Resolution Imagery of Earth at Night: New Sources, Opportunities and Challenges. Remote Sens. 2015, 7, 1–23. [Google Scholar] [CrossRef]
- Kuechly, H.U.; Kyba, C.C.M.; Ruhtz, T.; Lindemann, C.; Wolter, C.; Fischer, J.; Hölker, F. Aerial survey of light pollution in Berlin, Germany, and spatial analysis of sources. Remote Sens. Environ. 2012, 126, 39–50. [Google Scholar] [CrossRef]
- Hale, J.D.; Davies, G.; Fairbrass, A.J.; Matthews, T.J.; Rogers, C.D.; Sadler, J.P. Mapping lightscapes: Spatial patterning of artificial lighting in an urban landscape. PLoS ONE 2013, 8, e61460. [Google Scholar] [CrossRef]
- Fotios, S.; Gibbons, R. Road lighting research for drivers and pedestrians: The basis of luminance and illuminance recommendations. Light. Res. Technol. 2018, 50, 154–186. [Google Scholar] [CrossRef]
- Kocifaj, M. Towards a comprehensive city emission function (CCEF). J. Quant. Spectrosc. Radiat. 2018, 205, 253–266. [Google Scholar] [CrossRef]
- National Oceanic and Atmospheric Administration. Global Gas Flaring Observed from Space. 2012–2017. Available online: https://ngdc.noaa.gov/eog/viirs/download_global_flare.html (accessed on 11 November 2017).
- Bureau, U.S.C. Guide to State and Local Census Geography. 2010. Available online: https://www2.census.gov/geo/pdfs/reference/guidestloc/All_GSLCG.pdf (accessed on 28 February 2018).
- Federal Aviation Administration. Enplanements at All Commercial Service Airports (by Rank). 2017. Available online: https://www.faa.gov/airports/planning_capacity/passenger_allcargo_stats/passenger/media/cy16-commercial-service-enplanements.pdf (accessed on 28 February 2018).
- Statistics Canada. Passengers eNplaned and Deplaned on Selected Services—Top 50 Airports. 2016. Available online: http://www.statcan.gc.ca/pub/51-203-x/2015000/t002-eng.htm (accessed on 28 February 2018).
- American Association of Port Authorities. Port Industry Statistics—U.S. Port Ranking by Cargo Tonnage 2013. 2014. Available online: http://www.aapa-ports.org/unifying/content.aspx?ItemNum-ber=21048 (accessed on 1 March 2018).
- Transport Canada. 2018. Available online: http://www.tc.gc.ca/en/services/marine/ports-harbours/list-canada-port-authorities.html (accessed on 2 March 2018).
- Misachi, J. The Largest Sports Stadiums in Canada. 2017. Available online: https://www.worldatlas.com/articles/which-are-the-largest-sports-stadiums-in-canada.html (accessed on 1 March 2018).
- US Energy Information Administration. Form EIA-860 Detailed Data—EIA-923 Monthly Generation and Fuel Consumption Time Series File, 2016 Final Revision. 2017. Available online: https://www.eia.gov/electricity/data/eia860/index.html (accessed on 3 March 2018).
- US Energy Information Administration. State Nuclear Profiles. 2012. Available online: https://www.eia.gov/electricity/data/eia860/index.html (accessed on 3 March 2018).
- US Department of Homeland Security. Prison Boundaries. 2017. Available online: https://hifld-geoplatform.opendata.arcgis.com/datasets/prison-boundaries/data (accessed on 31 October 2017).
- Elvidge, C.D.; Zhizhin, M.; Baugh, K.; Hsu, F.C.; Ghosh, T. Methods for global survey of natural gas flaring from visible infrared imaging radiometer suite data. Energies 2016, 9, 14. [Google Scholar] [CrossRef]
- United States Department of Agriculture Forest Service. Wilderness Areas: Legal Status. 2017. Available online: https://data.fs.usda.gov/geodata/edw/datasets.php?dsetCategory=boundaries (accessed on 2 November 2017).
- Coesfeld, J.; Kyba, C. Software Supplement to: “Variation of Individual Location Radiance in VIIRS DNB Monthly Composite Images”. V. 1.0. GFZ Data Services. 2018. [Google Scholar] [CrossRef]
- National Centers for Environmental Information, National Oceanic and Atmospheric Administration. VIIRS DNB Nighttime Lights Composites. 2012–2017. Available online: https://www.ngdc.noaa.gov/eog/viirs/download_dnb_composites.html (accessed on several dates between 10 February 2015 and 10 October 2017).
- Miller, S.D.; Straka, W.; Mills, S.P.; Elvidge, C.D.; Lee, T.F.; Solbrig, J.; Walther, A.; Heidinger, A.K.; Weiss, S.C. Illuminating the Capabilities of the Suomi National Polar-Orbiting Partnership (NPP) Visible Infrared Imaging Radiometer Suite (VIIRS) Day/Night Band. Remote Sens. 2013, 5, 6717–6766. [Google Scholar] [CrossRef]
- Kleinsteuber, F.A. Testing Stability of VIIRS DNB Night Lights Data in the United States of America. Master’s Thesis, Universität Trier, Trier, Germany, February 2017. [Google Scholar]
- Miller, S.; Mills, S.; Elvidge, C.; Lindsey, D.; Lee, T.; Hawkins, J. Suomi satellite brings to light a unique frontier of nighttime environmental sensing capabilities. Proc. Natl. Acad. Sci. USA 2012, 109, 15706–15711. [Google Scholar] [CrossRef] [PubMed]
- Noll, S.; Kausch, W.; Barden, M.; Jones, A.; Szyszka, C.; Kimeswenger, S.; Vinther, J. An atmospheric radiation model for Cerro Paranal-I. The optical spectral range. Astron. Astrophys. 2012, 543, A92. [Google Scholar] [CrossRef]
- Tobler, W.R. A computer movie simulating urban growth in the Detroit region. Econ. Geogr. 1970, 46, 234–240. [Google Scholar] [CrossRef]
- Kyba, C.C.; Kuester, T.; Kuechly, H.U. Changes in outdoor lighting in Germany from 2012–2016. Int. J. Sustain. Light. 2017, 19, 112–123. [Google Scholar] [CrossRef]
- Lu, Y.; Coops, N.C. Bright lights, big city: Causal effects of population and GDP on urban brightness. PLoS ONE 2018, 13, e0199545. [Google Scholar] [CrossRef]
- James, P.; Bertrand, K.A.; Hart, J.E.; Schernhammer, E.S.; Tamimi, R.M.; Laden, F. Outdoor light at night and breast cancer incidence in the Nurses’ Health Study II. Environ. Health Perspect. 2017, 125, 087010. [Google Scholar] [CrossRef]
- Falchi, F. Campaign of sky brightness and extinction measurements using a portable CCD camera. Mon. Not. R. Astron. Soc. 2011, 412, 33–48. [Google Scholar] [CrossRef]
- Jiang, W.; He, G.; Long, T.; Guo, H.; Yin, R.; Leng, W.; Liu, H.; Wang, G. Potentiality of Using Luojia 1-01 Nighttime Light Imagery to Investigate Artificial Light Pollution. Sensors 2018, 18, 2900. [Google Scholar] [CrossRef] [PubMed]
- Coesfeld, J. Nachtaufnahmen in der Fernerkundung: Überprüfung der Variabilität des VIIRS Day/Night Bands Anhand Einzelner Standorte. Bachelor’s Thesis, Universität Potsdam, Potsdam, Germany, July 2018. [Google Scholar]
| Land Use Class | Number of Sites | Notes |
|---|---|---|
| Downtown | 50 | Largest city in each US state |
| Suburb | 50 | Largest city in each US state |
| Airport | 25 | 20 busiest USA, 5 largest Canada |
| Ship port | 25 | 21 busiest USA, 4 busiest Canada |
| Stadium | 25 | 20 largest NFL stadiums, 5 largest stadiums Canada |
| Power plant | 25 | 10 largest kWh USA, 10 max capacity nuclear USA, 5 largest Canada |
| Bridge | 25 | 21 longest bridges USA, 3 longest bridges Canada, Ambassador Bridge |
| Prison | 25 | Bright high capacity maximum security prisons, USA |
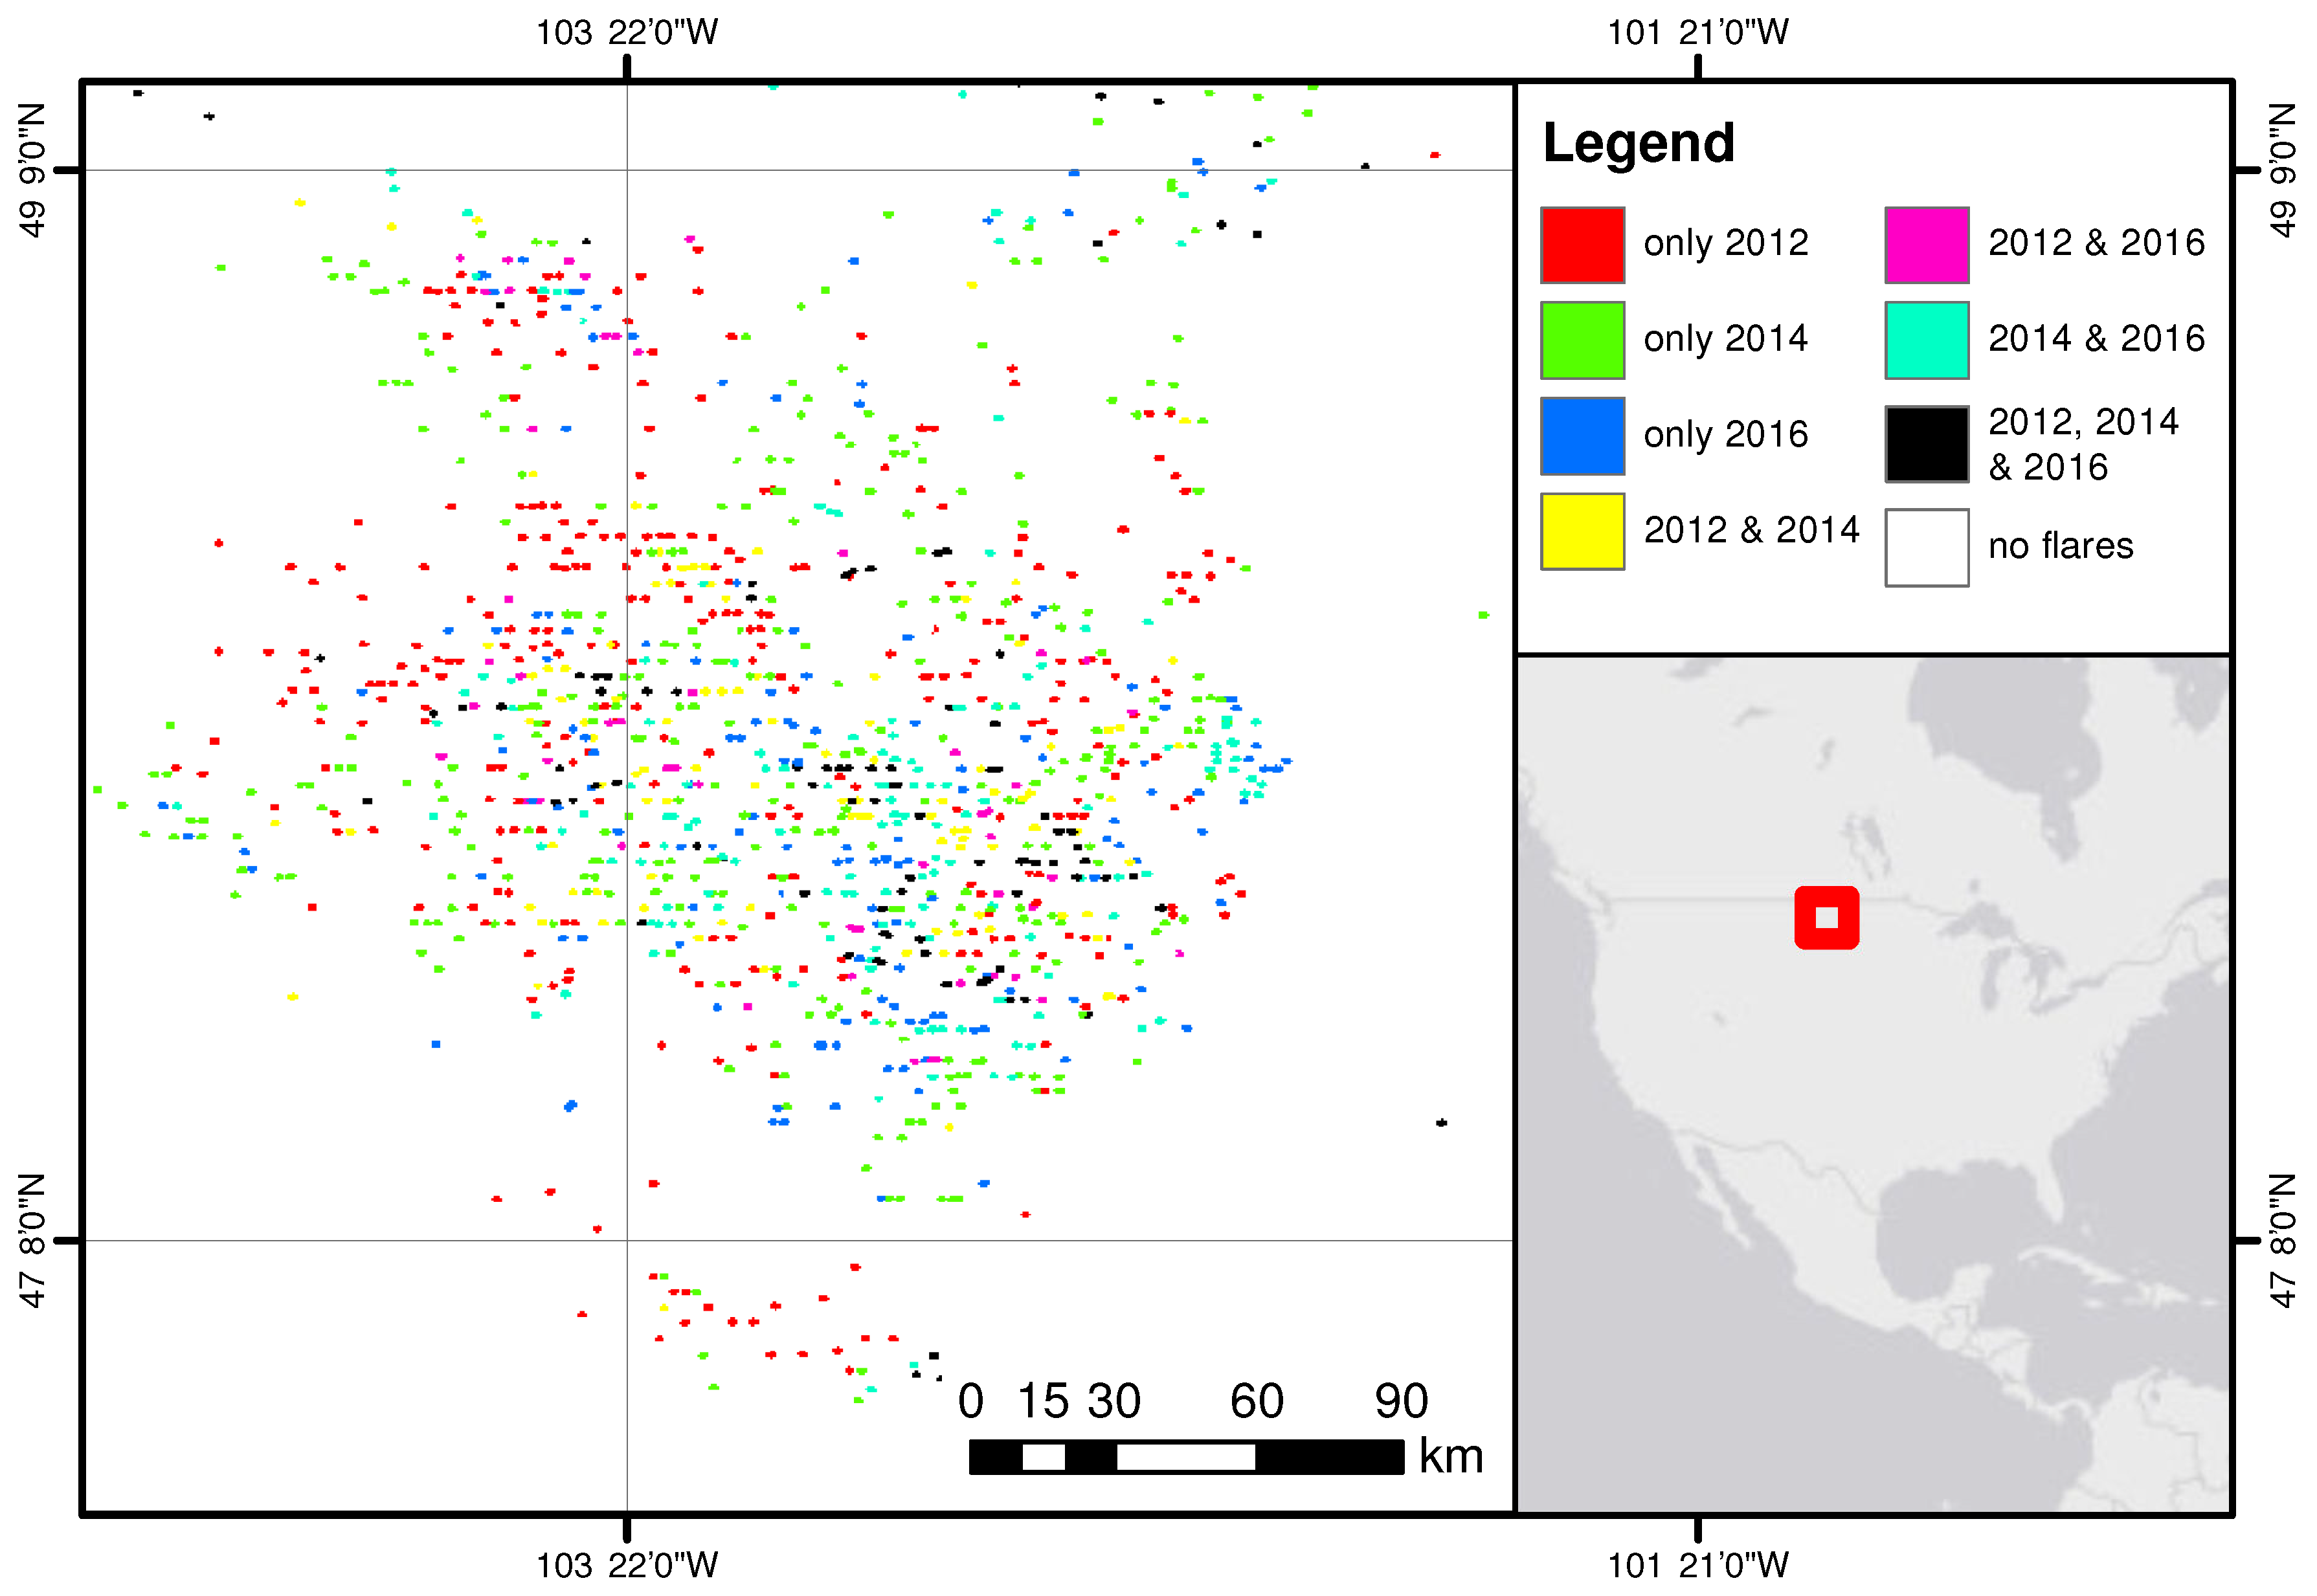
| Flares | 2585 | Bakken oil flares (USA) [36] |
| Wilderness Area | 25 | 20 contiguous USA, 5 Alaska |
| Greenhouse | 25 | Identified based on the October 2016 DNB data |
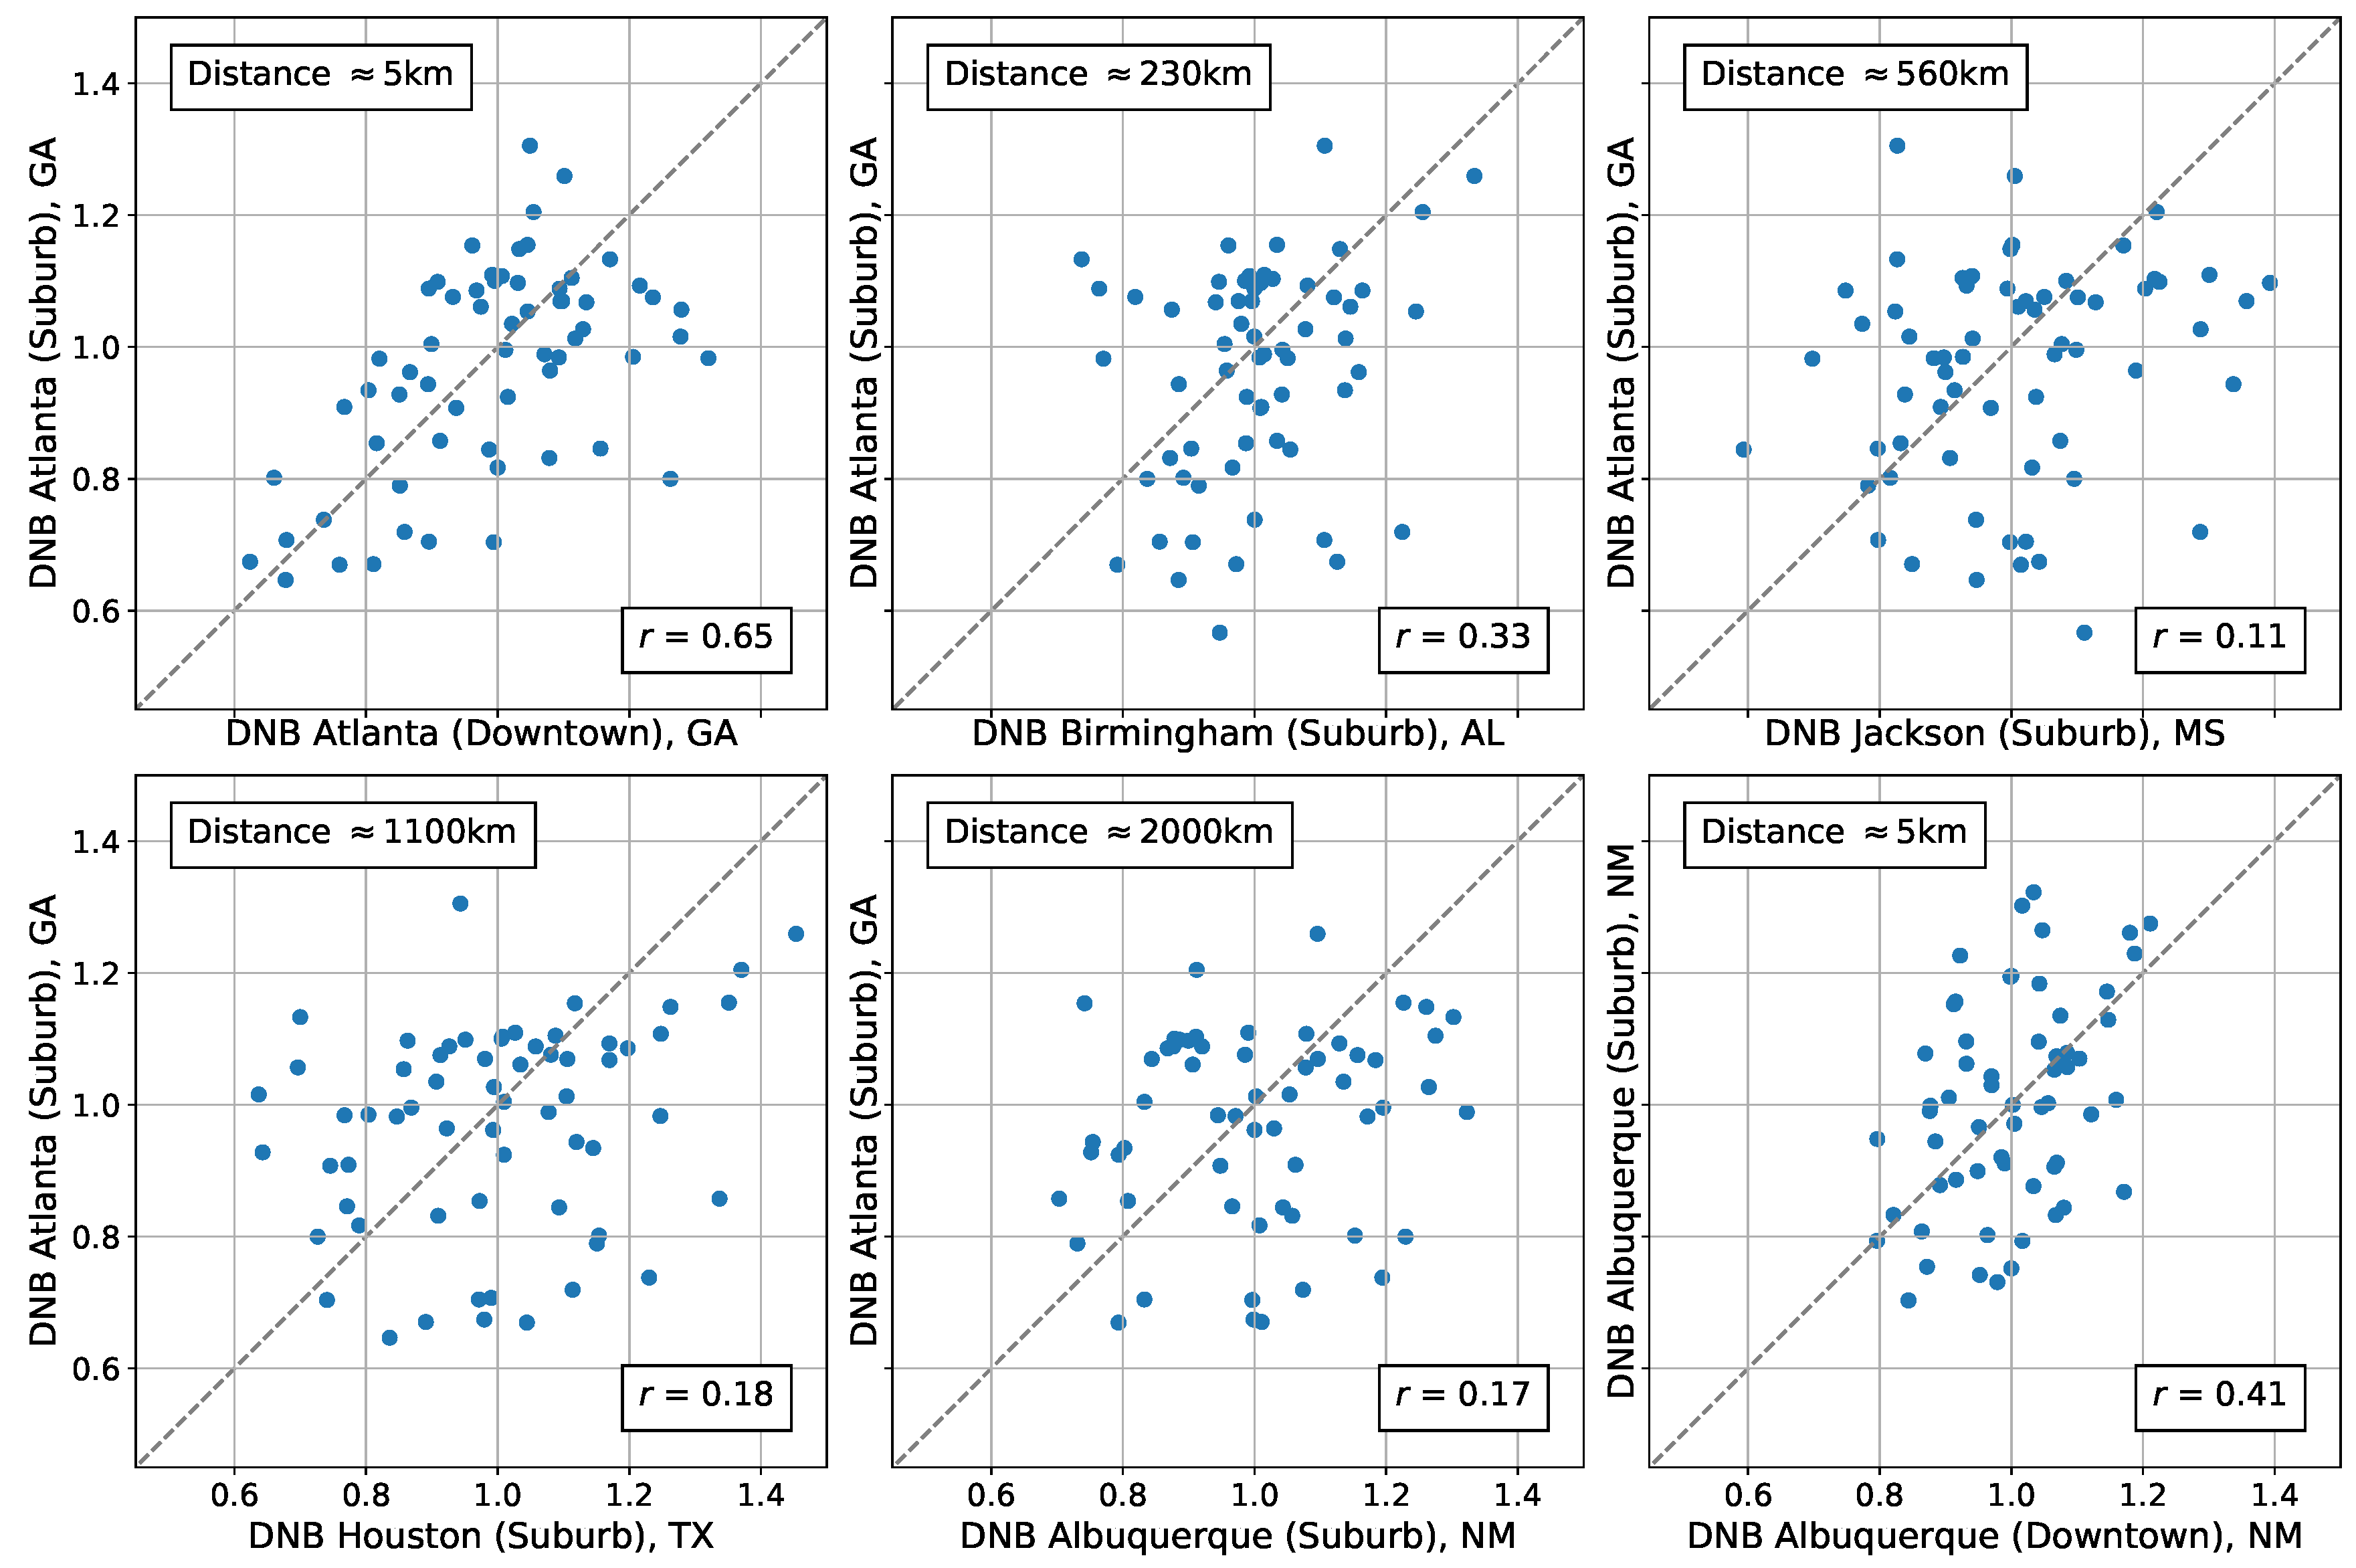
| Location 1 | Location 2 | Approximate Distance |
|---|---|---|
| Atlanta, GA Suburb | Atlanta, GA Downtown | 5 km |
| Atlanta, GA Suburb | Birmingham, AL Suburb | 230 km |
| Atlanta, GA Suburb | Jackson, MS suburb | 560 km |
| Atlanta, GA Suburb | Houston, TX suburb | 1100 km |
| Atlanta, GA Suburb | Alburquerque, NM Suburb | 2000 km |
| Alburquerque, NM Suburb | Alburquerque, NM Downtown | 5 km |
© 2018 by the authors. Licensee MDPI, Basel, Switzerland. This article is an open access article distributed under the terms and conditions of the Creative Commons Attribution (CC BY) license (http://creativecommons.org/licenses/by/4.0/).
Share and Cite
Coesfeld, J.; Anderson, S.J.; Baugh, K.; Elvidge, C.D.; Schernthanner, H.; Kyba, C.C.M. Variation of Individual Location Radiance in VIIRS DNB Monthly Composite Images. Remote Sens. 2018, 10, 1964. https://doi.org/10.3390/rs10121964
Coesfeld J, Anderson SJ, Baugh K, Elvidge CD, Schernthanner H, Kyba CCM. Variation of Individual Location Radiance in VIIRS DNB Monthly Composite Images. Remote Sensing. 2018; 10(12):1964. https://doi.org/10.3390/rs10121964
Chicago/Turabian StyleCoesfeld, Jacqueline, Sharolyn J. Anderson, Kimberly Baugh, Christopher D. Elvidge, Harald Schernthanner, and Christopher C. M. Kyba. 2018. "Variation of Individual Location Radiance in VIIRS DNB Monthly Composite Images" Remote Sensing 10, no. 12: 1964. https://doi.org/10.3390/rs10121964
APA StyleCoesfeld, J., Anderson, S. J., Baugh, K., Elvidge, C. D., Schernthanner, H., & Kyba, C. C. M. (2018). Variation of Individual Location Radiance in VIIRS DNB Monthly Composite Images. Remote Sensing, 10(12), 1964. https://doi.org/10.3390/rs10121964


