Article

The AQUI Soil Moisture Network for Satellite Microwave Remote Sensing Validation in South-Western France

INRA, UMR1391 ISPA, CS 20032 33882 Villenave d’Ornon, France
*
Author to whom correspondence should be addressed.
Remote Sens. 2018, 10(11), 1839; https://doi.org/10.3390/rs10111839
Submission received: 3 October 2018 / Revised: 9 November 2018 / Accepted: 14 November 2018 / Published: 20 November 2018
(This article belongs to the Special Issue New Outstanding Results over Land from the SMOS Mission)

Abstract

:
Global soil moisture (SM) products are currently available thanks to microwave remote sensing techniques. Validation of these satellite-based SM products over different vegetation and climate conditions is a crucial step. INRA (National Institute of Agricultural Research) has set up the AQUI SM and soil temperature in situ network (composed of three main sites Bouron, Bilos, and Hermitage), over a flat area of dense pine forests, in South-Western France (the Bordeaux–Aquitaine region) to validate the Soil Moisture and Ocean salinity (SMOS) satellite SM products. SMOS was launched in 2009 by the European Space Agency (ESA). The aims of this study are to present the AQUI network and to evaluate the SMOS SM product (in the new SMOS-IC version) along with other microwave SM products such as the active ASCAT (Advanced Scatterometer) and the ESA combined (passive and active) CCI (Climate Change Initiative) SM retrievals. A first comparison, using Pearson correlation, Bias, RMSE (Root Mean Square Error), and Un biased RMSE (ubRMSE) scores, between the 0–5 cm AQUI network and ASCAT, CCI, and SMOS SM products was conducted. In general all the three products were able to reproduce the annual cycle of the AQUI in situ observations. CCI and ASCAT had best and similar correlations (R~0.72) over the Bouron and Bilos sites. All had comparable correlations over the Hermitage sites with overall average values of 0.74, 0.68, and 0.69 for CCI, SMOS-IC, and ASCAT, respectively. Considering anomalies, correlation values decreased for all products with best ability to capture day to day variations obtained by ASCAT. CCI (followed by SMOS-IC) had the best ubRMSE values (mostly < 0.04 m3/m3) over most of the stations. Although the region is highly impacted by radio frequency interferences, SMOS-IC followed correctly the in situ SM dynamics. All the three remotely-sensed SM products (except SMOS-IC over some stations) overestimated the AQUI in situ SM observations. These results demonstrate that the AQUI network is likely to be well-suited for satellite microwave remote sensing evaluations/validations.

Graphical Abstract

1. Introduction

Surface Soil moisture (SM), which refers to the water content in the top soil layer, plays a key role in land surface and atmospheric processes, by influencing the exchange of energy, water and carbon dioxide fluxes between them [1,2]. Continuous measurements for monitoring SM deem necessary for various agriculture and hydrological applications (e.g., agricultural drought monitoring, flood forecast, yield forecasting, monitoring of greenhouse gase emissions and reservoir management) [3,4]. Soil moisture observations can be obtained either locally using ground-based measurements or globally using microwave remote sensing techniques [5,6].
More specifically, SM can be inferred from brightness temperatures (TB) and backscatter coefficients measured by passive and active microwave sensors [5,6,7,8], respectively. Recent passive remote sensing satellites include, but not limited to, the two dedicated SM missions: the National Aeronautics and Space Administration (NASA) SMAP (Soil Moisture Active Passive) satellite and the Soil Moisture and Ocean Salinity (SMOS) satellite. Active remote sensing sensors include, but not limited to, the ESA Advanced Scatterometer (ASCAT) sensor. Furthermore, based on these (and others) passive and active datasets, a long term (~35 years of data) SM product was developed by the European Space Agency (ESA); the so-called climate change initiative (CCI) SM product.
After the launch of several space-borne microwave satellites such as the SMOS satellite, calibration/validation studies using ground-based measurements are useful and important to assess the quality of the space-borne observations. This led to the development of integrative systems such as the so-called the ISMN (International Soil Moisture Network). ISMN collects ground-based SM measurements and hosts currently a large number of SM networks (~59), obtained from validation campaigns and operational networks, over various regions of the world [9,10]. The French AQUI network (Bordeaux–Aquitaine region), for instance, is one of the most recent networks that were included in the ISMN network. This network is a flat area of dense pine forests, making it interesting for calibration/validation (cal/val) studies, as few sites in ISMN have been set up for similar vegetation conditions [11]. The site is therefore very useful for the evaluation of microwave products over forested areas.
The AQUI network which was set up by INRA (National Institute of Agricultural Research), consists of in situ stations equipped with sensors to measure SM and soil temperature at various depths. These stations were equipped during 2009–2013 in the framework of the ESA SMOS satellite and ICOS (Integrated Carbon Observation System) project. The AQUI network has not been yet exploited and used to validate microwave remote sensing SM retrievals.
In this context, the objective of this study is twofold: presenting the main characteristics of the French AQUI network and evaluating, for the first time, SMOS, ESA CCI, and ASCAT SM products over this network. This paper is organized as follows. The AQUI network and the remotely-sensed SM observations used in this study as well as the methodology are described in Section 2. Then, Section 3 presents the evaluation results. Discussion and conclusions are drawn in Section 4.

2. Materials and Methods

2.1. The AQUI In Situ Network

The AQUI network is situated in South-Western France (see Figure 1) and consists of four sites (Bouron watershed, Bilos, Nezer, and Hermitage) located in the “Les Landes” forest of the Bordeaux-Aquitaine region and one site (Parcmeteo) situated in the urban area of the Bordeaux city. The “Les Landes” forest is one of the largest forest (~1 M ha) in Europe and mainly constituted by maritime pine stands. The “Les Landes” forest is a very interesting region to calibrate and/or evaluate remote sensing products, as it is very homogeneous, due to the flat relief and the even aged stands of maritime pines whose aerial tree biomass range is ~0–200 T/ha. In the “Les Landes” forest, soils are sandy and hydromorphic podzols, with dark organic matter in the first 30 cm (% of sand generally exceeds 90% at surface). On top of the soil lies a distinct litter layer of organic matter whose thickness may exceed 10 cm in some places [11].
All forested sites are a mosaic of forest stands and crop fields (forest being the dominant cover fraction), except for the Bouron sites which are almost pure forest sites (>90% of the cover fraction is forest). More details about these sites can be found in the following sections. The AQUI network has been used in numerous studies for different applications of remote sensing sensors [12,13,14,15,16,17]. Yet, no study was conducted to evaluate microwave remote sensing SM products. It should be noted that only the Bouron watershed, Nezer, and Parcmeteo sites are integrated in the ISMN network.

2.1.1. Sites Included in the ISMN Network

Several SM and soil temperature sensors were installed at various depths in the Bouron watershed, Nezer and Parcmeteo sites with a purpose, among others, to validate the SMOS SM products. The Bouron watershed is composed of three SM monitoring stations located in the “Les Landes” forest of the Bordeaux-Aquitaine region: Fraye, Hillan, and Grandcal. All these stations provide continuous measurements of SM and soil temperature each 10 or 15 min. The main characteristics of the different stations and of the in situ measurements are presented in Table 1.
All the SM measurements are made with Tetha probe ML2x from Delta-T Devices (see Figure 2 of one example of the installation of the SM sensors at the FRAYE station).
A site specific calibration of these probes was carried out using cylindrical volumetric soil samples for a variety of conditions in terms of SM and bulk soil density. The Fraye, Hillan2, Grandcal, and Nezer stations (as for the Bilos site described below) have very similar sandy and hydromorphic soil properties, therefore one linear calibration function was used to compute SM (m3/m3) as a function of the measured voltage U (V):
SM = 0.41245 U − 0.01175
For the Parcmeteo station (close to Bordeaux city with a gravelly soil), another linear calibration function was used:
SM = 0.476 U − 0.045917

2.1.2. Bilos

Bilos is also located in the “Landes forest”, 50 km south west of Bordeaux, France (see Figure 1). The site is a managed Pine forest at the elevation of 39.18 m above sea level. The station was set up in the framework of the Carboage and ICOS European projects [18] and is part of the European ICOS infrastructure (station code FR-Bil) [19]. The site is marked by the following climate characteristics: mean annual temperature 12.9 °C, annual precipitation 960.1 mm, mean annual shortwave radiation 140.9 Wm−2. In this study, Bilos is composed of 3 SM monitoring stations: Bilos-N, Bilos-E, and Bilos-S (see Table 2 for more specific information about these stations). The Bilos station provides continuous measurements of SM and soil temperature each half hour. Over this site, the linear calibration function in Equation 2 was used to compute SM (m3/m3) as a function of the measured voltage U (V).

2.1.3. Hermitage

The site of the Hermitage in Pierroton is located in the region of Cestas, about twenty kilometres southwest of Bordeaux, formerly in the heart of the forest, today at the limit between peri-urban areas and cropland areas. It includes a long-term biophysical and biogeochemical monitoring system comprising 3 parcels of 9 ha of maritime pine and eucalyptus, representing three contrasting silvicultural modalities monitored for 20 years by a set of automated measurement systems of in situ SM and soil temperature installed in 2013 (Xyloforest project funded by the French ANR and the Region Nouvelle-Aquitaine). In this study, Hermitage is composed of 4 SM monitoring stations: C5-1, C5-2, C6-1, and C6-2 (see Table 3 for more specific information about these stations and Figure 3 for the installation of the SM sensors at one Hermitage site). The Hermitage stations provide continuous measurements of SM and soil temperature each half hour. Over this site, the linear calibration function in Equation (2) was used to compute SM (m3/m3) as a function of the measured voltage U (V).

2.2. Remotely-Sensed Datasets

An overview of the remotely-sensed SM retrievals used in this study is presented in Table 4. Three SM products were used: SMOS-IC, ASCAT, and CCI. We considered other products such as the NASA SMAP but these retrievals were not recommended over the study region due to coastal proximity. Although SMOS operates in a protected band (1.40–1.42 GHz), SMOS TB observations are negatively impacted by artificial sources of RFI signals coming from either unauthorized or unwanted man-made emissions (e.g., FM radio signals, telecommunications signals, electric circuits, etc.) [20,21]. RFI signals can be weak (very difficult to detect) or strong (easily detected with unreasonable high values of TB) [20].

2.2.1. SMOS-IC

SMOS-IC is a new SM product retrieved from SMOS satellite TB observations. SMOS is an ESA mission with contributions from CNES (Centre National d’Etudes Spatiales) and CDTI (Centro para el Desarrollo Tecnológico Industrial). The SMOS satellite operates at L-band (1.4 GHz) and has been providing TB observations since 2010, with a spatial resolution of (~43 km) and with a global coverage of 3 days. SM and vegetation optical depth (VOD) are retrieved from SMOS TBs (provided over a range of incidence angles: 0–60° at both V and H polarizations) [22] employing the L-band Microwave Emission of the Biosphere (L-MEB) model [23,24].
The latest version (V105) of SMOS-IC (delivered as a scientific product) was used in this study; it is provided as volumetric water content at both ascending (06:00 am) and descending (06:00 pm) orbits in the NETCDF format. This new SM product performs very well in comparison with other satellite SM retrievals [25]. However, the SMOS TB observations are strongly impacted by RFI in this region and therefore SM retrievals should be filtered. SMOS-IC SM retrievals were kept when the Root Mean Square Error (RMSE) between SMOS Level 3 simulated and observed TB (here forward referred to as RFI) < 8 K. SMOS-IC is delivered in the Equal-Area Scalable Earth (EASE) grid V2 and can be freely obtained from CATDS (Centre Aval de Traitement des Données SMOS) at: https://www.catds.fr/Products/Available-products-from-CEC-SM/SMOS-IC. Only SMOS-IC SM products that correspond to ascending overpass were considered in this study [26]. More information about SMOS-IC and its products can be found in [27,28].

2.2.2. ASCAT

Metop- A&B satellites carry ASCAT on-board since 2006 and 2012, respectively [29]. The local solar time of the descending node is 9:30 am and 9:30 pm for the ascending node. ASCAT measures the backscatter coefficient at C-band (5.3 GHz) at VV polarization and at spatial resolution of 25 km. Surface soil moisture (expressed in degree of saturation) is retrieved from the ASCAT multi-angle backscatter observations using the Vienna University of Technology (TU Wien) semi-empirical change detection algorithm [6].
The H111-Metop ASCAT SSM CDR2016 time series with 12.5 km spatial sampling was downloaded from the Satellite Application Facility on Support to Operational Hydrology and Water Management (H SAF) and used in this study. Soil moisture values with confidence flag other than “0” were excluded [30]. The ASCAT dataset is provided in both degree of saturation (%) and volumetric SM units (using porosity values from the Harmonized World Soil Database; expressed in m3/m3). In this study, we used the ASCAT data in volumetric SM units to match with SMOS and CCI SM products.

2.2.3. ESA CCI Soil Moisture

Several global passive (e.g., SMMR, AMSR-E, SMOS, etc.) and active (e.g., ERS and ASCAT) SM products are blended to produce the first long-term i.e., 11/1978–12/2016 ESA CCI SM product [31]. This active and passive SM combination is based on a weighted average method. The weights are proportional to the Signal to Noise Ratio (SNR) that is estimated using triple collocation analysis of each product [32]. The Global Land Data Assimilation System (GLDAS), provided by Noah Land Surface Model [33], is used to scale the various datasets into a common model SM climatology using a Cumulative Density Function (CDF) matching approach.
The CCI SM product can be freely downloaded from https://www.esa-soilmoisture-cci.org/, which is delivered as daily volumetric (m3/m3) SM product in a NETCDF format with a spatial resolution of 0.25° × 0.25° (WGS 84).

2.3. Methodology

The CCI, ASCAT, SMOS-IC SM products were evaluated against the French AQUI in situ observations. We considered all available SM retrievals from each product within the 2010–2017 period and also considered only overlapping dates where we have observations from all the three products (only if data availability is higher than one month). For each station, we extracted the corresponding SM time series from the original grids of each product (e.g., 25 km from SMOS-IC, etc.) based on its latitude and longitude (see Supplementary Figure S1 for the AQUI in situ stations distributed in the “contributing area” for a single grid point for SMOS, ASCAT, and CCI). Finally, the metrics between the three remotely-sensed SM products and the AQUI in situ observations were calculated separately for each station after excluding pixels with frozen conditions (using flags provided with each product).
In this study, we considered four statistics to evaluate the three satellite-based SM products: Pearson correlation coefficient (R; Equation (1)), Bias (Equation (2)), RMSE (Root Mean Square Error; Equation (4)), and the unbiased RMSE (ubRMSE; Equation (4)) given as follows:
R = 1 ( SM RS SM REF ) 2 ( SM RS SM REF ¯ )
Bias = ( SM RS SM REF ) ¯
RMSE = ( SM RS SM REF ) 2 ¯
u b R M S E = R M S E 2 B i a s 2
where SM REF refers to the reference AQUI in situ soil moisture and SM RS refers to the remotely-sensed soil moisture retrievals, and the bar refers to the temporal mean of the time series.
In addition, the capability of the products to reproduce short-term SM fluctuations was investigated performing the analysis with SM anomalies. The anomalies (SManom(i) at day (i)) were computed as follows [34]:
S M a n o m ( i ) = S M i m e a n   ( S M x ) Standard   deviation   ( S M x )
where SM_i is the SM value at day (i) and SMx is a sliding window (x) of ±17 days.
Moreover, only stations with SM measured at soil depth of 0–5 cm and soil temperature higher than frozen conditions (~273.5 K degree) were selected and used in this study. Finally, time series were plotted to show the time evolution (variability and dynamics behavior) of the different SM products with respect to the AQUI in situ measurements.

3. Results

3.1. Sites Included in the ISMN Network

The R, Bias, RMSE, and ubRMSE metrics calculated between the CCI, SMOS-IC, and ASCAT SM retrievals (if available within the 2010–2017 period) and the Bouron, Nezer, and Parcmeteo in situ SM observations are presented in Table 5. It can be seen from Table 5 that while CCI had the highest correlation values over Hillan2 and Parcmeteo stations, ASCAT had highest values over Nezer station. ASCAT had highest correlation values based on anomalies over all sites. SMOS-IC had the lowest (dry) absolute Bias and RMSE values over Grandcal and Parcmeteo stations. CCI had the lowest ubRMSE and ASCAT had the highest ubRMSE values over all sites. While SMOS-IC was slightly drier than the SM measurements over all stations (except Nezer), the other two products were wetter over all stations. Supplementary Table S1 shows the same statistics but considering only overlapping periods between the SMOS-IC, ASCAT, and CCI SM retrievals. In general, the performance of the three products did not change considerably and the values got slightly higher or lower depending on the station.
The time series (dynamics and absolute values) of the three products i.e., SMOS-IC, ASCAT, and CCI along with the Bouron in situ observations are displayed in Figure 4. In general, the three products capture well the annual cycle of the in situ observations. The Nezer station is the driest one with most values lower than 0.2 m3/m3. Looking at the seasonal trends, SMOS-IC tends to overestimate measured SM over the Nezer station but underestimate SM over the other stations during both the dry and wet seasons. CCI time series overestimate but follow correctly the temporal dynamics of in situ SM time series. ASCAT tends to overestimate in situ SM during the wet seasons and underestimate SM during the dry seasons.

3.2. Bilos

In case of Bilos stations (Bilos-E, Bilos-N, and Bilos-S), CCI SM had the highest R values over Bilos_E and Bilos_N and lowest ubRMSE and RMSE values over all stations; see Table 6. ASCAT showed the highest values in terms of correlations (original) and anomalies over Bilos_S and all sites, respectively. ASCAT, again, had the highest ubRMSE values over Bilos_E and Bilos_N. As observed for Bouron, SMOS-IC had the lowest correlation values over all stations. Table S2 shows the metrics considering only overlapping periods. The general performance of the products was unchanged. Unlike the Bouron stations, here all satellite-based SM retrievals overestimated the Bilos in situ observations in both cases: all dates and overlapping periods.
Figure 5 shows the time series of SMOS-IC, ASCAT, and CCI along with the three stations from the Bilos in situ observations. The annual cycle of the Bilos stations is well captured by the three products. ASCAT and SMOS-IC SM data are more scattered than the CCI SM data. ASCAT had higher bias and this can be clearly identified in Figure 5.

3.3. Hermitage

Unlike what was observed in the Bouron and Bilos sites, over the Hermitage stations, SMOS-IC had comparable performance with ASCAT and CCI particularly when considering the overlapping period, see Table 7 and Supplementary Table S3. Similarly to the previous sites, ASCAT had also highest correlation values based on anomalies over all Hermitage sites. Figure 6 shows the time series of SMOS-IC, ASCAT, and CCI along with the four stations from the Hermitage in situ observations. Overall, the variability of CCI (better) and SMOS-IC is within the range of the SM content (up to 0.3 m3/m3) from the Hermitage stations over this 2013–2016 period. The ASCAT SM data are much more variable with a wider range of SM values (up to 0.5 m3/m3). The range of variations of the three remotely-sensed and in situ SM observations is rather similar, although the CCI and ASCAT SM values were generally higher. The overestimation of the in situ data by the CCI and ASCAT SM products is almost constant over the entire 2013–2016 period. Furthermore, it can be seen from both Table 7 and Supplementary Table S3 that the ubRMSE values obtained by CCI (SMOS-IC) were lower than (close to) the SMAP mission requirements of 0.04 m3/m3.

4. Discussion and Conclusions

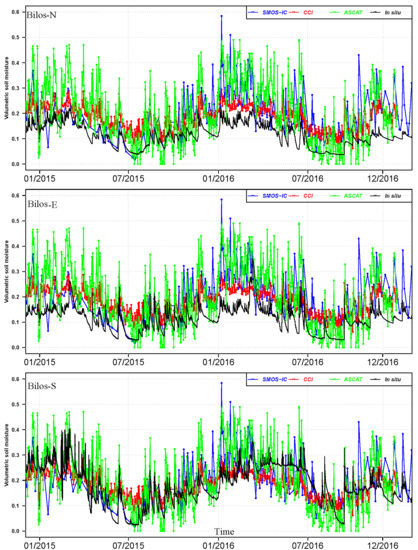
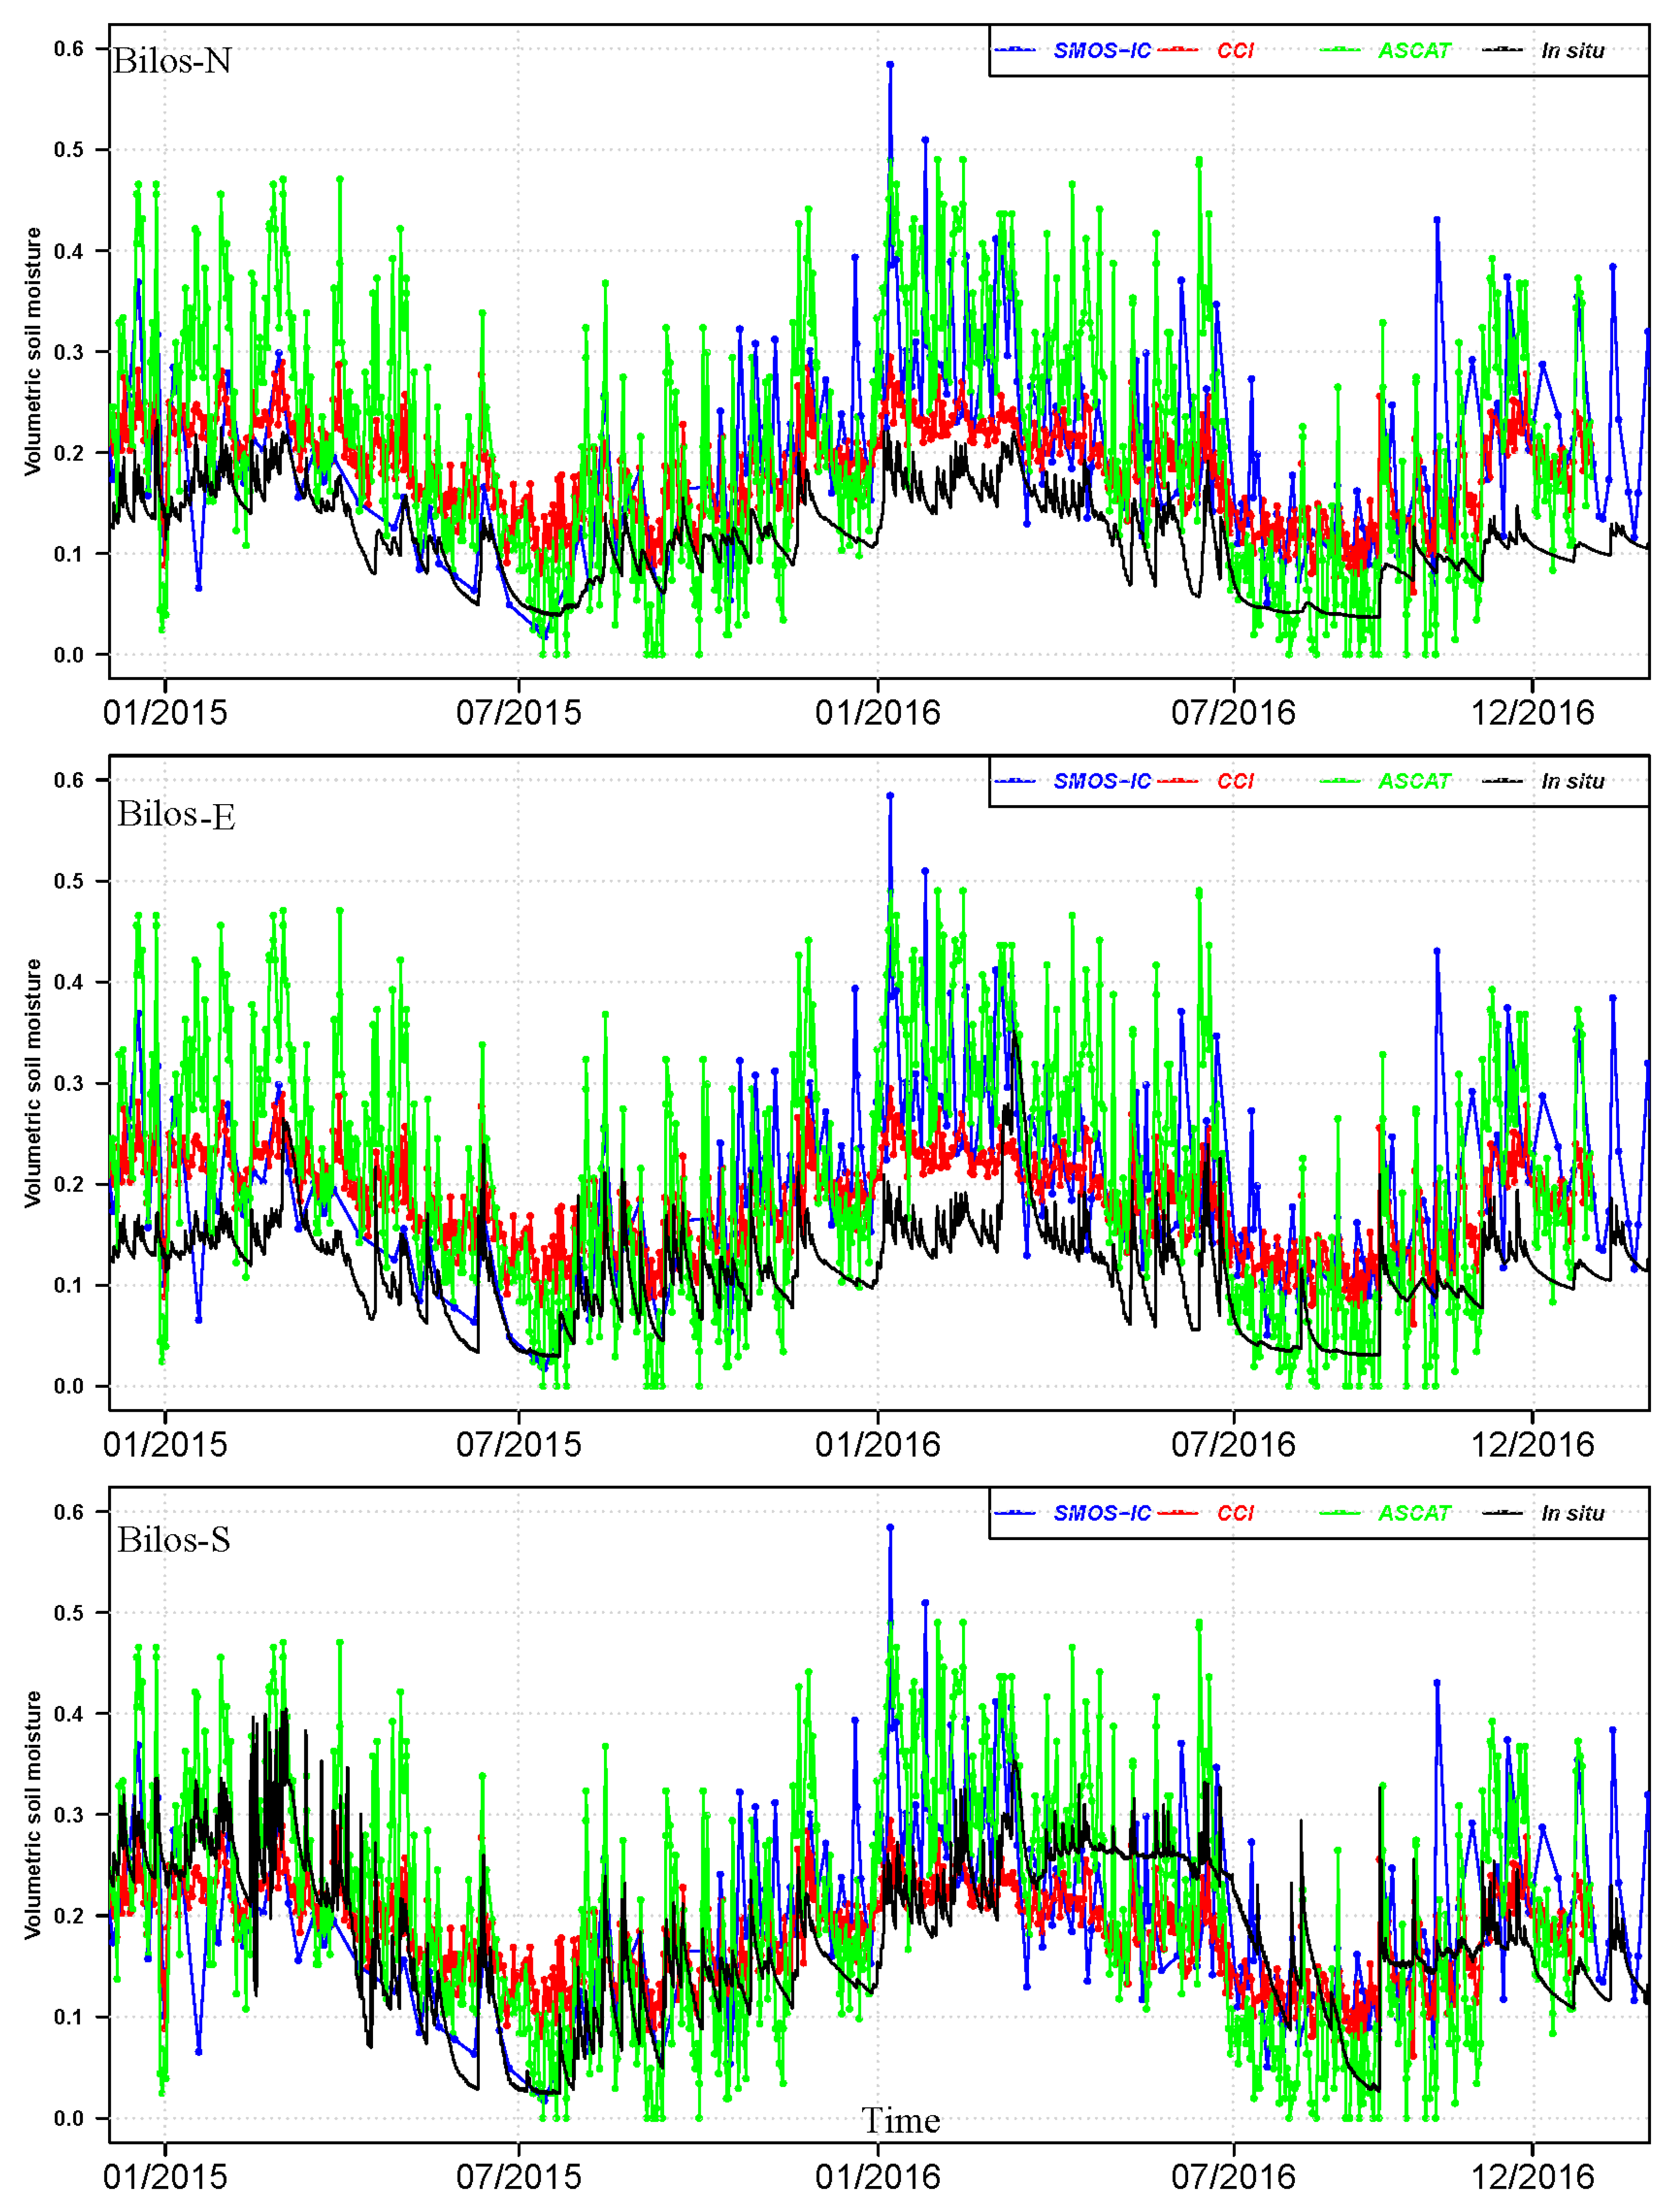
Based on the statistics and time series presented in the previous section, the three products were able to reproduce the annual cycle of all stations in the AQUI network. All the three SM products overestimated the AQUI network SM data (except a few stations for SMOS-IC). It was found that ASCAT and CCI had often equivalent performances in terms of correlations and better performances than SMOS-IC over the Bouron and Bilos stations. The similarity in the performance, only in terms of correlations, between CCI and ASCAT is not unexpected. This can be linked to the fact that ASCAT is one of the sensors used to produce the CCI SM product and as this region is highly impacted by RFI [21], CCI was more influenced by active products than passive products. However comparable performances between the three products were found over the Hermitage stations. These results could be explained by the fact that the Bilos and Bouron stations are closer to water bodies (ocean, rivers, and lakes), which influences the inversion of SM from TB or backscatter observations, than the Hermitage stations. Moreover, SMOS had better results (and comparable to CCI and ASCAT) over the Hermitage stations than over the Bouron and Bilos stations. In terms of short term variations and day to day fluctuations, the correlations values decreased for all products but ASCAT had the best overall correlations over most of the sites considered in this study. The best capability of ASCAT to capture short terms variations over Europe is consistent with the findings of Al-Yaari et al. [35,36] and [36].
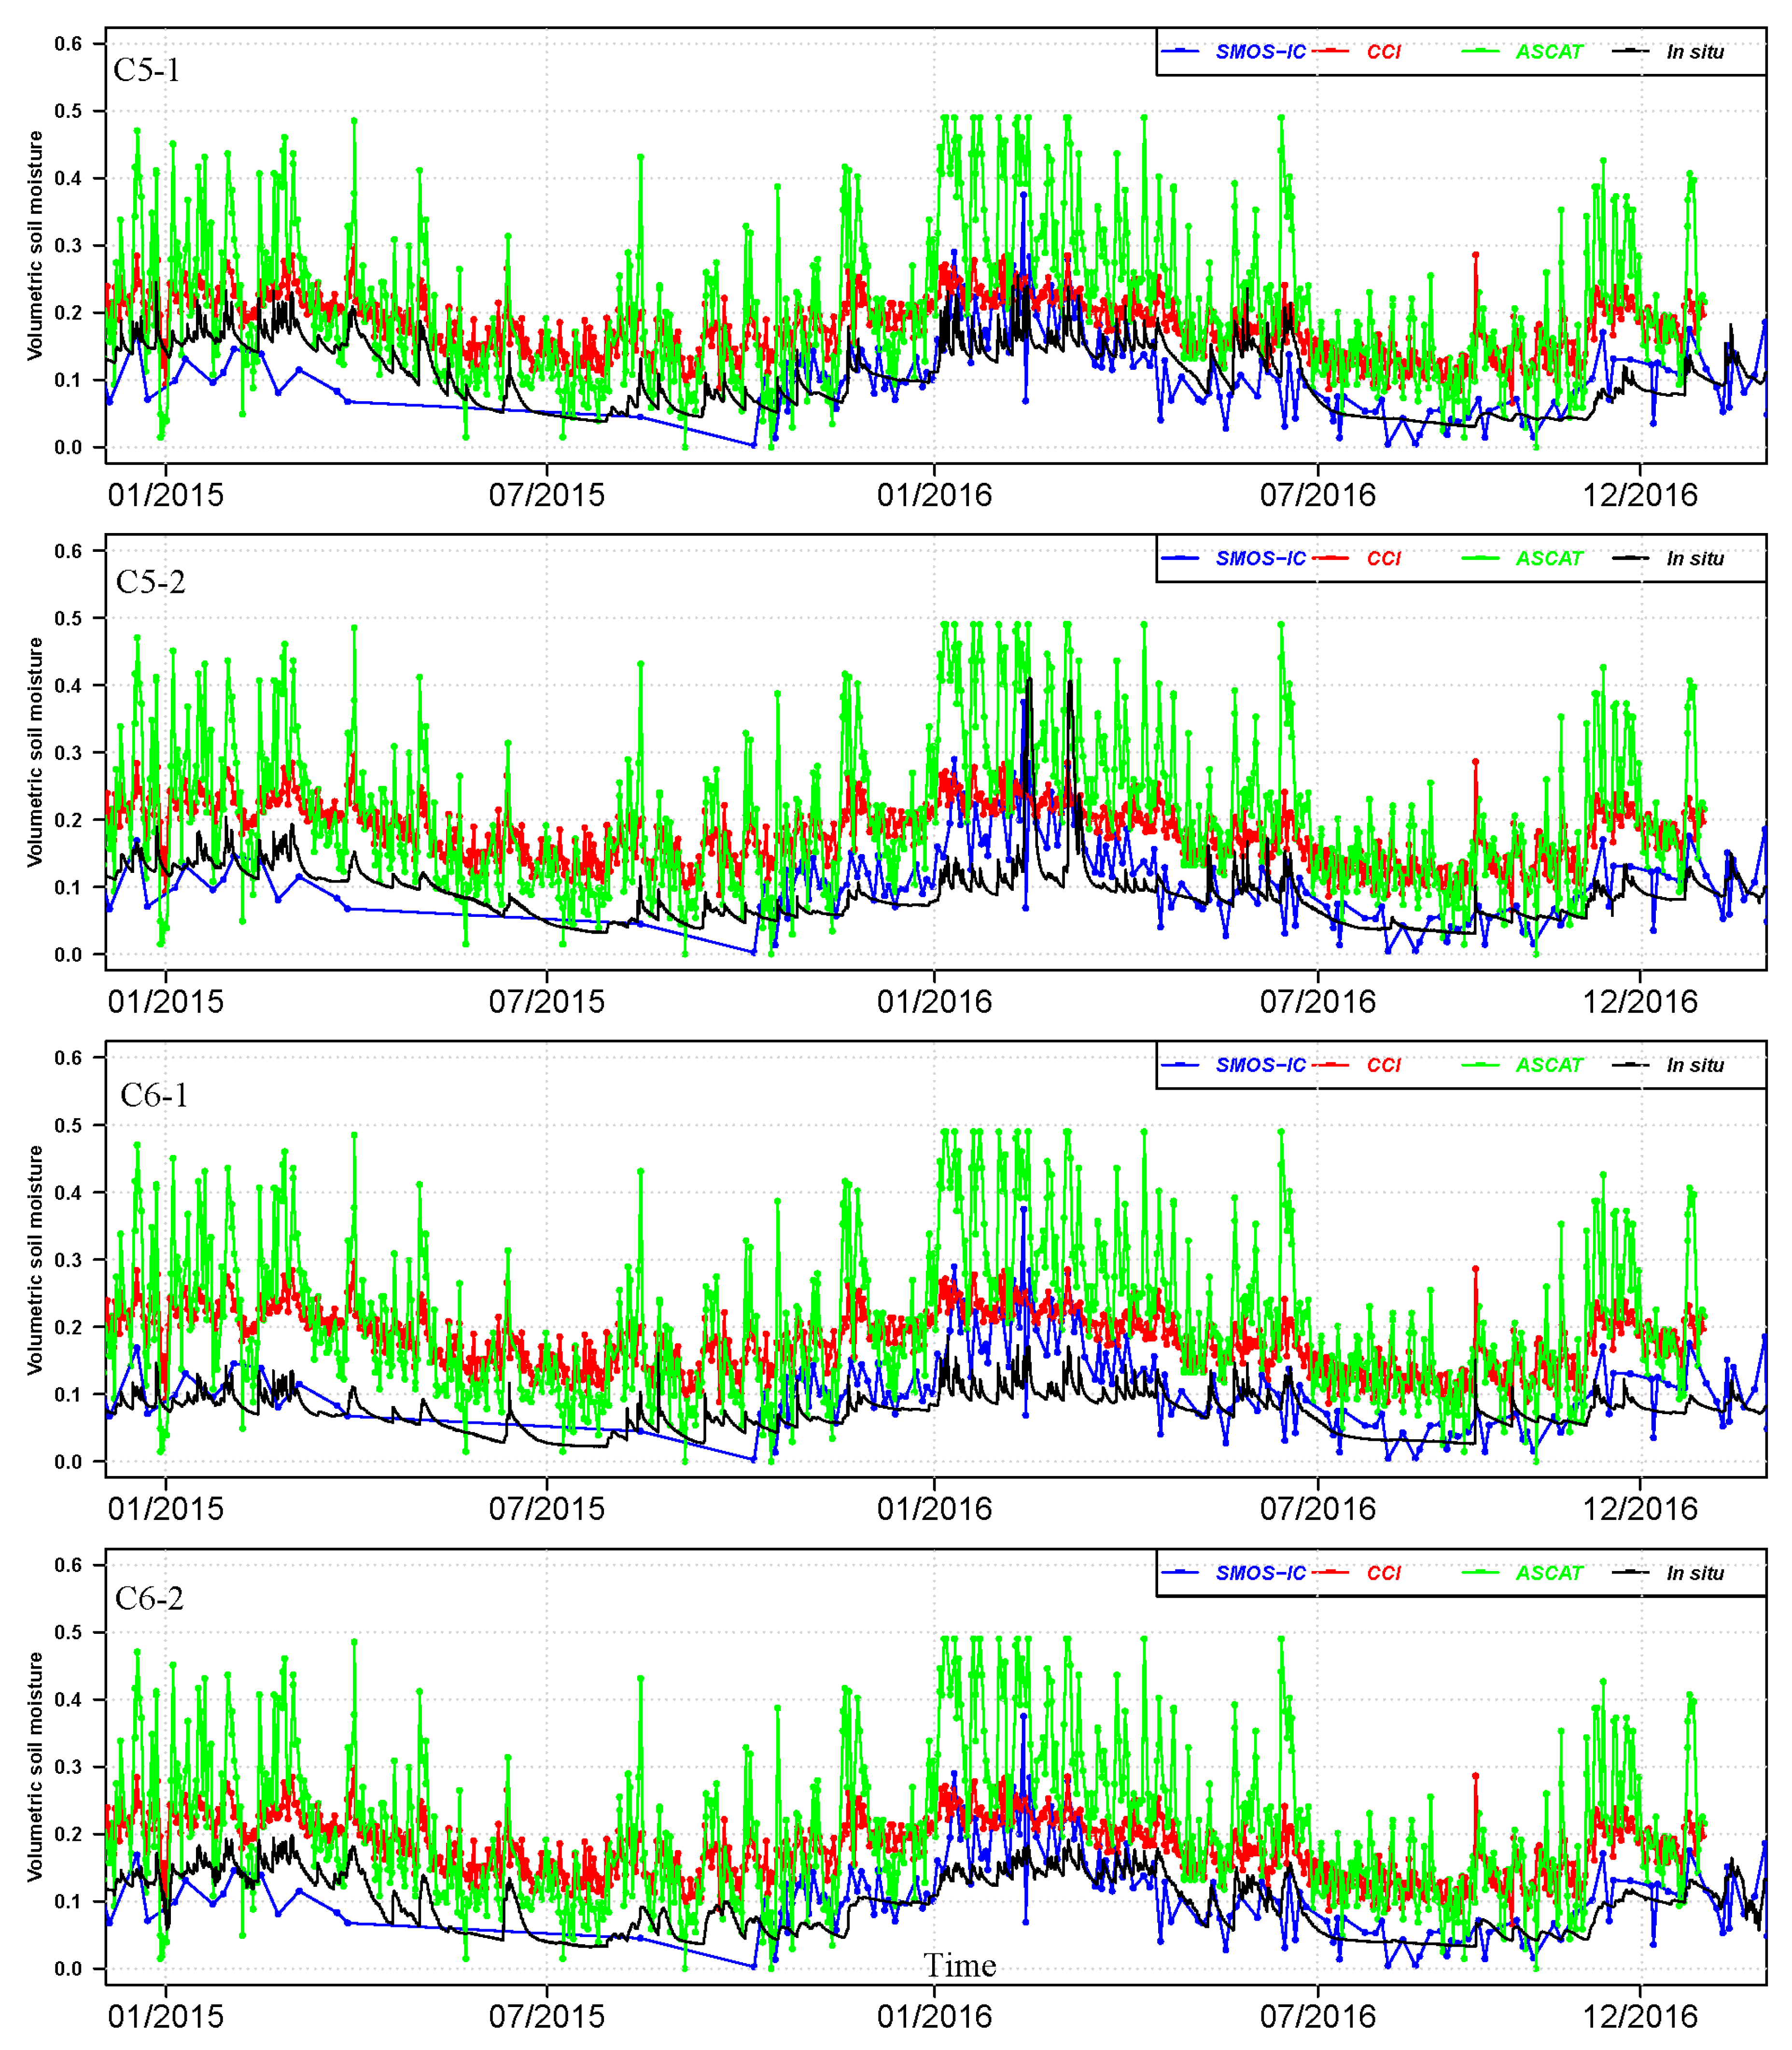
Note that the SM retrievals are strongly impacted by the vegetation density. For instance, Figure 7 shows time series of SMOS-IC VOD over the Bouron, Bilos, and Hermitage regions. The low number of SMOS retrievals before 2016 for the Bouron and Hermitage sites, in Figure 7, is due to the filtering of SMOS data with RFI > 8 K. At the end of 2015/beginning of 2016, it seems the source of RFI was off as RFI values were significantly decreased and much more SMOS-IC retrievals were available. It seems that the Bilos site (Figure 8b) was less impacted by RFI effects and much more retrievals were available before 2016 than for the other sites (the scatter in the VOD data is slightly lower too over Bilos).
The yearly average of VOD is good a proxy of biomass [37] and we see from this figure that the Aquitaine region is moderately vegetated with average values of VOD of ~0.3, corresponding to an average biomass density of ~60 t/ha. It can be seen in Figure 7a,b that VOD values can be as high as 0.6 (mainly in 2010), corresponding to an average biomass density of ~120 t/ha. Over the three sites, it is likely the decrease in VOD after 2010 is due to residual effects of the impact of the big Klaus storm beginning of 2009 and to forestry work following the storm. A detailed evaluation of the vegetation effects on the performance of the different SM products is outside the scope of the paper, but these effects will be investigated more in depth in future studies.
In addition, the whole region in Aquitaine is highly impacted by RFI in the protected L-band which has a strong impact on the performances of SMOS. Figure 8 shows an example illustrating how the accuracy of the SMOS-IC SM retrievals is sensitive to RFI. In Figure 8a,c the correlation values between the SMOS-IC SM retrievals and the Bouron (Fraye) and Hermitage (C6-1) in situ SM measurements increased when RFI were more strongly filtered (RFI were filtered using the TB-RMSE index which is a good proxy of the RFI intensity). The counterpart of the higher filtering process of the RFI effects is a lower number of data. However, this is not always the case as illustrated in Figure 8b for the Bilos site, where the correlation value had a low sensitivity to the RFI filtering threshold (best results obtained when the threshold was set equal to 8 K). This could be explained by the fact that, as noted before, the Bilos site was much less impacted by RFI effects before 2016 than the other sites. Therefore, filtering RFI is highly dependent on the study region. It should be noted that other studies evaluated SMOS and compared it to ASCAT, SMAP, and CCI SM products over other regions with low or no RFI and found it to be very skillful e.g., [35,38,39,40,41].
Although the AQUI network is very close to the ocean, which affects the remote sensing SM retrievals, the findings of this study showed that all the three remotely-sensed SM products have reasonable performances in terms of both temporal dynamics and absolute values. The discrepancies especially the systematic errors between the remotely-sensed SM retrievals and the AQUI network can be generally explained by sampling depth mismatch between the satellite-based SM retrievals (~3 cm) [42] and the in situ measurements. In addition, one should not neglect inaccuracies in both the satellite-based SM algorithms or in the set-up of the AQUI in situ observations. These factors may impact the statistics either separately or in combination depending on the site location.
In conclusion, this is the first study where the AQUI network in South-Western France was presented and used to evaluate the SMOS-IC, CCI, and ASCAT SM products. For the evaluation, the Pearson correlation coefficient (R), Bias, RMSE, and ubRMSE scores were computed. Except for one specific site (slightly lower performances were obtained over Bilos_S), the results for both ASCAT and CCI were found to be relatively homogeneous over the different sites, in terms of correlation, bias, RMSE and UbRMSE. This is a very positive result and no clear interpretation of the results relative to the soil properties (gravelly or sandy soils) or vegetation (more or less vegetated sites) conditions can be drawn. For instance, relatively similar performances were obtained over the Parcmeteo site (gravelly soil in the Bordeaux suburbs), forested sites of Nezer, Bilos, Hermitage and over the Bourron sites which include the densest forest cover (forest cover fraction ~90%). The results of SMOS-IC were found to be strongly dependent on the RFI conditions that depend on the site location and time (for instance, lower RFI effects were generally found after 2016).
Generally, the agreement between the AQUI SM data and the CCI SM product was the best (except for anomalies where ASCAT was the best). In this regard, one should keep in mind that CCI is combining the best retrievals of several sensors and thus high quality is expected. In addition, SMOS observations are strongly affected by RFI over the AQUI sites. The present study showed, that in spite of the high level of RFI effects, SMOS-IC could produce correct SM retrievals, if accurate filtering procedures are applied.
The statistics, temporal dynamics in particular, of the comparisons of SMOS-IC, CCI, and ASCAT along with AQUI network shown in the previous section are in range with other evaluation results over other networks. This demonstrates that the AQUI network is likely to be well-suited for satellite microwave remote sensing evaluation/validation. Further investigation is needed to address the discrepancies between the satellite-based SM retrievals and the AQUI network.

Supplementary Materials

The following are available online at https://www.mdpi.com/2072-4292/10/11/1839/s1, Figure S1: The AQUI in situ stations distributed in the “contributing area” for a single grid point for SMOS, ASCAT, and CCI, Table S1: Same as Table 5 but using only overlapping dates, Table S2: Same as Table 6 but using only overlapping dates. Table S3: Same as Table 7 but using only overlapping dates.

Author Contributions

A.A. and J.-P.W. wrote the paper with inputs from all co-authors. A.A. performed the analyses. J.-P.W. and A.A. designed the study. J.-P.W., S.D., A.K., C.A., C.C., and D.L. contributed to the installation of the AQUI network.

Funding

This study was funded by TOSCA/Centre national d’études spatiales (CNES) and the European Space Agency (ESA; SMOS Expert Support Laboratory).

Acknowledgments

We acknowledge the contribution of the Pierroton UE (including P.B.) to the installation of some in situ stations. We gratefully acknowledge Dominique Guyon for her valuable comments.

Conflicts of Interest

The authors declare no conflict of interest.

References

  1. Berg, A.; Lintner, B.R.; Findell, K.L.; Malyshev, S.; Loikith, P.C.; Gentine, P. Impact of Soil Moisture–Atmosphere Interactions on Surface Temperature Distribution. J. Clim. 2014, 27, 7976–7993. [Google Scholar] [CrossRef]
  2. Seneviratne, S.I.; Corti, T.; Davin, E.L.; Hirschi, M.; Jaeger, E.B.; Lehner, I.; Orlowsky, B.; Teuling, A.J. Investigating soil moisture–climate interactions in a changing climate: A review. Earth-Sci. Rev. 2010, 99, 125–161. [Google Scholar] [CrossRef]
  3. Norbiato, D.; Borga, M.; Degli Esposti, S.; Gaume, E.; Anquetin, S. Flash flood warning based on rainfall thresholds and soil moisture conditions: An assessment for gauged and ungauged basins. J. Hydrol. 2008, 362, 274–290. [Google Scholar] [CrossRef]
  4. Bolten, J.D.; Crow, W.T.; Zhan, X.; Jackson, T.J.; Reynolds, C.A. Evaluating the Utility of Remotely Sensed Soil Moisture Retrievals for Operational Agricultural Drought Monitoring. IEEE J. Sel. Top. Appl. Earth Observ. Remote Sens. 2010, 3, 57–66. [Google Scholar] [CrossRef] [Green Version]
  5. Kerr, Y.H.; Waldteufel, P.; Wigneron, J.P.; Martinuzzi, J.; Font, J.; Berger, M. Soil moisture retrieval from space: The Soil Moisture and Ocean Salinity (SMOS) mission. IEEE Trans. Geosci. Remote Sens. 2001, 39, 1729–1735. [Google Scholar] [CrossRef]
  6. Wagner, W.; Lemoine, G.; Rott, H. A Method for Estimating Soil Moisture from ERS Scatterometer and Soil Data. Remote Sens. Environ. 1999, 70, 191–207. [Google Scholar] [CrossRef]
  7. Entekhabi, D.; Njoku, E.G.; O’Neill, P.E.; Kellogg, K.H.; Crow, W.T.; Edelstein, W.N.; Entin, J.K.; Goodman, S.D.; Jackson, T.J.; Johnson, J.; et al. The Soil Moisture Active Passive (SMAP) Mission. Proc. IEEE 2010, 98, 704–716. [Google Scholar] [CrossRef]
  8. Owe, M.; de Jeu, R.; Walker, J. A methodology for surface soil moisture and vegetation optical depth retrieval using the microwave polarization difference index. IEEE Trans. Geosci. Remote Sens. 2001, 39, 1643–1654. [Google Scholar] [CrossRef] [Green Version]
  9. Dorigo, W.A.; Wagner, W.; Hohensinn, R.; Hahn, S.; Paulik, C.; Xaver, A.; Gruber, A.; Drusch, M.; Mecklenburg, S.; van Oevelen, P.; et al. The International Soil Moisture Network: A data hosting facility for global in situ soil moisture measurements. Hydrol. Earth Syst. Sci. 2011, 15, 1675–1698. [Google Scholar] [CrossRef]
  10. Dorigo, W.A.; Xaver, A.; Vreugdenhil, M.; Gruber, A.; Hegyiová, A.; Sanchis-Dufau, A.D.; Zamojski, D.; Cordes, C.; Wagner, W.; Drusch, M. Global Automated Quality Control of In Situ Soil Moisture Data from the International Soil Moisture Network. Vadose Zone J. 2013, 12. [Google Scholar] [CrossRef]
  11. Wigneron, J.P.; Dayan, S.; Kruszewski, A.; Aluome, C.; AI-Yaari, M.G.E.A.; Fan, L.; Guven, S.; Chipeaux, C.; Moisy, C.; Guyon, D.; et al. The Aqui Network: Soil Moisture Sites in the “Les Landes” Forest and Graves Vineyards (Bordeaux Aquitaine Region). In Proceedings of the 2018 IEEE International Geoscience and Remote Sensing Symposium (IGARSS 2018), Valancia, Spain, 26–30 July 2018. [Google Scholar]
  12. Motte, E.; Zribi, M.; Fanise, P.; Egido, A.; Darrozes, J.; Al-Yaari, A.; Baghdadi, N.; Baup, F.; Dayau, S.; Fieuzal, R.; et al. GLORI: A GNSS-R Dual Polarization Airborne Instrument for Land Surface Monitoring. Sensors 2016, 16. [Google Scholar] [CrossRef] [PubMed] [Green Version]
  13. Saleh, K.; Porte, A.; Guyon, D.; Ferrazzoli, P.; Wigneron, J. A forest geometric description of a maritime pine forest suitable for discrete microwave models. IEEE Trans. Geosci. Remote Sens. 2005, 43, 2024–2035. [Google Scholar] [CrossRef]
  14. Toan, T.L.; Beaudoin, A.; Riom, J.; Guyon, D. Relating forest biomass to SAR data. IEEE Trans. Geosci. Remote Sens. 1992, 30, 403–411. [Google Scholar] [CrossRef]
  15. Beguet, B.; Guyon, D.; Boukir, S.; Chehata, N. Automated retrieval of forest structure variables based on multi-scale texture analysis of VHR satellite imagery. ISPRS J. Photogramm. Remote Sens. 2014, 96, 164–178. [Google Scholar] [CrossRef]
  16. Zribi, M.; Motte, E.; Baghdadi, N.; Baup, F.; Dayau, S.; Fanise, P.; Guyon, D.; Huc, M.; Wigneron, J. Potential Applications of GNSS-R Observations over Agricultural Areas: Results from the GLORI Airborne Campaign. Remote Sens. 2018, 10. [Google Scholar] [CrossRef]
  17. Zribi, M.; Guyon, D.; Motte, E.; Wigneron, J.-P.; Dayau, S.; Baghdadi, N.; Pierdicca, N. Performances of GNSS-R GLORI data over Landes forest in France. Int. J. Appl. Earth Obs. Geoinf. 2019, 74. [Google Scholar] [CrossRef]
  18. Kowalski, S.; Sartore, M.; Burlett, R.; Berbigier, P.; Loustau, D. The annual carbon budget of a French pine forest (Pinus pinaster) following harvest. Glob. Change Biol. 2003, 9, 1051–1065. [Google Scholar] [CrossRef]
  19. Deirmendjian, L.; Loustau, D.; Augusto, L.; Lafont, S.; Chipeaux, C.; Poirier, D.; Abril, G. Hydro-ecological controls on dissolved carbon dynamics in groundwater and export to streams in a temperate pine forest. Biogeosciences 2018, 15, 669–691. [Google Scholar] [CrossRef] [Green Version]
  20. Oliva, R.; Daganzo, E.; Kerr, Y.H.; Mecklenburg, S.; Nieto, S.; Richaume, P.; Gruhier, C. SMOS Radio Frequency Interference Scenario: Status and Actions Taken to Improve the RFI Environment in the 1400–1427-MHz Passive Band. IEEE Trans. Geosci. Remote Sens. 2012, 50, 1427–1439. [Google Scholar] [CrossRef] [Green Version]
  21. Oliva, R.; Daganzo, E.; Richaume, P.; Kerr, Y.; Cabot, F.; Soldo, Y.; Anterrieu, E.; Reul, N.; Gutierrez, A.; Barbosa, J.; et al. Status of Radio Frequency Interference (RFI) in the 1400–1427 MHz passive band based on six years of SMOS mission. Remote Sens. Environ. 2016, 180, 64–75. [Google Scholar] [CrossRef]
  22. Kerr, Y.H.; Waldteufel, P.; Wigneron, J.P.; Delwart, S.; Cabot, F.; Boutin, J.; Escorihuela, M.J.; Font, J.; Reul, N.; Gruhier, C.; et al. The SMOS Mission: New Tool for Monitoring Key Elements ofthe Global Water Cycle. Proc. IEEE 2010, 98, 666–687. [Google Scholar] [CrossRef] [Green Version]
  23. Wigneron, J.P.; Kerr, Y.; Waldteufel, P.; Saleh, K.; Escorihuela, M.J.; Richaume, P.; Ferrazzoli, P.; de Rosnay, P.; Gurney, R.; Calvet, J.C.; et al. L-band Microwave Emission of the Biosphere (L-MEB) Model: Description and calibration against experimental data sets over crop fields. Remote Sens. Environ. 2007, 107, 639–655. [Google Scholar] [CrossRef]
  24. Wigneron, J.P.; Jackson, T.J.; O’Neill, P.; De Lannoy, G.; de Rosnay, P.; Walker, J.P.; Ferrazzoli, P.; Mironov, V.; Bircher, S.; Grant, J.P.; et al. Modelling the passive microwave signature from land surfaces: A review of recent results and application to the L-band SMOS & SMAP soil moisture retrieval algorithms. Remote Sens. Environ. 2017, 192, 238–262. [Google Scholar] [CrossRef]
  25. Al-Yaari, A.; Mialon, A.; Dorigo, W.; Colliander, A.; Fan, L.; Kerr, Y.; Pellarin, T.; Wigneron, J.-P. Validation of satellite microwave retrieved soil moisture with global ground-based measurements. In Proceedings of the 2018 IEEE International Geoscience and Remote Sensing Symposium (IGARSS 2018), Valancia, Spain, 26–30 July 2018. [Google Scholar]
  26. Al-Yaari, A.; Wigneron, J.P.; Ducharne, A.; Kerr, Y.; de Rosnay, P.; de Jeu, R.; Govind, A.; Al Bitar, A.; Albergel, C.; Muñoz-Sabater, J.; et al. Global-scale evaluation of two satellite-based passive microwave soil moisture datasets (SMOS and AMSR-E) with respect to Land Data Assimilation System estimates. Remote Sens. Environ. 2014, 149, 181–195. [Google Scholar] [CrossRef] [Green Version]
  27. Fernandez-Moran, R.; Al-Yaari, A.; Mialon, A.; Mahmoodi, A.; Al Bitar, A.; De Lannoy, G.; Rodriguez-Fernandez, N.; Lopez-Baeza, E.; Kerr, Y.; Wigneron, J.-P. SMOS-IC: An Alternative SMOS Soil Moisture and Vegetation Optical Depth Product. Remote Sens. 2017, 9. [Google Scholar] [CrossRef]
  28. Fernandez-Moran, R.; Wigneron, J.P.; De Lannoy, G.; Lopez-Baeza, E.; Parrens, M.; Mialon, A.; Mahmoodi, A.; Al-Yaari, A.; Bircher, S.; Al Bitar, A.; et al. A new calibration of the effective scattering albedo and soil roughness parameters in the SMOS SM retrieval algorithm. Int. J. Appl. Earth Obs. Geoinf. 2017, 62, 27–38. [Google Scholar] [CrossRef]
  29. PUM. Product User Manual (PUM) Soil Moisture Data Records, Metop ASCAT Soil Moisture Time Series. Doc. No: SAF/HSAF/CDOP2/PUM, v0.4, 2016. Available online: http://hsaf.meteoam.it/documents/PUM/SSM_ASCAT_DR_PUM_v0.4.pdf (accessed on 9 May 2018).
  30. Paulik, C.; Dorigo, W.; Wagner, W.; Kidd, R. Validation of the ASCAT Soil Water Index using in situ data from the International Soil Moisture Network. Int. J. Appl. Earth Obs. Geoinf. 2014, 30, 1–8. [Google Scholar] [CrossRef]
  31. Liu, Y.Y.; Dorigo, W.A.; Parinussa, R.M.; de Jeu, R.A.M.; Wagner, W.; McCabe, M.F.; Evans, J.P.; van Dijk, A.I.J.M. Trend-preserving blending of passive and active microwave soil moisture retrievals. Remote Sens. Environ. 2012, 123, 280–297. [Google Scholar] [CrossRef]
  32. Dorigo, W.; Wagner, W.; Albergel, C.; Albrecht, F.; Balsamo, G.; Brocca, L.; Chung, D.; Ertl, M.; Forkel, M.; Gruber, A.; et al. ESA CCI Soil Moisture for improved Earth system understanding: State-of-the art and future directions. Remote Sens. Environ. 2017, 203, 185–215. [Google Scholar] [CrossRef]
  33. Rodell, M.; Houser, P.R.; Jambor, U.; Gottschalck, J.; Mitchell, K.; Meng, C.J.; Arsenault, K.; Cosgrove, B.; Radakovich, J.; Bosilovich, M.; et al. The Global Land Data Assimilation System. Bull. Am. Meteorol. Soc. 2004, 85, 381–394. [Google Scholar] [CrossRef] [Green Version]
  34. Albergel, C.; Rüdiger, C.; Carrer, D.; Calvet, J.-C.; Fritz, N.; Naeimi, V.; Bartalis, Z.; Hasenauer, S. An evaluation of ASCAT surface soil moisture products with in-situ observations in Southwestern France. Hydrol. Earth Syst. Sci. 2009, 13, 115–124. [Google Scholar] [CrossRef] [Green Version]
  35. Al-Yaari, A.; Wigneron, J.P.; Ducharne, A.; Kerr, Y.H.; Wagner, W.; De Lannoy, G.; Reichle, R.; Al Bitar, A.; Dorigo, W.; Richaume, P.; et al. Global-scale comparison of passive (SMOS) and active (ASCAT) satellite based microwave soil moisture retrievals with soil moisture simulations (MERRA-Land). Remote Sens. Environ. 2014, 152, 614–626. [Google Scholar] [CrossRef] [Green Version]
  36. Brocca, L.; Hasenauer, S.; Lacava, T.; Melone, F.; Moramarco, T.; Wagner, W.; Dorigo, W.; Matgen, P.; Martínez-Fernández, J.; Llorens, P.; et al. Soil moisture estimation through ASCAT and AMSR-E sensors: An intercomparison and validation study across Europe. Remote Sens. Environ. 2011, 115, 3390–3408. [Google Scholar] [CrossRef]
  37. Brandt, M.; Wigneron, J.-P.; Chave, J.; Tagesson, T.; Penuelas, J.; Ciais, P.; Rasmussen, K.; Tian, F.; Mbow, C.; Al-Yaari, A.; et al. Satellite passive microwaves reveal recent climate-induced carbon losses in African drylands. Nat. Ecol. Evol. 2018, 2, 827–835. [Google Scholar] [CrossRef] [PubMed]
  38. Kerr, Y.H.; Al-Yaari, A.; Rodriguez-Fernandez, N.; Parrens, M.; Molero, B.; Leroux, D.; Bircher, S.; Mahmoodi, A.; Mialon, A.; Richaume, P.; et al. Overview of SMOS performance in terms of global soil moisture monitoring after six years in operation. Remote Sens. Environ. 2016, 180, 40–63. [Google Scholar] [CrossRef]
  39. Rodríguez-Fernández, J.N.; Kerr, H.Y.; van der Schalie, R.; Al-Yaari, A.; Wigneron, J.-P.; de Jeu, R.; Richaume, P.; Dutra, E.; Mialon, A.; Drusch, M. Long Term Global Surface Soil Moisture Fields Using an SMOS-Trained Neural Network Applied to AMSR-E Data. Remote Sens. 2016, 8. [Google Scholar] [CrossRef]
  40. Leroux, D.J.; Kerr, Y.H.; Al Bitar, A.; Bindlish, R.; Jackson, T.J.; Berthelot, B.; Portet, G. Comparison Between SMOS, VUA, ASCAT, and ECMWF Soil Moisture Products Over Four Watersheds in U.S. IEEE Trans. Geosci. Remote Sens. 2013, 52, 1562–1571. [Google Scholar] [CrossRef] [Green Version]
  41. Al-Yaari, A.; Wigneron, J.P.; Kerr, Y.; Rodriguez-Fernandez, N.; O’Neill, P.E.; Jackson, T.J.; De Lannoy, G.J.M.; Al Bitar, A.; Mialon, A.; Richaume, P.; et al. Evaluating soil moisture retrievals from ESA’s SMOS and NASA’s SMAP brightness temperature datasets. Remote Sens. Environ. 2017, 193, 257–273. [Google Scholar] [CrossRef] [PubMed]
  42. Escorihuela, M.J.; Chanzy, A.; Wigneron, J.P.; Kerr, Y.H. Effective soil moisture sampling depth of L-band radiometry: A case study. Remote Sens. Environ. 2010, 114, 995–1001. [Google Scholar] [CrossRef] [Green Version]
Figure 1. The AQUI network in South-Western France (top panel). Distribution of the AQUI network stations in the Aquitaine region in France (bottom panel).
Remotesensing 10 01839 g001
Figure 2. Installation of the soil moisture sensors at FRAYE site.
Remotesensing 10 01839 g002
Figure 3. Installation of the soil moisture sensors at Hermitage site.
Remotesensing 10 01839 g003
Figure 4. Time series of SMOS-IC, ASCAT, CCI, and the Bouron, Nezer, and Parcmeteo in situ soil moisture observations.
Remotesensing 10 01839 g004
Figure 5. Same as Figure 4 but with the Bilos in situ soil moisture observations.
Remotesensing 10 01839 g005
Figure 6. Same as Figure 4 but with the Hermitage in situ soil moisture observations.
Remotesensing 10 01839 g006
Figure 7. SMOS-IC VOD over the (a) Bouron, (b) Bilos, and (c) Hermitage regions.
Remotesensing 10 01839 g007
Figure 8. The impact of RFI on the accuracy of SMOS-IC products. TB –RMSE is a good proxy of RFI intensity: (a) Bouron (Fraye), (b) Bilos (Bilos-N), and (c) Hermitage (C6-1). N of points represents the number of remaining points after masking pixels with RFI > 6,8,10, and 12 (k).
Remotesensing 10 01839 g008
Table 1. The main characteristics of the Bouron, Nezer, and Parcmeteo sites [11].
SITESFrayeHillanGrand CalNezerParcmeteo
Location44°28′1.45″N44°29′29.05″N44°28′19.31″N44°35′41.17″N44°47′23.64″N
0°43′3718″W0°45′24.61″W0°46′3.24″W1°1′42.44″W0°34′35.59″W
Depth of soil sampling0–5, 10, 20, 30, 45, 55 cm0–5, 15, 30, 50, 70, 90 cm0–5, 10, 20, 35, 45, 55 cm0–5 cm (4 probes at surface)0–5, 10, 25, 50 cm
Period08/2013–Present09/2013–Present01/2013–Present05/2015–Present01/2013–Present
SM probesTetha probe ML2x (Delta-T sensors)
Vegetation typeGrove of old treesSparse & old treesDense young forestVery young treesVineyards (Graves Bordeaux domain)
Age ~33 in 2017Age ~20 in 2017Age ~16 in 2017Age = 2 in 2017
Landes ForestLandes Forest Landes ForestLandes Forest
Soil typesandy and hydromorphic podzolsGravelly soil
saturation is at ~0.6 m3/m3
wilting point is at ~0.12 m3/m3
field capacity is at 0.25 m3/m3
Table 2. The main characteristics of the Bilos sites.
SITESBilos-EBilos-SBilos-N
Location44°29′36.7922″N44°29′35.8944″N44°29′38.7470″N
0°57′20.2478″W0°57′22.4262″W0°57′21.6511″W
Depth of soil sampling0–5 cm
Period06/2014–Present
SM probesTETHAPROBE ML2x Delta-T sensors
Vegetation typeYoung stand of maritime pines (sown in 2005) of 60 ha. The vegetation consists of purple heat grass (Molinia coerulea), Gorse (Ulex nanus), Fern (Pteridium aquilinum)
Soil typeSand
Table 3. The main characteristics of the Hermitag sites.
SITESC5-1 & C5-2C6-1 & C6-2
Location44°44′39.3504″N44°44′45.6612″N
0°46′33.6864″W0°46′31.2096″W
Depth of soil sampling0–5, 10, 20, 30, 45, 90 cm
Period03/2014–Present
SM probesTethaprobe ML2x (Delta-T sensors)
Vegetation typeMaritime pine planted in 2013 and gorse and broom sown in 2013. The understory was crushed in March 2017.
Soil typeSand
Table 4. An overview of the remotely-sensed soil moisture retrievals used in this study.
PassiveActiveCombined (CCI)
SensorSMOSASCATSMMR
SSM/I
TMI
AMSRE
AMSR2
Windsat
ERS
ASCAT
SMOS
Satellite/Band frequencySMOS/1.4 GHzMetOp-A & MetOp-B/5.3 GHzVarious/1.4–19.3 GHz
Time periodJanuary 2010–presentJanuary 2007–presentJanuary 1978–December 2016
Spatial resolution/Spatial coverage27–55 km/Global25 km/Global0.25°/Global
Acquisition timeDescending: 18:00Ascending: 21:30-
Ascending: 06:00Descending: 09:30
Product versionSMOS-IC V105WARP 5.2CCI V04.2
Unitm3 m−3Degree of saturation (%)m3 m−3
Table 5. Pearson correlation (R), Pearson correlation using anomalies (Ranom), Bias, RMSE, and UbRMSE calculated between SMOS-IC, ASCAT, and CCI SM retrievals and the Bouron in situ measurements using all dates.
R (Ranom)BiasRMSEUbRMSE
CCIICASCATCCIICASCATCCIICASCATCCIICASCAT
FRAYE0.69 (0.47)0.51 (0.28)0.69 (0.49)0.010−0.0910.0100.0680.1190.0770.0670.0760.077
N = 1113N = 227N = 1225
GRANDCAL0.74 (0.49)0.56 (0.36)0.74 (0.54)0.0670.0210.0680.0790.0600.0960.0430.0560.069
N = 1112N = 229N = 1211
HILLAN20.83 (0.54)0.69 (0.56)0.81 (0.56)0.046−0.0660.0340.0580.0820.0720.0340.0480.063
N = 578N = 201N = 653
NEZER0.73 (0.60)0.57 (0.38)0.79 (0.70)0.1170.1330.0980.1210.1550.1360.0300.0780.094
N = 553N = 237N = 586
PARCMETEO0.76 (0.47)0.56 (0.47)0.66 (0.53)0.0740.0420.0460.0870.0710.0940.0470.0570.081
N = 2113N = 342N = 1891
Average0.75 (0.51)0.58 (0.41)0.74 (0.56)0.0630.0170.0510.0830.0970.0950.0440.0630.077
Table 6. Pearson correlation (R), Bias, RMSE, and ubRMSE calculated between SMOS-IC, ASCAT, and CCI SM retrievals and the Bilos in situ measurements using all dates.
R (Ranom)BiasRMSEUbRMSE
CCIICASCATCCIICASCATCCIICASCATCCIICASCAT
Bilos_E0.76 (0.57)0.52 (0.40)0.73 (0.63)0.0700.0870.0940.0770.1160.130.0330.0760.090
N = 771N = 282N = 848
Bilos_N0.74 (0.47)0.49 (0.36)0.71 (0.52)0.0650.0910.0830.0740.1200.1210.0340.0780.089
N = 914N = 324N = 997
Bilos_S0.65 (0.49)0.43 (0.41)0.66 (0.57)0.0160.0520.0330.0670.1040.0950.0650.0900.088
N = 909N = 323N = 991
Average0.72 (0.51)0.48 (0.39)0.70 (0.57)0.0500.0760.0700.0720.1130.1150.0440.0810.089
Table 7. Pearson correlation (R), Bias, RMSE, and UbRMSE calculated between SMOS-IC, ASCAT, and CCI SM retrievals and the Hermitage in situ measurements using all dates.
R (Ranom)BiasRMSEUbRMSE
CCIICASCATCCIICASCATCCIICASCATCCIICASCAT
C5_10.76 (0.51)0.61 (0.48)0.66 (0.57)0.076−0.0090.0950.0820.0490.1250.0310.0490.080
N = 1028N = 272N = 1126
C5_20.61 (0.49)0.50 (0.39)0.53 (0.53)0.0880.0120.1020.0910.0550.1350.0370.0540.088
N = 1028N = 272N = 1126
C6_10.75 (0.53)0.70 (0.52)0.75 (0.58)0.1070.0210.126 0.1110.0510.1520.0280.0460.085
N = 1021N = 271N = 1117
C6_20.78 (0.49)0.63 (0.44)0.67 (0.51)0.0850.0030.1030.0890.0470.1310.0270.0470.081
N = 1013N = 270N = 1109
Average0.73 (0.51)0.61 (0.46)0.65 (0.55)0.0890.0060.1060.0930.0500.1350.0300.0490.083

