Article

Methodology for Participatory GIS Risk Mapping and Citizen Science for Solotvyno Salt Mines

by
Abby Muricho Onencan
*,
Kenny Meesters
and
Bartel Van de Walle
Policy Analysis Section, Multi-Actor Systems (MAS) Department, Faculty of Technology, Policy and Management, Delft University of Technology, Building 31, Jaffalaan 5, 2628 BX Delft, P.O. Box 5015, 2600 GA Delft, The Netherlands
*
Author to whom correspondence should be addressed.
Remote Sens. 2018, 10(11), 1828; https://doi.org/10.3390/rs10111828
Submission received: 28 September 2018 / Revised: 23 October 2018 / Accepted: 14 November 2018 / Published: 19 November 2018
(This article belongs to the Special Issue Citizen Science and Earth Observation II)

Abstract

:
The Horizon 2020 interim evaluation (2017) indicates a steep increase in citizen engagement in European Union Citizen Science (CS) projects, with less than 1% in budgetary terms and minimal influence. Research findings attribute weak CS influence to the restriction of citizen actions to data collection, with minimal or no engagement in co-design, co-creation, data analysis, and elucidation of results. We design a participatory GIS and CS methodology aimed at engaging the citizens in the entire Earth Observation (EO) project cycle. The methodology also seeks to address previous CS project challenges related to data quality, data interoperability, citizen-motivation, and participation. We draw the high-level requirements from the SENDAI framework of action and the three pillars of active citizen engagement, as enshrined in Principle 10 of the Rio Declaration and the Aarhus Convention. The primary input of the methodology is the Haklay (2018) approach for participatory mapping and CS, and the Reed (2009) stakeholder analysis framework. The proposed methodology comprises of three main parts: system analysis, stakeholder analysis, and a six-step methodology. We designed the six-step methodology using an iterative and flexible approach, to take account of unforeseen changes. Future research will focus on implementing the methodology and evaluating its effectiveness in the Solotvyno Saltmine case study in Ukraine.

Graphical Abstract

1. Introduction: Citizen Science and Spatial Risk Mapping

A significant milestone in strengthening risk governance was the adoption of an action-oriented and targeted DRR framework, during the Third World Conference on DRR, held in Sendai, Japan on 14 to 18 March 2015 [1,2,3,4]. The 2015–2030 Sendai Framework for Disaster Risk Reduction (SFDRR) [3], which is a successor of the Hyogo Framework for Action 2005–2015 [4], introduces the element of risk in disaster management [3], (p. 5). The Sendai Framework recognizes that stakeholders have an active role in disaster risk management. It recommends measures to increase accountability and strengthen risk governance. The basis of the Sendai Framework is four key priorities: (1) Understanding disaster risk [3], (p. 14); (2) “Strengthening disaster risk governance, to manage disaster risks” [3], (p. 17); (3) “Investing in disaster risk reduction for resilience” [3], (p. 18); and (4) “Enhancing disaster preparedness for effective response, and to ‘Build Back Better’ in recovery, rehabilitation, and reconstruction” [3], (p. 21).
In furtherance of the SENDAI framework’s priority 4, the European Union Civil Protection Mechanism (EUCPM) initiated the ImProDiReT (Improving Disaster Risk Reduction in Transcarpathia, Ukraine) project. The ImProDiReT project seeks to use innovative Earth Observation (EO) technologies to strengthen disaster risk governance in the Transcarpathian region, Ukraine (see project details in Appendix A). EO is the compilation of in situ ground surveys and remote-sensing data regarding the Earth surface. EO uses various sources to extract the data including drones, satellite sensors, airplane aerial imagery, hand-held sensors, permanent ground sensors, paper-based templates, and digital questionnaires [5]. One of the emerging sources of data is citizens: as sensors, data collectors, and in the recent past co-creators, monitors, and evaluators.
The role of the citizen in EO, for the last four decades, has widened through the use of community-based approaches to enrich geospatial maps and enhance the quality of social vulnerability assessments [6]. Most frequently used community-based approaches include the rapid rural appraisal (RRA) and the participatory rural appraisal (PRA). Application of these approaches is mainly in natural resource management (NRM) projects [7,8,9,10]. Beyond NRM, RRA and PRA have also proved to be effective in DRR [11,12,13,14,15,16,17,18,19,20]. PRA and RRA spatial data improve the understanding of hazard features, including zoning of the different levels of vulnerable structures and people. Also, through the fieldwork, experts can gather from the local people information about their coping strategies and represent this in sketch maps.
Unfortunately, most of these RRA and PRA sketch maps, photographs, and historical community profiles were not formally incorporated in the official EO maps nor legitimated [21,22]. Most often they were not stored, backed up, or updated [23]. Moreover, there was a loss of local knowledge relevant to EO after the conclusion of the RRA and PRA projects [21]. The challenges of integrating maps developed using RRA and PRA approaches opened up new opportunities for innovations to address the gap.
Recent advances to improve the uptake of RRA and PRA data have arisen in remote sensing and community risk assessment (CRA) to transform the citizen data into flexible forms (accessible and usable) of spatial data [21,23]. Flexible spatial data allows policymakers and communities to interact and update the data with minimal or no support from the EO scientists [21,24]. Spatial maps that are accessible to the community enhance local capacity, strengthen local risk governance, increase social learning within the community and improve the communication of risk [21,24,25]. Also, flexible maps allow the community to undertake risk analysis, joint risk zoning, and risk evaluation [23].
Notwithstanding advances in CRA and remote-sensing, these innovations have not extensively harnessed local spatial knowledge to improve the understanding of risks and strengthen risk governance [3,4,21,26]. As a consequence, Participatory Geographic Information Systems (GIS) was introduced to combine the DRR remote sensing data with the local spatial knowledge that is relevant to hazard, exposure and vulnerability. According to McCall (2008), PGIS results led to improved hazard forecasting, risk estimation, and an increased understanding of vulnerability and community coping strategies [25]. The use of local knowledge to enrich spatial maps increased the legitimacy of the maps and improved policy planning and decisions by providing more thorough, consistent, credible, empirical data [21,27,28,29,30]. Since the spatial maps focus on a specific locality, the information can be verified and adjusted depending on local values, perceptions, and priorities. The PGIS map is also socially inclusive, thereby increasing its uptake and use. Furthermore, decisions made using a PGIS map are more informed and better implemented, thereby increasing trust between the local leadership and the community. PGIS mapping usually is less costly, due to cost reductions by use of local community-based, voluntary resources [21].
Principle 10 of the Rio Declaration on Environment and Development recognizes and supports PGIS [31]. Principle 10 emphasizes three pillars of participation. These three pillars are the need to ensure that the public has access to environmental information, can participate in decision-making, and has access to environmental justice. These three pillars are also enshrined in the Aarhus convention (UNECE 1998) [32,33,34]. The introduction of open data facilitated the sharing of PGIS databases across the globe that can be updated and visualized through GIS-based images [34]. Therefore, open data facilitated the implementation of Principle 10 and the Aarhus convention. Despite all the advantages of introducing PGIS to make data more flexible and interoperable, the innovations were not systemic and most of the time never institutionalized [35].
Consequently, Citizen Science (CS) was introduced to institutionalize some EO innovations, including PGIS, leading to the systematic updating and monitoring of PGIS maps [36]. CS connotes long-term engagement with the citizens as scientists, in addressing local challenges [34,35]. The European Commission “Green Paper on Citizen Science,” defines CS as:
“the general public engagement in scientific research activities when citizens actively contribute to science either with their intellectual effort or surrounding knowledge or with their tools and resources. Participants provide experimental data and facilities for researchers, raise new questions and co-create a new scientific culture… As a result of this open, networked and trans-disciplinary scenario, science-society-policy interactions are improved leading to a more democratic research based on evidence-informed decision making”.
[37], (p. 7)
The Horizon 2020 interim evaluation indicates a steep increase in citizen engagement in EU projects, with the marginal imprint of less than 1% in budgetary terms and minimal influence [38]. Citizen engagement should be at the same level as EO specialists in project design, creation, monitoring, and evaluation [21,24,35,39]. Most of the research findings indicate that CS actions for the citizens are primarily data collection [34,35,40,41,42]. Fritz et al. (2017) highlight six challenges encountered in previous CS projects. First, not involving the citizen in the entire workflow or project cycle and confining their role to data collection [36]. Second, data quality issues [43,44,45,46]. The third challenge is data incompatibility (interoperability) [47,48]. Fourth, citizen-motivation and engagement challenges [49,50]. Fifth, sustainability issues (citizen retention and participation) [5,51]. Finally, legal matters related to licensing, privacy, and ethical concerns [52].
To increase the influence of CS, the European Commission (2017) report produced under the chairmanship of Pascal Lamy (High-Level Group Chairperson) recommends increased quality engagement of citizens in co-creation, monitoring, and evaluation. In pursuance of the EU Green paper on CS [37], the Horizon 2020 interim evaluation recommendations to strengthen CS [38] and the European Commission (2017) High-Level Group report [53], we developed a Participatory GIS Risk Mapping and CS Methodology. This methodology will draw input from the Haklay (2018) methodology for participatory mapping and citizen science [41], Reed (2009) schematic representation for critical steps for stakeholder analysis [54], and the Graciela Peters-Guarin (2012) proposed approach for coping strategies and risk manageability: using PGIS to represent local knowledge [21]. Also, based on the analysis by Fritz et al. (2017), lessons learned will be drawn from some of the listed ongoing and concluded CS projects [36].
The paper consists of three main parts. First, we assess the growth of CS in Europe in research, innovation, and projects. In the third section, we discuss the Solotvyno Saltmines land subsidence challenge and introduce the complex decision-making process and the challenge of having multiple and competing perceptions of risk. Finally, we assess three significant attempts by the Ukrainian government to address the problem (risk mapping to identify high-risk areas, relocation, and liquidation of the mining company). The fourth section describes the methodology. The fifth section introduces two case studies where the methodology has been applied and the opportunities and challenges of implementing the methodology in Solotvyno. After the four main sections, we provide a brief concluding section.

2. Citizen Science in Research and Innovation

The first application of CS was in 1989, (under the name CS) by the Audubon Society, where 225 American citizens collected rain samples to test rain-water acidity [35], (p. 71). After that, the term CS continued to be used and slowly gained acceptance in the 1990s [55]. The increased recognition is measured by the steep surge in CS projects, its inclusion in policies (e.g., European Commission Green Paper on Citizen Science) and practices.

2.1. The Growth of Citizen Science in the European Union

There are some essential practices in policy formulation, implementation (EU level and national) and analysis (research & innovation), attributed to the growth of CS in Europe. At the policy formulation level, there have been two main developments. First, the European Commission “Green Paper on Citizen Science” [56] was adopted and set the stage for the ongoing policy transformations in the European Commission, Council, and Parliament to support CS [40]. Second, the adoption of the 3Os strategy (Open Science, Open Innovation, Open to the World), facilitated CS work. Moreover, the 3Os strategy book on Europe’s future: Open Innovation, Open Science, Open to the World‘ was launched on 15 May 2017.
At the policy implementation level, the EU has undertaken CS initiatives directly and indirectly through its member states. Directly, the EC engages citizens through some actions including VOICES urban waste project, CIMULACT, and NewHoRRIzon projects, to co-create future citizen EC research narratives and visions. Also, the ‘Invasive Alien Species’ app (IAS), was launched by the European Commission’s Joint Research Centre. The IAS app is in furtherance of the Regulation (EU) 1143/2014 on invasive alien species (the IAS Regulation) that came into force since 1 January 2015. Through the app, European Union citizens can document IAS incidents as an early warning advisory for new species invaders. At the national level in Europe, in March 2017, a participatory research charter was signed between the French Research Ministry and research institutions. Additionally, the Ministry for Education and Research in Germany (BMBF) is funding projects that support the co-creation of knowledge with citizens (BürGEr schaffen WISSen or GEWISS).
At the policy analysis level, there are numerous strides towards improving CS in Europe. Since 2002, the Framework Programmes for research and Innovation have dedicated funds for CS projects. In 2012, the European Union financed five projects under the topic “Developing community based environmental monitoring and information systems using innovative and novel earth observation applications.” In 2017, the European Commission under the Horizon 2020, had specific calls for citizen science (e.g., “Exploring and supporting citizen science”) and introduced Responsible Research and Innovation (RRI). The overall objective of RRI is to engage civil society organizations and citizens in research and innovation (R&I).

2.2. Citizen Science in Research and Innovation (R&I)

In the mid-1990s, CS gained traction and there was a steep increase in the CS projects and research studies [1,5,35,37,56]. Additionally, there was a drastic rise in publications on CS generally and specifically in the EO domain. Based on a SCOPUS search result conducted on 12 November 2018, there were 306 publications for “earth observation” AND” citizen science” and 2882 for “citizen science,” between 2008 and 2018.
In 2008, only 20 articles were published under the “citizen science” group in comparison to 2017, where 650 articles were published. There was only one article published under the “earth observation” AND “citizen science” domain in 2008 compared to 2017, where 78 articles were published. Google Scholar has more research output, based on a search conducted on 12 November 2018. For the date range 2008–2018. There were 20,500 articles for “citizen science” and 547 publications for “citizen science” AND “earth observations”.
The enormous difference between “citizen science” and “citizen science” in “earth observations” search results, indicates that CS in the domain of EO is small compared to other CS research and innovation (R&I) initiatives. Earth and Planetary studies are only 6.4% of the overall CS documents. The main EO subject areas are Environmental Science (22.7%), Agricultural and Biological Sciences (18.3%), Earth and Planetary Sciences (17.6%), and Social Sciences (10.9%).

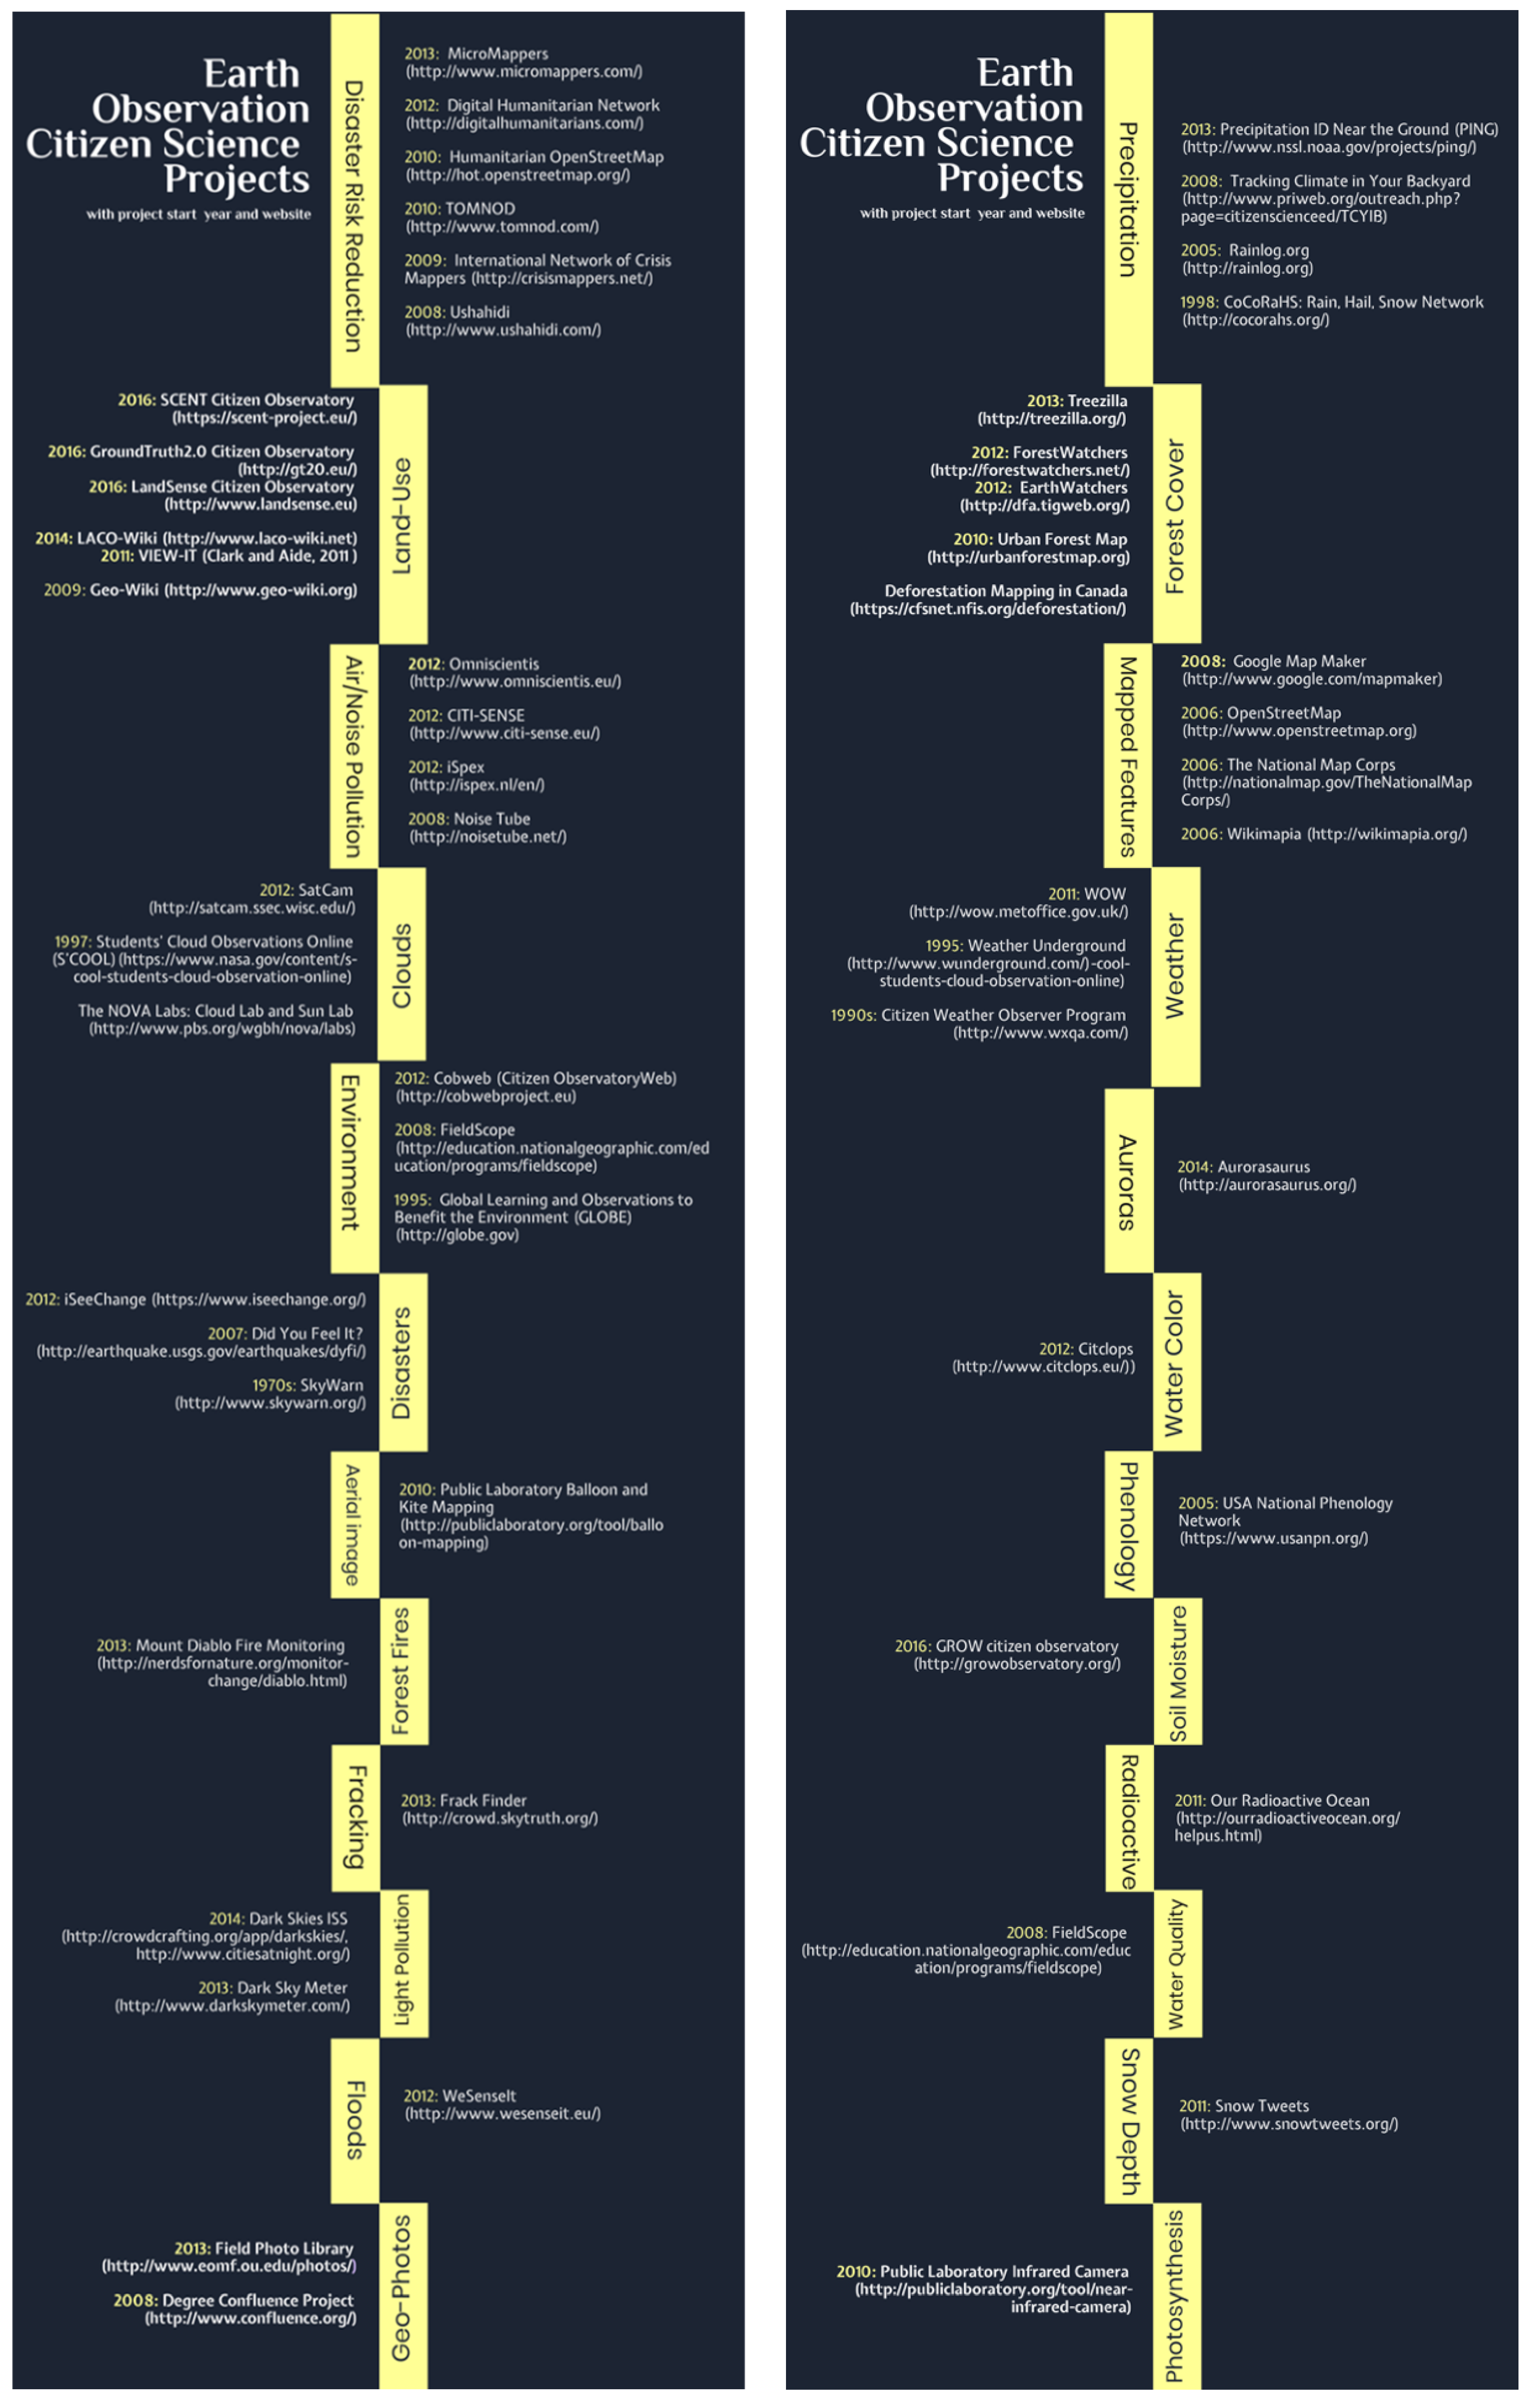
2.3. CS Projects Providing Useful Data for EO

A typical CS project comprises the input-process-output policy model [57]. In most of the CS projects, the citizens are engaged at the input level [42]. Thus, they provide relevant input for EO remote-sensed data and imagery [36]. Fritz et al. (2017) conducted an extensive review of CS projects that are providing relevant input and in situ data for EO projects. Figure 1 is an illustration of the projects, classified under 23 groups based on the data collected [36], (pp. 3–4).
According to Fritz et al. (2017), only 27 percent of the citizens are engaged beyond the input level, in co-creation, decision-making, monitoring, and evaluation. A high proportion of the projects involved the use of citizens as collectors of in situ data (83 percent). For instance, the Public Laboratory for Balloon & Kite Mapping (https://publiclab.org/wiki/stories) was established in 2010 after the Gulf of Mexico Oil Disaster. During the disaster, the citizens had no access to relevant data. However, they could see the damage the oil was causing on their environment. Through the laboratory, citizens collected over 100,000 aerial images using balloons and kites. Afterward, the maps were integrated into Google Earth. Thus, citizens were used as data collectors, to increase visibility on the oil disaster. Unfortunately, most CS projects barely engage citizens in the entire input-process-output policy process, leading to the weak integration of CS in policy and practice.
We will draw lessons learned from the Fritz et al. (2017) report and some of the ongoing and concluded CS projects listed in Figure 1. The methodology will focus on a CS platform that utilizes both online and field-based data collection methods. Also, based on the CS projects, lessons will be drawn on what needs to be improved and what to avoid. In the following section, we discuss the methods employed to develop the methodology.

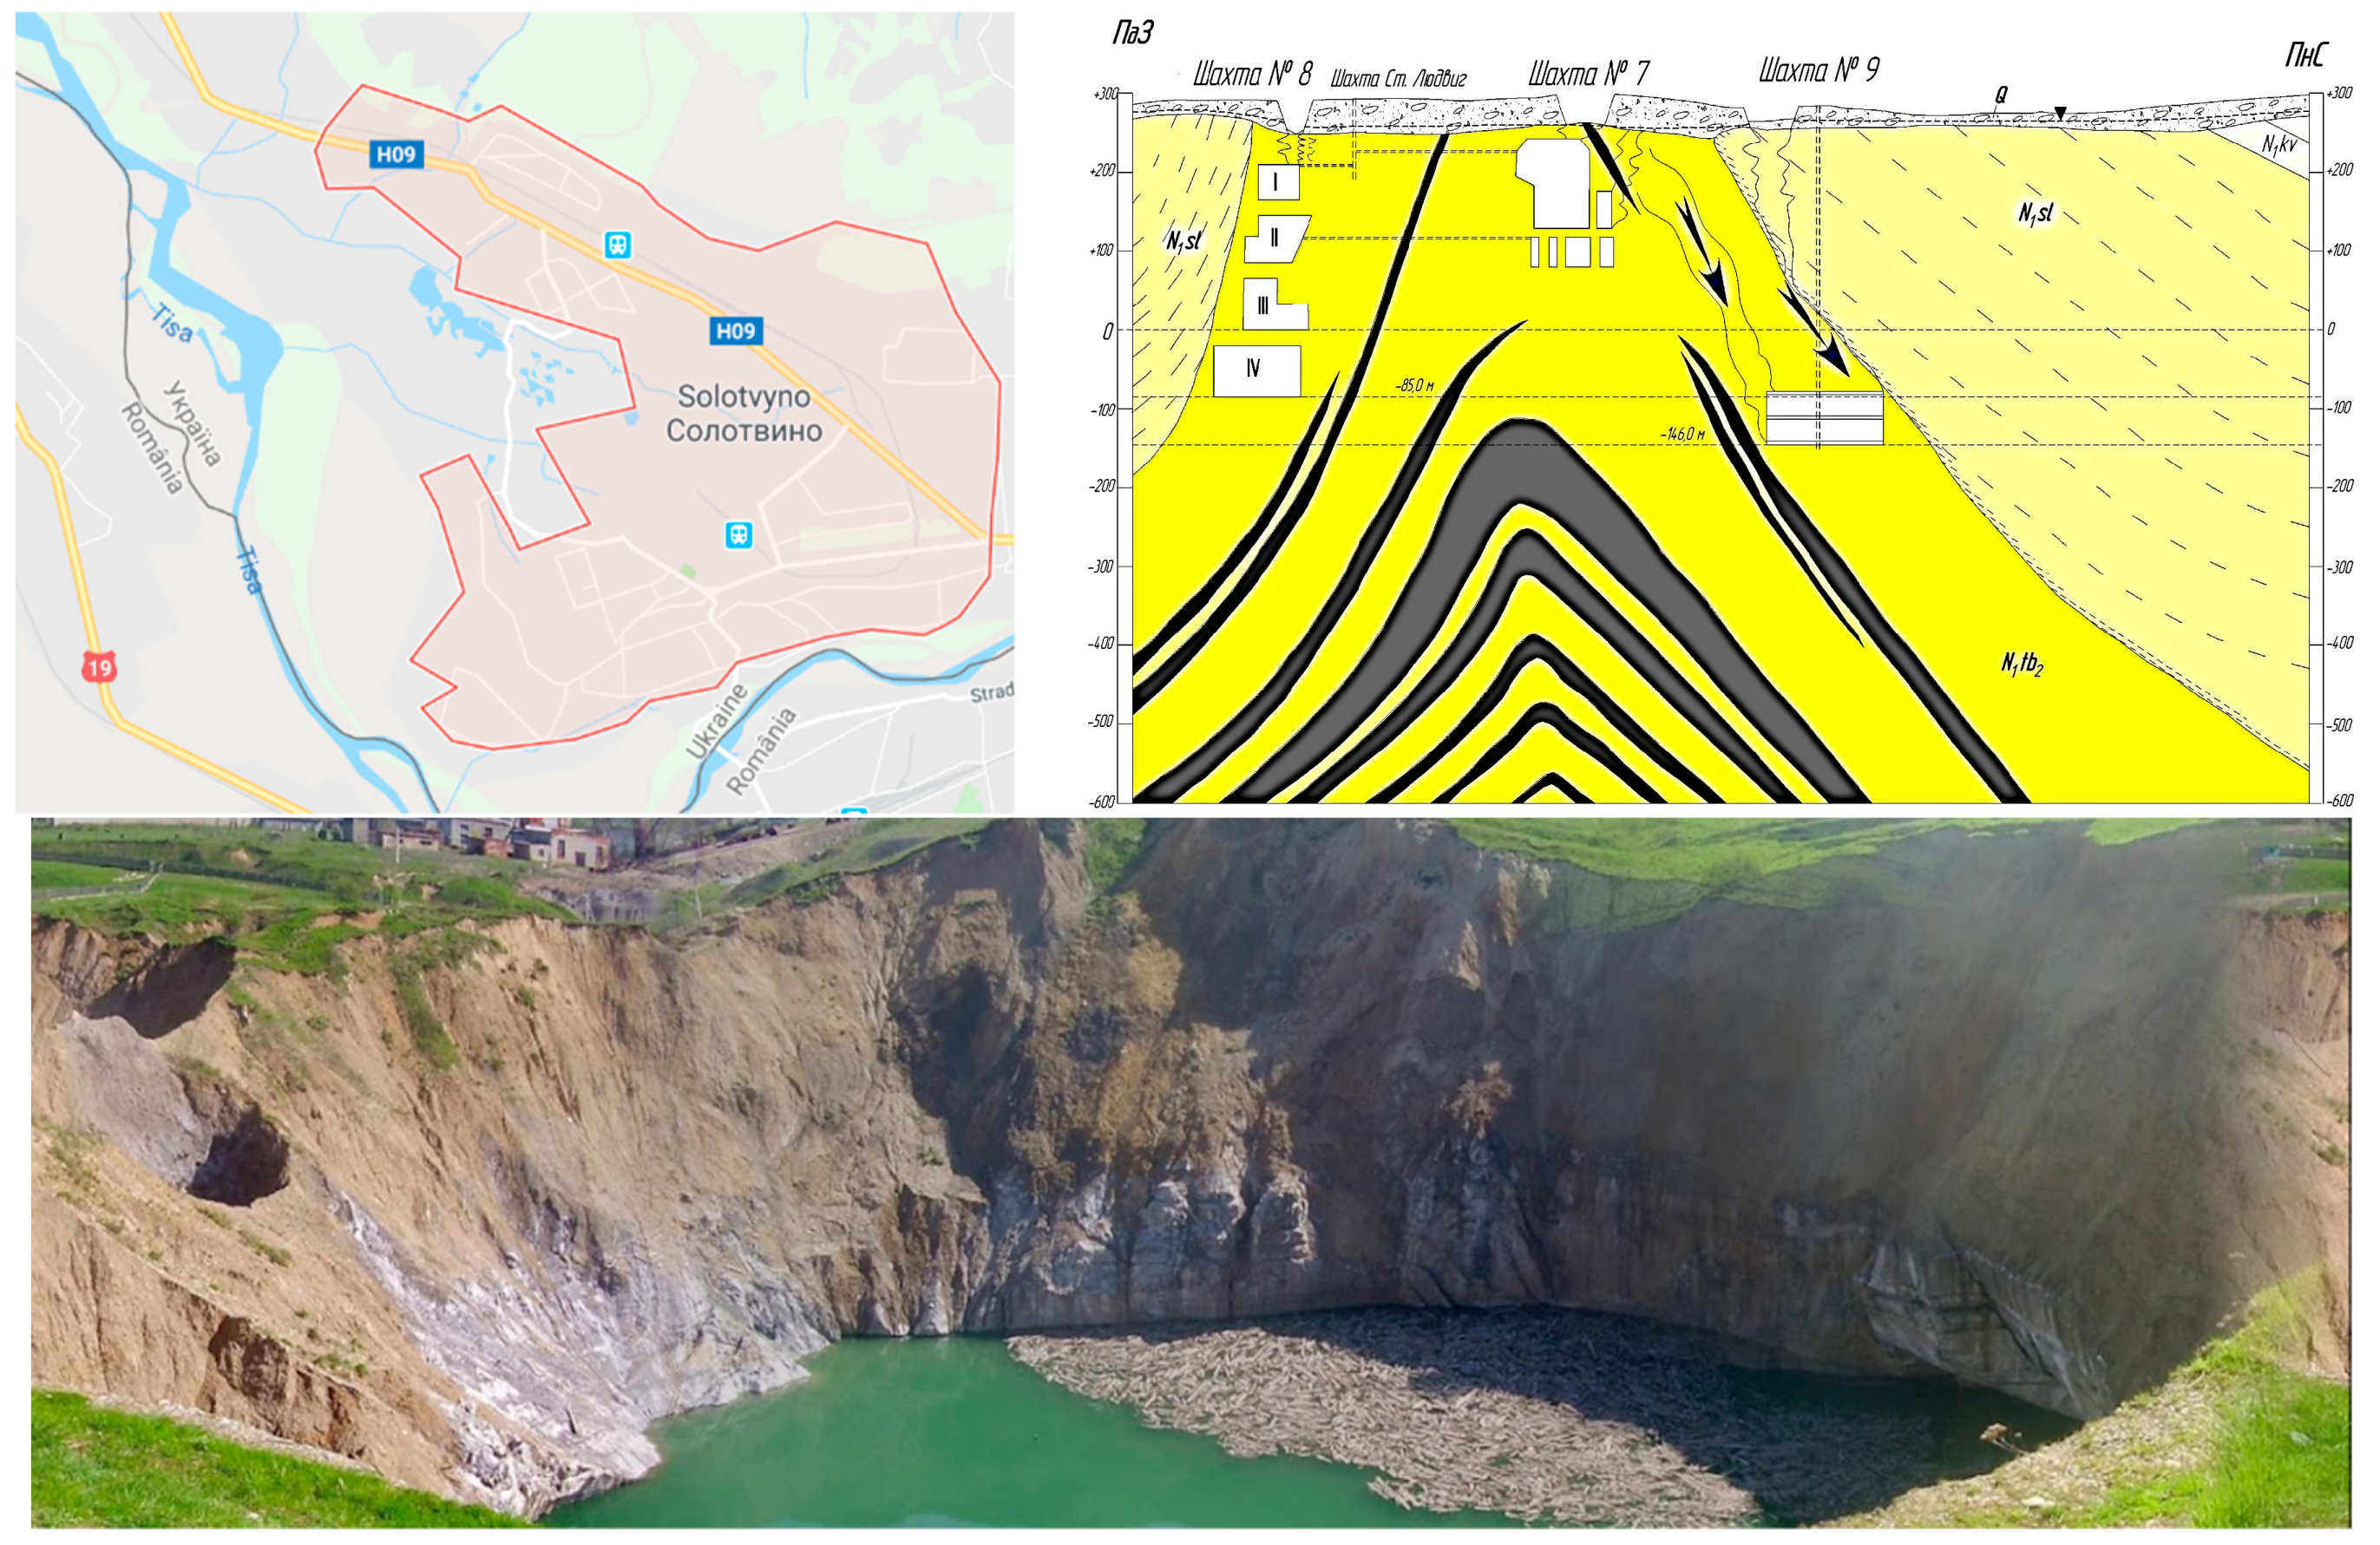
3. The Case Study: Solotvyno Salt Mines

3.1. Land Subsidence in Solotvyno Saltmine Village

Solotvyno (Ukrainian: Сoлoтвинo) means salt, named after the salt mines that are at the center of Solotvyno village (Figure 2) [58]. Solotvyno is situated in the Tyachev district of the Transcarpathian region (Zakarpattia Oblast) of Ukraine, closer to the Romanian border and on the right bank of River Tirza (Figure 2). The village is densely populated with about 300 houses [58].
Many mega-annums (Ma) ago, the Carpathian sea was situated in Solotvyno, leaving behind kilometers of high-quality salt. The mining of salt deposits has been ongoing since the 1790s [60]. Inside the mines were large chambers; one such underground compartment was 20 m deep and 60 m high and used for music production [61]. In one of the chambers was the largest allergological hospital. The hospital started operating in 1976 [62]. Studies indicate that the hospital’s bacterium-free microclimate (comprised of saturated salt) treated approximately 95 percent of children and 85 percent of adults [60,62].
The slow geological salt-formation process remained uninterrupted when there was clay protecting the upper part of the salt-dome. The natural procedure of salt transforming into plastic parameters and becoming soft and then moving to the surface is protracted and not hazardous. It takes a few million years for the salt to move to the surface due to pressure. The slow movement establishes an equilibrium, thus not disrupting the earth’s surface [63].
During salt exploitation of the upper part of the salt-dome, the mining company removed the protective clay layer, as illustrated in Figure 2. Consequently, water began to filter into the galleries, thereby dissolving the salt materials. The salt dissolved, leading to the active upward mobility of the salt solution to the surface. As a result, there was a karst technogenic reaction leading to subsidence in the peripheral part of the salt mines and the collapse of the central region. The process of karst removal and subsidence has been going on for many years [64].
The flooding of the mines began in 1908, leading to the formation of Lake Cunegunda [60]. After that, more salt lakes were formed (Figure 2). There were dozens of pump stations removing the water from the mines into Tirza river to reduce the occurrence of a disaster due to the presence of freshwater resources close to the salt dome. Also, the mines that were found to be unviable (economically) were filled and closed. After the downfall of the Soviet Union, the mines came under a new governance mechanism. With the new government, there was less allocation of money to manage water in the mines. Therefore, the pumping of water out of the mines including repairs and maintenance was stalled [61]. The mines flooded in 1998 and the water slowly moved into the cavities, dissolving the salt and the land slowly subsided. By 2000, the ground collapsed, and after that there was subsequent land subsidence. In 2005, one house and eight cottages collapsed [60].
In February 2008, a significant karstic hollow was formed (30–40 m), leading to the closure of the mine 9, and Mine 8 was closed in 2010 [61]. Within the two years when the salt mine and factory were not operating, 600 people lost their jobs [60]. In addition, two underground allergological hospitals that focused on asthma treatment were closed [62]. Most of the Solotvyno residents lost their primary source of income [58,61,65]. With the land subsidence and salt mine collapse, exposure of the Solotvyno inhabitants and the tourists to the geological hazard and the increased levels of vulnerability became a significant issue of concern [66,67,68].
In December 2010, the situation related to these critical exogenic geological processes within the territory of Solotvyno salt mines was classified as an emergency by a decision of the Transcarpathian Regional State Administration. The village was also declared by the national State Emergencies Services (SES) to be at a critical point [66]. The expert report of the Ministry of Emergency Situations of Ukraine (No. 02-17292/165 dated from 9 December 2010), later approved the decision of the Transcarpathian Regional State Administration. The approval resulted in the announcement of an environmental disaster at the state level by the Ministry. Therefore, it is currently a high-security zone of national importance.

3.2. Complex Decision-Making Process

Being declared an emergency and a matter of national importance, the primary responsibility for the future of the village and the salt mines shifted to the central government. Only the central government can make decisions concerning the future of the Solotvyno mines, the residents, and economic activities in that place. As a consequence, the Head of the Regional State Administration of Transcarpathia (Governor) [67], the Head of the Tyachiv District State Administration [68], and the Mayor of Solotvyno Municipality [58] cannot make significant decisions regarding the future of Solotvyno. Their role is limited to urban planning, water treatment and distribution, waste management, and similar duties. Strategic decisions are vested with the central government that has constituted a Solotvyno working group that meets in Kiev, Ukraine. Despite having this working group, there is a lack of coordination of the socio/economic/environmental and safety issues.
Also, at the state level, the state institution that was responsible for the mines is the one mandated to resolve the current problems in Solotvyno. The Ministry of Agrarian Policy and Food is the state institution that was responsible for the exploitation of the mines. Therefore, the same Ministry continues to receive money from the consolidated fund to address the Solotvyno crisis. The same Ministry is responsible for building the 133 homes and planning the relocation, and the ongoing liquidation and restoration of the mines. Both processes are at a standstill [58,67,68].
This decision-making process is not only slow, but also disjointed and disempowering for the local authorities and the local communities. Unfortunately, most of the stakeholders’ lack information on the ongoing activities and efforts to resolve the situation. The current governance system fails to respect the “principle of subsidiarity” that requires decision-making at the lowest, less centralized, and smallest competent authority. Therefore, in the case of Solotvyno salt mine, the municipality or another competent authority at the lowest level, rather than the Ministry of Agrarian Policy and Food, should have been given the power and budget to facilitate the relocation and liquidation process with the active participation of the central government, the Solotvyno residents, and other stakeholders.

3.3. Multiple and Competing Risk Perceptions

Vulnerability assessments, when faced with multiple, competing, and sometimes conflicting risk perceptions from a diverse group of stakeholders, are not straightforward [21]. Being a border town, Solotvyno is a highly complex social-technical system comprising of multi-ethnic, multi-religion, multi-national, and multi-lingual groups. Also, diverse competing interests need to be considered when strengthening risk governance in Solotvyno. Risk perception is different amongst different stakeholders [69,70,71]. One’s opinion of the likelihood of the hazard occurring, the degree of exposure and extent of vulnerability mainly affects their overall understanding of the risk and the actions they will take to manage it [21]. For instance, in the case of the Solotvyno salt mines, land subsidence and collapse in a salt mining area is perceived by the modelers as a phenomenon that they can model and quantify to develop risk maps [72,73]. However, vulnerability is not easy to model [74].
To the head of the region, the safety of the people is a crucial concern, and there is a risk of not understanding what is ensuing beneath the surface of the earth, to inform decision-making [67,68]. To this date, getting real-time information on the current status of the flooded mines is a significant challenge. Without this information, the current models based on available data are incomplete and not accurate. The water directorate is concerned about further flooding of the mines that would result in more land subsidence and collapse [73]. The concern of the State Ecological Inspection Department is salt-intrusion into land and rivers and unauthorized pumping of the brine [6]. The pumping of the brine is done with non-metered pumps, thus aggravating the data availability challenge. The PJSC “Girhimprom” (Mining Company), perceives it as an incident that requires immediate actions to minimize the loses and reduce responsibility [75]. The former miners lost their jobs and fear the continued flooding and subsidence of the mines may diminish future job opportunities for miners in Solotvyno [61]. Developing a business case for future investment in the mine is a significant challenge. For the state authority that authorized the corporate action, their perception of the risk is the likelihood of minimizing event occurrence through liquidation and closure [76]. The local government perceives the risk as an information gap that needs to be filled to enable them to make better decisions on whether or not to relocate the people away from the high-risk zones [58]. The State Emergency Services perceives a governance problem; they may not be informed on time to be able to facilitate the movement of persons at high risk to safer places [66]. The companies in the recreation center face the risk of bad publicity that might damage their business or even lead to business closure [59]. The school directors and teachers face the risk of not preparing their students for the disaster risks through their safety training [77,78]. The religious leaders face the risk of most of their parishioners leaving the village in search of a safer place, losing jobs, and not being able to meet their basic physical needs [65]. The citizens with deformed houses face the risk of their homes collapsing, leading to further damage or even loss of life. They also face the risk of not being compensated for the deformed or collapsed homes [79]. Regrettably, for the local citizen, the risk is an incidence that they are required to confront and manage on a daily basis [80]. In doing so, they have to avoid the regions that are subsiding and take extra precautions to reduce risk incidence.
The EO scientists need to be cognizant of local knowledge on risk perception and the management of risks to develop the appropriate decision support tools. Due to the multitude range of risk perceptions, there is a wealth of local knowledge on how the various stakeholder groups are coping, adapting, or managing the risks. The local knowledge is a collection of facts about the characteristics of the hazard, its frequency, and the changes that have been happening in their environment due to the hazard. With a rich historical understanding of the hazard, the local people have established formal and informal mechanisms to cope with the hazard. These mechanisms need to be known and understood by the EO scientists, to be able to support the community in developing DRR tools to complement the existing ones, with the aim of managing the risk and reducing vulnerability [21].

3.4. Previous Attempts to Address the Challenges

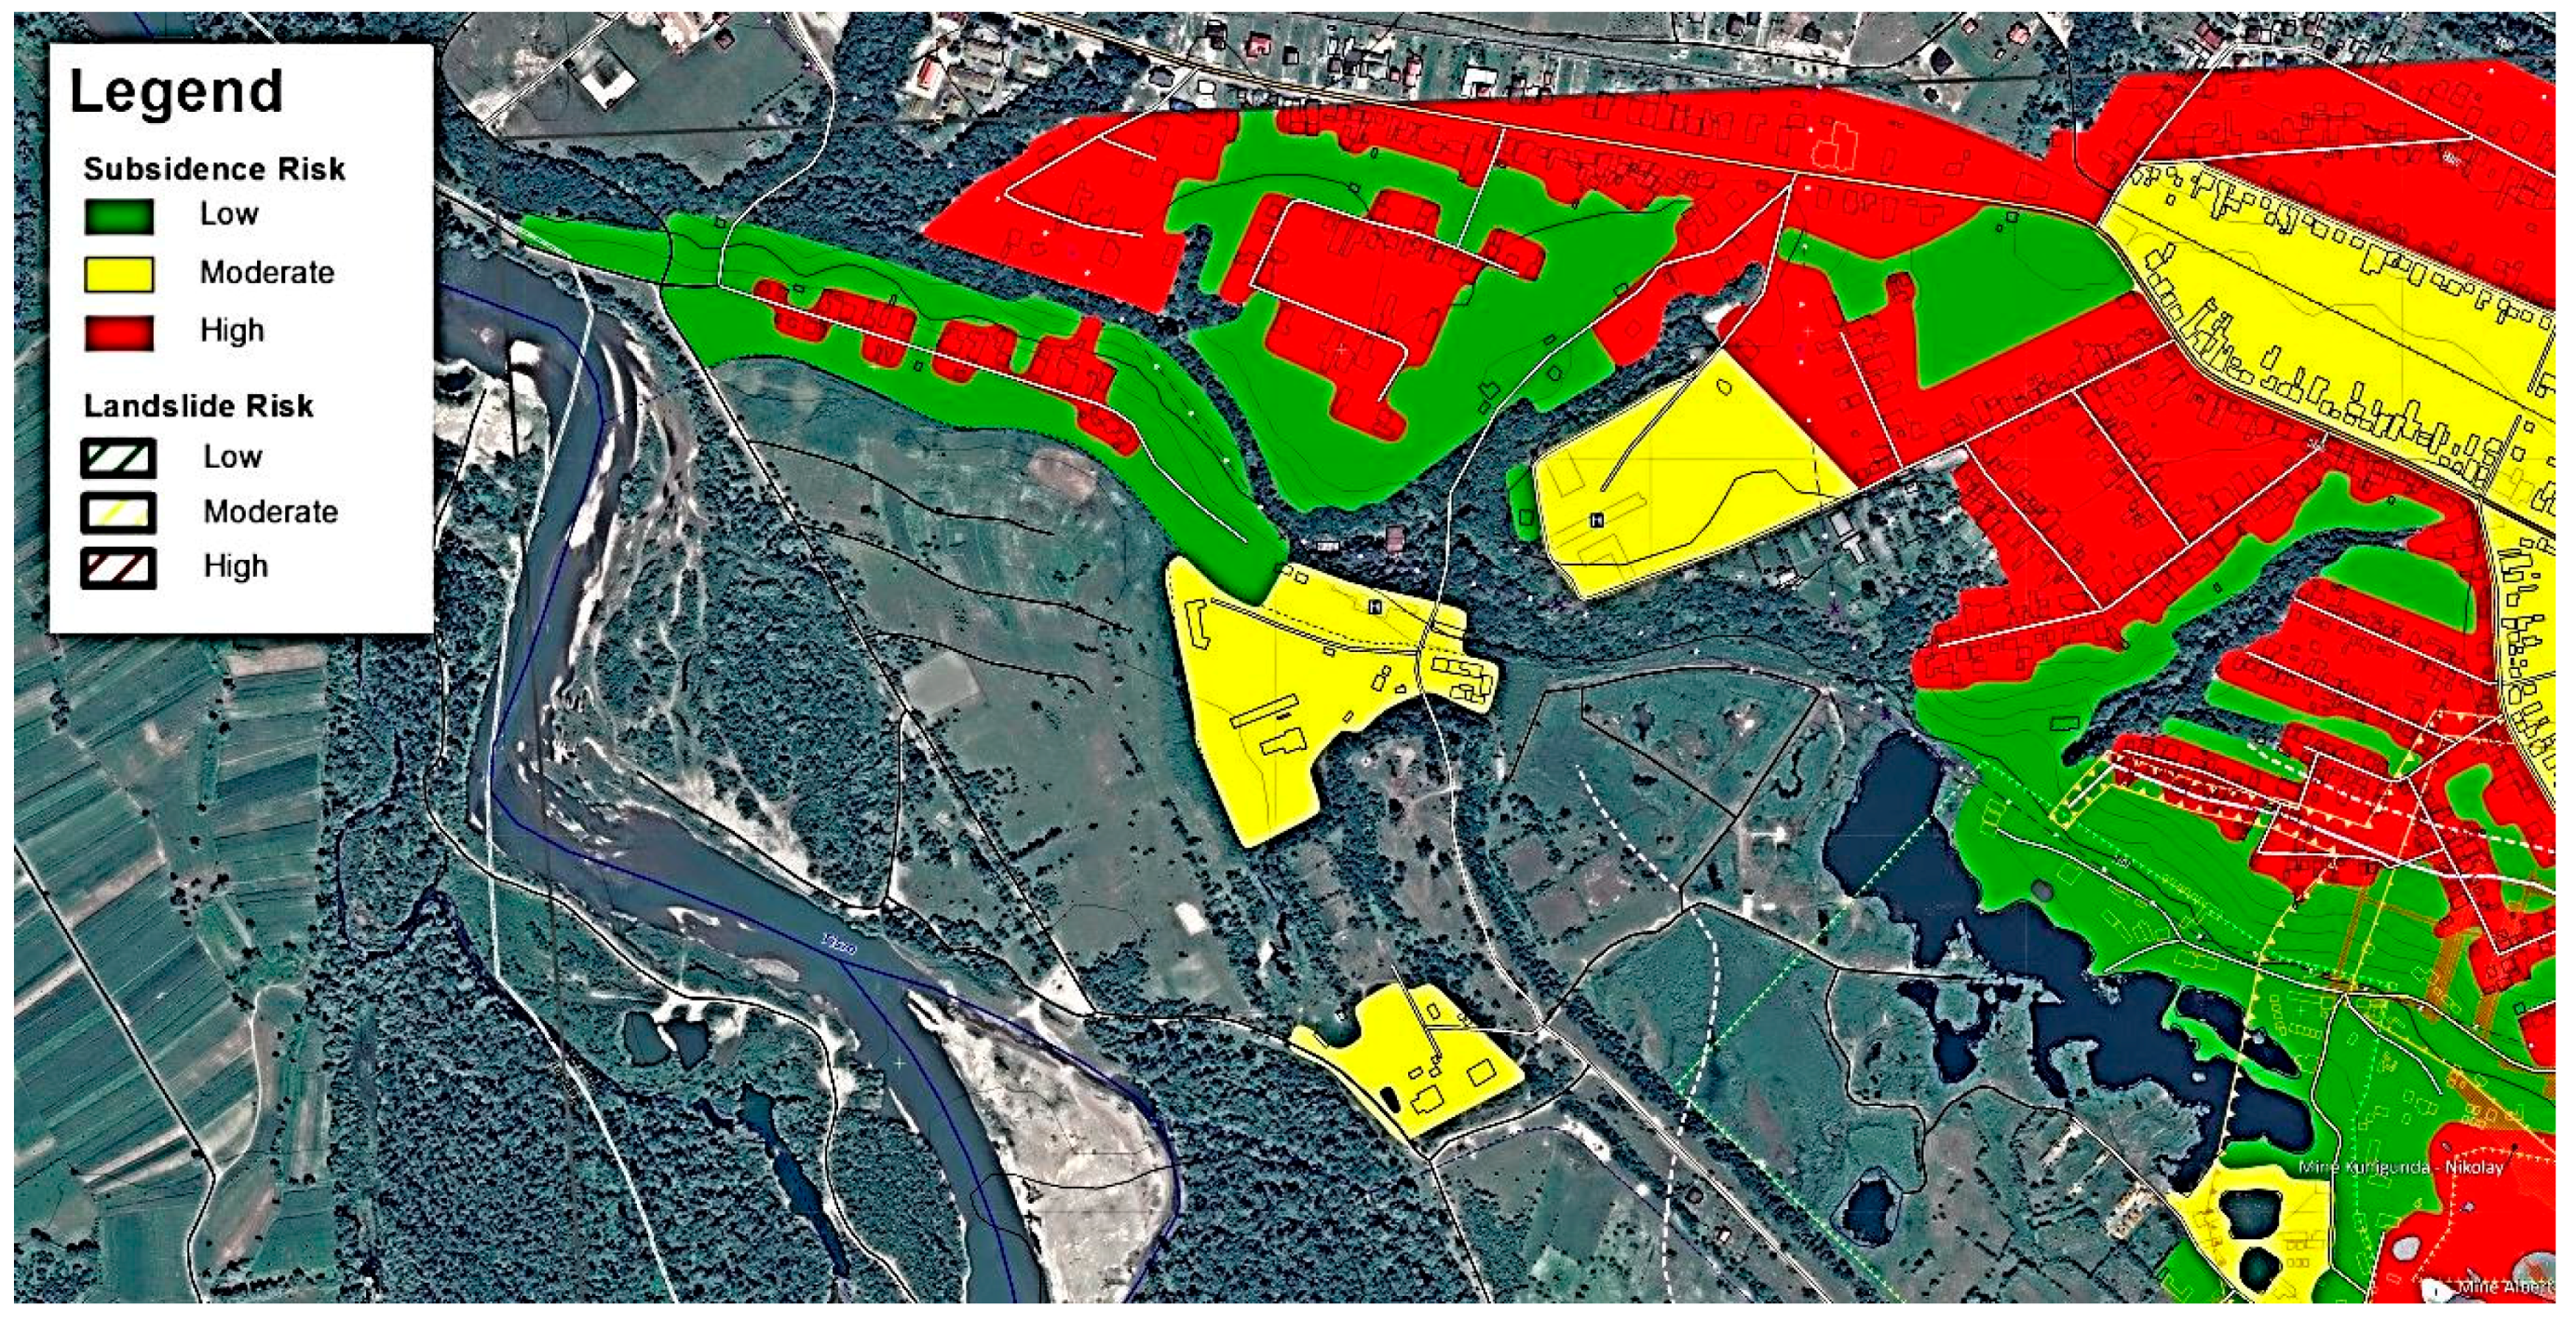
3.4.1. Development of Risk Maps to Identify the High, Moderate, and Low-Risk Zones

Access to environmental information is a fundamental right for every citizen according to the Aarhus Convention. Most ecological decisions require sufficient knowledge of the situation for informed decision making. Understanding the level of geological risk, in the case of Solotvyno, is critical for informed decision-making.
There are existing studies and risk maps for Solotvyno (see Figure 3). The existing maps provide a wealth of information that is relevant to DRR in Solotvyno. The Solotvyno maps play a critical role in the decision-making process. The maps are not accessible in a form that is easily understood by all the Solotvyno village residents [77].
The recent Copernicus Emergency Management Service digital maps (Figure 3) are not accessible to the local community in a format that the community can understand. They are online and most of the population do not have regular access to the internet. The reports are too technical, written in English, and not written for Solotvyno local community as the target audience. Also, the purchasing of most of the digital maps is not affordable for most institutions and citizens.

3.4.2. Relocation from Solotvyno to Tereblya

When the Solotvyno mining company could not rescue the salt mines and the situation was critical, risk maps were developed to identify high-risk zones [58]. To relocate the 133 families from the high-risk zones, the Ukrainian Government built 133 (116 flats and 17 houses) for the Solotvyno residents in the village in Tereblya. The Ukrainian government constructed a school. Thirty-five to forty families took keys, went and looked at the houses, and returned [80]. Only 11 of the Solotvyno residents currently live in Tereblya [68]. Some people, especially families whose homes have serious cracks, were ready to move to Tereblya after receiving the keys. They did not move because there was no clarity on who owns the new homes [79]. Others refused to move because the building was not constructed to take account of the complexity of Solotvyno. In Solotvyno, the Romanian houses are mansions, and the Czech houses are small and sturdy. The new dwellings failed to capture the opulence of Romanian homes nor the strength of Czech houses. One of the Solotvyno residents from Czech origin refused to move because they did not feel safe in a house with fragile walls [80].
Most of the Solotvyno residents refused to move. The main reason for people’s refusal to relocate was the distance between Tereblya and Solotvyno. It was too far [58,67,68]. Some Solotvyno residents did not want to relocate far away from the land of the ancestors; one resident stated that he wants to be buried where his family was buried [77]. Others were too old to relocate [58].
Even though Tereblya is a salt village, the salt quality is perceived to be lower than Solotvyno [62]. Also, there were no or poor amenities in the new houses (water, electricity, and wiring) [65,80]. Most of the residents did not know how they would earn a living in a new environment because they had fewer business opportunities [66]. The Solotvyno residents are entrepreneurs and would like to live in a place that demonstrates a business case for earning sufficient income. Tereblya village did not seem to present such an opportunity [65]. Solotvyno is a border town, and thus most of the resident’s livelihood is based on the cross-border trade opportunities [66]. Tereblya is not a border town, with no income opportunities for cross-border traders. Also, with the collapse of the mines, salt lakes were formed that have been a significant source of income for the Solotvyno residents during the summer seasons [58,59]. This opportunity is not available in Tereblya [81].
Solotvyno is a complex socio-technical system because it consists of multiple nationalities, languages, and religions. Moving to Tereblya village would mean moving to an environment where only Ukrainians reside [58]. The school constructed did not take account of the complexity of Solotvyno town nor reflect the village diversity. Solotvyno consists of diverse backgrounds, cultures, religions, and languages, and multiple schooling systems (Hungarian, Romanian, and Ukrainian schools) with different languages of instruction. The construction of one school in Tereblya took no consideration of the existing social dynamics and complexity [77,78]. Religious multiplicity was also not addressed. Most of the Solotvyno inhabitants are highly religious. They were not sure which sacred places they would join in Tereblya village. Even though Solovyno is a small town, it has numerous opportunities for the multi-religious community [65].

3.4.3. Liquidation of the PJSC “Girhimprom” (Mining Company)

In addition to the relocation challenge, Solotvyno is facing a prolonged liquidation process. The process of liquidation and restoration of the mines stalled due to lack of funds and changes in prices that need to be adjusted. The State Enterprise Solerudlikvidacija is the company mandated to undertake liquidation of the mines, under the leadership of the Ministry of Agrarian Policy and Food. The State Enterprise Solerudlikvidacija does not have the money to remove the objects (mining shafts and other mining objects) [58,68,75,76].
In the meantime, PJSC “Girhimprom” (Mining Company under liquidation) is still operational, though mining has stopped. PJSC “Girhimprom” (Mining Company under liquidation) license for the business community to pump the brine from the salt lakes is still valid. Also, a 20-year license has been issued to construct a Speleocenter in Solotvyno by the Solotvyno Spa Speleocenter. Under the permit, Solotvyno Spa Speleocenter has undertaken to restore the environment and stop the further degradation of the land around the mines [82].
The field assessment conducted on 10 August 2018, concluded that the salt mine area is further deteriorating, in comparison to the EUCPM Advisory Mission in 2016 observations and the subsequent Risk Assessment report. The mission team noted that the salt lakes had become larger and steeper. There was also further subsidence of the land around the mines [81].

4. The Methodology: Solotvyno Participatory GIS and CS

4.1. High-Level Requirements for Risk Mapping and CS

We derived the high-level requirements for PGIS and CS from Principle 10 of the Rio Declaration on Environment and Development [31], Aarhus convention (UNECE 1998) [32,33,34], and the SENDAI Framework priorities and global targets. As noted earlier, the three pillars enshrined in Principle 10 of the Rio Declaration on Environment and Development [31], and Aarhus convention (UNECE 1998) [32,33,34] emphasize the need to ensure that citizens:
  • have access to environmental information (priority 1 and 2 of the SENDAI Framework);
  • can participate in decision-making (priority 1, 2 and 3 of the SENDAI Framework); and
  • have access to environmental justice (priority 2 of the SENDAI Framework).
Environmental justice refers to the ability to seek redress for an infringement of a citizen’s ecological rights. During the mission to Solotvyno in August 2018, we interviewed a father and son in Solotvyno living near the sinkholes, on Solna street. According to previous maps, that were used to determine the 133 families targeted for relocation to Tereblya, this father and son’s home was not identified to be in the high-risk zone. However, after a short while, their houses were severely deformed. They sought redress from the local, district, and regional administration, only to be disappointed. Everyone referred them to the Ministry of Agrarian Policy and Food. The Ministry of Agrarian Policy and Food is based in Kiev, Ukraine and it would take 12–18 h by train. Also, they would not know whom to contact in the Ministry, because the Ministry is big and deals with many matters. Finally, the father and son gave up their search for environmental justice for the severe house deformations [79]. The CS platform will not only focus on providing citizens with the information they need to make informed decisions but will also create a “One-Stop-Shop” where citizens can easily contact the responsible authorities and seek environmental justice or reparations for the damages suffered as a result of ecological actions of the respective institution. The CS will also support governmental actions by making all the information public and open to avoid the previous instances of double or triple reparations for the same damage. Moreover, within the CS, there will be environmental, civil society organizations who can advocate for policy reforms to improve and strengthen disaster risk governance [83].
Furthermore, ecological justice claims require the citizens to be better prepared in problem framing and deriving joint solutions [84,85,86,87]. The CS platform will provide them with the participatory process of gathering evidence through PGIS and the mutual risk evaluation and collective decision-making [88].
The design of the methodology is based on the following SENDAI global targets:
  • Substantially reduce global disaster mortality by 2030—Disaster-based mortality is increasing as the buildings continue to be deformed, flooding is still in the mines, the land subsides. To substantially reduce mortality, the high-risk areas need to be identified as soon as possible through risk mapping and joint risk evaluation. After that, a decision needs to be made to treat the risks in cooperation with the community.
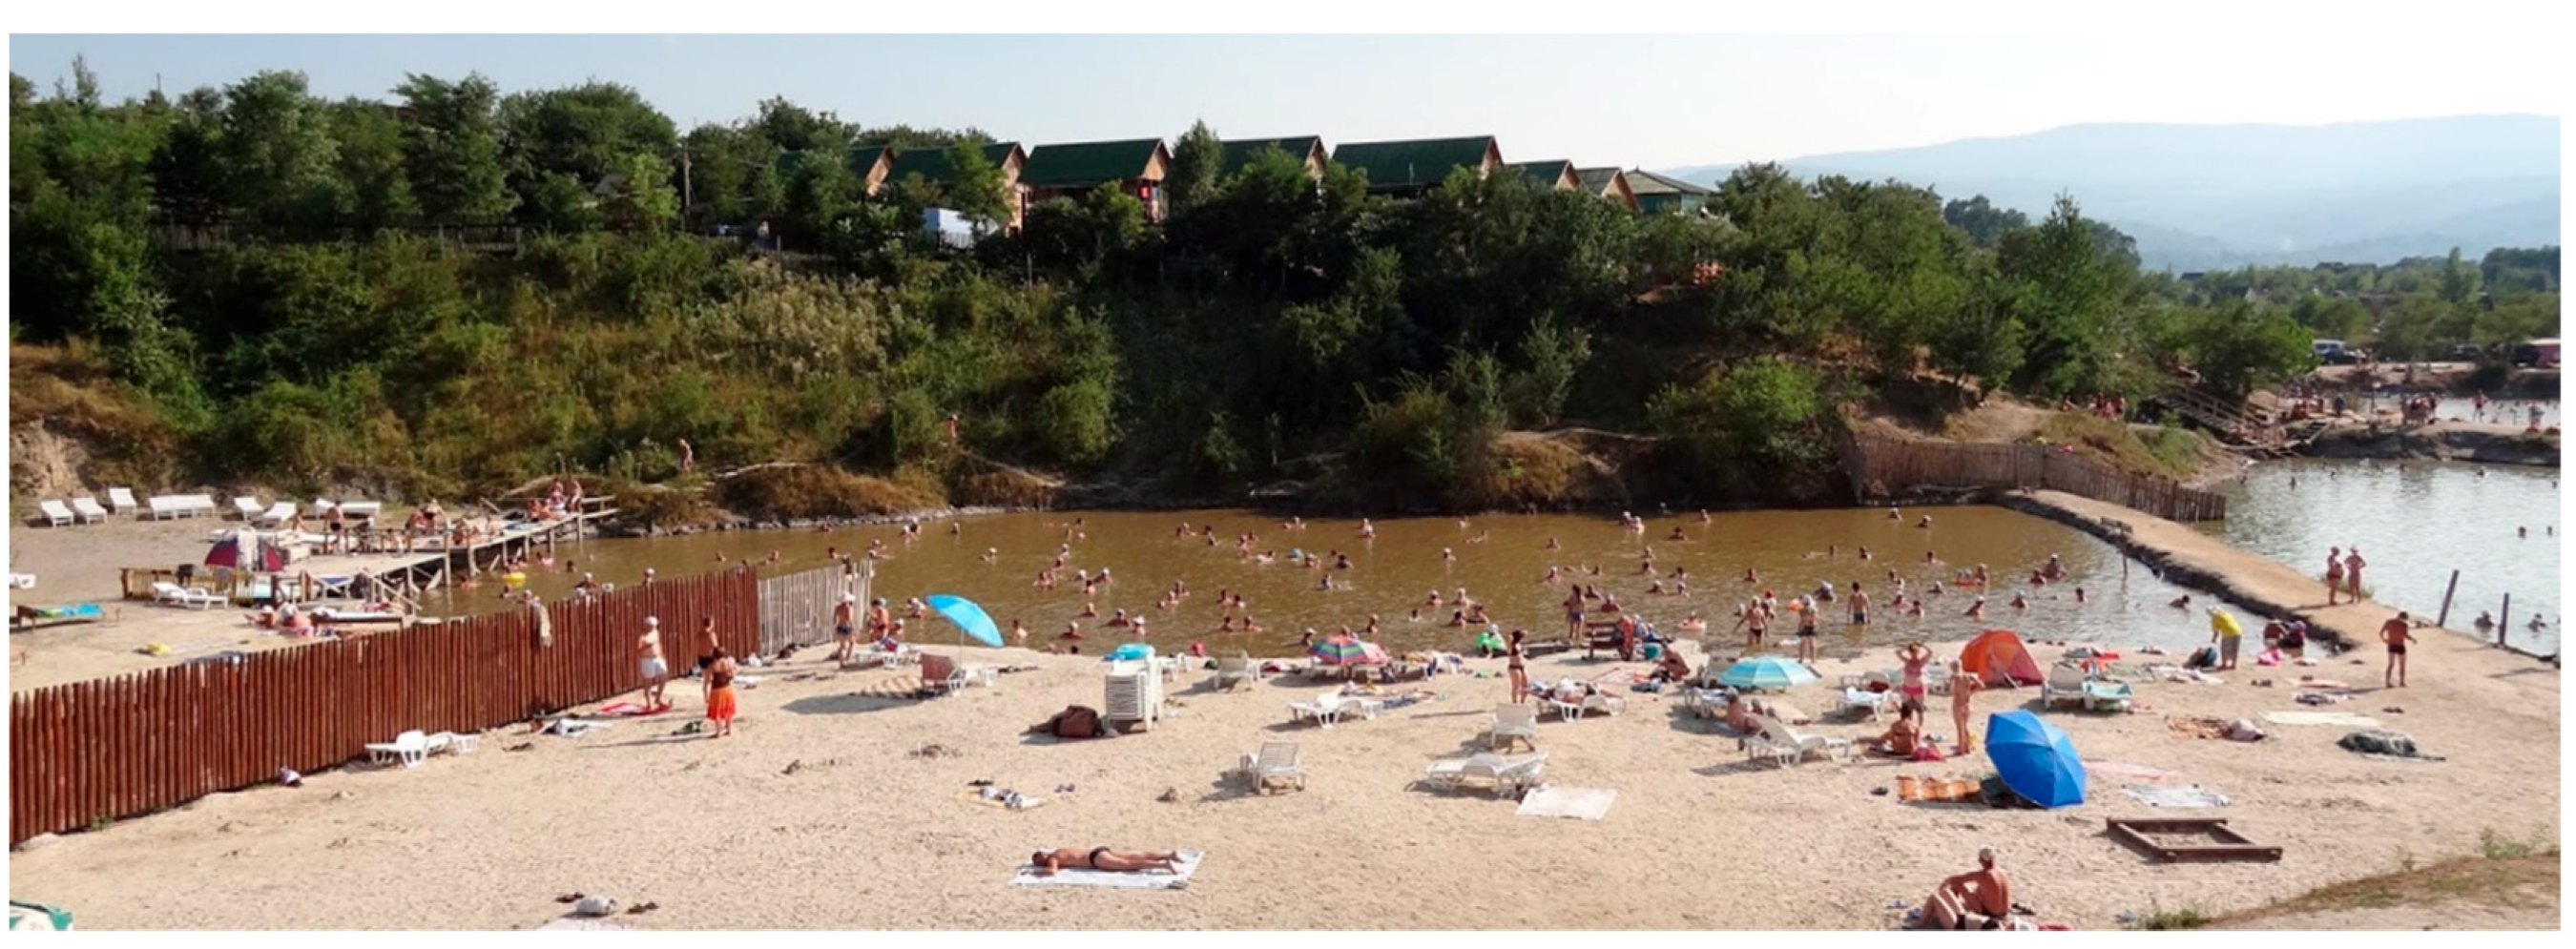
  • Substantially reduce the global number of affected persons by 2030—There are approximately 300 houses in Solotvyno. In every home, there are about four persons. Therefore, 1200 persons may be in danger. Also, during the summer holidays, the number drastically increases due to the significant number of tourists living in the recreation centers and people’s homes. The risk maps should indicate the persons at risk. The risk evaluation approach should zone the different areas in the village based on the level of risk. The joint decision-making approach should enable the various stakeholders to make collective decisions aimed at substantially reducing the number of affected persons.
  • Substantially reduce direct disaster-induced economic loss about the global gross domestic product (GDP) by 2030—If all the 300 homes, offices, and the recreation center are at risk then the economic losses to the community, businesses, and local administration are enormous. There are many other direct losses (jobs, income from the mines, income from the hospitals, income from the recreation centers and many other forms of economic losses). The CS should facilitate the joint evaluation of these risks and the development of collective action plans and investment matrix to substantially reduce the disaster-induced financial losses.
  • Substantially reduce critical infrastructure disaster-induced damage and the disruption of essential services, among them health and educational facilities—Hospitals, schools, engineering systems, and water supply systems may be destroyed, deformed, and be more unstable. The CS should facilitate the joint evaluation of these risks and the development of collective action plans and investment matrix to substantially reduce disaster-induced damage to critical infrastructure and disruption of essential services, including health and educational facilities.

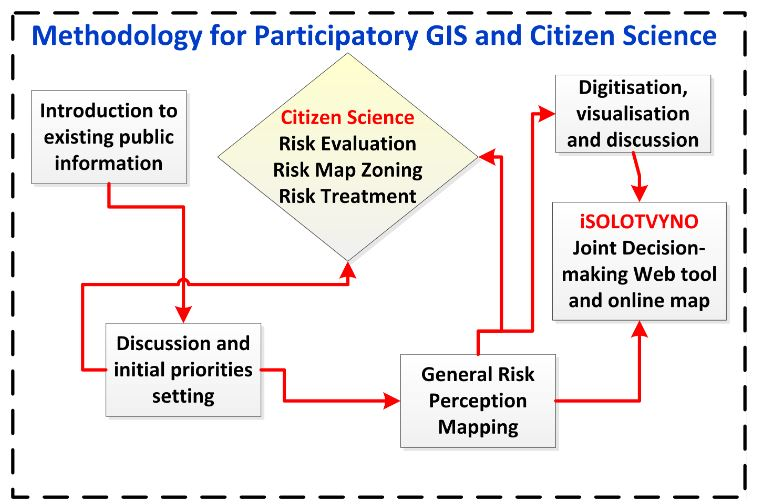
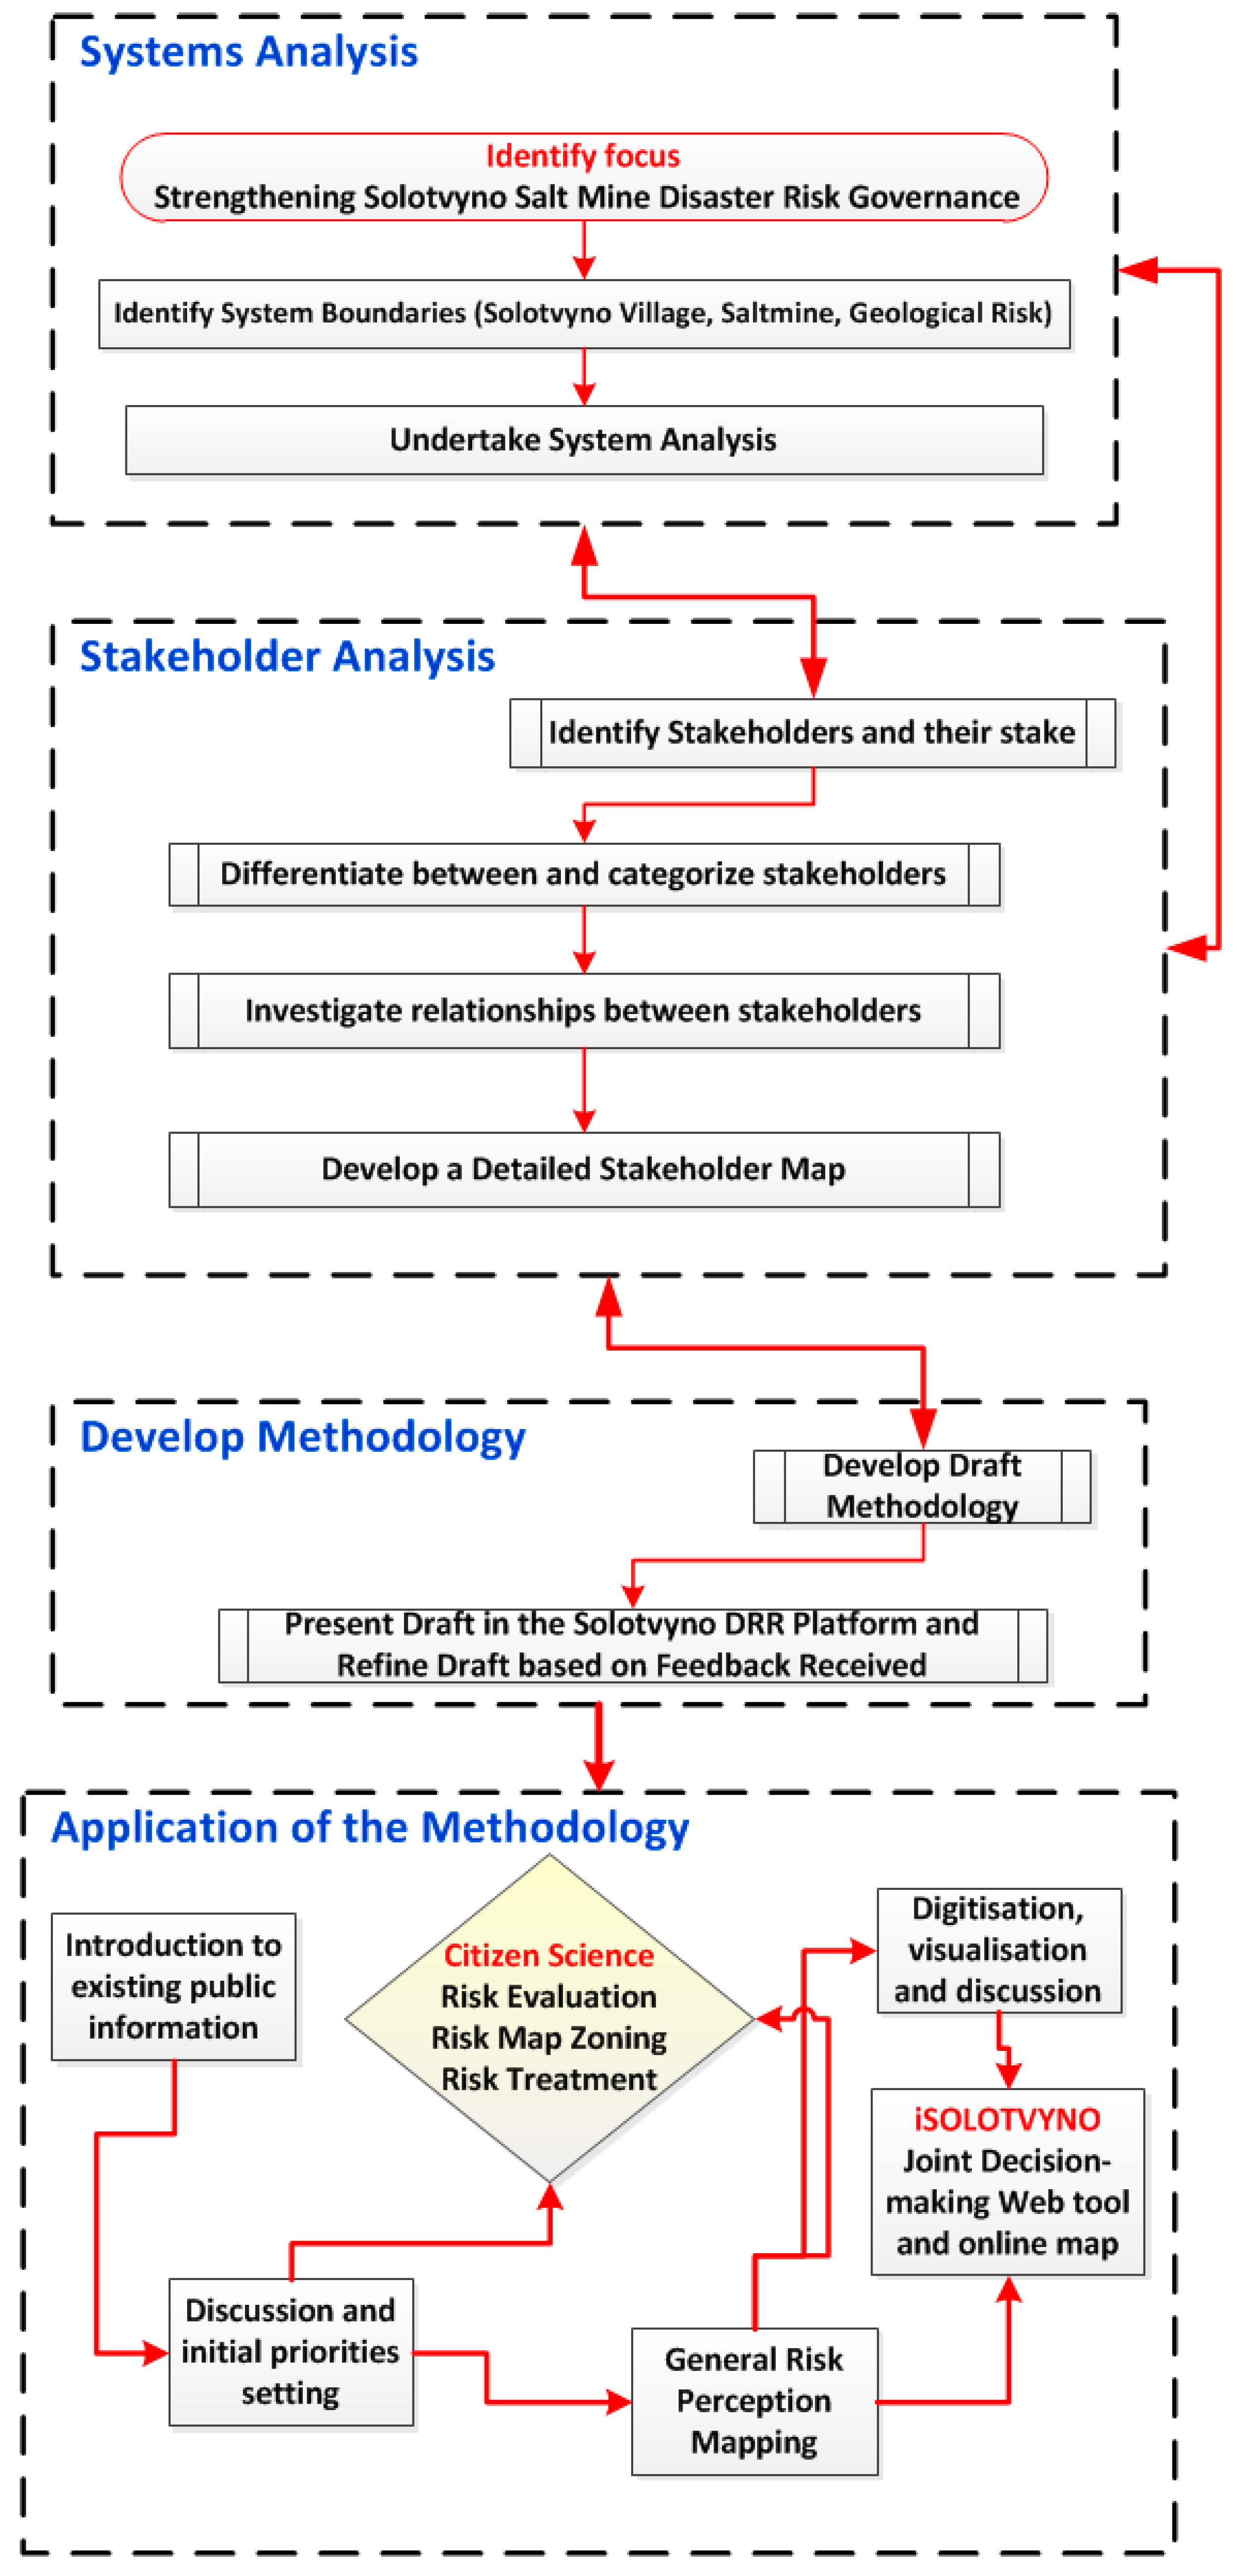
4.2. Schematic Representation of the Methodology

We developed the current methodology based on interviews conducted in Kiev, Uzhhorod, and Solotvyno on Monday, 16 July 2018, to Friday, 10 August 2018, under the ImProDiReT project (Appendix B). This methodology will guide the environmental justice process and the design of a platform known as iSOLOTVYNO, for the Solotvyno municipality. The objective of iSOLOTVYNO is to facilitate the development of a common understanding of the geological risks and the local environmental justice issues related to the salt mines and provide support in the development of a local action plan and investment matrix. Two methodological frameworks guided the development of the methodology (Figure 4). First, the Reed (2009) schematic representation of the critical steps for stakeholder analysis [54], (p. 1947). The socio-technical system in Solotvyno is complex. There is a need for a thorough stakeholder analysis to be able to develop a more detailed map to support the CS and PGIS work. Second, Haklay (2018, p. 3) has developed a methodology used for PGIS and CS [41]. We adopted the methodology with a few adjustments because it is relevant to the current project. The focus of the methodology is to develop a PGIS and CS platform that would enhance local capacity to understand better the risks they face, avail relevant information in a format they comprehend, and help prepare them to communicate and seek solutions for the environmental justice issues affecting them.
The methodology entails three significant phases (Figure 4). First, we will analyze the Solotvyno socio-technical system to guide the design of the platform. Second, we will conduct a detailed stakeholder analysis. Finally, we will implement a six-step methodology to implement PGIS and CS in Solotvyno.

4.3. System Analysis

Systems analysis is essential for the design of the PGIS and CS online joint decision-making web tool. The objective of the study is to ensure that there is a match between the analysis and the subsequent design. We would like to avoid mismatches that would affect the quality of the design and lead to failure.
We will use the structured development technique to ensure that various software developers have sufficient knowledge of the system under analysis regarding inputs, functions, processes, and outputs. All developers of the PGIS and CS system will use the same terminology to facilitate the eventual development of a coherent toolbox for the joint decision-making platform. The structured development systems technique will help to streamline the inputs, processes, functions, and outputs of all the ImProDiReT developers.
During the systems analysis process, emphasis will be placed on the requirements analysis, because it is a critical stage in the development of an information system. The design of the online platform will be based on the initial requirements elicitation outputs and refined through an iterative process. The system analysis will adopt the requirements-driven information systems engineering approach, selected in the Tropos project [89]. The methodology comprises of four phases:
  • Early requirements elicitation. This stage has already begun and scheduled for conclusion during the first DRR platform meeting. In this step, the designers seek to understand the problem and understand the institutional set-up. At the end of this phase, there will be a problem and institutional analysis which will include the actors who are relevant to the Solotvyno salt mine project, their respective goals, and interdependencies. Implementation of this phase is in tandem with the detailed stakeholder analysis for Solotvyno municipality.
  • Late requirements elicitation. The second phase will involve the initial visioning of the “system-to-be.” The description will be specific to the Solotvyno operational environment and include the qualities of the system and its requirements.
  • Prototype design. In this phase, we will define the system’s architecture in the form of a prototype. We will present the prototype to the stakeholders during the Solotvyno DRR platform meetings.
  • Detailed design. The detailed design of the joint online decision-making will take place in the final phase.
The detailed design will be presented in the final integration workshop (4th DRR Platform meeting) and applied to the local context. The results of its application will be discussed, evaluated and, if needed, refined. Once verified, the approach will be combined and integrated into a roadmap tailored to the Solotvyno case.

4.4. Stakeholder Analysis

Based on the initial systems analysis that establishes the problem, the focus, and the system boundaries, the second phase is to undertake a detailed stakeholder analysis. The term stakeholder, for purposes of the analysis refers to people or groups of persons with a direct interest in the Solotvyno salt mine (have stakes) and also those may have or not have a direct interest but have the power to influence the decisions regarding the present condition and future of the mining area. The analysis will also assess the interactions between the stakeholders and possible opportunities for joint actions and decision-making.
We conducted the initial stakeholder mapping at the start of the ImProDiReT project. However, after the interviews, it became evident that some of the key stakeholders were not included in the list (for instance three new companies with 20-year licenses to mine in Solotvyno and their supporting institutions—actual mining companies and research institutions). Also, the initial scoping did not identify stakeholder stakes, differentiate between the categories of stakeholders, nor assess the power relationships. Therefore, the Reed (2009) approach will be used to improve the current stakeholder map for Solotvyno.
Due to budgetary constraints, part of the stakeholder analysis will adopt semi-participatory approaches [90,91,92]. To categorize the stakeholders and understand their inter-relationships, we will triangulate using literature review, focus groups, semi-structured interviews, and snowball sampling approaches. Literature review and the semi-structured interviews have already been conducted. We chose to use simpler methods because of the language complexities in the target population, the purpose of the analysis, and the skills and resources available. Specialist methodologies (for instance Social Network Analysis and Q methodology), are not appropriate because the number of stakeholders is not significant and implementation of specialist methodologies might be cumbersome and time-consuming.

4.5. Six-Step Methodology for Participatory GIS Risk Mapping and Citizen Science

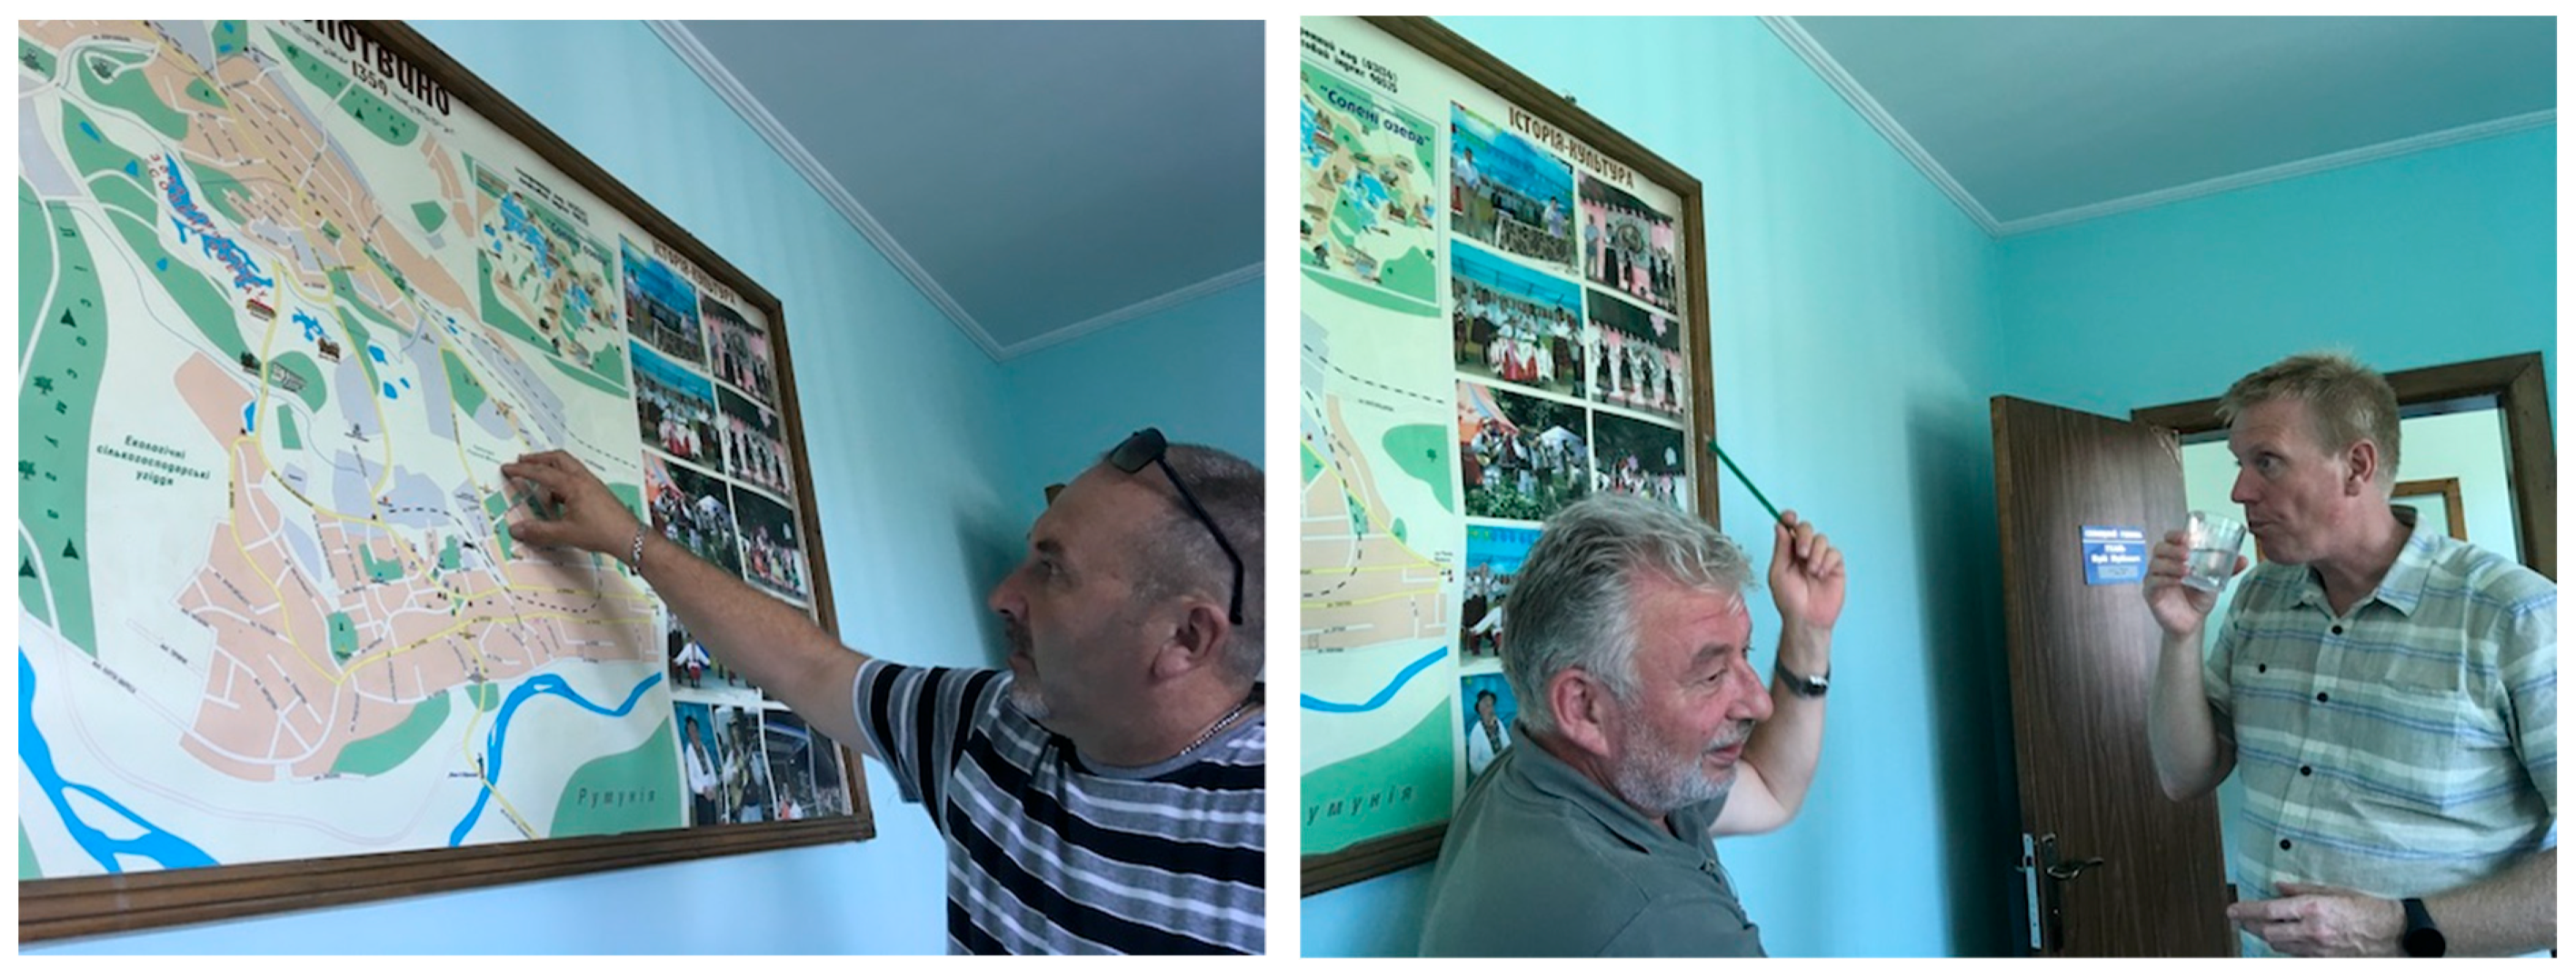
4.5.1. Introduction to Existing Public Information

As described earlier, the methodology for PGIS and CS involves six steps, which are iterative and flexible. The main focus of step 1 is to introduce the community to the existing hazard and risk maps and discuss with the community what the risk maps mean, in their particular circumstance.
We will undertake step 1 at a convenient time for the community when all the interested members of the community are available. Since the collapse of the mine, most of the men left the village in search of work and typically come back during the summer holidays when there is work in the town. Also, the recreation centers may be fully operational during the summer season and dormant in the winter season. However, during the summer season, some of the key policymakers in Kiev are on holiday. Therefore, the timing for this activity is vital to ensure that the process facilitator contacts all the interested members of Solotvyno community.
This initial meeting should be inclusive and ensure representation of all the interested groups. Most importantly, the meeting should be in Solotvyno, not Kiev (capital city) nor Uzhhorod (Transcarpathia regional center). The initial meeting should happen in the study area to enable all the interested parties and the parties who have the power to influence decisions to understand the context and visit the mining area.
Before this first meeting, all open data and open access information that is relevant to the Solotvyno salt mine case will be compiled and made available through an online portal. The data includes information from the previous geological studies carried out by various institutes in Kiev and Lviv [82]. The list of data will include publicly available maps and relevant policy information from the:
  • Solotvyno municipality;
  • State Emergency Services, the Tyachiv District State Administration;
  • Regional State Administration of Transcarpathia;
  • PJSC “Girhimprom” (Mining Company under liquidation); and
  • Solotvyno Spa Speleocenter (the new company with a 20-year license).
We will present the information at the start of the implementation process because of two reasons. First, to disseminate available information expressed in the language that a majority of the community understand. Most of this information is scattered, with minimal outreach attempts to the affected population (demand driven information). The Solotvyno community is not aware of the existence of previous research work and risk maps developed for their use [77]. Most of the information is produced to address a particular institutional need or fulfill budgetary or project requirements (supply driven information). This information needs to be repackaged and made accessible for the community in one place. With the click of one button, they would be able to access all information relating to the Solotvyno salt mine which is regarded to be in the public domain (open data, access, science, and education).
Second, we will develop leaflets for the public that identify and explore the critical environmental issues that the Solotvyno public face. The brochure should be neutral. It should scientifically present the facts openly while providing sufficient flexibility for the stakeholders to decide their futures based on the information. At this stage, we will avoid preconceived ideas about the Solotvyno problem and the possible solution, as discussed in Haklay (2018). The ImProDiReT project should not be presented as a ‘fait accompli,’ because it defeats the purpose of developing a joint-decision making platform, where the stakeholders and not external actors, can make the decisions. To avoid presenting a ‘fait accompli’, step 1 should present a portfolio of all the available and relevant information and a list of issues to stimulate discussions. The importance of the community controlling the decision-making process will be emphasized during the implementation of Step 1.

4.5.2. Discussion and Initial Priorities Setting

The second step is a facilitated meeting to discuss the already concluded risk maps developed in the first phases of the ImProDiReT project and set priorities. Many issues surround the Solotvyno salt mine. There is the: stalled liquidation process; the restoration of the mines; the relocation of ‘at high risk’ citizens; the weak risk governance system; the land use planning system; the licensing of companies to conduct activities that have an impact on the environment; waste management; salination of the Tisza river and the trans-boundary issues associated with it; the pumping of salt water from the salt lakes; and investment opportunities in Solotvyno to mention a few. Therefore, there is a need to set priorities and arrive at joint agreements on the project focus areas. The risk maps will provide the necessary information to guide the discussions. However, the decisions on what priorities to focus on have to be made jointly with the stakeholders.
The output of step 2 will be an agreement on what to focus on in the ImProDiReT project and also an agreement on how to visualize the community map. Based on the initial map, there will be discussions on what to include and how to include it. In this meeting, the community will have access to both the digital and paper maps. The paper maps will be for the members of the community who are not conversant with the use of the digital maps.
If the community agrees to add more components to the existing risk maps, then the community should agree on how to collectively gather the data to populate the map, during the project period and after project closure. This additional information, not available in GIS maps, is essential for solidifying their positions in preparation for discussions with the decision makers and public authorities. Additional dialogues can center around the data collection protocol, collating the data, and how the data will be analyzed and visualized.
The protocol will take account of the following:
  • Establish a balance between robust data collection protocols that require consistency and systematic collection of data to less stringent approaches that other scientists may reject as ‘anecdotal’ [41];
  • Availability of smartphones and internet connection (internet connectivity in Solotvyno is weak, and there is a need for further analysis of the access to smartphones);
  • Age dynamics (most of the young people leave Solotvyno for schooling and work and come back during the holidays);
  • Population dynamics and demographics;
  • Working hour dynamics (after the closure of the mine the available work is mainly cross-border trade with irregular work hours); and
  • Integration of the PGIS maps into the official risk map. Assess whether the instruments and methods used to produce the official GIS risk map can also be used for the PGIS maps.

4.5.3. General Risk Perception Mapping

The community-based mapping of risk perceptions is in Step 3. For this step, we will use paper maps. The first action in this step is to distribute the paper maps to all the 300 households in Solotvyno community and inform them of the upcoming risk perception mapping. After that, community volunteers will contact their neighbors and while looking at the map (Figure 5), ask them questions regarding:
  • the history of Solotvyno and the salt mines (for the elderly and the miners);
  • the memories they have when the town was at the center Solovyno and the successive changes over the years;
  • the memories they had when the mine was operational and upon its closure; and
  • the feelings they have about particular places—Mine 7, 8, 9, 10, the river, the mountains, and the recreation center (dangerous, safe, moderately safe, unpleasant).
The volunteers will receive administrative access to an online shared community map where they will be able to digitize the information [41,93,94].

4.5.4. Digitization, Visualization, and Discussion

We will digitize, analyze, and with the use of GIS software, make the available data visual in Step 5. We will discuss with the community whether they would like the data online as open data. Based on previous similar environmental projects, some communities would not wish to share the information until the conclusion of the process, especially if they fear negative repercussions when the information is available to certain authorities as an early stage of the PGIS [41]. Haklay (2018) proposes either a password-protected website or localized GIS in circumstances where the community does not wish their information to be shared openly.

4.5.5. Citizen Science (Risk Evaluation, Risk Map Zoning, and Risk Treatment)

Alternatively, we will facilitate perception mapping through the CS platform (step 4). We conducted initial perception mapping in August 2018, through semi-structured interviews. However, at this stage, the risk maps were not concluded. Therefore, the discussions were very general. A key finding of the initial deliberations was that three successful businesses in the recreation center stated that they perceive the recreation area to be extremely safe. The former miners reported that they consider the places above the mines that had sizable chambers to be extremely unsafe and the unexploited regions to be safe [61]. One of the companies that recently received a license to establish a Solotvyno Spa Speleocenter stated that they see many investment opportunities in Solotvyno and the mines can be reclaimed and made profitable [82]. The second stage of the perception mapping is after the conclusion of the risk maps.
Based on the interviews, it emerged that decisions need to be made on relocation, liquidation, risk mitigation, and whether to continue investments in the area. Regarding relocation, the first decision is determining the high-risk zones that require immediate relocation. There is a need to decide whether the community should be compensated or relocated to a safe place. Based on the interviews with the various stakeholders, if relocation is the solution, then the following requirements should be incorporated in the joint decision-making model for relocation:
  • Distance from Solotvyno;
  • Livelihood and opportunities to exercise their entrepreneurship skills;
  • Ownership rights to the new property;
  • Building requirements that reflect the culture-diverse community in Solotvyno;
  • School and religious institutions that take account of the diversity in the village;
  • Livable houses with water, electricity, and up-to-standard wiring;
  • Demographics and age dynamics—old people may not be able and willing to relocate.
Concerning liquidation, the most urgent decisions are expediting the stalled liquidation process and removal of the objects. Urgent decisions are required on treating the high-risk zones to slow down the subsidence process and the quick sealing of the leaking sewerage system.
Regarding investments, there are two main issues to be considered, the current businesses at the recreation center and the future investments in open mining. Decisions on whether these two investment trajectories are sustainable within the current context and in the future need to be made. These decisions include whether to allow businesses to operate and continue to extract the salt water from the salt lakes. If yes, how can this be monitored and controlled? Finally, a strategic decision on whether there is a business case for the three new mining companies that have been issued 20-year licenses and the impact of their planned actions on the geological risk.
We will combine risk perception mapping with a community-based risk evaluation and zoning. Based on the risk maps, the community would evaluate the risks and zone the different areas that require:
  • Risk avoidance;
  • Risk mitigation or reduction of the likelihood of the land subsidence and collapse event or its consequences;
  • Risk transfer to a third party like the Ministry of Agrarian Policy and Food.
  • Risk acceptance when the government or the responsible authorities have addressed all the adequate controls. However, it is essential to explain to the Solotvyno community that health and safety risks require a higher standard of controls. Risk acceptance is an option if everything possible to reduce the chance of risk occurrence has been done. Before accepting a risk, it is vital to ensure that sufficient controls are in place.

4.5.6. iSOLOTVYNO (Joint Decision-Making Web Tool and Online Map)

This stage is only relevant if the Solotvyno community agrees to share the information online. iSOLOTVYNO will be an online platform where the joint decision-making web tool and the online map can be accessed. The community will update the online risk map. It will form the basis for further deliberations and the subsequent development of a community-based action plan and investment matrix. The decision-making process in iSOLOTVYNO will include, whether to:
  • Eliminate all geological hazards as much as possible;
  • If they cannot eliminate, then substitute them with something less hazardous/dangerous; to reduce the risks;
  • If they cannot substitute, then engineer a solution to protect the community in Solotvyno;
  • If they cannot engineer a solution, then isolate it—stop people from getting near the high-risk zones;
  • If they cannot isolate, then administer it through policies and administrative processes on how to manage the hazard. At this stage, the decision-makers will be getting to the dangerous part, where they have to rely on people to protect themselves. Administering risks increases risk exposure and vulnerability.
  • If they cannot administer, ask the citizens to wear some personal protective equipment (PPE). PPE might not be relevant depending of the nature of the risk.
The six-step design process is iterative and flexible; it is not a simple design process. However, it is responsive to the needs of the community, enabling changes and adaptation to ensure that the final product follows the EU principles of responsible research and innovation. The underlying principle of the methodology is to ensure that the community co-design the PGIS and iSOLOTVYNO and co-determine the process and the products [42].

5. Case Studies, Opportunities, and Limitations of the Proposed Methodology

5.1. Case Studies

Several case studies have used the proposed methodology. We will describe two such case studies; the first was in London, United Kingdom and the second in Pampulha, Belo Horizonte, Brazil. Haklay et al. (2018) describe the first case study on noise pollution mapping survey in Pepsy Estate (Lewisham, London) [41], (pp. 8–9). The details of the case study are as follows:
  • System Analysis and Problem Identification: Noise pollution (grinding and banging) by a recycling scrapyard within a neighborhood classified to contain 20% of the poorest in England. The scrapyard is located near a residential area with a nursery and a primary school.
  • Stakeholder Analysis: Residents felt disempowered because their numerous complaints were unanswered. The local government felt disempowered because the scrapyard was a recycling facility which could only be regulated by the Environmental Agency (central government).
  • Step 1: Participatory collection of existing information regarding the issue.
  • Step 2: Identifying noise pollution as the key priority and an agreement on the kind of data to be collected and a data collection protocol.
  • Step 3: Perception mapping of the citizen’s daily experiences with the noise nuisance.
  • Step 4: Data gathering using Class 2 Noise Meters in early 2008 (for more than eight weeks) through a comprehensive survey to map the noise pollution. There were more than one thousand individual readings from the area citizens on the dBA sounds and their perceptions of the noise (how it affected them). The data sheets were circulated and filled forms were collected on a weekly basis. Feedback was provided on the quality of the data and the areas that needed improvement.
  • Step 5: GIS software was utilized to produce noise pollution maps. The qualitative information on perceptions and the impact of the noise was digitized and visualized using graphs and charts. The noise pollution mapping was grouped under: extremely loud, very loud, and loud. Based on the visualized data, the noise pollution affected the Pepsy Estate residents living up to 350 m from the recycling scrapyard, thus reducing their quality of life.
  • Step 6: A public community forum was held where the community presented their findings to the Environmental Agency and the Lewisham Council. The meeting led to further investigations by the Environmental Agency and increased scrapyard regulation to minimize the nuisance.
Zyngier et al. (2016) describe the second case study on the use of the Geodesign Hub to map and visualize proposed urbanization and dynamic transformations in Pampulha (UNESCO World Heritage site, Belo Horizonte, Brazil) [95]. The details of the case study are as follows:
  • System Analysis and Problem Identification: The need to balance socio-economic needs, urbanization pressures, and environmental conservation and the preservation of a UNESCO World Heritage site due to Oscar Niemeyer’s architectural work.
  • Stakeholder Analysis: Competing socio-economic, cultural, and environmental interests coupled with increased population pressure. The pressure to urbanize the region with counter population, cultural, social, and environmental pressures.
  • Step 1: In August 2015, the first iteration meeting consisting of 21 multi-stakeholders from six interest groups was held to introduce the Geodesign architecture for Pampulha and to assess existing information on the area and its needs and dynamics. The meeting also determined the process of conducting the PGIS. The six interest groups were: residents, chamber of commerce, developers, green NGOs, cultural heritage interest groups, and the local public administration.
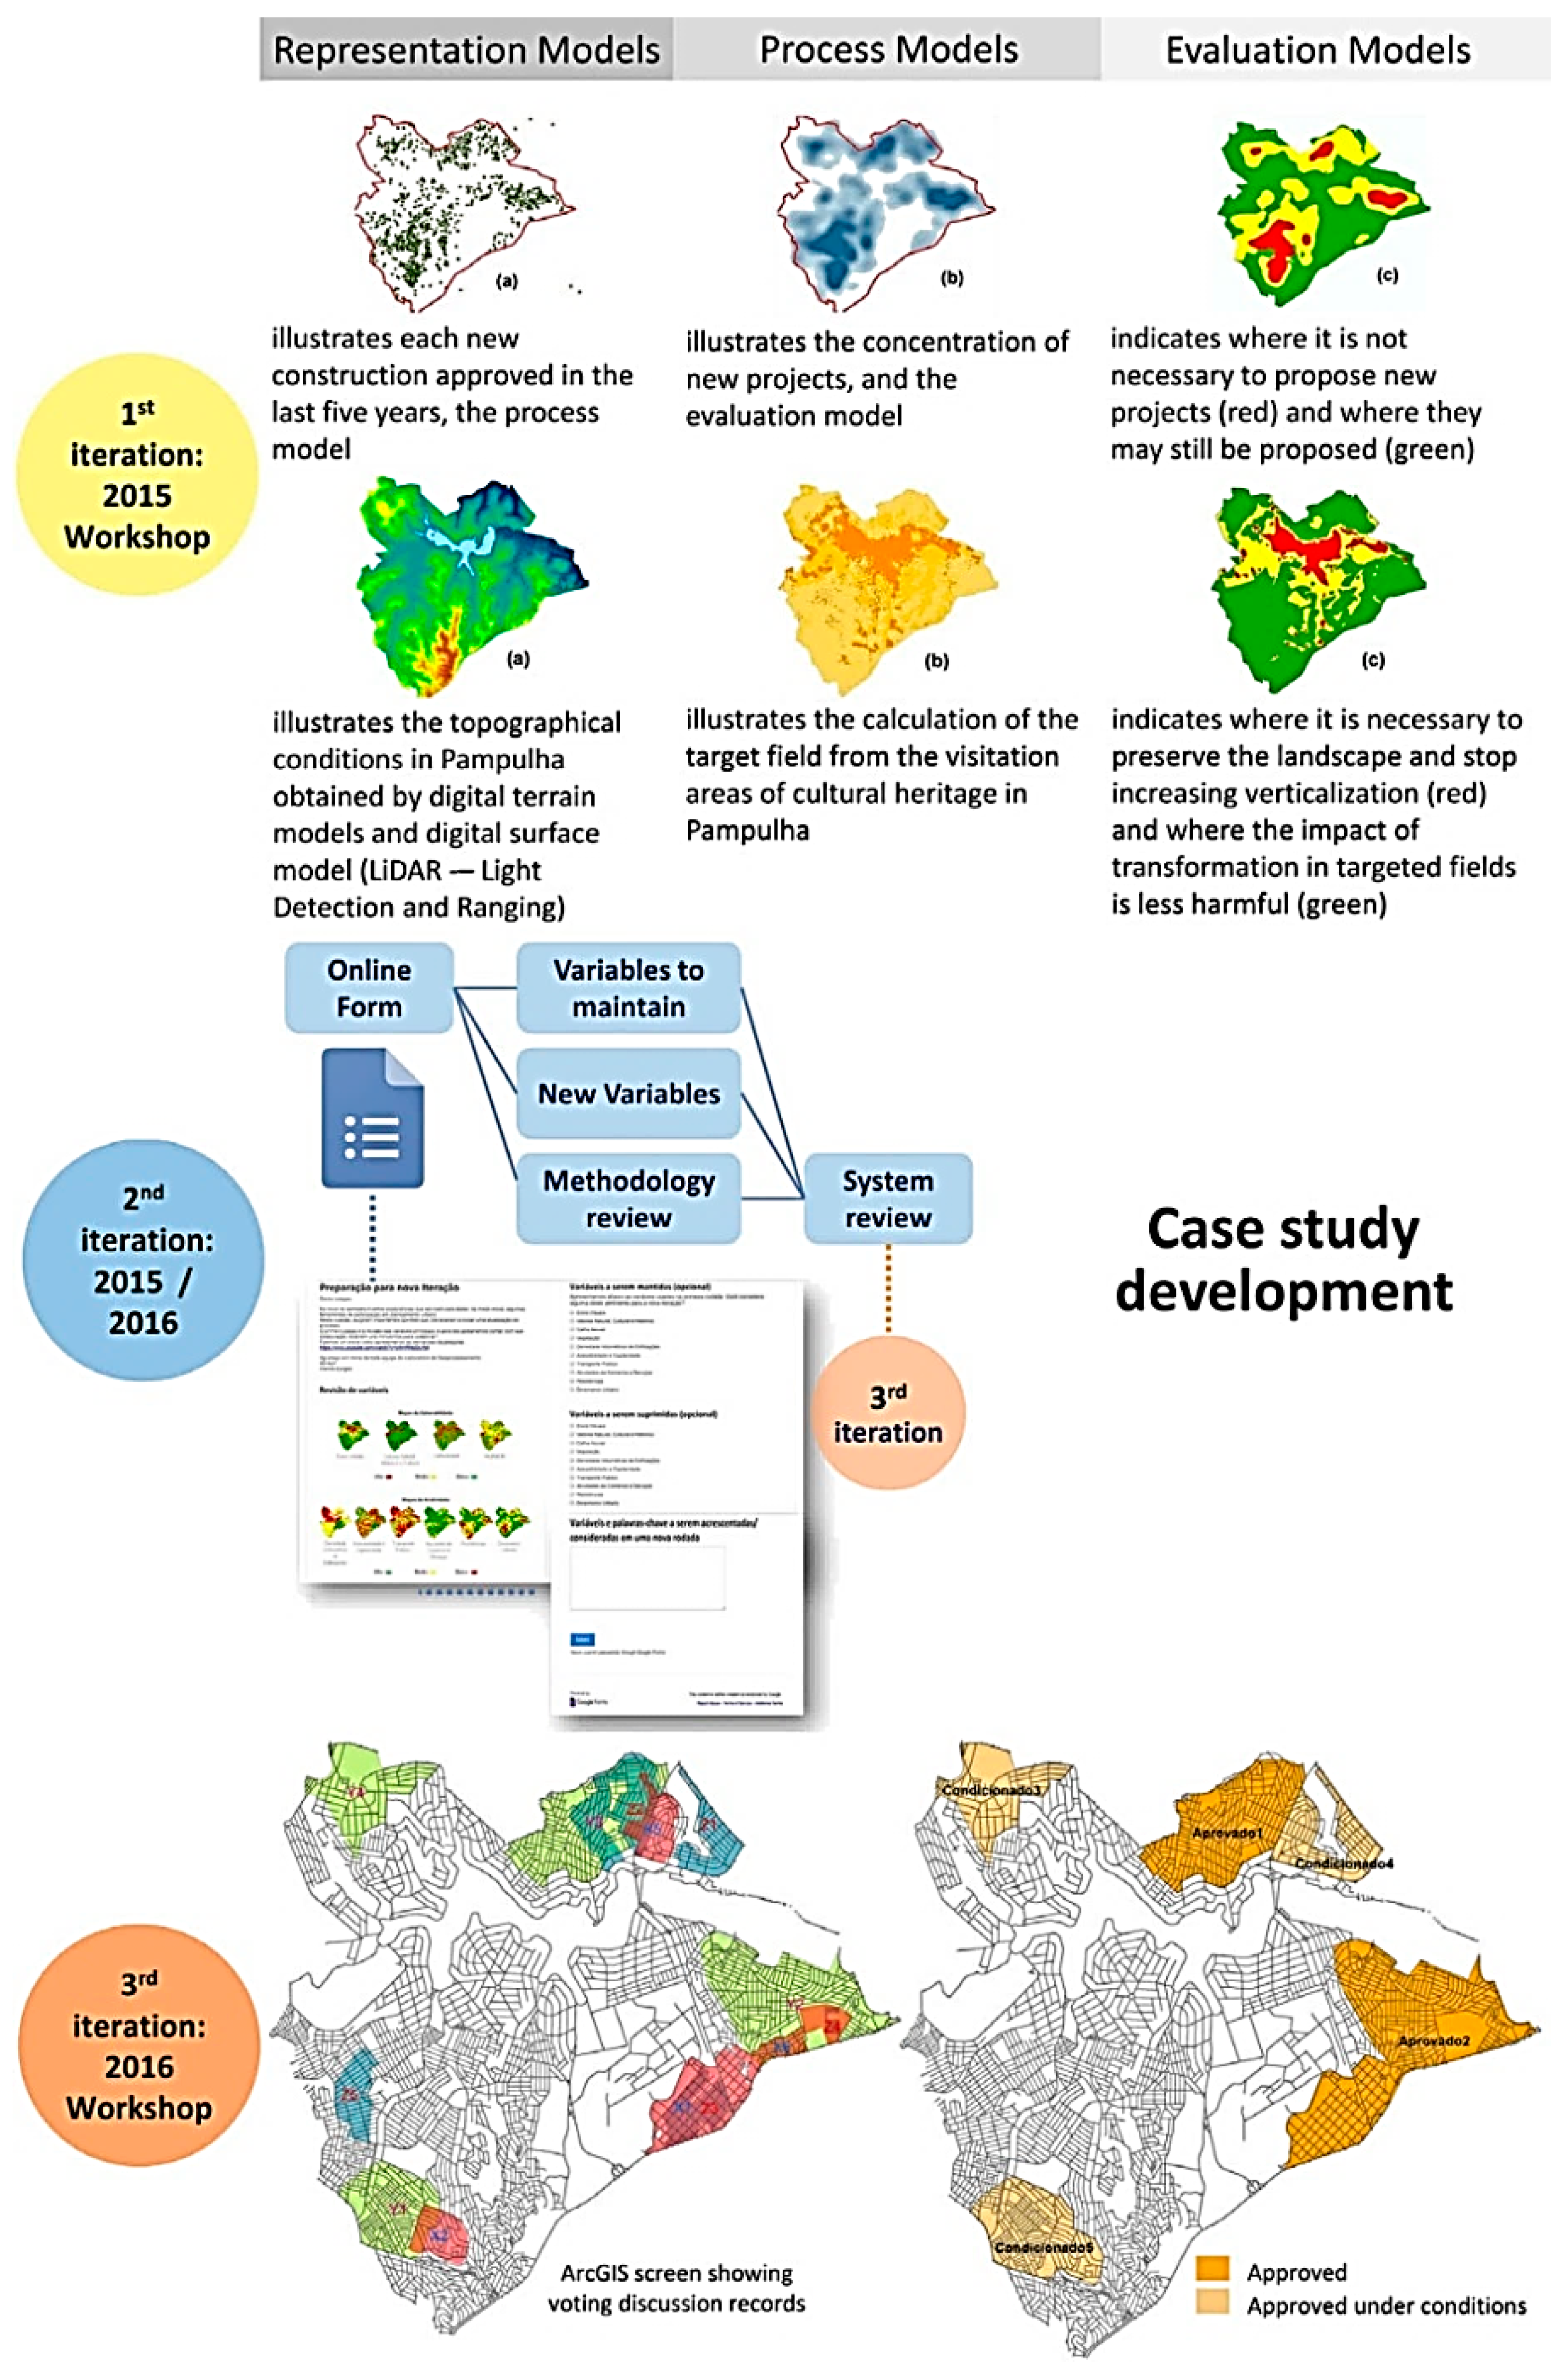
  • Step 2: Identifying the territory for the CS. The stakeholders decided that the area would be larger than the restricted zone (Niemeyer UNESCO World Heritage site). The PGIS covers the entire Pampulha Regional Administration. Later, under the 2nd iteration (see Figure 6), the citizens prioritized the system variables to be maintained, new variables that need to be introduced, and agreed on the methodology.
  • Step 3: In 2015 and 2016 there was a perception mapping by the 21 multi-stakeholders from six interest groups of the results of the 1st iteration through interviews, an online form, and video recording. The perception mapping focused on the customized Geodesign system review. One emerging issue was the introduction of new social variables and the deletion of some previous variables. The feedback received from the interviews was later sent to the design experts.
  • Step 4: In early 2016, data was collected on citizen opinions on increased occupation of public services, infrastructure, the distribution of socio-economic needs, and the empty spaces that are not occupied.
  • Step 5: ArcGIS software was utilized to produce land use base maps. The maps were visualized at three levels (representation, process, and evaluation). The exported data was visualized with histograms for 14 systems (Housing; Applied volumetric density; public transport; income; sanitary sewage; schools and health centers; urban dynamism/concentration of new constructions; commerce, industry and facilities; vegetation; surface water; predominantly empty areas; historical, cultural, and natural values; accessibility and capillarity and visual axis).
  • Step 6: The printed maps were distributed and the different groups provided input on where to densify in the Pampulha Regional Administration. The information was later exported into the digital maps. The group then went through a participatory process with the aim of reaching a consensus on one land use proposal for Pampulha.
A key lesson from the two case studies is the significance of the selected methodology in determining the success of the CS initiative. The methodology may determine whether the stakeholders will reach a consensus or not. In the two case studies, consensus was reached mainly because the stakeholders went through a targeted participatory process containing the three Principle 10 of the Rio Declaration pillars. All the case studies ensured that the citizens had access to the environmental information, then a PGIS and CS platform was created where the citizen could participate in GIS mapping and decision-making. Finally, the methodology ensured that citizens could access social/environmental justice.

5.2. Opportunities

The proposed methodology presents an opportunity for “doing science differently,… and helping to redefine what it means to be a scientist” [34]. For Ukraine, the approach presents an opportunity to resolve the current risk governance challenge, ensure that the geological risk is well managed and community vulnerability is reduced. The approach also introduces a new governance model where the citizens are at the center of the decision-making.
At the European Union level, the methodology may create the following opportunities:
  • Stimulation of trans-boundary and cross-sectoral co-creation initiatives;
  • Development of a European Union co-created and co-creation risk governance programme by benchmarking of successful CS initiatives in DRR;
  • Create an innovation lab by the full participation of citizens in the post-2020 EU R&I programme to increase demand for EU products and services;
  • Increase motivation of citizens to participate in CS through involving them in co-design and testing of proposed planned solutions;
  • Active citizen involvement in monitoring and evaluation;
  • Inform the use of social media for policy reforms, agenda setting, and provision of real-time recommendations and feedback; and
  • Encourage citizens to not only provide data but be the users of the data, through evidence-based policy and decision-making with the aim of producing new forms of partnerships (e.g., Projects for Policy (P4P)) [53], (p. 19).
The methodology also provides an opportunity to address the six main CS challenges, as stated in the Introduction. First, the methodology engages the citizens as co-creators, decision makers, monitors, and evaluators, to address the challenge of confining their role to data collection [36]. The citizens determine the requirements for the CS platform and PGIS mapping. After that, the citizens actively engage in data collection through an agreed data collection protocol. Afterward, the citizens use the input to zone the Solotvyno area and determine the high, medium, and low-risk zones. Finally, the citizens actively engage in the decision-making processes, monitoring, and evaluation. The citizens also regularly update the CS system.
The second challenge concerning data quality [43,44,45,46], will be resolved by developing a data collection protocol with the citizens and EO specialists to ensure that there is a balance between robust data collection and less rigorous approaches. The protocol will incorporate the following considerations: internet and phone availability, population, age, and work dynamics. Most importantly the protocol will ensure that the PGIS maps seamlessly integrate into the official Solotvyno map. The third challenge regarding data incompatibility [47,48] will be resolved by discussing the technical specifications of the PGIS and CS with the relevant EO scientists to ensure that the PGIS maps can easily integrate into the official Solotvyno map. The system analysis and the agreed data protocol will ensure seamless integration of the PGIS map and data. Facilitating co-creation of the PGIS maps provides an opportunity for increased citizen motivation and engagement [49,50]. The citizens will provide the requirements for the CS and PGIS, thus increase their motivation, thereby addressing the fifth challenge regarding sustainability issues (citizen retention and participation) [5,51]. We seek to address the final challenge regarding legal matters related to licensing, privacy, and ethical concerns [52] through the participatory all-inclusive co-creation process. As discussed earlier, the citizens will determine the level of privacy of the databases and other legal issues will be addressed through the participatory process.

5.3. Limitations

Notwithstanding the numerous opportunities discussed in Section 5.2, the methodology may face some limitations. Empowering citizens to take their rightful place in EO policymaking processes is challenging. In the case of Solotvyno, we foresee some limitations. First, the methodology proposes a change in the governance system from top-down to bottom-up. Governance changes call for a paradigm shift and a change in the current power distribution and dynamics. The methodology is supported by decentralized systems of governance where the allocation of resources is to the lowest competent governing authority. This change takes time and may involve power struggles between different stakeholders. Therefore, if the CS is perceived as a threat to power and a drastic departure from the status quo, it might not be supported by the powerful and influential stakeholders.
Second, the approach seeks to empower citizens with information and GIS-based tools that enable them to collect consistent data to seek environmental justice. The methodology requires a change in the mental models of both the governed and the government. The citizen mental model needs to shift from entirely disempowered towards using the available political space (no matter how small) to influence policy. On the other hand, the government needs to acknowledge the role of other stakeholders in decision-making. This change process may or may not occur.
Third, the methodology requires cooperation and trust between the various stakeholders. Cooperation can be achieved at the initial stages through power. However, a favorable environment should be created to nurture trust formation. The data collected by the citizens and the EO specialists is ordinarily sensitive information, and some level of trust would facilitate the data sharing process.
At the implementation level, we foresee some limitations as mentioned in the paper. There are too many competing interests and diverse risk perceptions that need to be managed. Also, there are practical challenges related to: internet and smartphone issues, legal issues related to privacy, and sustainability challenges after the project closure. All the foreseeable limitations have already been discussed, and steps have been taken to mitigate the risks and address the limitations.
The adopted methodology will be adjusted through successive iterations to address some of the foreseen limitations and ensure that the project objective is met and the CS platform is sustained long after project closure.

6. Conclusions

Expert-driven and community-driven approaches need to be integrated to develop holistic and effective DRR strategies. Experts provide domain-specific knowledge about hazards, risks, and their potential impact, along with potential solutions for addressing these issues. On the other hand, communities can provide a continuous stream of information regarding the risks as they evolve and change over time as input to the experts. Communities also play a critical role in the adoption and advocacy on the implementation of DRR measures. While this combination would provide both a comprehensive, in-depth, and broad sustainable approach to DRR strategy development, there are limited methodologies to guide the implementation of the CS approach.
In this paper, we design a methodology of participatory GIS risk mapping and CS for the Solotvyno salt mine in the Transcarpathia region in Ukraine. The methodology consists of three main parts: system analysis; stakeholder analysis; and a six-step methodology for participatory GIS and CS. The six-step methodology is iterative and flexible to allow for changes and improvements.
The initial step is the introduction of the existing information on the Solotvyno salt mine to all the relevant stakeholders during an initial meeting. This information will be collated beforehand and made available online before the initial meeting. The second step is a discussion of the Solotvyno risk maps developed in the first phases of the project with the community and setting priorities. The community at this stage will assess whether the maps are sufficient, additions/revisions needed, who should add/revise it and how. A critical tool that we will develop at this stage is the data collection protocol to ensure consistent and robust data collection in the right mode and taking into account age, population, work hours, and data integration dynamics. The third stage is general risk mapping. In this stage, paper maps will be distributed to all the households and volunteers will visit the households and conduct the risk perception mapping and record the information in a shared online community map. The fourth stage will be the digitization, visualization, and discussion with the community about the data sharing preferences (open or password protected until a particular stage). The fifth stage entails community risk evaluation, risk map zoning, and risk treatment. The community will decide whether to avoid, mitigate, transfer, or accept different risks. The final stage is the design, testing, and final launch of iSOLOTVYNO. iSOLOTVNO is the online joint decision-making tool and map. The iSOLOTVYNO decisions are whether to eliminate, substitute, engineer, isolate, or administer already identified geological hazards.
We will implement the methodology during the project’s lifespan of two years (1 March 2018 to 29 February 2020). This paper is an initial publication of the current ongoing research for the ImProDiReT project. Future research will focus on the implementation of the six-step methodology. The research will also be informed by the project-developed risk maps and the ongoing risk awareness processes, within and outside the ImProDiReT project.

Supplementary Materials

More information about the ImProDiReT project and additional materials are available in the Appendix A and on the project website: www.improdiret.eu.

Author Contributions

Conceptualization, A.M.O., K.M. and B.V.d.W.; Data curation, A.M.O.; Formal analysis, A.M.O. and K.M.; Funding acquisition, K.M. and B.V.d.W.; Investigation, A.M.O.; Methodology A.M.O. and K.M.; Project administration, K.M. and B.V.d.W.; Resources, B.V.d.W.; Supervision, B.V.d.W.; Validation, A.M.O. and B.V.d.W.; Visualization, A.M.O. and K.M.; Writing—original draft, A.M.O.; Writing—review & editing, A.M.O., K.M. and B.V.d.W.

Funding

This research was funded by European Union Civil Protection grant number 783232 and the APC was funded by the Delft University of Technology.

Acknowledgments

This research is part of the ImProDiReT project, which is funded by the European Union Civil Protection, under grant agreement No. 783232. The research furthermore has been made possible by the partners in the ImProDiReT project facilitating the local contacts, providing background information and additional insights. We thank the Regional Development Agency of Zakarpattia, Ukraine, the Resilience Advisors Network and Institute of Geological Sciences of the National Academy of Sciences of Ukraine for their support. We especially thank Edmunds Atikis and Sjirk Meijer for their support.

Conflicts of Interest

The authors declare no conflict of interest. The funders had no role in the design of the study; in the collection, analyses, or interpretation of data; in the writing of the manuscript, and in the decision to publish the results.

Appendix A. The ImProDiReT Project Summary and Intended Audience for Deliverable 3.1

Appendix A.1. ImProDiReT Project Summary

The ImProDiReT project was launched in March 2018 with a lifetime of 24 months and it aims to empower communities within the Transcarpathian region in Ukraine with innovative socio-technical solutions to reconnect them, and support them in responding to, and recovering from crisis situations. The project’s primary objective is to enhance community-based decision-making, assisted by automated methods for real time, crowd-sourced data collection, and monitoring.
Since the collapse of the Union of the Soviet Socialistic Republics (USSR) the logical connections between Ukrainian institutes and institutions with relevant data on hazards and risk of disasters and the local and regional administration were disturbed. An open, transparent exchange of information has become increasingly difficult at all levels, also in addressing cross-cutting issues. The UCPM Scoping mission to the Solotvyno noted this as a significant obstacle to come to a proper, all-inclusive assessment. In respect to the SENDAI framework, problems can be seen in the field of understanding risks, risk reduction governance, and investing in risk reduction management.
This document forms deliverable D 3.1 “State of the Art analysis”. As part of Work Package 3 (WP3), this deliverable focus on the establishing transparent risk evaluation and joint decision-making approach. The focus of WP3 is on establishing these approaches through examining best practices, academic literature, and drawing on the work from the other work-packages. Additionally, WP3 operates in conjunction with the other work-packages-extensive field visits and interviews to complement the findings and develop novel and appropriate methods for involving various stakeholders in the decision-making process. This first deliverable presents the State of the Art and is a result of an explorative effort to identify and evaluate different existing methods for joint decision-making approaches in risk reduction efforts.

Appendix A.2. Intended Audience

This deliverable is first and foremost intended to lay the groundwork for the follow-up activities in Work Package 3, to develop a joint decision-making approach and transparent risk evaluation methodology. Furthermore, it provides other consortium members insights in the direction of the ongoing developments in this Work Package, specifically to bridge the activities in Work Package 1 (Mapping) and Work Package 4/5 (development of an action plan), as described in the Plan of Action. However, the results from the ongoing work in this WP as they are presented in this deliverable also provides valuable insights in bringing together the work in the DRR domain, risk evaluation approaches, citizen engagement, and participatory systems.
Table A1. Readers of Deliverable 3.1 and Rationale for Reading.
Group of ReadersRationale for Reading
1. ImProDiReT consortiumThe deliverable builds on the work that has been conducted in WP1 and WP4, along with the own fieldwork presented. The results of the work presented in this deliverable also inform future work in other work-packages. Specifically, the application of the method in WP4 and WP5.
2. Regional stakeholders.The results of the deliverable will be shared and validated in the upcoming platform meeting. Furthermore, the method relies heavily on the involvement of local stakeholders. Finally and most importantly, the regional stakeholders will be the end-users of the proposed approach
3. Emergency management & Disaster Risk Reduction agenciesThis deliverable examines existing DRR approaches and implementing measures in a complex stakeholder landscape. While the local circumstances can differ, the findings and method described in this deliverable can also be applied by DRR agencies and Emergency Management authorities and tailored to their region.
4. PolicymakersJoint decision making and engaging citizens in the DRR process is a critical element of the ImProDiReT project. This deliverable provides the rationale and narrative for policy and decision makers to move towards a more collaborative approach.
5. AcademiaThe analysis presented in this deliverable combines concepts from the Disaster Risk Reduction (DRR) domain with elements from the participatory systems. Building on existing domain knowledge, new insights are presented combining these fields to empower and engage citizens

Appendix B. List (with Links) of Interviews Conducted in Uzhhorod and Solotvyno in August 2018

  • Link to Interview One:
    Date: Thursday the 9th of August 2018 and Friday 10th of August 2018
    Interviewee: Mr. Janos Kocserha, the Deputy Mayor of Solotvyno Municipality.
  • Link to Interview Two:
    Date: Wednesday the 8th of August 2018
    Interviewee: Mr. Demianchuk Vasyl, the Head of the Tyachiv District State Administration
  • Link to Interview Three:
    Date: Tuesday the 7th of August 2018 at 0900 h
    Interviewee: Mr. Viktor Mikulin the Deputy Head of Regional State Administration (https://carpathia.gov.ua/storinka/kerivnyctvo)
  • Link to Interview Four:
    Date: Thursday the 9th of August 2018
    Interviewee: Two former Solotvyno salt miners
  • Link to Interview Five:
    Date: Thursday the 9th of August 2018
    Interviewee: Mr. Palat Vladimir, the Managing Director of the Solotvyno Spa Speleocenter
  • Link to Interview Six:
    Date: Tuesday the 7th of August 2018 at 1100 h
    Interviewee: Ms. Oksana Fentsyk the Deputy Head of the Regional Ecological Inspection (https://carpathia.gov.ua/view_company/726)
  • Link to Interview Seven:
    Date: 6th of August 2018 at 1430 h
    Interviewee: Ms. Myrochnyk Tamara from the Regional Water Directorate (BUVR Tysa river) (http://buvrtysa.gov.ua/newsite/)
  • Link to Interview Eight:
    Date: Monday the 6th of August 2018 at 1130 h
    Interviewee: Mr. Roman Zayats from the State Emergency Service (SES) of Ukraine (http://zk.dsns.gov.ua/)
  • Link to Interview Nine:
    Date: Friday the 3rd of August 2018 at 1100 h
    Interviewee: Mr. Haidur Mykhailo and Mr. Shpontak Yirii from the Transcarpathia State regional Administration (http://ecozakarpat.gov.ua/)

References

  1. Onencan, A.; Van de Walle, B.; Enserink, B.; Chelang’a, J.; Kulei, F. WeShareIt Game: Strategic foresight for climate-change induced disaster risk reduction. Procedia Eng. 2016, 159, 307–315. [Google Scholar] [CrossRef]
  2. Onencan, A.M.; Van de Walle, B. Designing Disaster Diplomacy in the Context of a Climate Change Water Game. In Proceedings of the 48th International Simulation and Gaming Association Conference (ISAGA 2017) on Simulation Games for Sustainable Cities and Smart Infrastructures, Delft, The Netherlands, 10–14 July 2017; pp. 43–57. [Google Scholar]
  3. UNISDR. Sendai Framework for Disaster Risk Reduction 2015–2030; The United Nations International Strategy for Disaster Reduction Geneva (UNISDR): Geneva, Switzerland, 2015. [Google Scholar]
  4. UNISDR. Hyogo Framework for Action 2005–2015: Building the Resilience of Nations and Communities to Disasters; The United Nations International Strategy for Disaster Reduction Geneva (UNISDR): Geneva, Switzerland, 2005; Volume 380. [Google Scholar]
  5. Fritz, S.; See, L.; Brovelli, M. Motivating and sustaining participation in VGI. In Mapping and the Citizen Sensor; Foody, G., See, L., Fritz, S., Mooney, P., Olteanu-Raimond, A.-M., Fonte, C.C.A., Antoniou, V., Eds.; Ubiquity Press: London, UK, 2017; pp. 93–117. [Google Scholar]
  6. Fentsyk, O. Regional Ecological Inspection: Deputy Head of regional ecological inspection. In ImProDiReT Project; Onencan, A., Meijer, S., Akitis, E., Eds.; Onencan, AM: Uzhhorod, Ukraine, 2018; p. 1. [Google Scholar]
  7. Gilbert, E.H.; Norman, D.W.; Winch, F.E. Farming Systems Research: A Critical Appraisal; Michigan State University, Department of Agricultural Economics: East Lansing, MI, USA, 1980; p. 135. [Google Scholar]
  8. Kabutha, C.; Thomas-Slayter, B.P.; Ford, R. Participatory Rural Appraisal Handbook: Conducting PRA’s in Kenya; Kenya National Environment Secretariat, Egerton University, Clark University, and World Resource Institute: Washington, DC, USA, 1990. [Google Scholar]
  9. Chambers, R. Participatory rural appraisal (PRA): Challenges, potentials and paradigm. World Dev. 1994, 22, 1437–1454. [Google Scholar] [CrossRef]
  10. Mukherjee, N. Participatory Learning and Action: With 100 Field Methods; Concept Publishing Company: Delhi, India, 2002. [Google Scholar]
  11. Heijmans, A.; Victoria, L. Citizenry-Based & Development-Oriented Disaster Response; Centre for Disaster Preparedness and Citizens’ Disaster Response: Quezon City, Philippines, 2001. [Google Scholar]
  12. de Dios, H.B. Participatory Capacities and Vulnerabilities Assessment: Finding the Link between Disasters and Development; Oxfam Great Britain, Philippines Programme: Oxford, UK, 2002. [Google Scholar]
  13. Ireland, D. Disaster Risk Management from a Remote Shire’s Perspective; Centre for Disasters Studies, James Cooks University: North Queensland, Australia, 2001. [Google Scholar]
  14. McCallie, E.; Bell, L.; Lohwater, T.; Falk, J.H.; Lehr, J.L.; Lewenstein, B.V.; Needham, C.; Wiehe, B. Many Experts, Many Audiences: Public Engagement with Science and Informal Science Education; A CAISE Inquiry Group Report; Center for Advancement of Informal Science Education (CAISE): Washington, DC, USA, 2009; p. 1. [Google Scholar]
  15. Venton, P.; Hansford, B. Reducing Risk of Disaster in Our Communities; Tearfund: Teddington, UK, 2006. [Google Scholar]
  16. Shaw, R.; Okazaki, K. Sustainability in Grass-Roots Initiatives: Focus on Community-Based Disaster Management; United Nations Centre for Regional Development (UNCRD): Nagoya, Japan, 2003. [Google Scholar]
  17. Abarquez, I.; Murshed, Z. Community-Based Disaster Risk Management: Field Practitioners’ Handbook; Asian Disaster Preparedness Center (ADPC): Bangkok, Thailand, 2004. [Google Scholar]
  18. Dekens, J. Local Knowledge for Disaster Preparedness: A Literature Review; International Centre for Integrated Mountain Development (ICIMOD): Kathmandu, Nepal, 2007. [Google Scholar]
  19. Van Aalst, M.K.; Cannon, T.; Burton, I. Community level adaptation to climate change: The potential role of participatory community risk assessment. Glob. Environ. Chang. 2008, 18, 165–179. [Google Scholar] [CrossRef]
  20. Zerger, A.; Smith, D.I. Impediments to using GIS for real-time disaster decision support. Comput. Environ. Urban Syst. 2003, 27, 123–141. [Google Scholar] [CrossRef]
  21. Peters-Guarin, G.; McCall, M.K.; van Westen, C. Coping strategies and risk manageability: Using participatory geographical information systems to represent local knowledge. Disasters 2012, 36, 1–27. [Google Scholar] [CrossRef] [PubMed]
  22. Anderson, M.B.; Woodrow, P.J. Rising from the Ashes: Development Strategies in Times of Disaster; Lynne Rienner Publishers: Boulder, CO, USA; London, UK, 1989. [Google Scholar]
  23. Cannon, T.; Twigg, J.; Rowell, J. Social Vulnerability, SUSTAINABLE Livelihoods and Disasters; DFID: London, UK, 2003. [Google Scholar]
  24. Onencan, A.; Kortmann, R.; Kulei, F.; Enserin, B. MAFURIKO: Design of Nzoia basin location based flood game. Procedia Eng. 2016, 159, 133–140. [Google Scholar] [CrossRef]
  25. McCall, M.K. Participatory Mapping and Participatory GIS (PGIS) for CRA, Community DRR and Hazard Assessment; ITC: Enschede, The Netherlands, 2008. [Google Scholar]
  26. Ferrier, N.; Haque, C.E. Hazards risk assessment methodology for emergency managers: A standardized framework for application. Nat. Hazards 2003, 28, 271–290. [Google Scholar] [CrossRef]
  27. McCall, M.K. Seeking good governance in Participatory-GIS: A review of processes and governance dimensions in applying GIS to participatory spatial planning. Habitat Int. 2003, 27, 549–573. [Google Scholar] [CrossRef]
  28. O’Neill, P. Developing an Effective Risk Communication Model for Vulnerable Communities; Pennsylvania State University: State College, PA, USA, 2003. [Google Scholar]
  29. Chambers, R. Participatory mapping and geographic information systems: Whose map? Who is empowered and who disempowered? Who gains and who loses? Electron. J. Inf. Syst. Dev. Ctries 2006, 25, 1–11. [Google Scholar] [CrossRef]
  30. Rambaldi, G.; Kyem, P.A.K.; McCall, M.; Weiner, D. Participatory spatial information management and communication in developing countries. Electron. J. Inf. Syst. Dev. Ctries 2006, 25, 1–9. [Google Scholar] [CrossRef]
  31. Declaration, R. Rio Declaration on Environment and Development; United Nations: Stockholm, Sweden, 1992. [Google Scholar]
  32. Stec, S.; Casey-Lefkowitz, S. The Aarhus Convention: An Implementation Guide; Economic Commission for Europe: New York, NY, USA; Geneva, Switzerland, 2000. [Google Scholar]
  33. Kravchenko, S. The Aarhus Convention and innovations in compliance with multilateral environmental agreements. Colo. J. Int. Environ. Law Policy 2007, 18, 1. [Google Scholar]
  34. Haklay, M.E.; Francis, L. Participatory GIS and Community-Based Citizen Science for Environmental Justice Action; Routledge: Abingdon, UK, 2017. [Google Scholar]
  35. Haklay, M.M.; Mazumdar, S.; Wardlaw, J. Citizen science for observing and understanding the Earth. In Earth Observation Open Science and Innovation; Springer: Berlin, Germany, 2018; pp. 69–88. [Google Scholar]
  36. Fritz, S.; Fonte, C.C.; See, L. The Role of Citizen Science in Earth Observation; Multidisciplinary Digital Publishing Institute: Basel, Switzerland, 2017. [Google Scholar]
  37. European Commission. Green Paper on Citizen Science for Europe: Towards a Society of Empowered Citizens and Enhanced Research; European Commission: Brussels, Belgium, 2014. [Google Scholar]
  38. European Commission. Interim Evaluation of Horizon 2020; European Commission: Brussels, Belgium, 2017; p. 243. [Google Scholar] [CrossRef]
  39. Barchiesi, S.; Sanchez, J.C.; Cross, K.; de Madrid, M.P.; Onencan, A.M. Adaptation Planning—Views towards Resilience and Up-scaling Success to Enhance Transboundary Water Governance (Chapter Five). In Transboundary Water Governance: Adaptation to Climate Change; IUCN, in Collaboration with the IUCN Environmental Law Centre: Gland, Switzerland, 2014; Volume 75, pp. 113–241. [Google Scholar]
  40. Haklay, M. Citizen Science and Policy: A European Perspective; The Woodrow Wilson Center, Commons Lab: Washington, DC, USA, 2015. [Google Scholar]
  41. Haklay, M.E.; Francis, L. Participatory GIS and community-based citizen science for environmental justice action. In The Routledge Handbook of Environmental Justice; Chakraborty, J., Walker, G., Holifield, R., Eds.; Routledge: Abingdon, UK, 2017; pp. 297–308. [Google Scholar]
  42. Stevens, M.; Vitos, M.; Altenbuchner, J.; Conquest, G.; Lewis, J.; Haklay, M. Taking participatory citizen science to extremes. IEEE Pervasive Comput. 2014, 2, 20–29. [Google Scholar]
  43. Senaratne, H.; Mobasheri, A.; Ali, A.L.; Capineri, C.; Haklay, M. A review of volunteered geographic information quality assessment methods. Int. J. Geogr. Inf. Sci. 2017, 31, 139–167. [Google Scholar] [CrossRef]
  44. Fonte, C.C.; Antoniou, V.; Bastin, L.; Bayas, L.; See, L.; Vatseva, R. Assessing VGI data quality. In Mapping and the Citizen Sensor; Foody, G., See, L., Fritz, S., Mooney, P., Olteanu-Raimond, A.-M., Fonte, C.C., Antoniou, V., Eds.; Ubiquity Press: London, UK, 2017; pp. 137–163. [Google Scholar]
  45. Antoniou, V.; Skopeliti, A. Measures and indicators of VGI quality: An overview. ISPRS Ann. Photogramm. Remote Sens. Spat. Inf. Sci. 2015, 2, 345. [Google Scholar] [CrossRef]
  46. Ballatore, A.; Zipf, A. A conceptual quality framework for Volunteered Geographic Information. In International Workshop on Spatial Information Theory; Springer: Berlin, Germany, 2015; pp. 89–107. [Google Scholar]
  47. Bakillah, M.; Liang, S.H.; Zipf, A.; Arsanjani, J.J. Semantic interoperability of sensor data with Volunteered Geographic Information: A unified model. ISPRS Int. J. Geo-Inf. 2013, 2, 766–796. [Google Scholar] [CrossRef]
  48. Zhao, P. Geospatial Web Services: Advances in Information Interoperability: Advances in Information Interoperability; Information Science Reference (an Imprint of IGI Global): Hershey, PA, USA, 2010. [Google Scholar]
  49. Coleman, D.; Georgiadou, Y.; Labonte, J. Volunteered geographic information: The nature and motivation of producers. IJSDIR 2009, 4, 332–358. [Google Scholar]
  50. Iacovides, I.; Jennett, C.; Cornish-Trestrail, C.; Cox, A.L. Do games attract or sustain engagement in citizen science?: A study of volunteer motivations. In Proceedings of the CHI’13 Extended Abstracts on Human Factors in Computing Systems, Paris, France, 2 May–27 April 2013; pp. 1101–1106. [Google Scholar]
  51. Hsu, A.; Malik, O.; Johnson, L.; Esty, D.C. Mobilize citizens to track sustainability. Nature 2014, 508, 33–35. [Google Scholar] [CrossRef] [PubMed]
  52. Mooney, P.; Olteanu-Raimond, A.-M.; Touya, G.; Juul, N.; Alvanides, S.; Kerle, N. Considerations of privacy, ethics and legal issues in volunteered geographic information. Mapp. Citiz. Sens. 2017, 18, 119–135. [Google Scholar]
  53. European Commission. LAB-FAB-APP: Investing in the European future we want. In The Lamy Report; European Commission: Brussels, Belgium, 2017; p. 36. [Google Scholar] [CrossRef]
  54. Reed, M.S.; Graves, A.; Dandy, N.; Posthumus, H.; Hubacek, K.; Morris, J.; Prell, C.; Quinn, C.H.; Stringer, L.C. Who’s in and why? A typology of stakeholder analysis methods for natural resource management. J. Environ. Manag. 2009, 90, 1933–1949. [Google Scholar] [CrossRef] [PubMed]
  55. Bonney, R.; Cooper, C.B.; Dickinson, J.; Kelling, S.; Phillips, T.; Rosenberg, K.V.; Shirk, J. Citizen science: A developing tool for expanding science knowledge and scientific literacy. BioScience 2009, 59, 977–984. [Google Scholar] [CrossRef]
  56. Riesch, H.; Potter, C. Citizen science as seen by scientists: Methodological, epistemological and ethical dimensions. Public Underst. Sci. 2014, 23, 107–120. [Google Scholar] [CrossRef] [PubMed]
  57. Enserink, B.; Kwakkel, J.; Bots, P.; Hermans, L.; Thissen, W.; Koppenjan, J. Policy Analysis of Multi-Actor SYSTEms; Eleven International Publ.: The Hague, The Netherlands, 2010. [Google Scholar]
  58. Kocserha, J. Deputy Mayor, Solotvyno Municipality. In ImProDiReT Project; Onencan, A., Meijer, S., Eds.; Onencan, AM: Solotvyno, Ukraine, 2018; p. 1. [Google Scholar]
  59. Three Company Directors of three Recreation Centers in Solotvyno. ImProDiReT Project; Onencan, A., Meijer, S., Akitis, E., Eds.; Onencan, AM: Solotvyno, Ukraine, 2018; p. 1. [Google Scholar]
  60. Poklad, A. Ecological Disaster in Solotvino; Sumy State University: Sumy, Ukraine, 2010. [Google Scholar]
  61. Two Former Miners—Solotvyno Salt Mine. ImProDiReT Project; Onencan, A., Meijer, S., Akitis, E., Eds.; Onencan, AM: Solotvyno, Ukraine, 2018; p. 1. [Google Scholar]
  62. Head of Clinic—Solotvyno Allergological Hospital. ImProDiReT Project; Onencan, A., Meijer, S., Eds.; Onencan, AM: Solotvyno, Ukraine, 2018; p. 1. [Google Scholar]
  63. Wheeler, S.; Sivakumar, V. An elasto-plastic critical state framework for unsaturated soil. Géotechnique 1995, 45, 35–53. [Google Scholar] [CrossRef]
  64. Khrushchev, D. Regional structural-lithological1modeling of sedimentary cover. Геoлoгічний журнал 2015, 2, 27–38. [Google Scholar] [CrossRef]
  65. Two Male Priests of Different Confessions. ImProDiReT Project; Onencan, A., Meijer, S., Eds.; Onencan, AM: Solotvyno, Ukraine, 2018; p. 1. [Google Scholar]
  66. Zayats, R. State Emergency Services, Head of the Department of Civil Protection Measure. In ImProDiReT Project; Onencan, A., Meijer, S., Akitis, E., Eds.; Onencan, AM: Uzhhorod, Ukraine, 2018; p. 1. [Google Scholar]
  67. Mikulin, V. Regional State Administration. In ImProDiReT Project; Onencan, A., Meijer, S., Akitis, E., Eds.; Onencan, AM: Uzhhorod, Ukraine, 2018; p. 1. [Google Scholar]
  68. Vasyl, D. Head of the Tyachiv District State Administration. In ImProDiReT Project; Onencan, A.M., Meijer, S., Akitis, E., Eds.; Onencan, AM: Solotvyno, Ukraine, 2018; p. 1. [Google Scholar]
  69. Onencan, A.M.; Van de Walle, B. Equitable and Reasonable Utilization: Reconstructing the Nile Basin Water Allocation Dialogue. Water 2018, 10, 707. [Google Scholar] [CrossRef]
  70. Onencan, A.M.; Van de Walle, B. From Paris Agreement to Action: Enhancing Climate Change Familiarity and Situation Awareness. Sustainability 2018, 10, 1929. [Google Scholar] [CrossRef]
  71. Onencan, A.M. Assessment of Hybrid Board Game-Based Learning Outcomes Using the Beatty Theoretical Framework. In International Simulation and Gaming Association Conference; Springer: Delft, The Netherlands, 2017; pp. 161–172. [Google Scholar]
  72. Mykhailo, H.; Yirii, S. Department of Ecology, State regional Administration: Deputy Directors. In ImProDiReT Project; Onencan, A., Meijer, S., Eds.; Onencan, AM: Uzhhorod, Ukraine, 2018; p. 1. [Google Scholar]
  73. Tamara, M. Regional Water Directorate (BUVR Tysa. In ImProDiReT Project; Onencan, A., Meijer, S., Akitis, E., Eds.; Onencan, AM: Uzhhorod, Ukraine, 2018; p. 1. [Google Scholar]
  74. Füssel, H.-M. Vulnerability: A generally applicable conceptual framework for climate change research. Glob. Environ. Chang. 2007, 17, 155–167. [Google Scholar] [CrossRef]
  75. Head of the PJSC “Girhimprom” (Mining Company). ImProDiReT Project; Onencan, A., Meijer, S., Akitis, E., Eds.; Onencan, AM: Solotvyno, Ukraine, 2018; p. 1. [Google Scholar]
  76. Head of the State Enterprise Responsible for Liquidation of the Mine. ImProDiReT Project; Onencan, A., Meijer, S., Akitis, E., Eds.; Onencan, AM: Solotvyno, Ukraine, 2018; p. 1. [Google Scholar]
  77. School Directors of the Hungarian Ukrainian and Romanian Schools in Solotvyno. ImProDiReT Project; Onencan, A., Meijer, S., Eds.; Onencan, AM: Solotvyno, Ukraine, 2018; p. 1. [Google Scholar]
  78. One Teacher in the Hungarian School. ImProDiReT Project; Onencan, A., Meijer, S., Eds.; Onencan, AM: Solotvyno, Ukraine, 2018; p. 1. [Google Scholar]
  79. Father and Son Whose House Was Destroyed in Solona Street—Solotvyno. ImProDiReT Project; Onencan, A., Meijer, S., Eds.; Onencan, AM: Solotvyno, Ukraine, 2018; p. 1. [Google Scholar]
  80. Resident of One of the Houses with Cracked Walls Near Salt Mine Number Eight (8). ImProDiReT Project; Onencan, A., Meijer, S., Eds.; Onencan, AM: Solotvyno, Ukraine, 2018; p. 1. [Google Scholar]
  81. Onencan, A.M.; Meesters, K.; Akitis, E. D. 3.1. State of the Art Analysis; Delft University of Technology: Delft, The Netherlands, 2018; p. 46. [Google Scholar]
  82. Vladimir, P. Solotvyno Spa Speleocenter (Company that has been given a new license for a Speleocenter). In ImProDiReT Project; Onencan, A., Meijer, S., Akitis, E., Eds.; Onencan, AM: Solotvyno, Ukraine, 2018; p. 1. [Google Scholar]
  83. Mitchell, G. Forecasting environmental equity: Air quality responses to road user charging in Leeds, UK. J. Environ. Manag. 2005, 77, 212–226. [Google Scholar] [CrossRef] [PubMed] [Green Version]
  84. Onencan, A.; Enserink, B.; Wairugala, H.; Chelang’a, J.; Chirchir, W.; Kulei, F. Coupling Nile Basin 2050 Scenarios with the IPCC 2100 Projections for Climate-induced Risk Reduction. Procedia Eng. 2016, 159, 357–365. [Google Scholar] [CrossRef]
  85. Onencan, A.M.; Enserink, B. THE NILE BASIN BY 2050: Strategic Foresight on the Nile Basin Water Governance; Nile Basin Discourse: Entebbe, Uganda, 2014; p. 28. [Google Scholar]
  86. Onencan, A.M.; Enserink, B.; van de Walle, B. Game Design Concept Report: Application of the WeShareIt Game Elements in Nzoia River Basin; Delft University of Technology: Delft, The Netherlands, 2018; p. 53. [Google Scholar]
  87. Enserink, B.; Onencan, A. Nile Basin Scenario Construction. In Proceedings of the IAIA’s Contribution in Addressing Climate Change, 37th Annual Conference of the International Association for Impact Assessment, Le Centre Sheraton, Montréal, QC, Canada, 4–7 April 2017. [Google Scholar]
  88. Haklay, M.; Mateos, P.; Hess, M. Mapping for Change: Practice, Technologies and Communication, Visioning and Visualization: People, Pixels and Plans, Geography and Genealogy: Locating Personal Pasts, Knowledge-Based Services, Internationalization and Regional Development; SAGE Publications: London, UK, 2009. [Google Scholar]
  89. Castro, J.; Kolp, M.; Mylopoulos, J. Towards requirements-driven information systems engineering: The Tropos project. Inf. Syst. 2002, 27, 365–389. [Google Scholar] [CrossRef]
  90. Mitchell, R.K.; Agle, B.R.; Wood, D.J. Toward a theory of stakeholder identification and salience: Defining the principle of who and what really counts. Acad. Manag. Rev. 1997, 22, 853–886. [Google Scholar] [CrossRef]
  91. Frooman, J. Stakeholder influence strategies. Acad. Manag. Rev. 1999, 24, 191–205. [Google Scholar] [CrossRef]
  92. Clarkson, M.E. A stakeholder framework for analyzing and evaluating corporate social performance. Acad. Manag. Rev. 1995, 20, 92–117. [Google Scholar] [CrossRef]
  93. Ellul, C.; Francis, L.; Haklay, M. A Flexible database-centric platform for citizen science data capture. In Proceedings of the 2011 IEEE Seventh International Conference on e-Science Workshops, Stockholm, Sweden, 5–8 December 2011; pp. 39–44. [Google Scholar]
  94. Ellul, C.; Gupta, S.; Haklay, M.M.; Bryson, K. A platform for location-based app development for citizen science and community mapping. In Progress in Location-Based Services; Springer: Berlin/Heidelberg, Germany, 2013; pp. 71–90. [Google Scholar]
  95. Zyngier, C.M.; Moura, A.C.; Palhares, R.; Carsalade, F. Geodesign in Pampulha cultural and heritage urban area: Visualization tools to orchestrate urban growth and dynamic transformations. Rozwój Regionalny i Polityka Regionalna 2016, 35, 73–87. [Google Scholar]
  96. Haklay, M.; Jankowski, P.; Zwoliński, Z. Selected modern methods and tools for public participation in urban planning—A review. Quaest. Geogr. 2018, 37, 127–149. [Google Scholar] [CrossRef]
Figure 1. Examples of Citizen Science (CS) initiatives that are relevant to Earth Observation (EO), Adopted from Table 1 of Fritz et al. (2017) [36], (pp. 3–4).
Remotesensing 10 01828 g001
Figure 2. The images of Solotvyno. The first image is the map of Solotvyno. The second image is a schematic geological–structural section (natural base for groundwater movement and karst cones subsidence development). From the schematic geological–structural section, Mine 7, 8, and 9, are represented. The zones of weakness are indicated, where the removal of the protective clay layer during salt exploitation led to the filtration of freshwater into the salt dome and flooding of the salt mines. We derived the second image from the Institute of Geological Sciences—National Academy of Sciences of Ukraine (IGS NASU). The third image is an illustration of one of the salt lakes, created when the salt mines subsided and collapsed. The last picture is a portion of the recreation center in Solotvino—solná jezera; it is crowded with approximately 3000 tourists in the summer season, every year [58,59]. The tourists come to Solotvyno for recreation and healing from the salt lakes. The salt lakes developed when the mines were flooded.
Remotesensing 10 01828 g002aRemotesensing 10 01828 g002b
Figure 3. Screenshot of the Copernicus Emergency Management Service 2017 digital map for Solotvyno.
Remotesensing 10 01828 g003
Figure 4. Schematic representation of critical methodological steps necessary for system and stakeholder analysis and the development and application of the methodology for Participatory GIS Risk Mapping and Citizen Science for Solotvyno Salt Mines. The methodology comprises a six-stage process. The process is iterative and flexible enough to be changed based on the local circumstances and agreements made with the stakeholders. The system and stakeholder analysis are modified from Reed (2009, 1947) schematic representation of the critical steps for stakeholder analysis [54]. The Methodology for Participatory GIS Risk Mapping and Citizen Science for Solotvyno Salt Mines is adjusted from Haklay (2018, 3) PGIS and CS methodology [41].
Remotesensing 10 01828 g004
Figure 5. Images of the Solotvyno Deputy Mayor (left image) and Mayor (right image), explaining their perceptions of risk, while referring to the old Solotvyno paper map. Since there have been many environmental changes around the mines and there is a need to update the current paper map with a more recent paper map before undertaking further Solotvyno community risk perception mapping.
Remotesensing 10 01828 g005
Figure 6. Pampulha case study Geodesign iterations. Each of the three iterations was performed using representation, process, and evaluation models. Source: Haklay et al. (2018) [96], (p. 142).
Remotesensing 10 01828 g006

