Article

Desertification Information Extraction Based on Feature Space Combinations on the Mongolian Plateau

1
State Key Laboratory of Resources and Environmental Information System, Institute of Geographic Sciences and Natural Resources Research, Chinese Academy of Sciences, Beijing 100101, China
2
School of Civil and Architectural Engineering, Shandong University of Technology, Zibo 255049, China
3
Jiangsu Center for Collaborative Innovation in Geographical Information Resource Development and Application, Nanjing 210023, China
4
Visiting professor at the School of Engineering and Applied Sciences, National University of Mongolia, Ulaanbaatar City 14201, Mongolia
5
University of Chinese Academy of Sciences, Beijing 100049, China
6
Department of Environment and Forest Engineering, National University of Mongolia, Ulaanbaatar City 210646, Mongolia
7
Department of Geography, National University of Mongolia, Ulaanbaatar City 14201, Mongolia
*
Author to whom correspondence should be addressed.
Remote Sens. 2018, 10(10), 1614; https://doi.org/10.3390/rs10101614
Submission received: 22 August 2018 / Revised: 29 September 2018 / Accepted: 9 October 2018 / Published: 11 October 2018

Abstract

:
The Mongolian plateau is a hotspot of global desertification because it is heavily affected by climate change, and has a large diversity of vegetation cover across various regions and seasons. Within this arid region, it is difficult to distinguish desertified land from other land cover types using low-quality vegetation information. To address this, we analyze both the effects and the applicability of different feature space models for the extraction of desertification information with the goal of finding appropriate approaches to extract desertification data on the Mongolian plateau. First, we used Landsat 8 remote sensing images to invert NDVI (normalized difference vegetation index), MSAVI (modified soil adjusted vegetation index), TGSI (topsoil grain size index), and albedo (land surface albedo) data. Then, we constructed the feature space models of Albedo-NDVI, Albedo-MSAVI, and Albedo-TGSI, and compared their extraction accuracies. Our results show that the overall classification accuracies of the three models were 84.53%, 85.60%, and 88.27%, respectively, indicating that the three feature space models are feasible for extracting information relating to desertification on the Mongolian plateau. Further analysis indicates that the Albedo-NDVI model is suitable for areas with a high vegetation cover or a high forest ratio, whilst the Albedo-MSAVI model is suitable for areas with relatively low vegetation cover, and the Albedo-TGSI model is suitable for areas with extremely low vegetation cover, including the widely distributed Gobi Desert and other barren areas. This study provides a technical selection reference for the investigation of desertification of different zones on the Mongolian plateau.

1. Introduction

Desertification is a serious global environmental problem. Under the influence of natural environmental change and the anthropogenic causes of grassland degradation, ecological and environmental deterioration, as well as desertification have become more severe in Mongolia [1]. Plant species from 1961 to 2006 in the forest steppe, real steppe, mountain steppe, desert steppe, and desert regions in Mongolia were reduced by 50.0%, 44.7%, 30.3%, 23.8%, and 26.7%, respectively [2]. In 2007, more than 72% of Mongolia’s land was affected by desertification, with the range of desertification still expanding [3]. In 2017, the most current data from the Ministry of Natural Environment and Tourism of Mongolia indicated that 76.8% of the country’s land suffered varying degrees of desertification with desertification continuing to spread at a rapid rate, affecting the country’s renowned grasslands, including those in Dornod and Khentii provinces [4]. The increasing desertification problem on the Mongolian Plateau will have a strong effect on local sustainable development and may become the biggest obstacle to the transboundary cooperation in this area, for example, the China-Mongolia-Russia economic corridor issued by the governments of these three countries [5].
International research on desertification monitoring by remote sensing began in the 1970’s [6]. Initially, researchers used land degradation as reflected by the vegetation index to represent desertification [7,8,9]. In the 1980’s, studies found that land surface albedo is one of the most important parameters of the ground radiant energy balance, which determine the radiant energy absorbed by the underlying surface [10]. Some studies showed that increasing land surface albedo implies a degradation of land quality [11]. At the beginning of the 21st century, a number of studies found that texture features, moisture content, and surface albedo changed with a change in ground object types [12]. At the same time, some researchers found that monitoring changes in vegetation and land use was not the only way to measure desertification [13,14]. Zeng et al. used the albedo and NDVI (normalized difference vegetation index) to build the Albedo-NDVI feature space to conduct a study on desertification [15]. They found that multi-dimensional remote sensing data had clear biophysical significance and could reflect the surface coverage, hydrothermal combination, and the changes in land desertification.
However, due to the considerable influence of the soil background on the NDVI, the vegetation condition cannot be well expressed in areas with sparse vegetation. With a decrease in vegetation coverage, surface albedo and surface radiation temperatures increase accordingly. Therefore, the MSAVI (modified soil adjusted vegetation index) was introduced, which fully considers the bare soil line problem and can better eliminate or reduce the influence of the soil and vegetation canopy background [16]. After comparing the correlation coefficients of NDVI, MSAVI, and the grassland vegetation cover, Wu et al. found that the MSAVI was significantly correlated with grassland vegetation cover [17]. Feng et al. proposed building an Albedo-MSAVI feature space model by replacing NDVI with MSAVI and applying it to the study of soil salinization [18]. However, Vova et al. carried out land degradation monitoring in the Govi-Altai province of Mongolia and found that the changes in the MSAVI were not sufficient to evaluate the land degradation process [19]. This suggests that changes in pure MSAVI are not a major indicator of land degradation assessment. In fact, in the current research of desertification information extraction, studies on feature space are still dominated by the Albedo-NDVI feature space, and diverse feature spaces, such as the Albedo-MSAVI feature space, are rarely used.
In addition, due to different degrees of desertification, different topsoil textures are produced. More serious desertification corresponds to rougher the surface soil particle composition. Therefore, TGSI (topsoil grain size index) is recommended as an evaluation index of land degradation [20,21]. Lamchin et al. used NDVI, TGSI, and albedo as representative indicators of vegetation biomass, landscape pattern, and micro-meteorology, respectively. Then, desertification information extraction was conducted on the Hogno Khaan Nature Reserve in Mongolia to complete a dynamic analysis of desertification [22]. In 2017, Lamchin et al. found that the highest correlations were between TGSI and albedo at all levels of desertification [23]. This provided a basis for constructing the Albedo-TGSI feature space model. Combined with the above information, it can be seen that the previous studies of desertification information extraction are mainly based on the combination of multiple indexes or on a single feature space model, which lacks the comprehensive evaluation ratio of various special space models. Determining what kind of feature space is suitable for the extraction of desertification information regarding the Mongolian Plateau remains a scientific problem that needs to be solved.
In response to this challenge, our study analyzed the effects and applicability of different feature space models in the extraction of desertification information, with the goal of finding appropriate extraction approaches for desertification relating to the Mongolian plateau. We used 30-m resolution remote sensing images to invert the NDVI, MSAVI, TGSI, and albedo data of the study area in Mongolia and investigated the desertification information based on the feature space models of Albedo-NDVI, Albedo-MSAVI, and Albedo-TGSI. By comparing and analyzing the results, we attempted to find the reasonable model(s) under different vegetation cover conditions. This study was expected to provide a reference for the methods used for the dynamic monitoring of desertification on the Mongolia Plateau.

2. Materials and Methods
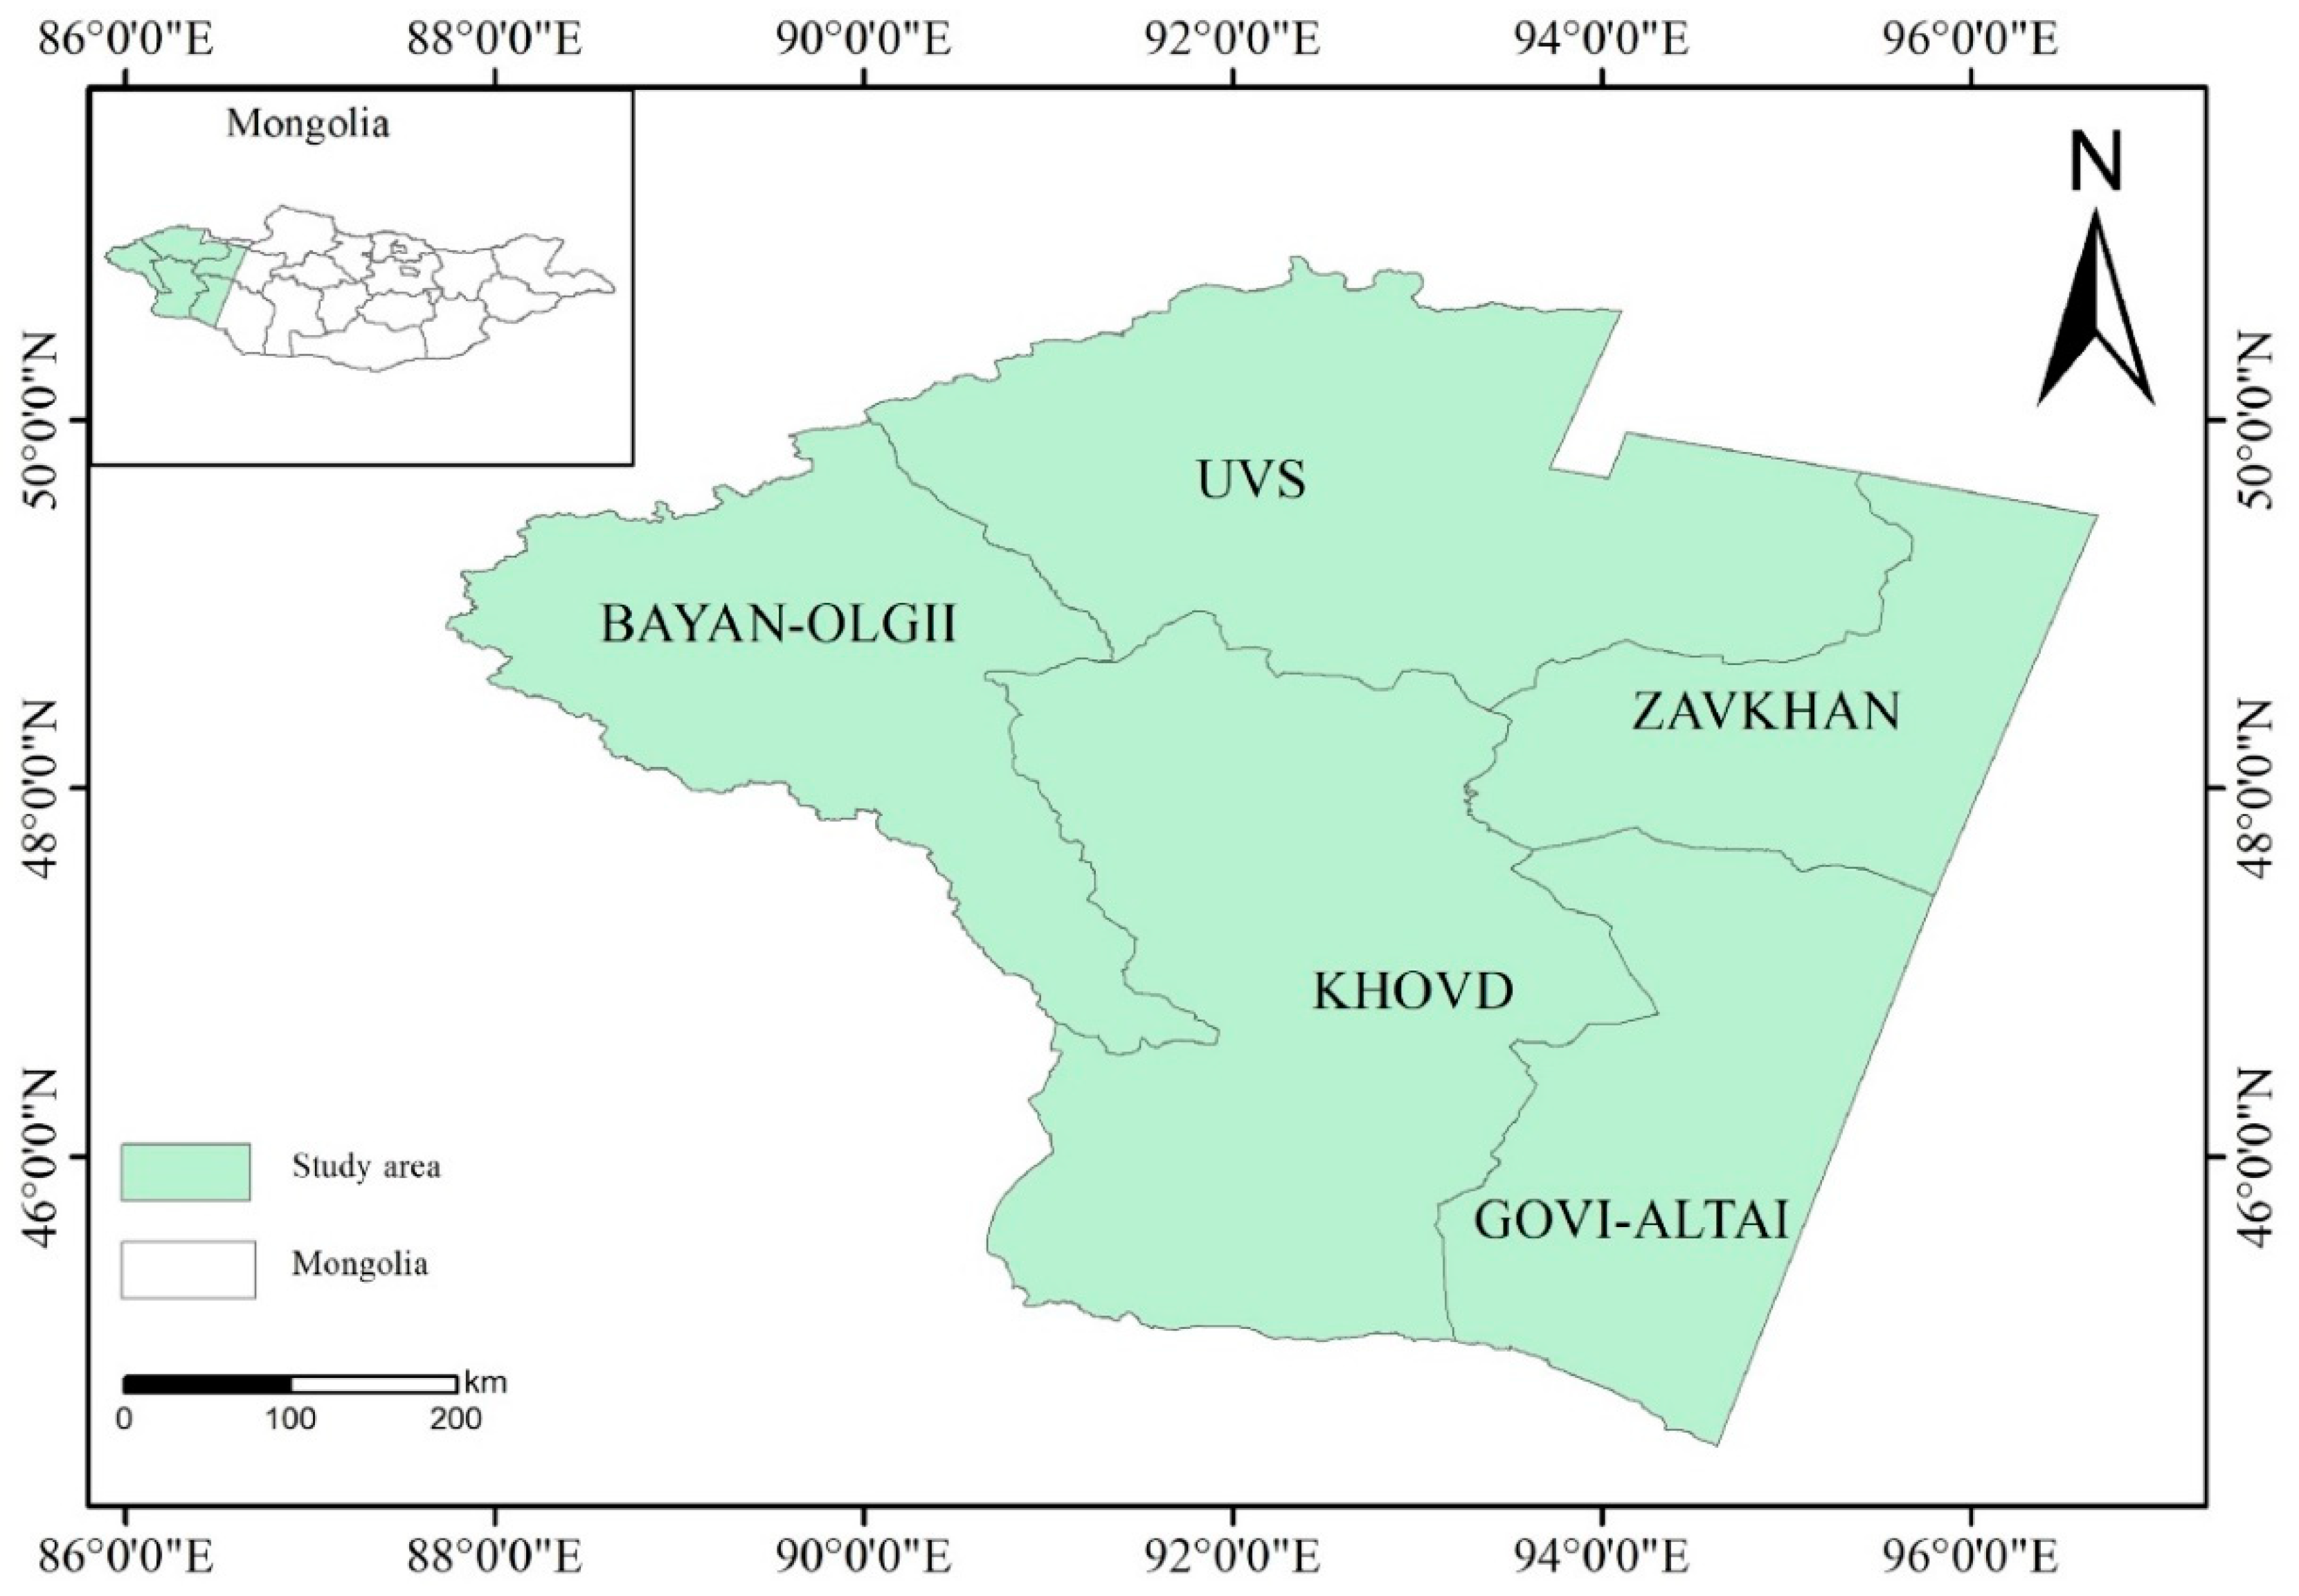
2.1. Study Area

The study area is located at 44°25′N–50°53′N and 87°44′E–96°41′E in the Northwestern part of Mongolia (Figure 1), adjacent to the Xinjiang Uygur Autonomous Region of China, the Republic of Tuva, and the Republic of Altai, Russia. In terms of administrative divisions, the study area mainly falls under the provinces of Bayan-Olgii, Khovd, most of Uvs, parts of Zavkhan province, and Govi-Altai province. The region mainly consists of plateaus and mountains. The Altai mountains run through the entire study area and extend from the Northwest to the Southeast of the inner Mongolian plateau, resulting in a gradual lowering of the topography from West to East. This area has a typical continental climate, in which the lowest temperature in winter reaches −40 °C, the highest temperature in summer can rise to 40 °C, and the annual precipitation is 200–300 mm. The land cover types in this region are complex, including almost all land cover types in Mongolia, but mainly consist of bare land and desert grassland. In addition, the region is inhabited by a number of different ethnic groups, including the Halaha, Burbutt, Bayat, and Kazak. According to 2010 statistics, there were about 326,000 people in this region [24].

2.2. Data Sources and Preprocessing

In this study, 19 Landsat 8 OLI (operational land imager) remote sensing images with 30 m resolution were selected. The imaging data were taken between June 2015 and October 2015, and the cloud coverage was less than 10%. Landsat 8 OLI images were obtained from the USGS website (United States Geological Survey) (http://earthexplorer.usgs.gov/).
Auxiliary data of this study include a vector map of Mongolia’s administrative division in 2013, a 2007 desertification status map of Mongolia [3], a 2015 classified map of Mongolia’s land cover [25], and the Google Earth online map. The land cover classification data with 30 m resolution was produced using the object-oriented classification method by the Institute of Geographic Sciences and Natural Resources Research, Chinese Academy of Sciences. In addition, the overall accuracy of the classified map of Mongolia’s land cover was 92.75%.

2.3. Method

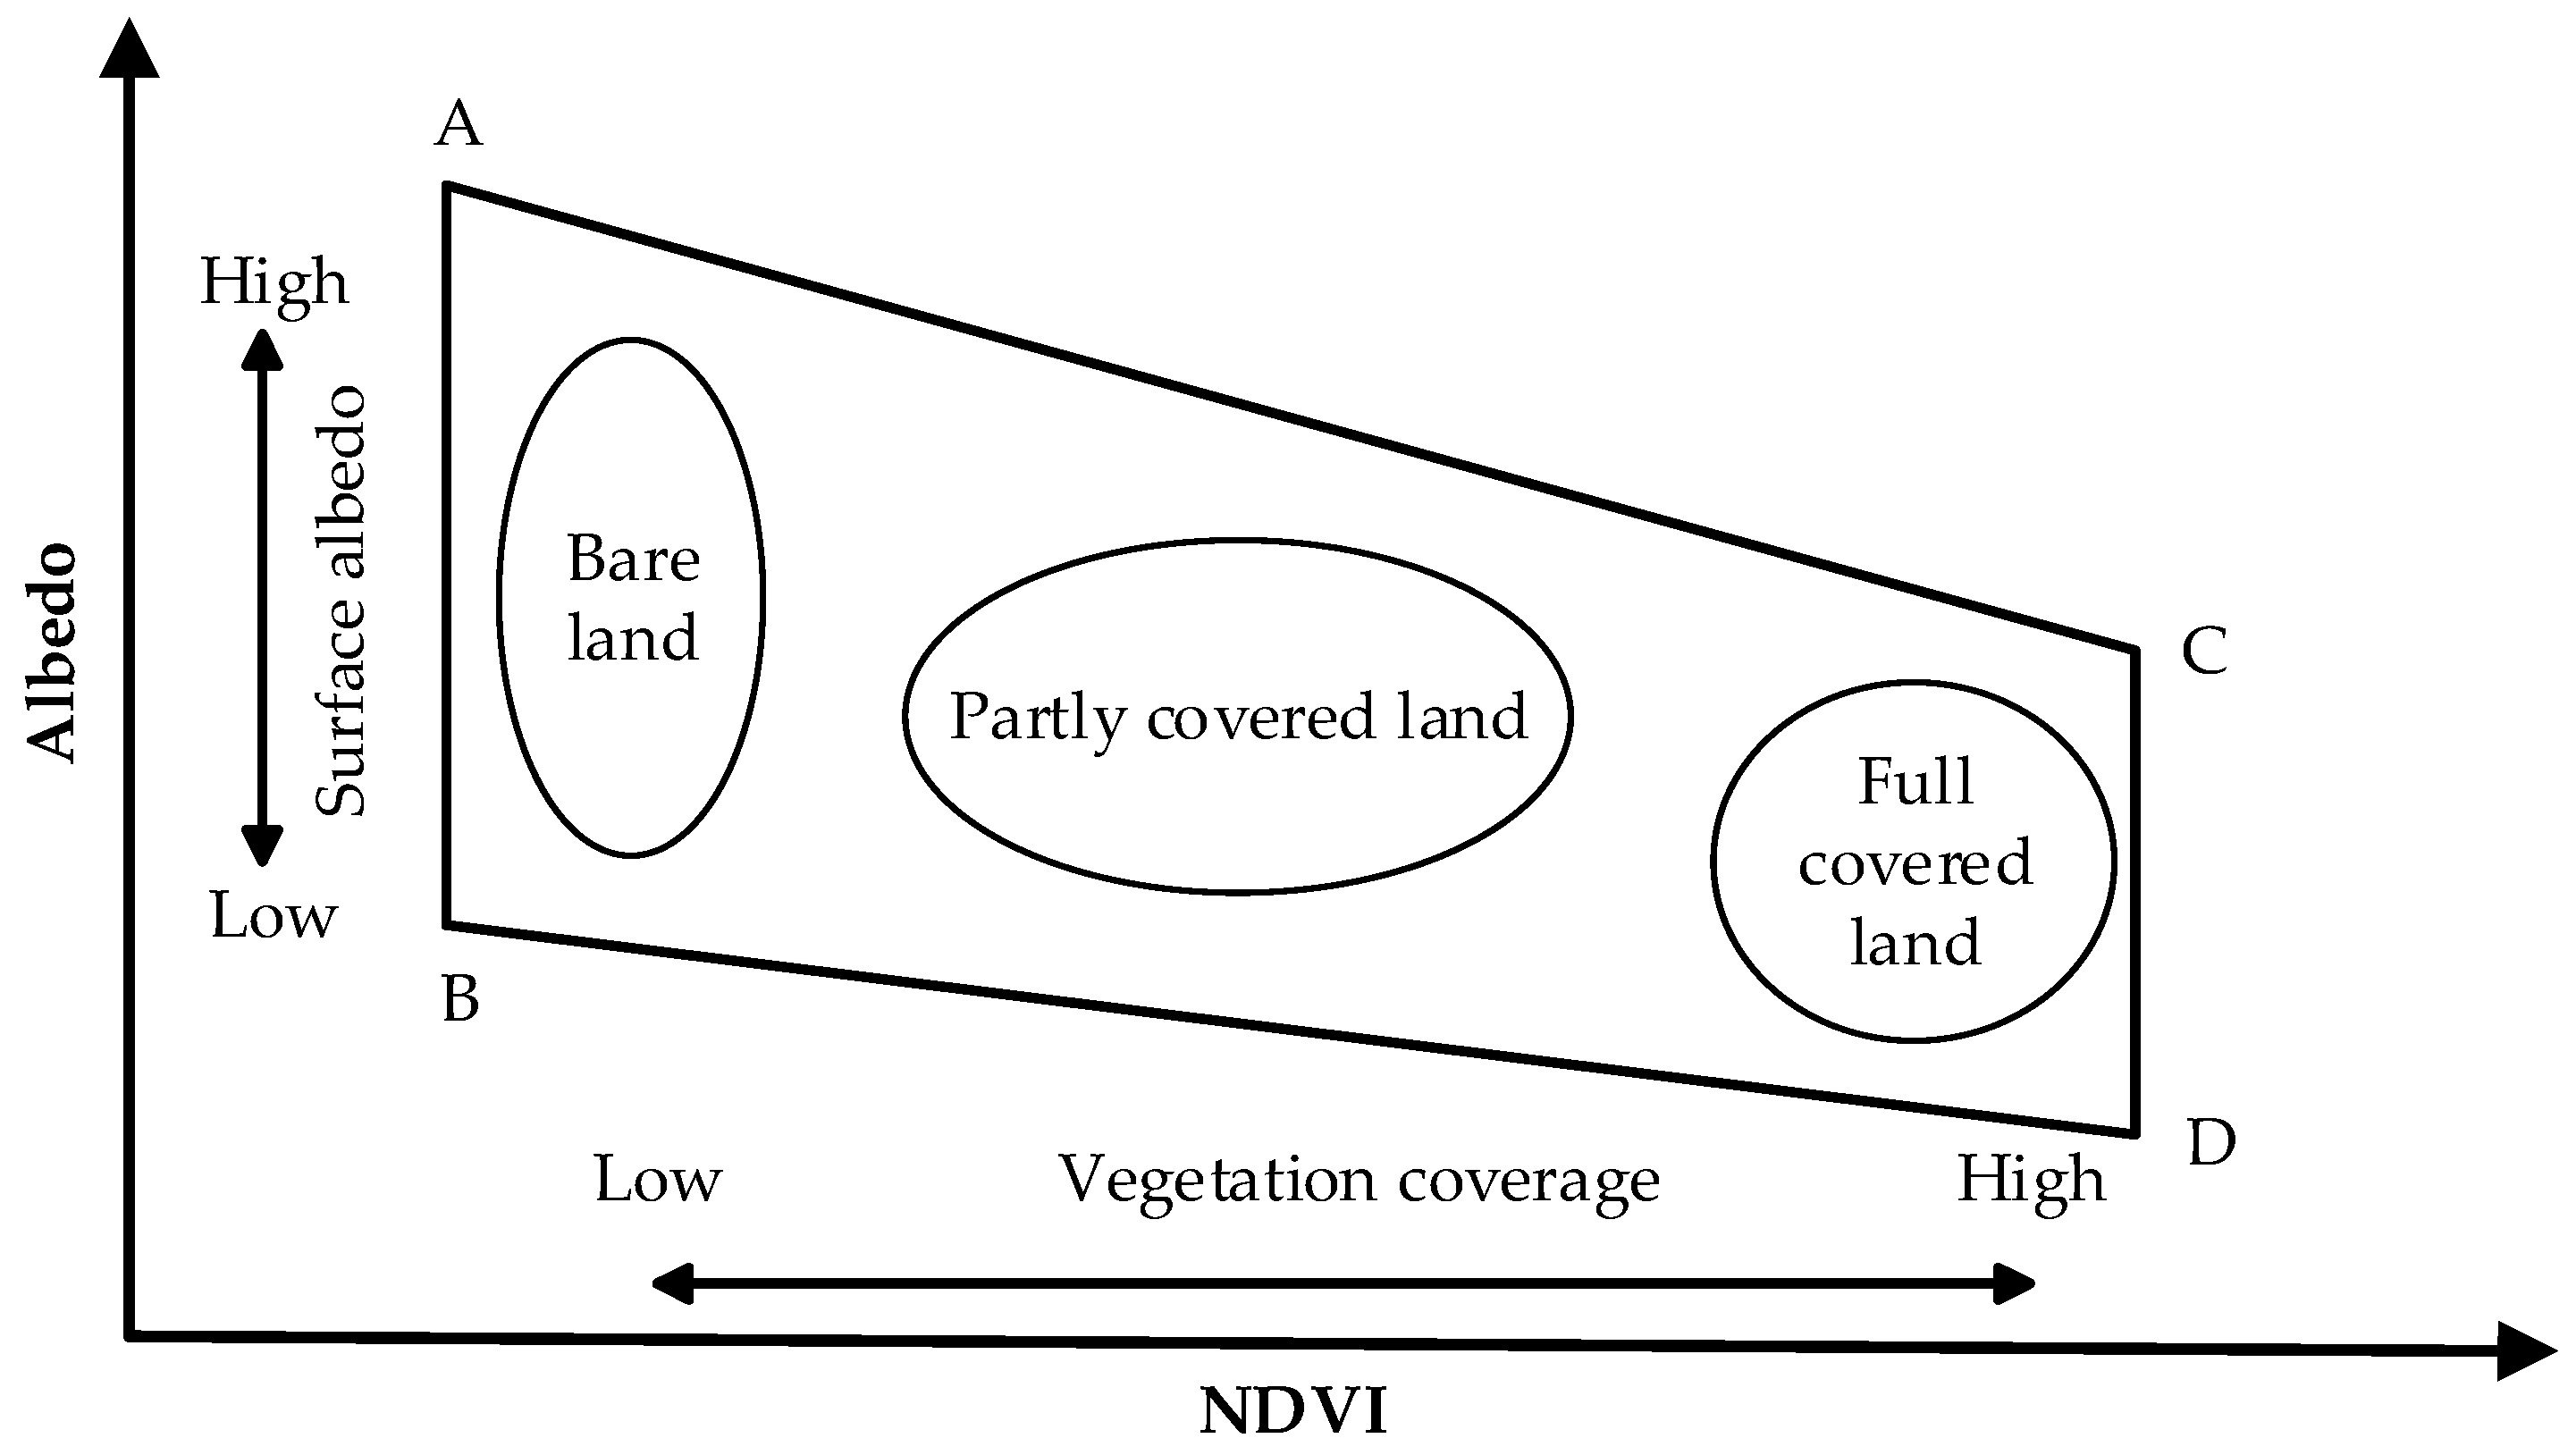
2.3.1. Principles of Feature Space

Long-term studies have shown that with an increase in desertification, the amount of surface vegetation gradually decreases, and the NDVI values decreases accordingly. Therefore, NDVI can be used as an important index to evaluate desertification. Albedo is one of the most important parameters of the radiation energy balance on the ground, and its values can be changed by soil moisture, vegetation cover, snow cover, and other land surface conditions. Field verification reveals that with an increase in the degree of desertification, the surface morphology changes, the surface roughness decreases, and the surface albedo increases continuously [26,27]. As shown in Figure 2 [28], there is a significant negative correlation between the NDVI and albedo in different desertification areas. In the figure, AC represents the high albedo line and reflects the drought situation, which is the limit of high albedo corresponding to the complete arid land under certain vegetation coverage [13]. BD represents the low albedo line, which involves a sufficient amount of surface water. A, B, C, and D represents four extreme states. In general, all types of ground objects are contained in the ABCD area and exhibit different spatial distribution patterns.
Therefore, the Albedo-NDVI feature space can be constructed to invert the variation characteristics of two-dimensional space composed of NDVI and albedo in the desertification process, and to effectively extract information regarding desertification.

2.3.2. The Construction of Feature Space

(1) Pre-processing
A number of steps were involved in the pre-processing of our data. First, remote sensing images selected were pre-processed, including radiometric correction, and atmospheric correction. Radiation correction is the process of eliminating all kinds of distortion in image data [29]. In this study, the radiometric calibration module in ENVI 5.1 was used to achieve radiation correction. Atmospheric correction is the process of eliminating the radiation error caused by atmospheric influence and retrieving the true surface reflectance of ground objects [30]. This was completed using the FLASSH module in ENVI 5.1. Before atmospheric correction, the sensor type, ground elevation, image generation time, atmospheric model parameters, and result of radiation correction should be added successively in this module. Finally, with the help of vector data from the Mongolian administrative division, the remote sensing images were clipped and mosaicked to synthesize the image map covering the entire study area.
(2) Feature space variables
Based on pre-processed Landsat 8 OLI images, we calculated the NDVI, MSAVI, TGSI, and albedo using the reflectance data of red, near infrared, blue, green, and short wave infrared band.
The formula for NDVI is as follows [31]:
NDVI = ( NIR RED ) / ( NIR + RED ) ,
where NIR is near infrared band and RED is red band.
The formula for MSAVI is as follows [32]:
MSAVI = ( 2 NIR + 1 ( 2 NIR + 1 ) 2 8 ( NIR RED ) ) / 2 ,
The formula for TGSI is as follows [33]:
TGSI = ( RED BLUE ) / ( RED + BLUE + GREEN ) ,
where BLUE is blue band and GREEN is green band.
The formula for albedo is as follows [34]:
Albedo = 0.356 BLUE + 0.13 RED + 0.373 NIR + 0.085 SWIR 1 + 0.072 SWIR 2 0.0018 ,
where SWIR1 and SWIR2 are the shortwave infrared bands.
(3) Data normalization processing
First, we identified the maximum and minimum values of NDVI, MSAVI, TGSI and albedo of the study area, and then used these to process the data normalization processing.
N = [ ( NDVI NDVI m i n ) / ( NDVI m a x NDVI m i n ) ] × 100 % ,
M = [ ( MSAVI MSAVI m i n ) / ( TGSI m a x TGSI m i n ) ] × 100 % ,
T = [ ( TGSI TGSI m i n ) / ( TGSI m a x TGSI m i n ) ] × 100 % ,
A = [ ( Albedo Albedo m i n ) / ( Albedo m a x Albedo m i n ) ] × 100 % ,
(4) Quantitative relation calculation
In order to further reveal the relationship between multiple feature space variables, we uniformly arranged 738 points in the whole study area, and the corresponding points values of NDVI, MSAVI, TGSI, and albedo were extracted. Then, SPSS software was used for the statistical regression analysis of the four feature space variables and to investigate their quantitative relations with each other. Finally, we selected three groups of highly correlated feature space variables to construct the feature space models of Albedo-NDVI, Albedo-MSAVI, and Albedo-TGSI.

2.3.3. Classification of Desertification

According to the research conclusions made by Verstraete and Pinty in 1996, different desertification lands can be effectively separated by dividing the Albedo-NDVI feature space in the vertical direction into changing trends of desertification [35]. In addition, the location of the vertical direction in Albedo-NDVI feature space can be well fitted by a simple binary linear polynomial expression as follows:
DDI = K × NDVI Albedo ,
where “DDI” was the desertification divided index and K was determined by the slope of the straight line fitted in the feature space.
According to the research conclusions made by Ma et al. in 2011, DDI values can be divided into five different levels by the natural break (Jenks) classification [28]. These five desertification levels are severe desertification, high desertification, medium desertification, low desertification, and non-desertification. The natural break classification method is based on natural grouping inherent in the data, and its boundary is set to the position where the data values are relatively different [36]. The method computes each kind of classification situation, and automatically selects the classification situation with the minimum variance values, so as to obtain the optimal classification result. In addition, it effectively aggregates similar classes and maximizes the differences between classes. Finally, the Albedo-MSAVI and Albedo-TGSI feature space models were constructed using the same method to extract desertification information. To make the results of extracting desertification information more realistic, it is necessary to separate the information regarding sand and water from other desertification information. In general, the reflectance of sand in each band (excluding the thermal infrared band) is high. When the reflectance data of multiple bands are added together, the sand must be the highest. Therefore, we can use this feature to extract sand information. When the feature space model is used to extract desertification information, water is usually classified as non-desertification and low desertification. However, in order to obtain more realistic and objective classification results, we suggest extracting water from non-desertification or low desertification areas. In 2007, Bao et al. found that the albedo of water was much lower than that of vegetation cover [37]. Therefore, we can make use of this feature to extract information on water.
For the process of extracting sand information, we first summed up the reflectance of the blue, green, red, nir, swir1, and swir2 bands, and obtained the multi-band synthetic remote sensing images. Then, the synthetic images were classified into six categoriesusing the natural break classification method and the category with the highest values could be identified as sand.
For the process of extraction water information, we used the Albedo-NDVI and Albedo-TGSI feature space models to extract the desertification information, and then identify water by its classification as “non-desertification”. When we used the Albedo-MSAVI feature space model to extract the desertification information, water was usually classified as low desertification. Therefore, we used the natural break classification to divide water from non-desertification and low desertification areas, respectively.

2.3.4. Accuracy Assessment and Comparison

To verify the accuracy of the models, 375 verification points were uniformly selected throughout the study area. Then, the verification points were interpreted by visual interpretation based on Landsat 8 true color images and a Google Earth map. Finally, we constructed the confusion matrix and acquired the producer, user and overall classification accuracy as well as the Kappa coefficient. The producer accuracy is the number of correctly classified samples of a particular category divided by the total number of reference samples for that category; the User’s Accuracy is the number of correctly classified samples of a particular category divided by the total number of samples being classified as that category [38]. The overall classification accuracy was calculated by the confusion matrix, which is equal to the sum of correctly classified pixels divided by the total number of pixels [39]. The calculation of the Kappa coefficient was also based on the confusion matrix. The results of the three feature space models were compared to the 2007 desertification status map of Mongolia as well as the 2015 land cover map of Mongolia. The obvious feature differences were investigated and discussed.

3. Results

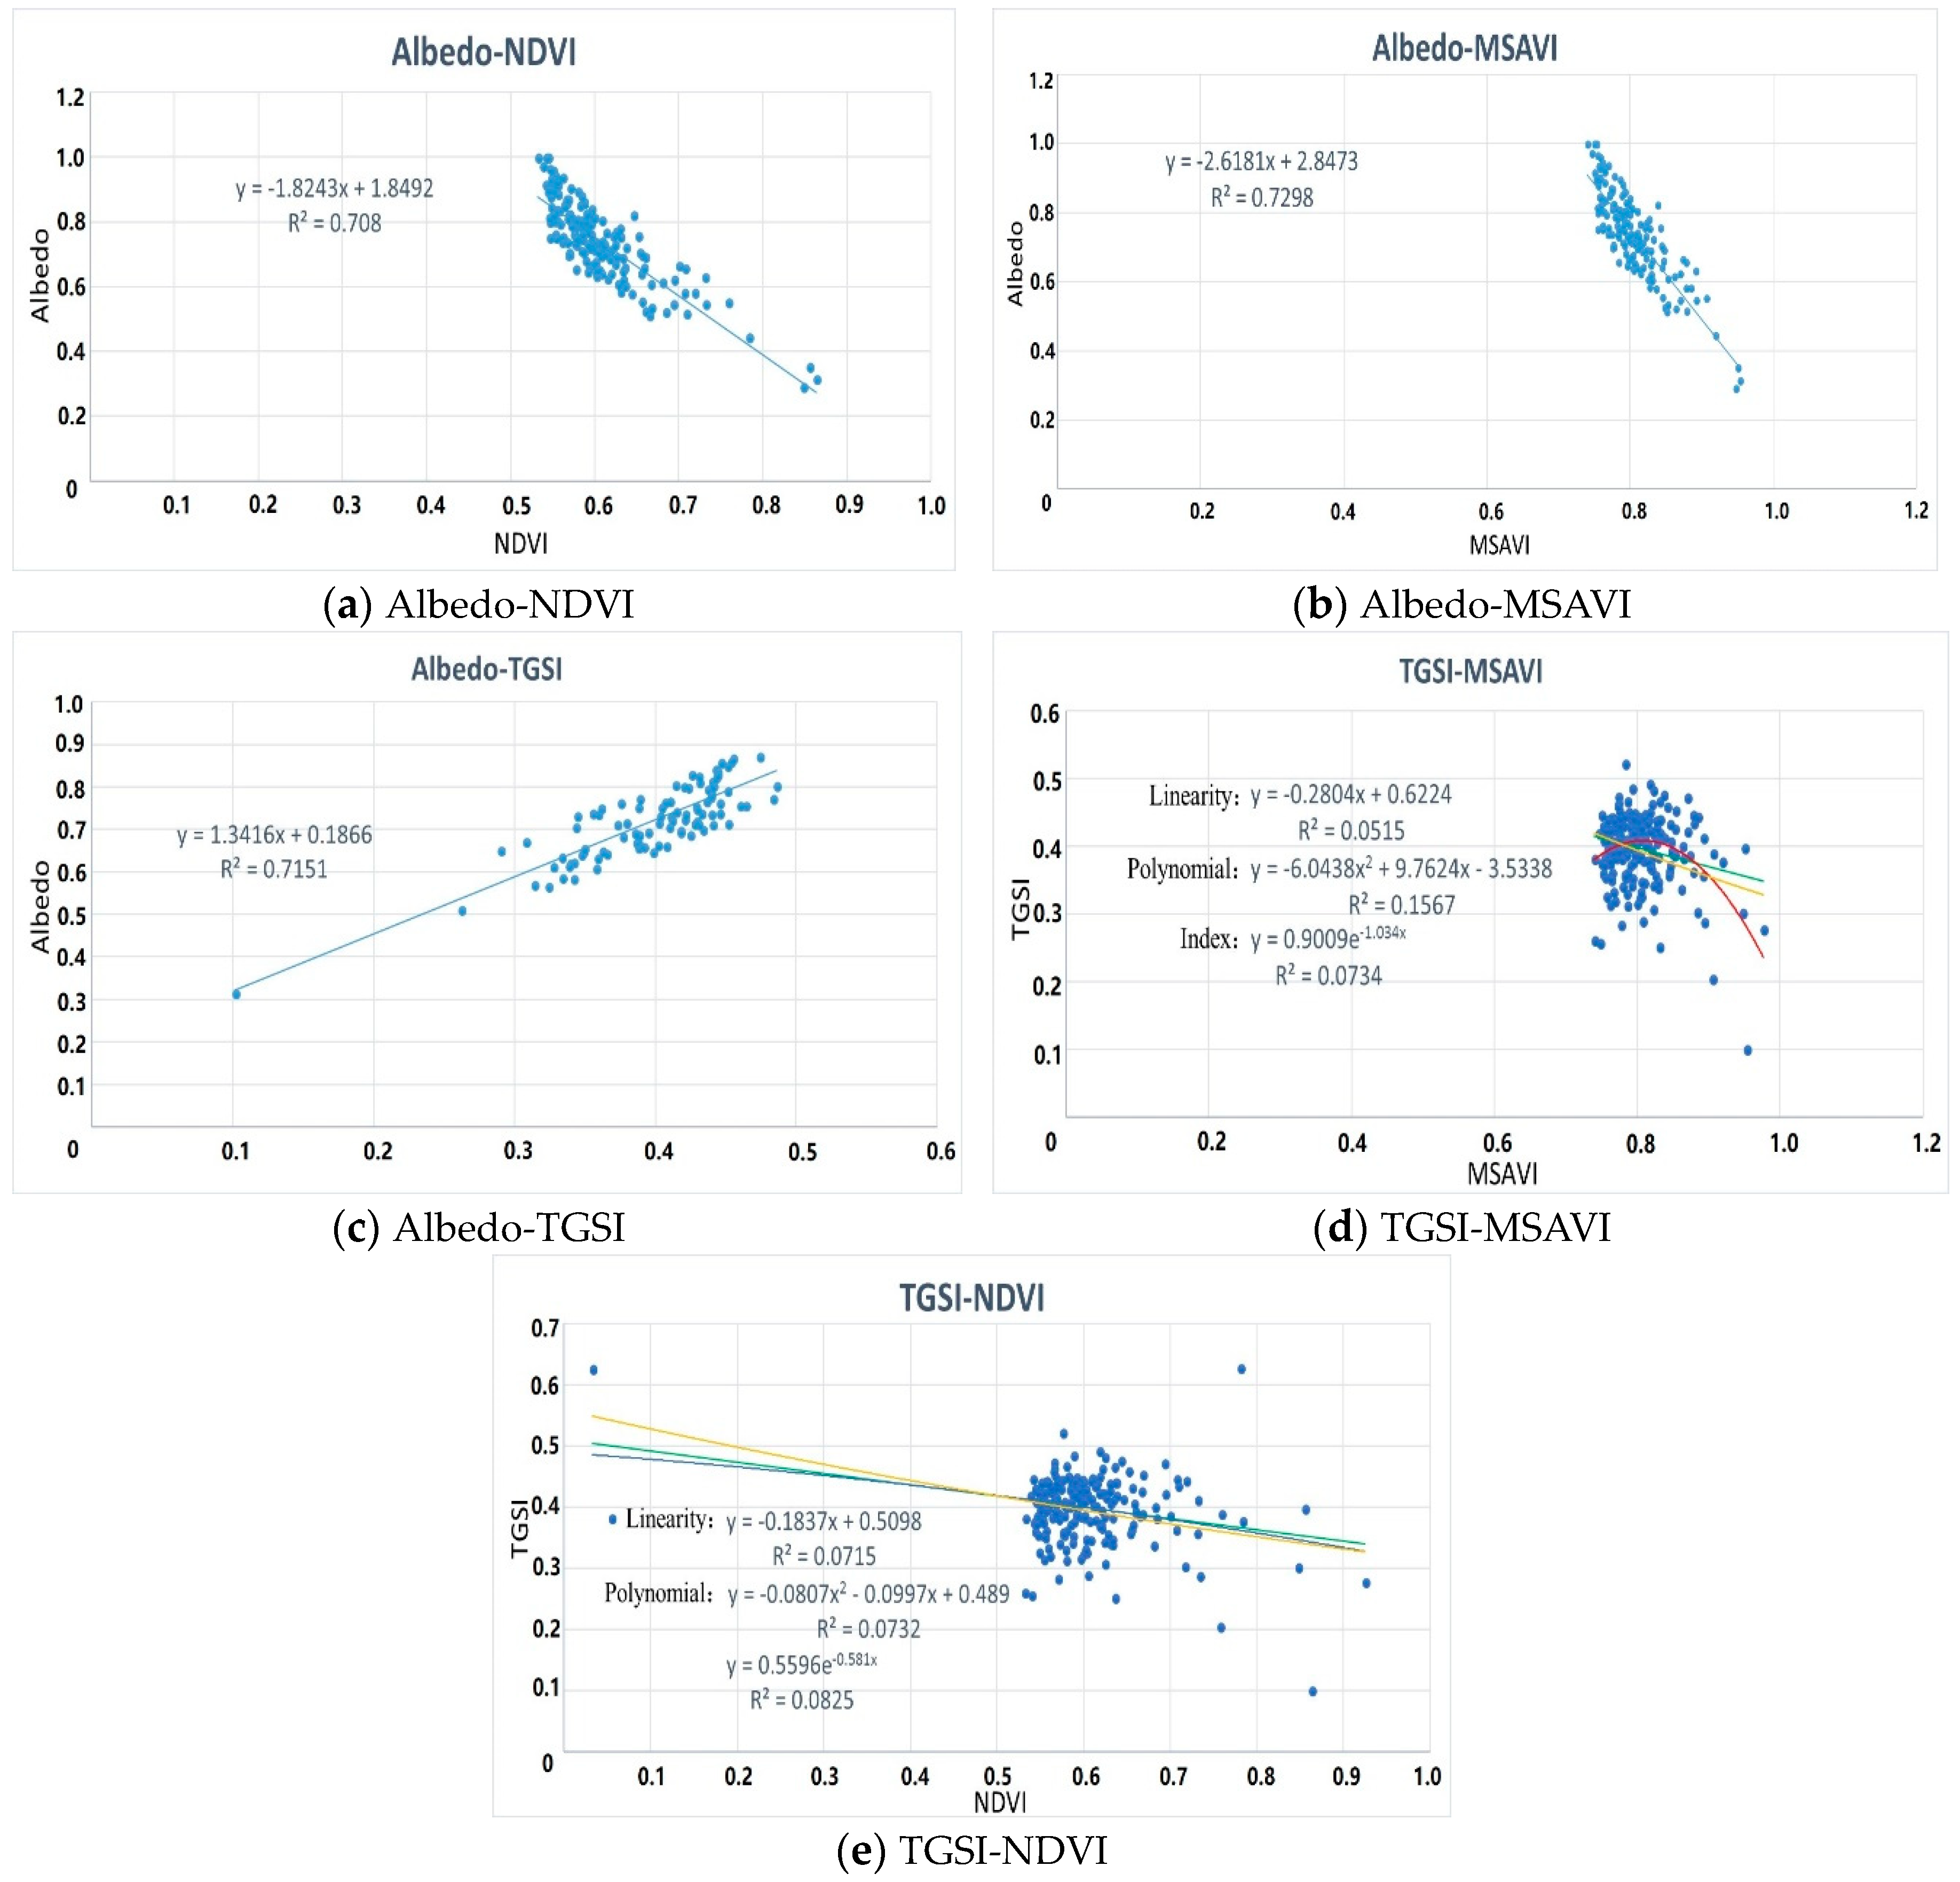
3.1. Quantitative Relationships among Feature Space Variables

The linear formula and correlation coefficient results of the four feature space variables (NDVI, MSAVI, TGSI, and albedo) are shown in Figure 3a–e. Here, it shows that the albedo has a significant negative correlation with NDVI and MSAVI, with correlation indexes of 0.708 and 0.7298, respectively (Figure 3a,b), while TGSI has a positive correlation with a correlation index of 0.7151 (Figure 3c). The linear and nonlinear relationships between TGSI and NDVI as well as MSAVI are extremely weak, both of which are less than 0.2 (Figure 3d,e). Therefore, the three sets of feature space variables with the strongest correlation were selected to construct the feature space models of Albedo-NDVI, Albedo-MSAVI, and Albedo-TGSI, respectively.

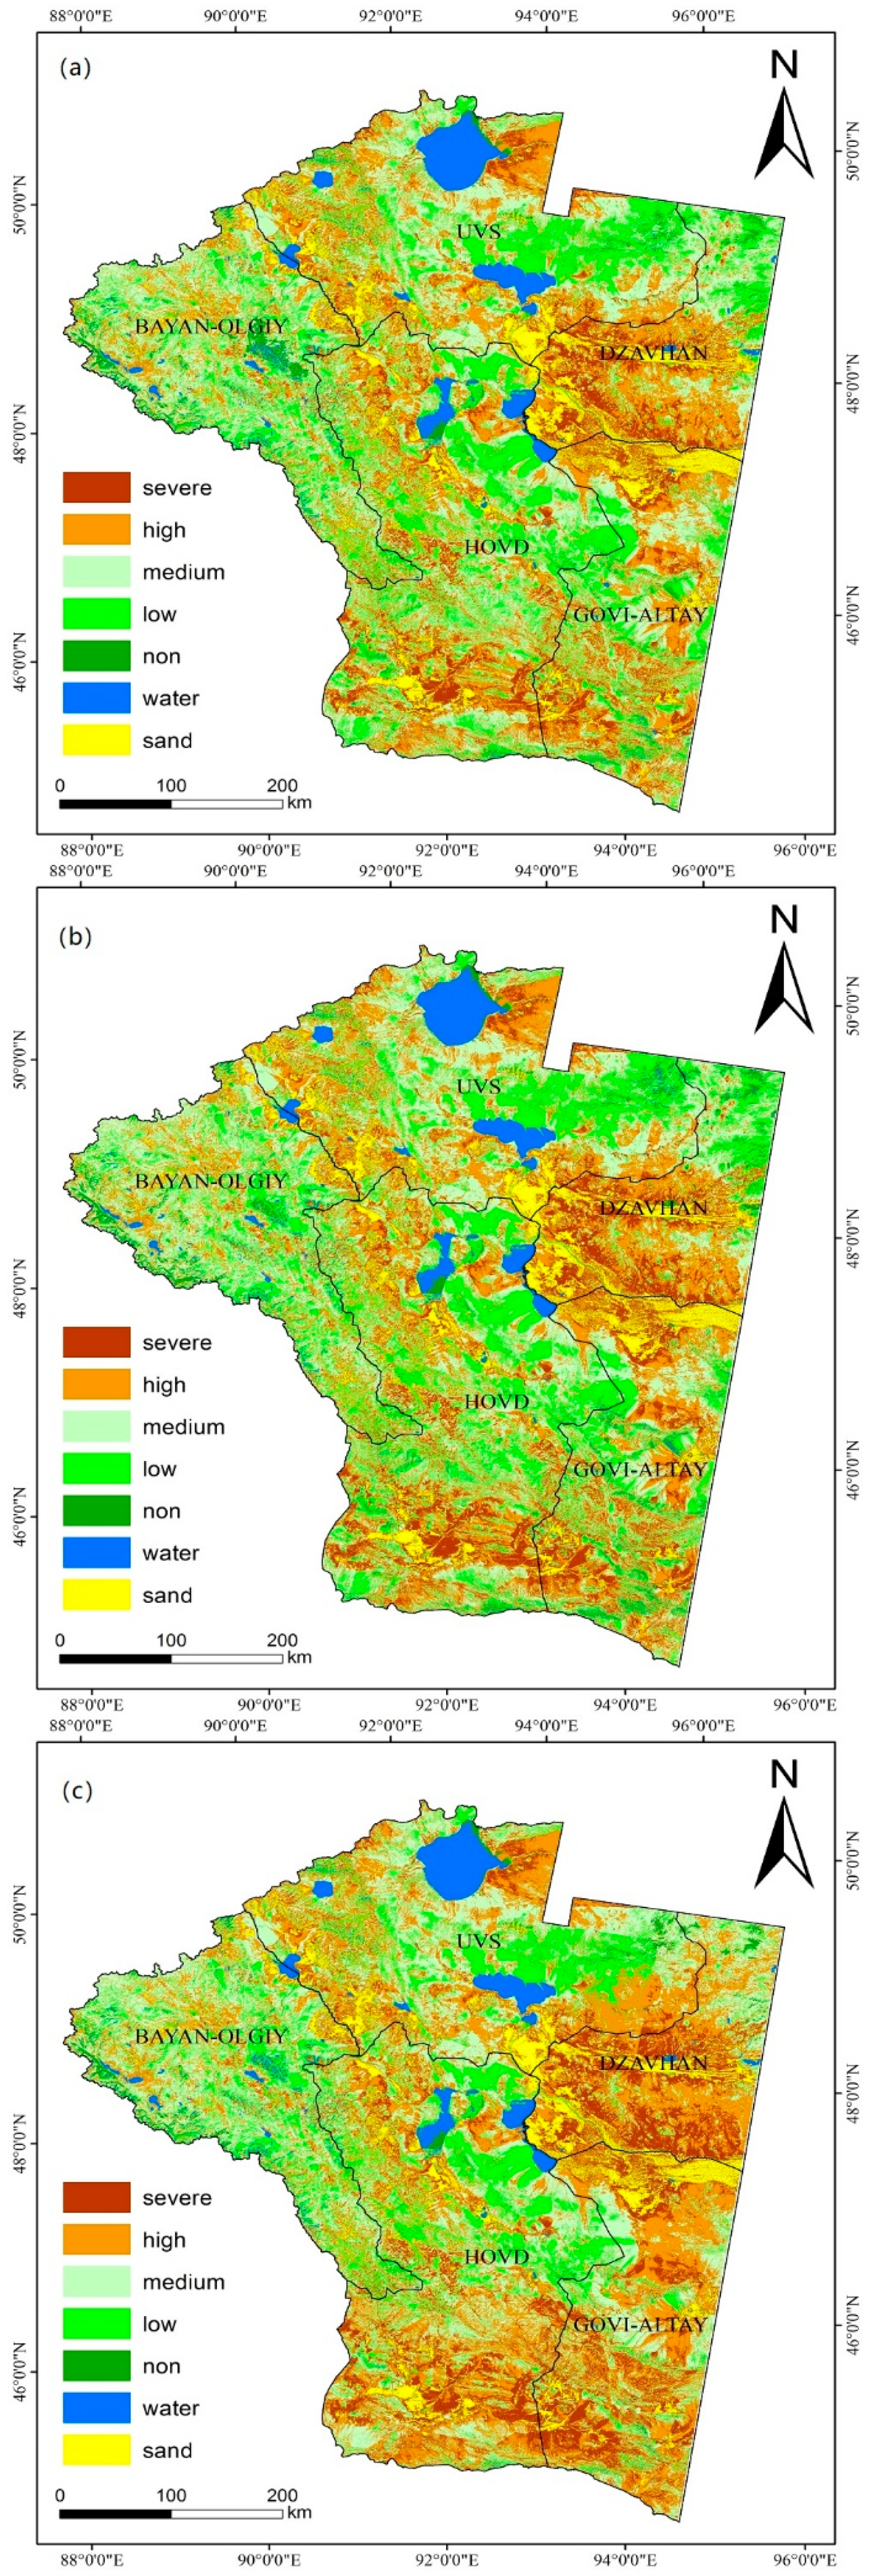
3.2. Results and Comparison

Table 1 shows the K values of the three feature space models. Table 2 indicates the range of DDI values for different desertification areas. The K values and the range of DDI values in the various desertification areas are different for the three feature space models. These include the highest albedo values, the lowest NDVI values, and almost no vegetation coverage in the severe desertification areas. However, the non-desertification areas covered by vegetation have the highest NDVI and the lowest albedo values.
The area and spatial distribution of desertification differed according to the feature space model used, as shown in Table 3 and Figure 4. Table 3 represents the statistics of the extraction results regarding desertification. Figure 4 shows the spatial distribution characteristics of desertification areas as extracted by the different models.
Figure 4a shows the results of desertification information extracted from the Albedo-NDVI feature space model. The area of desertification extracted from this model accounts for 86.20% of the total area, of which severe desertification accounts for 11.47%, high desertification accounts for 23.78%, medium desertification accounts for 31.92%, low desertification accounts for 19.03%, non-desertification accounts for 2.24%, water accounts for 3.63%, and sand accounts for 7.93% of the total area. The figure shows that non-desertification areas are mainly distributed along the Eastern and Western borders of Bayan-Olgii province, the Eastern mountainous areas of Uvs province, the Northern mountainous areas of Zavkhan province, and scattered areas in the sporadic Northern areas of Khovd province. Low desertification areas are widely distributed in Bayan-Olgii province, the central part of Uvs province, the central part of Khovd province, and near the lakes found within the study area. Medium desertification areas are evenly distributed in Bayan-Olgii province and Uvs province, whilst high desertification areas are mainly distributed in the Southwestern part of Zavkhan province, in Govi-Altai province, the Southern part of Khovd province, the central part of Bayan-Olgii province, east of Uvs lake, and in a ribbon stretching from the Northwest to the Southeast of the Western part of Uvs province and Khovd province. Most of the severe desertification areas are accompanied by high desertification, mainly distributed in Southwestern Zavkhan province, southern Khovd province, Northern and Southern Govi-Altai province, east of Uvs lakes, and adjacent to the sandy areas. At the same time, land degradation has begun in the areas around rivers and lakes, and most of these have become low or medium desertification areas.
Figure 4b is the result of desertification information extraction based on the Albedo-MSAVI feature space model. The area of desertification extracted from this model accounts for 85.72% of the total area, of which severe desertification accounts for 12.51%, high desertification accounts for 22.82%, medium desertification accounts for 30.66%, low desertification accounts for 19.73%, non-desertification accounts for 2.58%, water accounts for 3.77%, and sand accounts for 7.93%. This figure shows that the spatial distribution of various ground objects as obtained by the Albedo-MSAVI model is basically similar to that of the Albedo-NDVI model. The difference between the two methods is that the non-desertification and low desertification areas extracted by Albedo-MSAVI are larger, while the medium and high desertification areas extracted by Albedo-MSAVI are smaller than those extracted by the Albedo-NDVI model.
Figure 4c is the result of desertification information extraction based on the Albedo-TGSI feature space model. The area of desertification extracted from this model accounts for 86.99% of the total area, of which severe desertification accounts for 14.63%, high desertification accounts for 27.87%, medium desertification accounts for 29.52%, low desertification accounts for 14.97%, non-desertification accounts for 1.53%, water accounts for 3.55%, and sand accounts for 7.93%. These results show that the non-desertification areas are mainly distributed along the Western border of Bayan-Olgii province, the Northeastern parts of Uvs province, and a small area within the Northern region of Zavkhan province. Low desertification areas are widely distributed in the mountainous areas of the central part of Bayan-Olgii province, the central part of Uvs province, and near the lakes in Khovd province. The medium desertification areas are distributed in the western part of Govi-Altai province, the central part of Khovd province, and the Northeastern part of Uvs province. High desertification areas are mainly distributed in the southern parts of Zavkhan province, Govi-Altai province, Southern Khovd province, the central part of Bayan-Olgii province, and east of Uvs lake. Most severe desertification areas are associated with high desertification, mainly in Southern Zavkhan province, Southern Khovd province, east of lake Uvs, and the adjacent sand areas. At the same time, land degradation has begun in areas near rivers and lakes in the region, and most of the areas, except those affected by sand, have undergone low or medium desertification.

3.3. Accuracy Assessment

Table 4 shows the confusion matrices of the three feature space models, and the specific classification accuracy is shown in Table 5. The results showed that the overall classification accuracy of the Albedo-NDVI model was 84.53% with a Kappa coefficient of 0.8046, Albedo-MSAVI model was 85.60% with a Kappa coefficient of 0.8193, and Albedo-TGSI model was 88.27% with a Kappa coefficient of 0.8518. The producer and user accuracy of each type of ground object extracted by the Albedo-NDVI model were 75.00% and 96.43% for severe desertification, 84.54% and 88.17% for high desertification, 87.18% and 83.61% for medium desertification, 84.31% and 70.49% for low desertification, 68.42%and 76.47% for non-desertification, 89.47% and 94.44% for water, and 91.67% and 91.67% for sand. The producer and user accuracy of each type of ground object extracted by the Albedo-MSAVI model was 80.56% and 90.63% for severe desertification, 83.51% and 91.01% for high desertification, 86.32% and 87.83% for medium desertification, 88.24% and 69.23% for low desertification, 78.95% and 75.00% for non-desertification, 94.74% and 94.74% for water, and 88.89% and 91.43% for sand. The producer and user accuracy of each type of ground object extracted by the Albedo-TGSI model was 88.89% and 91.43% for severe desertification, 90.72% and 92.63% for high desertification, 90.60% and 87.60% for medium desertification, 80.39% and 75.93% for low desertification, 73.68% and 87.50% for non-desertification, 89.47% and 94.44% for water, and 91.67% and 91.67% for sand. Therefore, we found that the three models mentioned in this study have a relatively high classification accuracy. The overall classification accuracy of the Albedo-TGSI model, the producer accuracy of severe desertification and high desertification areas, and the Kappa coefficient were the highest. The overall classification accuracy of the Albedo-MSAVI model was slightly higher than that of the Albedo-NDVI model. At the same time, the Albedo-MSAVI model had the highest producer accuracy for non-desertification and low desertification areas.

4. Discussion

In desertification extraction studies, researchers have tried to extract information by deciphering ground cover types. In terms of the landscape pattern, the land covers in desertification areas are usually classified as desert steppe and barren. However, when the desertification information is obtained through the interpretation of land cover, it is often interpreted from a macroscopic perspective. In this study, the results of Albedo-NDVI, Albedo-MSAVI, and Albedo-TGSI were compared to the 2015 Mongolia land cover classification map. The contrasting results showed that the desertification area obtained by image interpretation accounts for 81.43% of the total area, which is lower than the desertification extraction results in this study. The land cover interpretation is not being sensitive enough regarding low quality vegetation information, resulting in the misclassification of some land cover information, such as desert steppe and barren areas. When the vegetation coverage of desert steppe remained at about 10% (using the land cover classification map of Mongolia), it was very similar to the real steppe with low coverage. In addition, it was easily classifiable as real steppe, leading to an underestimation in the area of desertification. When the vegetation coverage of desert steppe was reduced to about 5%, the similarity with land classified as barren became high. In the 30-m resolution image, it was difficult to distinguish between desert steppe and barren, resulting in the overestimation of severe desertification and high desertification, and the underestimation of medium desertification. Therefore, the actual results of the desertification area in this region should be greater than 81.43%, as indicated on the land cover interpretation map. In addition, it is more similar to the results of the above three models.
Figure 5 represents a comparison of the land cover interpretation product and the Albedo-MSAVI model inversion results. Figure 5a,b do not represent the same type of results, with (a) being a land cover map reflecting desertification or non-desertification land cover types, while (b) is a model inversion result showing the degree of desertification. As desertification will inevitably lead to changes in land object types and special land cover types, land cover maps can, indirectly reflect the present situation of desertification. From our study, we found that the similarity between water- and sand information obtained by the two different methods was high, but the results of other land objects were quite different. Through visual comparison, five zones with significant differences were selected in Figure 5. Regarding Zone 1, the non-desertification areas in the Eastern part of Uvs province and the Western part of Zavkhan province differed greatly. The results of the land cover map based on eCognition software showed much greater non-desertification than those of the distribution map, showing different degrees of desertification. For Zone 2, the results of the Albedo-MSAVI retrieval showed that the Southern part of Zavkhan province mainly exhibited areas of severe and high desertification, while the interpretation of images suggested that half of the Southern part of Zavkhan province consisted of non-desertification areas (interpretation classified as real steppe). With regards to Zone 3, the interpretation of images showed that the Southern part of Uvs province was barren, portraying areas of high and severe desertification. However, the Albedo-MSAVI model exhibited far fewer areas of high desertification than the interpretation of the image in the high desertification region. For Zone 4, the retrieved results of the Albedo-MSAVI model showed that the area East of Uvs Lake was mainly an area that contained high and severe desertification. However, the interpretation results showed that the degree of desertification in this region was relatively light (interpretation classified this area as desert steppe). For Zone 5, the land cover map showed that most of the areas of Khovd province and the Southern part of Govi-Altai province were barren, namely, the areas of high and severe desertification. On the other hand, the distribution map of the degree of desertification showed far fewer barren areas than the remote sensing image interpretation results in the high desertification region.
The results obtained from this study were very similar to the desertification data released by Mongolia. The 2007 desertification data of Mongolia also shows that the high and severe areas of desertification are strip-shaped and extend from the Northwest to the Southeast. Land degradation was indicated to have begun near the country’s rivers and lakes, most of which had become areas of low desertification [3]. The area selected for this study lies in the Northwestern part of Mongolia, associated with serious desertification. In this region, there is less area that is covered by forests and steppe grasslands. Therefore, the actual desertification situation in the region should be higher than the average desertification level of 76.8% announced by Mongolia in 2017 [4]. It may be closer to the results of this study.
Compared to previous studies on the extraction of desertification information, the data sources chosen in this study have a higher resolution, and a variety of surface reference variables were introduced to build corresponding feature spaces. Previous studies on desertification mostly used MODIS data as the basic data source to extract large-scale desertification information [40,41,42]. However, the spatial resolution of MODIS data is 500 m, making the retrieval of fine detail difficult. Therefore, Landsat 8 images with a spatial resolution of 30 m, as used in this study, can greatly increase the level of detailed information and thereby, improve accuracy. Furthermore, most other studies on the extraction of desertification information, involved a variety of indexes that were chosen to form a decision tree classification or to construct an Albedo-NDVI feature space [43,44,45]. In this study, MSAVI and TGSI were introduced to replace NDVI to build different models, and the results were more accurate than the single Albedo-NDVI model.
A comparison of the results from the three models reveals that the effects of desertification extracted by each method differs, but each method has its own advantages in extracting desertification information at different levels. The Albedo-TGSI model was used to extract the largest area of desertification, accounting for 86.99% of the total area, followed by the Albedo-NDVI model at about 86.20%, and the Albedo-MSAVI model at about 85.72%. At the same time, the area and accuracy of severe and high desertification areas extracted by the Albedo-TGSI model were the highest, far exceeding the results obtained by the Albedo-NDVI and Albedo-MSAVI models. Its spatial distribution extends from the Southwestern part of Zavkhan province to a wide area in the Southern part of Zavkhan province and from the Southern part of Khovd province and parts of Govi-Altai province to cover most of Khovd province and the Southern part of Govi-Altai province. However, the areas of medium desertification, low desertification, and non-desertification extracted by the Albedo-TGSI model were smaller than those obtained by the other two methods. The spatial changes were mainly reflected in the disappearance of the scattered non-desertification areas in the Northern part of Khovd province and the decrease in both the low and medium desertification levels. A comparison between Albedo-NDVI and Albedo-MSAVI showed that the results of the two classifications were highly similar. However, the areas of non-desertification, low desertification, and water extracted by the Albedo-MSAVI model were all larger than those obtained by the Albedo-NDVI. The accuracy of non-desertification, low desertification, and water extracted by the Albedo-MSAVI was far higher than that of the other two models. Thus, we can conclude that the Albedo-MSAVI model is the most sensitive to vegetation under the condition of low vegetation coverage. In addition, this model can fully extractinformation relating to areas of non-desertification and low desertification. The Albedo-TGSI model has the highest sensitivity to surface soil changes and can fully extract information relating to areas of high and severe desertification. Presently, the Albedo-NDVI model is a widely accepted model and can be used to accurately acquire desertification information in regions with higher vegetation coverage.

5. Conclusions

By constructing the feature space models of Albedo-NDVI, Albedo-MSAVI, and Albedo-TGSI, this study, with a high resolution (30 m), has obtained the results regarding the extraction of desertification information of Northwestern Mongolia, analyzed the mechanism of three feature space models, and compared these with previous studies on desertification information extraction. This study has proven that it is feasible to extract desertification information using the feature space models of Albedo-NDVI, Albedo-MSAVI, and Albedo-TGSI. Moreover, these models are preferable to the traditional method of extracting desertification information by land cover classification. In addition, the results of the different desertification extraction models vary. Therefore, in the vast area that comprises the Mongolian plateau, different methods for the extraction of desertification information should be chosen for different regions and different surface features. The traditional Albedo-NDVI model can be used in areas with high vegetation coverage and high forest ratios (such as the Northern and Eastern parts of the Mongolian plateau). The Albedo-MSAVI model can be used to extract desertification information in areas with relatively low vegetation coverage on the Mongolian Plateau (such as the Western Mongolian Plateau and Eastern Mongolia). The Albedo-TGSI model can be used for regions with extremely low vegetation coverage and for the widely distributed Gobi Desert and bare land (such as the Southwestern regions of the Mongolian plateau). Based on the three models and the land cover characteristics of the Mongolian plateau, dynamic monitoring of desertification on the Mongolian plateau can be realized in the future.

Author Contributions

H.W. drafted the manuscript and was responsible for data preparation, experiment, and analysis. J.W. was responsible for the research design and analysis, and designed and reviewed the manuscript. K.C. and G.L. participated in data collection. A.O., S.C. and D.D. organized and participated in the field work of the study. All authors contributed to the editing and reviewing of the manuscript.

Funding

This research was funded by the Strategic Priority Research Program (Class A) of the Chinese Academy of Sciences grant number XDA19040501 and XDA2003020302, the Department of Research and Innovation, National University of Mongolia grant number P2017-2396, the 13th Five-year Informatization Plan of Chinese Academy of Sciences grant number XXH13505-07, and the Construction Project of the China Knowledge Center for Engineering Sciences and Technology grant number CKCEST-2018-2-8. And the APC was funded by the Strategic Priority Research Program (Class A) of the Chinese Academy of Sciences grant number XDA19040501.

Acknowledgments

We wish to thank the editor of this journal and the anonymous reviewers during the revision process.

Conflicts of Interest

The authors declare no conflict of interest.

References

  1. Chang, S.; Wu, B.; Yan, N.; Davdai, B.; Nasanbat, E. Suitability assessment of satellite-derived drought indices for Mongolian grassland. J. Remote Sens. 2017, 9, 650. [Google Scholar] [CrossRef]
  2. Buren, G. Research on Current Status, Causes and Prospect of Desertification in Mongolia. Master’s Thesis, Inner Mongolia University, Inner Mongolia, China, 2011. [Google Scholar]
  3. Current Status of Desertification in Mongolia; Research Center on Desertification, Institute of Ecological Geography, Mongolian Academy of Sciences: Ulaanbaatar, Mongolia, 2007.
  4. Nearly 80% of Land in Mongolia Suffers from Desertification in Different Degrees. Available online: http://world.people.com.cn/n1/2017/0617/c1002-29345905.html (accessed on 11 December 2017).
  5. The Outline of the Plan for Building the Economic Corridor between China, Mongolia and Russia. Available online: http://www.ndrc.gov.cn/zcfb/zcfbghwb/201609/t20160912818326.html (accessed on 12 September 2018).
  6. Basso, F.; Bove, E.; Dumontet, S.; Ferrara, A.; Pisante, M.; Quaranta, G. Evaluating environmental sensitivity at the basin scale through the use of geographic information systems and remotely sensed data: An example covering the Agri basin (Southern Italy). J. Catena 2000, 40, 19–35. [Google Scholar] [CrossRef]
  7. Holm, A.M.; Cridland, S.W.; Roderick, M.L. The use of time-integrated NOAA NDVI data and rainfall to assess landscape degradation in the arid shrubland of Western Australia. J. Remote Sens. Environ. 2003, 85, 145–158. [Google Scholar] [CrossRef]
  8. Geerken, R.; Ilaiwi, M. Assessment of rangeland degradation and development of a strategy for rehabilitation. J. Remote Sens. Environ. 2004, 90, 490–504. [Google Scholar] [CrossRef]
  9. Wessels, K.J.; van den Bergh, F.; Scholes, R.J. Limits to detectability of land degradation by trend analysis of vegetation index data. J. Remote Sens. Environ. 2012, 125, 10–22. [Google Scholar] [CrossRef]
  10. Liang, S.L. Narrowband to broadband conversions of land surface albedo I algorithms. J. Remote Sens. Environ. 2001, 76, 213–238. [Google Scholar] [CrossRef]
  11. Robinove, C.J.; Chavez, P.S.; Gehring, D. Arid land monitoring using Landstat albedo difference images. J. Remote Sens. Environ. 1981, 11, 133–156. [Google Scholar] [CrossRef]
  12. Rasmussen, K.; Fog, B.; Madsen, J.E. Desertification in reverse? Observations from northern Burkina Faso. J. Glob. Environ. Chang. 2001, 11, 271–282. [Google Scholar] [CrossRef]
  13. Albalawi, E.K.; Kumar, L. Using remote sensing technology to detect, model and map desertification: A review. J. Food Agric. Environ. 2013, 11, 791–797. [Google Scholar]
  14. Guo, Q.; Fu, B.; Shi, P.; Cudahy, T.; Zhang, J.; Xu, H. Satellite monitoring the spatial-temporal dynamics of desertification in response to climate change and human activities across the Ordos Plateau, China. J. Remote Sens. 2017, 9, 525. [Google Scholar] [CrossRef]
  15. Zeng, Y.N.; Xiang, N.P.; Feng, Z.D.; Hu, H. Albedo-NDVI space and remote sensing synthesis index models for desertification monitoring. J. Sci. Geogr. Sin. 2006, 26, 75–81. [Google Scholar] [CrossRef]
  16. Qi, J.; Chehbouni, A.; Huete, A.R.; Kerr, Y.H.; Sorooshian, S. A modified soil adjusted vegetation index. J. Remote Sens Envrion. 2015, 48, 119–126. [Google Scholar] [CrossRef]
  17. Wu, X.T. Research and Application of Remote Sensing Monitoring Methods for Grassland Desertification. Master’s Thesis, Chinese Academy of Agricultural Sciences, Beijing, China, 2003. [Google Scholar]
  18. Feng, J.; Ding, J.L.; Wei, W.Y. Research on soil salinization in Weikui Oasis based on the characteristic space of Albedo-MSAVI. J. China Rural Water Hydropower 2018. [Google Scholar] [CrossRef]
  19. Vova, O.; Kappas, M.; Renchin, T.; Degener, J. Land degradation assessment in Gobi-Altai province. In Proceedings of the Trans-Disciplinary Research Conference: Building Resilience of Mongolian Rangelands, Ulaanbaatar, Mongolia, 9–10 June 2015. [Google Scholar]
  20. Zhu, Z.D.; Wang, T. An analysis on the trend of land dessertification in northern China duing the last decade based on examples from some typical areas. J. Acta Geogr. Sin. 1990. [Google Scholar] [CrossRef]
  21. Qing, S.; Gao, H.; Huang, C. Monitoring desertification processes in Mongolian Plateau using MODIS tasseled cap transformation and TGSI time series. J. Arid Land 2018, 10, 12–26. [Google Scholar] [CrossRef]
  22. Lamchin, M.; Lee, J.Y.; Lee, W.K.; Lee, E.J.; Kim, M.; Lim, C.H.; Choi, H.A.; Kim, S.R. Assessment of land cover change and desertification using remote sensing technology in a local region of Mongolia. J. Adv. Space Res. 2016, 57, 64–77. [Google Scholar] [CrossRef]
  23. Lamchin, M.; Lee, W.K.; Jeon, S.; Lamchin, M.; Lee, W.K.; Jeon, S.W.; Lee, J.Y.; Song, C.; Piao, D.; Lim, C.H.; et al. Correlation between Desertification and Environmental Variables Using Remote Sensing Techniques in Hogno Khaan, Mongolia. J. Sustain. 2017, 9, 581. [Google Scholar] [CrossRef]
  24. Population and Housing Census of Mongolia; National Statistical Office: Ulaanbaatar, Mongolia, 2010.
  25. Wang, J.L.; Cheng, K.; Zhu, J.X.; Liu, Q. Study and development of Mongolian land cover data products with 30 meters resolution and its pattern analysis. J. Geo-Inf. Sci. 2018, 20, 1263–1273. [Google Scholar] [CrossRef]
  26. Li, S.G.; Harazono, Y.; Oikawa, T.; Zhao, H.L.; He, Z.Y.; Chang, X.L. Grassland desertification by grazing and the resulting micrometeorological changes in inner Mongolia. J. Agric. For. Meteorol. 2000, 102, 125–137. [Google Scholar] [CrossRef]
  27. Wang, Y.; Yan, X. Climate change induced by Southern Hemisphere desertification. J. Phys. Chem. Earth 2017, 102, 40–47. [Google Scholar] [CrossRef]
  28. Ma, Z.; Xie, Y.; Jiao, J.; Wang, X. The Construction and Application of an Aledo-NDVI Based Desertification Monitoring Model. J. Procedia Environ. Sci. 2011, 10, 2029–2035. [Google Scholar] [CrossRef]
  29. Zhu, S.; Chen, Y. Methods for Atmospheric Radiation Correction. J. Geospat. Inf. 2010. [Google Scholar] [CrossRef]
  30. Zheng, W.; Zeng, Z.Y. A Review on Methods of Atmospheric Correction for Remote Sensing Images. J. Remote Sens. Inf. 2004, 4, 66–70. [Google Scholar] [CrossRef]
  31. Carlson, T.N.; Ripley, D.A. On the relation between NDVI, fractional vegetation cover, and leaf area index. J. Remote Sens. Environ. 1997, 62, 241–252. [Google Scholar] [CrossRef]
  32. Qi, J.; Chehouni, A.; Huete, A.R. A modified soil adjusted vegetation index. J. Remote Sens. Environ. 1994, 48, 119–126. [Google Scholar] [CrossRef]
  33. Xiao, J.; Shen, Y.; Tateishi, R.; Bayaer, W. Development of topsoil grain size index for monitoring desertification in arid land using remote sensing. Int. J. Remote Sens. 2006, 27, 2411–2422. [Google Scholar] [CrossRef]
  34. Liang, S.; Shuey, C.J.; Russ, A.L.; Fang, H.; Chen, M.; Walthall, C.L.; Daughtry, C.S.T.; Hunt, R., Jr. Narrowband to broadband conversions of land surface albedo: II. Validation. J. Remote Sens. Environ. 2003, 84, 25–41. [Google Scholar] [CrossRef]
  35. Michel, M. Verstraete and Bernard Pinty: Designing optimal spectral indexes for remote sensing applications. J. Remote Sens. Environ. 1996, 34, 1254–1265. [Google Scholar] [CrossRef]
  36. Zeng-Hai, W.U.; Tao, L.I. The comprehensive performance evaluation of the high-tech development zone: Analysis based on the natural breakpoint method. J. Stat. Inf. Forum 2013, 3, 82–88. [Google Scholar] [CrossRef]
  37. Bao, P.Y.; Zhang, Y.J.; Gong, L. Study on consistency of land surface albedo obtained from ETM+ and MODIS. J. Hohai Univ. 2007, 35, 67–71. [Google Scholar] [CrossRef]
  38. Fung, T.; Ledrew, E.F. The Determination of Optimal Threshold Levels for Change Detection Using Various Accuracy Indices. J. Photogramm. Eng. Remote Sens. 1988, 54, 1449–1454. [Google Scholar]
  39. Green, K. Assessing the Accuracy of Remotely Sensed Data: Principles and Practices, 2nd ed.; CRC Press/Taylor & Francis: Boca Raton, FL, USA, 2009. [Google Scholar]
  40. Lin, M.L.; Chu, C.M.; Shih, J.Y.; Wang, Q.B.; Chen, C.W.; Wang, S. Assessment and monitoring of desertification using satellite imagery of MODIS in East Asia. J. Proc. SPIE 2006, 6411. [Google Scholar] [CrossRef]
  41. Xu, D.; Li, C.; Song, X. The Research of the Quantitative Method of Desertification Assessment at Large Scale Based on MODIS Data and Decision Tree Model—A Case Study in Farming-Pastoral Region of North China. In Proceedings of the International Conference on Remote Sensing, Environment and Transportation Engineering, Nanjing, China, 1–3 June 2012; pp. 1–4. [Google Scholar] [CrossRef]
  42. Sa, R.; Yin, S.; Bao, Y.; Bao, H. Change of Desertification based on MODIS Data in the Mongolia Border Region. In Proceedings of the 7th Annual Meeting of Risk Analysis Council of China Association for Disaster Prevention, Changsha, China, 4–6 November 2016. [Google Scholar]
  43. Shuyong, M.A.; Zhu, X.; Yulun, A.N. Remote sensing image classification based on decision tree in the karst rocky desertification areas: A case study of Kaizuo Township. Asian Agric. Res. 2014, 21, 58–62. [Google Scholar]
  44. Zhou, G.; Zhang, R.; Shi, Y.; Su, C.; Liu, Y.; Yan, H. Extraction of exposed carbonatite in karst desertification area using co-location decision tree. In Proceedings of the 2014 IEEE Geoscience and Remote Sensing Symposium, Quebec City, QC, Canada, 13–18 July 2014; pp. 3514–3517. [Google Scholar] [CrossRef]
  45. Zhu, X.; An, Y.; Yue, M. Land use classification based on decision tree in karst rocky desertification areas. In Proceedings of the 2011 International Conference on Electric Technology and Civil Engineering (ICETCE), Lushan, China, 22–24 April 2011; pp. 5149–5153. [Google Scholar] [CrossRef]
Figure 1. Geographic location of the study area.
Remotesensing 10 01614 g001
Figure 2. Albedo-NDVI feature space [28].
Remotesensing 10 01614 g002
Figure 3. Correlation between variables of different eigenspaces: (a) Albedo-NDVI; (b) Albedo-MSAVI; (c) Albedo-TGSI; (d) TGSI-MSAVI; and (e) TGSI-NDVI.
Remotesensing 10 01614 g003
Figure 4. Desertification information extraction results of three feature space models: (a) Albedo-NDVI, (b) Albedo-MSAVI, and (c) Albedo-TGSI.
Remotesensing 10 01614 g004
Figure 5. Comparison of land cover interpretation results and Albedo-MSAVI model results. (a) Land cover map, and (b) Albedo-MSAVI model inversion results.
Remotesensing 10 01614 g005
Table 1. Statistical table of K values for the three feature space models.
Feature Space ModelsK
Albedo-NDVI0.55
Albedo-MSAVI0.38
Albedo-TGSI−0.75
Table 2. The different ranges of DDI (desertification divided index) values for land at different stages of desertification.
ModelLevelDDI
Albedo-NDVIsevere desertification<−0.23
high desertification−0.23 to −0.19
medium desertification−0.19 to −0.15
low desertification−0.15 to −0.05
non-desertification>−0.05
Albedo-MSAVIsevere desertification<−0.51
high desertification−0.51 to −0.41
medium desertification−0.41 to −0.30
low desertification−0.30 to −0.14
non-desertification>−0.14
Albedo-TGSIsevere desertification<−1.10
high desertification−1.10 to −0.94
medium desertification−0.94 to −0.78
low desertification−0.78 to −0.46
non-desertification>−0.46
Table 3. Statistical analysis of desertification information extraction results by Albedo-NDVI, Albedo-MSAVI, and Albedo-TGSI.
LevelAlbedo-NDVIAlbedo-MSAVIAlbedo-TGSI
Area (km2)%Area (km2)%Area (km2)%
severe36,474.0111.4739,789.1912.5146,527.7614.63
high75,588.2823.7872,539.4722.8288,625.8327.87
medium101,489.6431.9297,466.0930.6693,847.1829.52
low60,513.1619.0362,743.6319.7347,583.6214.97
non7123.822.248203.432.584867.861.53
water11,544.113.6311,983.893.7711,300.883.55
sand25,224.587.9325,231.907.9325,204.477.93
total317,957.60100317,957.60100317,957.60100
Table 4. Confusion matrices of the three feature space models.
ModelLevelSevereHighMediumLowNonWaterSand
Albedo-NDVIsevere27600003
high082114000
medium0410211000
low00643200
non00231310
water00002170
sand11100033
Albedo-MSAVIsevere29301003
high281104000
medium0310113000
low00245400
lon00121510
water00001180
sand12100032
Albedo-TGSIsevere32100003
high08845000
medium061065000
low10841100
non00221410
water00011170
sand20100033
Table 5. The user and producer accuracy of Albedo-NDVI, Albedo-MSAVI, and Albedo-TGSI.
ModelLevelProducer Accuracy (%)User Accuracy (%)
Albedo-NDVIsevere75.0096.43
high84.5488.17
medium87.1883.61
low84.3170.49
non68.4276.47
water89.4794.44
sand91.6791.67
Albedo-MSAVIsevere80.5690.63
high83.5191.01
medium86.3287.83
low88.2469.23
non78.9575.00
water94.7494.74
sand88.8991.43
Albedo-TGSIsevere88.8991.43
high90.7292.63
medium90.687.6
low80.3975.93
non73.6887.5
water89.4794.44
sand91.6791.67

