1. Introduction
An earthquake is one of the most dangerous natural disasters for human beings, and often results in heavy casualties and great property loss [
1,
2,
3]. However, earthquakes cannot be predicted accurately at the current scientific level [
4]. In recent years, more and more earthquakes have hit areas worldwide, and the economic losses and casualties caused by earthquakes have shown an upward trend [
5]. Rapid damage assessment can help to reduce the casualties and disaster losses [
6]. Building damage assessment is one of the most important parts of earthquake damage assessment, because most of the casualties are usually caused by building collapse [
7].
The timeliness and efficiency of disaster information acquisition is very important. Remote sensing technology, with the advantages of speed and extensiveness, is playing a more and more important role in disaster investigation and assessment [
8]. As is well known, the use of synthetic aperture radar (SAR) images to investigate building disaster information is independent of weather conditions. Fully polarimetric SAR (PolSAR) data contain much more information than single-polarization SAR data [
9]. PolSAR data consist of four different combinations of horizontal (H) and vertical (V) polarization states, namely, HH, HV, VH, and VV [
10]. Therefore, the precision of the damage assessment can be improved by using PolSAR data for disaster information acquisition.
In former research about the use of PolSAR data for building earthquake damage assessment, in order to identity the building damage information, researchers have often directly extracted the collapsed buildings [
11] or the damaged building areas [
12] from the ground objects in the earthquake-stricken region according to the change information of various characteristics between the pre-earthquake and post-earthquake times; other researchers have directly identified the damage level of building areas instead of collapsed buildings by means of comparing the characteristics of different building areas [
13]; and some researchers have extracted the collapsed building information through dividing the buildings in an earthquake-stricken region into two kinds of buildings, i.e., intact buildings and collapsed buildings [
14]. However, it is especially difficult to directly extract collapsed buildings by the use of a single post-earthquake PolSAR image, without the use of pre- and post-earthquake change information. Therefore, most studies of building damage information extraction have classified the buildings in earthquake-stricken areas into intact buildings and collapsed buildings. Only a few researchers have divided the buildings in earthquake-stricken areas into three kinds of buildings, i.e., intact buildings, collapsed buildings, and oriented buildings [
15], in consideration of the specificity of SAR imaging and the fact that oriented buildings are easily mistaken as collapsed buildings. In this former research, most researchers have often used many common polarimetric features generated from polarimetric decomposition to extract collapsed buildings and intact buildings [
16,
17]; some researchers preferred to use circular-polarization correlation coefficients for analyzing the building damage information [
18,
19]; other researchers have used a variety of texture features to identify the building collapse level [
20,
21]; other researchers have used some intensity features to extract damaged building areas [
22,
23].
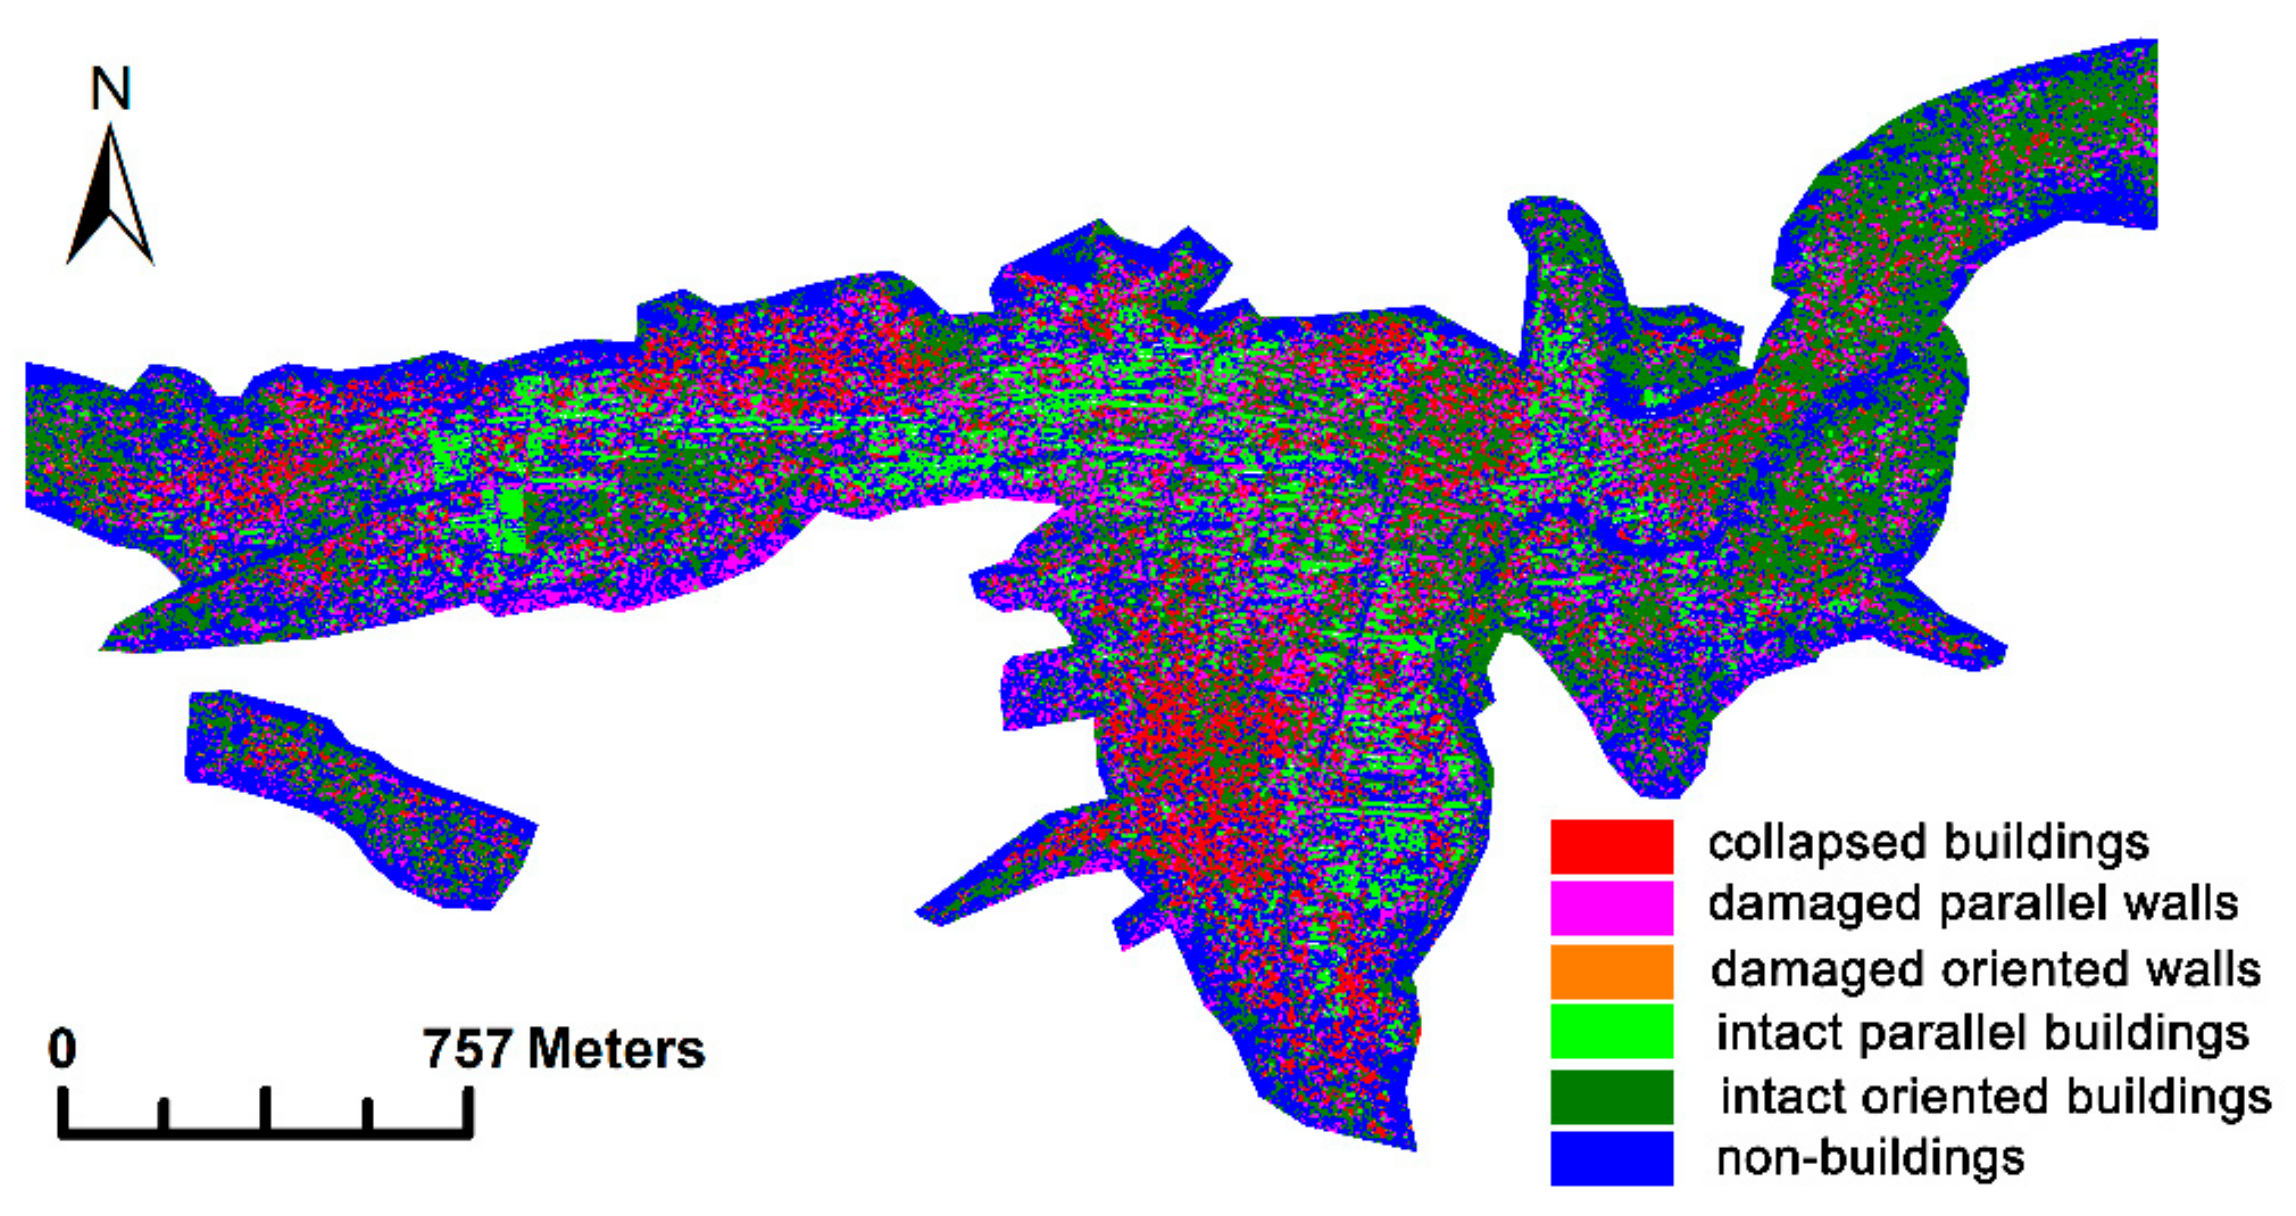
However, during the experiments undertaken in this study, we found that the oriented buildings extracted from post-earthquake PolSAR imagery are often mixed up with the damaged residual oriented walls of damaged buildings, and the intact buildings also contain damaged residual parallel walls of damaged buildings. Therefore, in this study, based on the above studies in which the buildings in earthquake-stricken areas were divided into three types, the damaged residual parallel walls and the damaged residual oriented walls were added. That is, in our study, we divided the buildings in the earthquake-stricken region into five types, i.e., intact parallel buildings whose array direction is parallel to the flight direction, intact oriented buildings whose array direction is not parallel to the flight direction, collapsed buildings that are completely collapsed, damaged residual parallel walls whose array direction is parallel to the flight direction and which are part of damaged buildings, and damaged residual oriented walls whose array direction is not parallel to the flight direction and which are part of damaged buildings. Among these types of buildings, both the intact parallel buildings and the intact oriented buildings belong to the undamaged buildings, whereas the collapsed buildings, the damaged residual parallel walls, and the damaged residual oriented walls belong to the damaged buildings.
The underestimation of the quantity of collapsed buildings is potentially dangerous, because this situation could result in people trapped in ruins not being found in time by rescue workers. The identification of the two kinds of damaged residual walls can effectively lower the risk of damaged building miss-recognition, and thus the earthquake-induced casualty rate. In the proposed approach, the buildings in an earthquake disaster zone are divided into the above five kinds of buildings. By doing so, the extraction of the collapsed buildings and the undamaged buildings in the earthquake disaster zone is more accurate, and the excessive identification of collapsed buildings and the subsequent waste of manpower and material resources can be reduced as much as possible; meanwhile, the risk of a trapped person failing to be rescued in time due to collapsed building miss-recognition can also be reduced.
Using the common polarimetric feature parameters to extract the damaged and undamaged buildings cannot meet the recognition requirements of the five kinds of buildings in an earthquake-stricken area. To recognize the above five kinds of buildings, two new polarimetric feature parameters,
λ_H and
H_λ, are put forward in this work. The two parameters are based on polarimetric entropy and eigenvalues of coherency matrix 〈
T3〉, and can be used to distinguish three pairs of easily confused buildings in earthquake-stricken areas, which are intact parallel buildings and damaged residual parallel walls, intact oriented buildings and collapsed buildings, intact oriented buildings and damaged residual oriented walls. Meanwhile, combining the two polarimetric features, we propose a new scheme for building damage assessment using a single PolSAR image. In addition, only using one post-earthquake SAR image to assess the building damage is much quicker and more convenient than using multi-source or multi-temporal data [
24], because image registration is inevitable when using multi-source or multi-temporal data to interpret earthquake damage information. Therefore, our study about building damage information extraction using a single post-event PolSAR image is more aligned with the requirements of rapid post-earthquake emergency response.
2. Building Damage Information Extraction Procedure
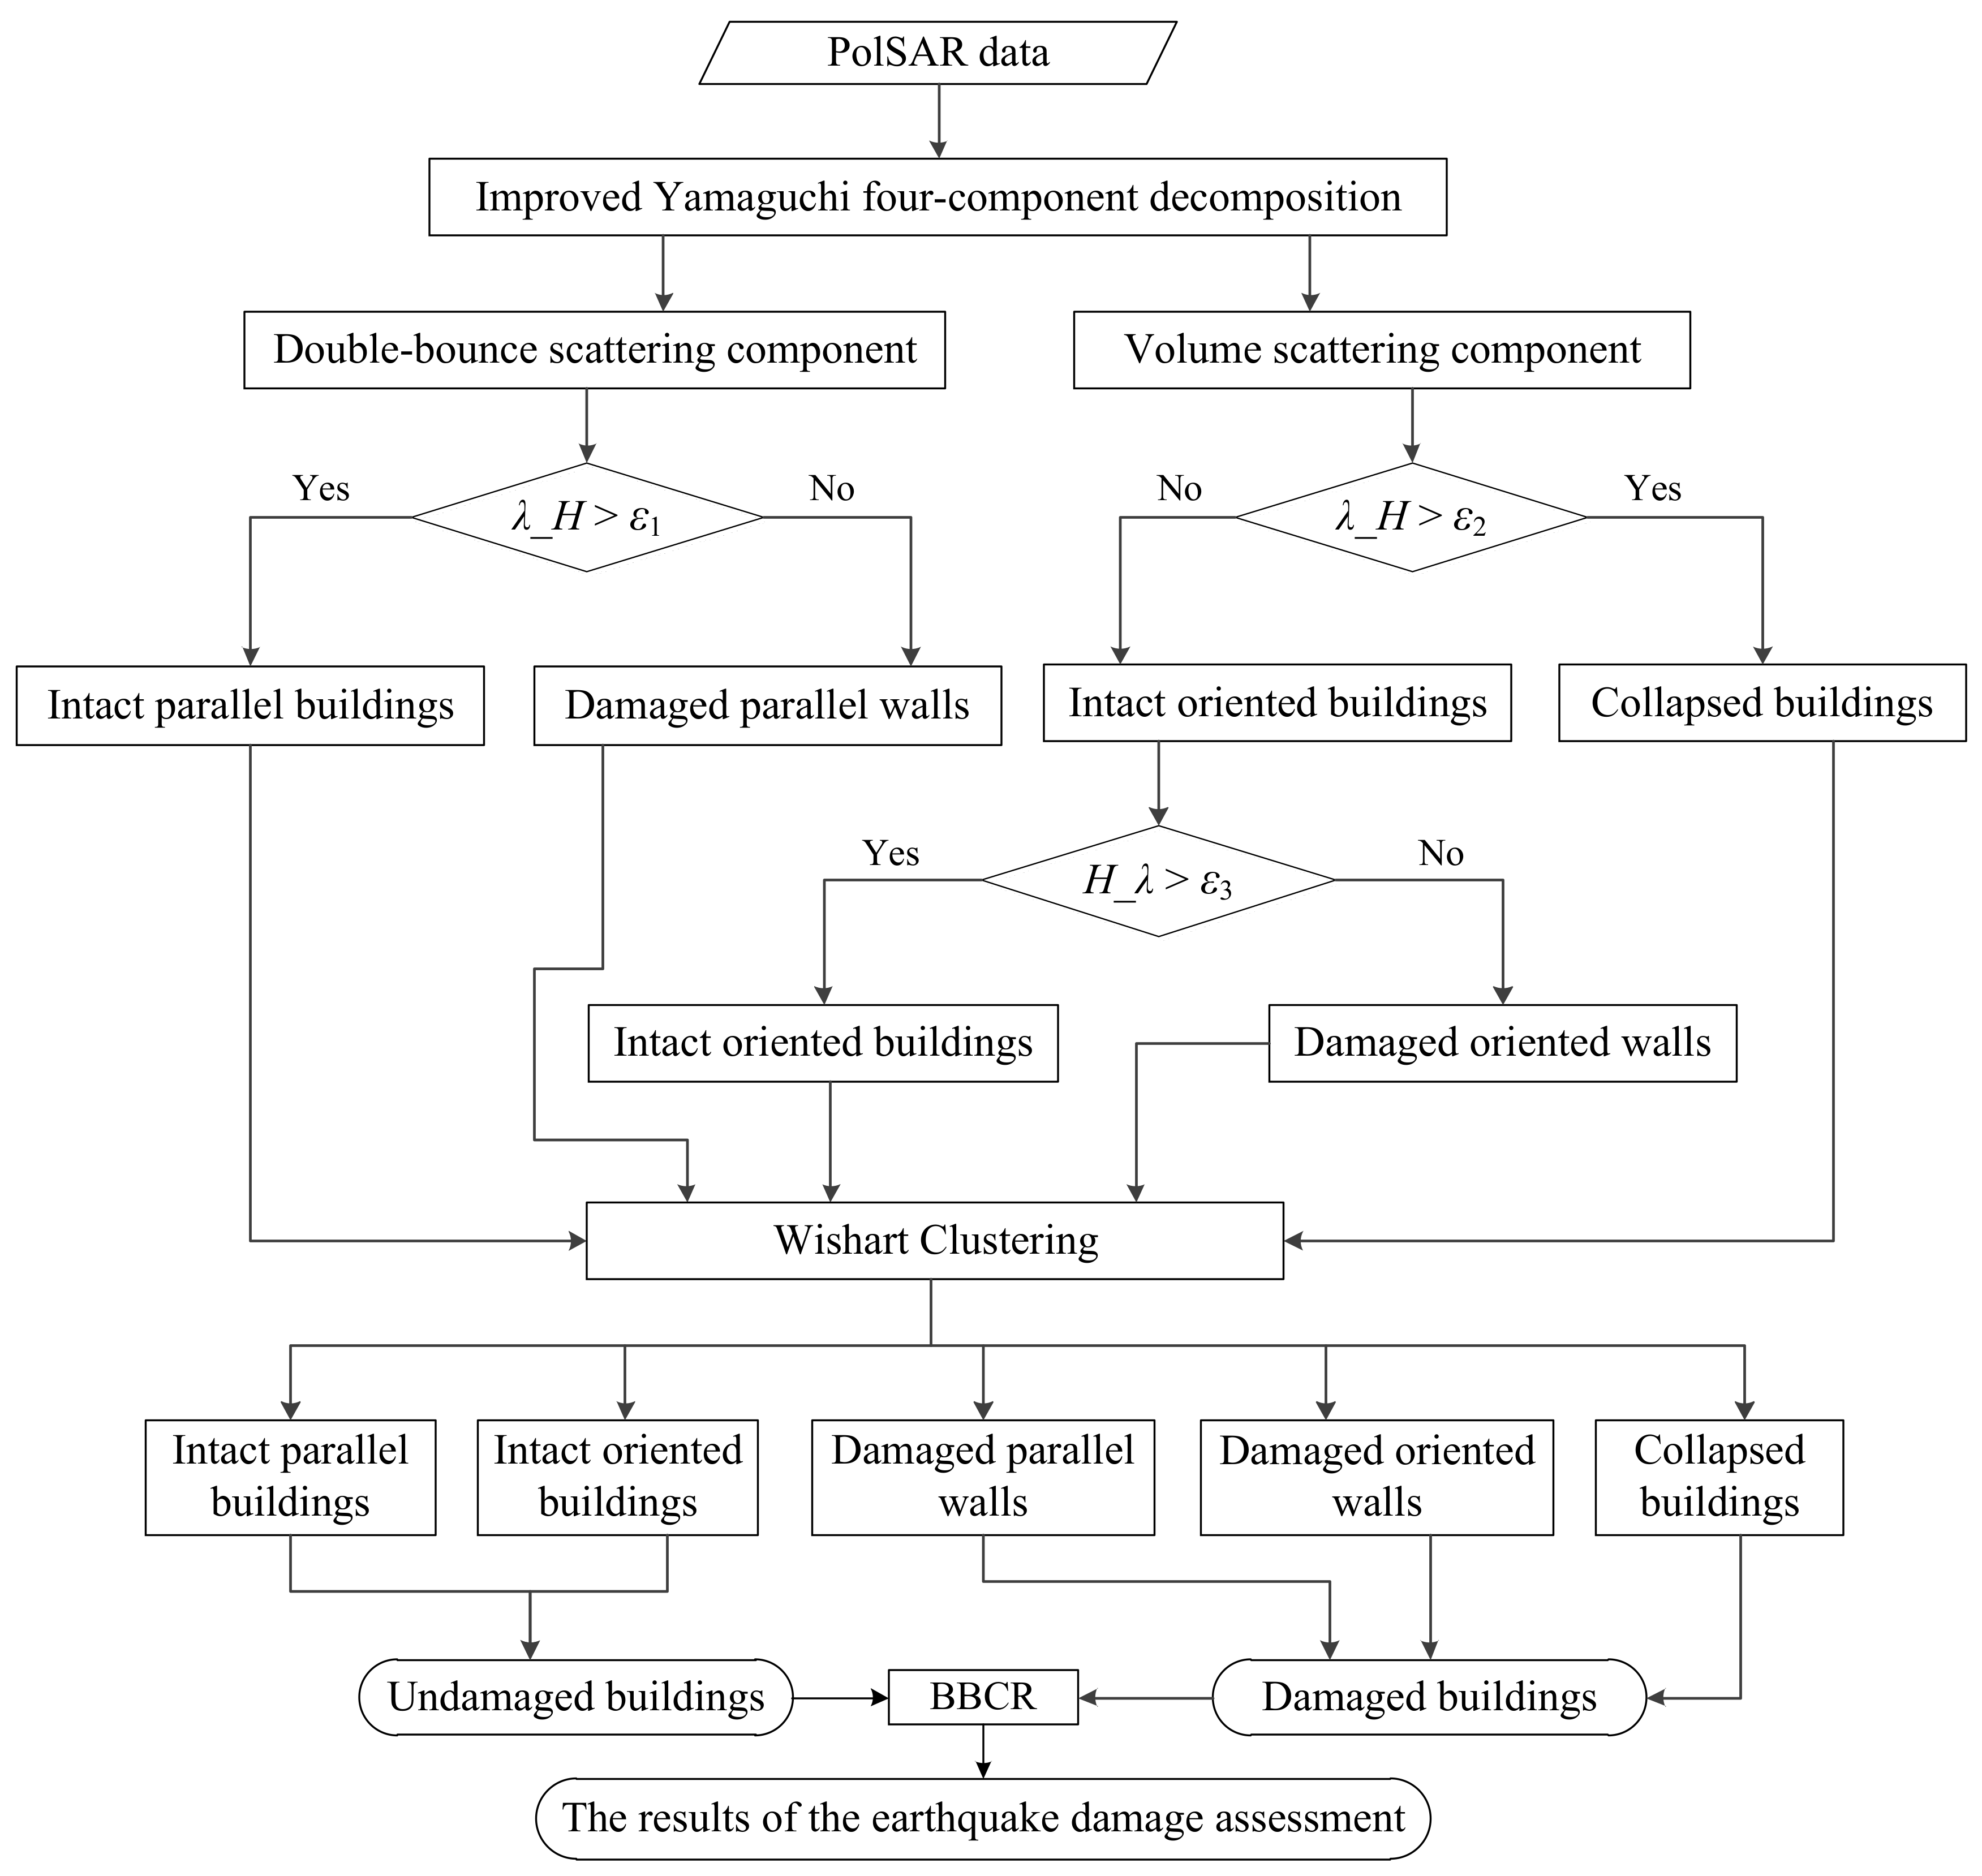
The process of building damage assessment is shown in
Figure 1. There are five key steps in the process flow of the damage estimation framework proposed in this study.
The first step is polarimetric decomposition. The method of improved Yamaguchi four-component decomposition [
25] is performed on the PolSAR data. The ground objects dominated by volume scattering and double-bounce scattering are then obtained. The details about this step can be found in
Section 3.1.
The second step is the recognition of the intact parallel buildings and the damaged parallel walls. According to Equation (5), parameter
λ_H of the PolSAR data is calculated. The objects dominated by double-bounce scattering are classified as intact parallel buildings and damaged parallel walls, according to Equation (7). In this way, the preliminary recognition results of the intact parallel buildings and the damaged parallel walls are obtained. The detailed discussion of this step can be found in
Section 3.2 and
Section 3.3.
The third step is the identification of the intact oriented buildings and the collapsed buildings. The volume-dominated ground objects generated from the first step are separated as intact oriented buildings and the collapsed buildings, according to Equation (8). In this step, the preliminary classification results of the collapsed buildings are obtained. The detailed description of this step can be found in
Section 3.4.
The fourth step is the extraction of the damaged oriented walls from the intact oriented buildings. Parameter
H_λ of the PolSAR data is calculated based on Equation (6). The intact oriented buildings generated from the third step are further separated into the two kinds of buildings, which are the damaged oriented walls and the intact oriented buildings, according to Equation (9). In this way, the preliminary extraction results of the intact oriented buildings and the damaged oriented walls are obtained. The detailed information of this step can be found in
Section 3.2 and
Section 3.5.
The fifth step is the clustering of the five kinds of buildings using the complex Wishart classifier. The clustering using the complex Wishart classifier is carried out to update the preliminary classification results of the five kinds of buildings generated from the above four steps. The final extraction results for the five kinds of buildings in the earthquake-stricken area are then obtained. More detail about this step can be found in
Section 3.6.
The last step is building damage assessment using the building damage index. The intact parallel buildings and the intact oriented buildings are combined as undamaged buildings. The collapsed buildings, the damaged parallel walls, and the damaged oriented walls are combined as damaged buildings. In addition to the undamaged buildings and the damaged buildings, the remaining ground objects are classified as non-buildings. The
BBCR building damage index of each city block is calculated according to Equation (10), and the building damage levels of all of the city blocks in the study area are obtained according to Equation (11). Detailed information about this step can be found in
Section 3.7.
3. Methodology
In PolSAR data, the undamaged buildings usually have strong double-bounce scattering power, and the collapsed buildings, whose dihedral structures are destroyed, are dominated by volume scattering, such that they are usually considered to be easily extracted. However, some undamaged buildings and some residual damaged walls are easily confused with collapsed buildings and undamaged buildings, respectively. For the former, the undamaged oriented buildings which have weak scattering power are often mistakenly identified as collapsed buildings. For the latter, there are two kinds of residual damaged walls: residual parallel walls and residual oriented walls. Some residual parallel walls of damaged buildings form a perfect dihedral reflector with the ground, and they also have strong double-bounce scattering power, so they are easily misclassified as intact parallel buildings. Similarly, some residual oriented walls of damaged buildings can be confused with intact oriented buildings, because their array direction is similar to the oriented buildings and they have the same dominant scattering mechanism as oriented buildings. The successful resolution of these problems is an effective way to improve the reliability and precision of the building damage information extraction result, so the buildings in earthquake-stricken areas can be divided into the five categories. In this paper, the main methodology is using the two polarimetric feature parameters of λ_H and H_λ to extract the five kinds of buildings from a single PolSAR image taken after the earthquake.
3.1. Polarimetric Decomposition Method
Compared with Freeman three-component decomposition [
26], Yamaguchi decomposition introduces the helix scattering component, so it is more applicable to urban areas. Therefore, Yamaguchi four-component decomposition is preferred for decomposing the scattering components of buildings in earthquake-stricken areas. According to the decomposition results of the classical Yamaguchi four-component scattering model [
27,
28], among the five kinds of buildings, the parallel buildings and the damaged parallel walls are dominated by the dihedral scattering component, and the dominant scattering mechanism of the collapsed buildings, the oriented buildings, and the damaged oriented walls is the volume scattering component. Yamaguchi et al. [
25] improved the classical Yamaguchi four-component decomposition model to enhance the performance of oriented building recognition. To recognize the oriented buildings as completely and accurately as possible, the improved Yamaguchi four-component decomposition method (whose details can be found in [
25]) is used as the polarimetric decomposition method in this paper.
3.2. The Two Polarimetric Feature Parameters of λ_H and H_λ
According to the above analysis, there will be mixed damaged parallel walls among the intact parallel buildings. Therefore, when the dihedral-dominated ground objects generated from the improved Yamaguchi four-component decomposition are regarded as undamaged buildings, the damaged parallel walls need to be extracted from the intact parallel buildings. In this paper, a new polarimetric feature parameter, λ_H, is proposed to identify the two kinds of buildings. Before introducing λ_H, we first introduce the parameters of λeigen and Hentro.
Applying eigenvalue analysis, the coherency matrix 〈
T3〉 can be decomposed into [
29]:
where
λi and
ei are the eigenvalues and eigenvectors of coherency matrix 〈
T3〉, respectively.
Parameter
λeigen, which corresponds to the mean target power, is defined as:
where
Parameter
Hentro, the entropy, is defined as:
The proposed parameter
λ_H of point
x in the PolSAR data is defined as:
where
λeigen and
Hentro are the
λeigen and
Hentro of point
x, respectively; and
and
are the mean values of the
λeigen and
Hentro of the region or calculation window containing
x.
In Equation (5), the value range of
Hentro is [0, 1], so
Hentro30 is a very small number, while
λeigen is a big number and 3
λeigen is a bigger number. Therefore, for
λ_H,
λeigen plays the leading role, while
Hentro only plays an auxiliary role. The bigger
λeigen is and the smaller
Hentro is, the bigger
λ_H is, and vice versa. Both of the difference of
λeigen between intact parallel buildings and the damaged parallel walls and the difference of
λeigen between intact oriented buildings vs. collapsed buildings is much greater than
Hentro. 3
λeigen increases the role of
λeigen and
Hentro30 decreases the role of
Hentro. Therefore, the coefficient 3 of
λeigen and the exponent 30 of
Hentro based on experience can increase the difference of
λ_H between each pair of buildings. The larger the coefficient of
λeigen and the exponent of
Hentro are, the larger the difference between the minuend and the subtractor is. We hope that the difference is larger. Because the difference of the minuend is larger for ground objects compared with the subtractor, and ground objects will be easier to distinguish based on the difference. However, if the exponent is too large, the subtractor will become very small, and the significance of the subtractor will decrease. At the same time, the coefficient cannot be too large. Because a rather large coefficient will make both the minuend and the value range of Equation (5) too large. In this way, the function of the subtractor will be weakened, and the objects with small values will be neglected, or even difficult to image accurately. In view of this and considering the separation performance of the intact parallel buildings and damaged parallel walls and the separation performance between the intact oriented buildings and collapsed buildings, the coefficient and the exponent are set as 3 and 30, respectively. In this way, using
λ_H to distinguish the two pairs of buildings becomes easier. There are detailed descriptions for using
λ_H to distinguish the two pairs of buildings in
Section 3.3 and
Section 3.4.
The proposed parameter
H_λ of point
x in the PolSAR data is defined as:
where
λeigen and
Hentro are the
λeigen and
Hentro of
x, respectively; and
and
are the mean values of the
λeigen and
Hentro of the region or calculation window containing
x. In Equation (6), the bigger
Hentro is and the smaller
λeigen is, the bigger
H_λ is, and vice versa. The difference of
Hentro between damaged oriented walls and the intact oriented buildings is as big as the difference of
λeigen. Therefore, any empirical coefficients are not constructed for
Hentro and
λeigen. Using
H_λ to recognize the damaged oriented walls and the intact oriented buildings can be found in
Section 3.5.
3.3. Using λ_H to Recognize the Intact Parallel Buildings and the Damaged Parallel Walls
There are dihedral structures for both intact parallel buildings and damaged parallel walls, and their dominant scattering mechanism is double-bounce scattering. Therefore, the buildings dominated by the double-bounce scattering component generated from the improved Yamaguchi four-component decomposition should be classified into two classes: intact parallel buildings and damaged parallel walls. We then use the parameter λ_H to distinguish the intact parallel buildings and the damaged parallel walls.
λeigen can reflect the scattering intensity of a ground object. The larger the scattering intensity of the ground object, the bigger the value of λeigen is, and vice versa. In normal circumstances, for intact parallel buildings and intact parallel walls with the same height, the overlap area of the building contains the single scattering components of the ground, the wall, and the roof, but the single scattering components of the ground and the wall contribute to the overlap area of the wall, which does not contain the scattering of the roof. Therefore, the scattering power of the building is bigger than the scattering power of the wall. Accordingly, the λeigen values of the intact buildings are bigger than the λeigen values of the intact walls. In an earthquake-stricken area, the shapes of the damaged parallel walls are usually incomplete, or their height is often reduced, or they are slanted toward the ground. Therefore, the scattering power of the damaged parallel walls is less than that of the intact parallel walls, and the λeigen values of the intact parallel buildings are bigger than the λeigen values of the damaged parallel walls.
Hentro can reflect the scattering randomness of the ground objects. The larger the scattering randomness is, the bigger the Hentro value is, and vice versa. There are usually many ruins around the damaged parallel walls. The scattering randomness of ruins is bigger than that of the intact parallel buildings. Therefore, the Hentro values of damaged parallel walls are bigger than the Hentro values of intact parallel buildings.
In conclusion, the
λ_H values of intact parallel buildings are bigger than the
λ_H values of damaged parallel walls. This conclusion is consistent with our experimental results, which are described in
Section 4.2. Therefore, using
λ_H to classify the two kinds of buildings can be expressed as:
where
ε1 represents the threshold value.
3.4. Using λ_H to Classify Intact Oriented Buildings and Collapsed Buildings
The dominant scattering mechanism of both intact oriented buildings and collapsed buildings is the volume scattering component. The scattering power of the oriented buildings can be only partly improved using the improved Yamaguchi four-component decomposition. After decomposition, the volume scattering is still the dominant scattering mechanism of the intact oriented buildings, and the confusion between collapsed buildings and intact oriented buildings is unchanged. Therefore, the buildings dominated by the volume scattering component generated from the improved Yamaguchi four-component decomposition need to be classified into two classes: collapsed buildings and oriented buildings. We then need to use the parameter λ_H to distinguish the intact oriented buildings and the collapsed buildings.
Although the dihedral structure of the collapsed buildings is destroyed in an earthquake and they are dominated by the volume scattering mechanism, some small ground objects with dihedral structure will be mingled with the collapsed buildings, and there will usually be some piecemeal small scatterers with strong scattering power. Thus, some highlighted points with strong scattering power often exist around the collapsed buildings in PolSAR imagery. Therefore, the scattering power of the collapsed buildings is usually higher than that of the intact oriented buildings. That is, the λeigen values of the intact oriented buildings are smaller than the λeigen values of the collapsed buildings.
The stronger the depolarization effect is, the bigger the Hentro value is, and vice versa. Because the polarization basis of the intact oriented buildings is rotated and their polarization orientation angles are skewed, the intact oriented buildings have a strong depolarization effect. Thus, the Hentro values of the intact oriented buildings are bigger than the Hentro values of the collapsed buildings.
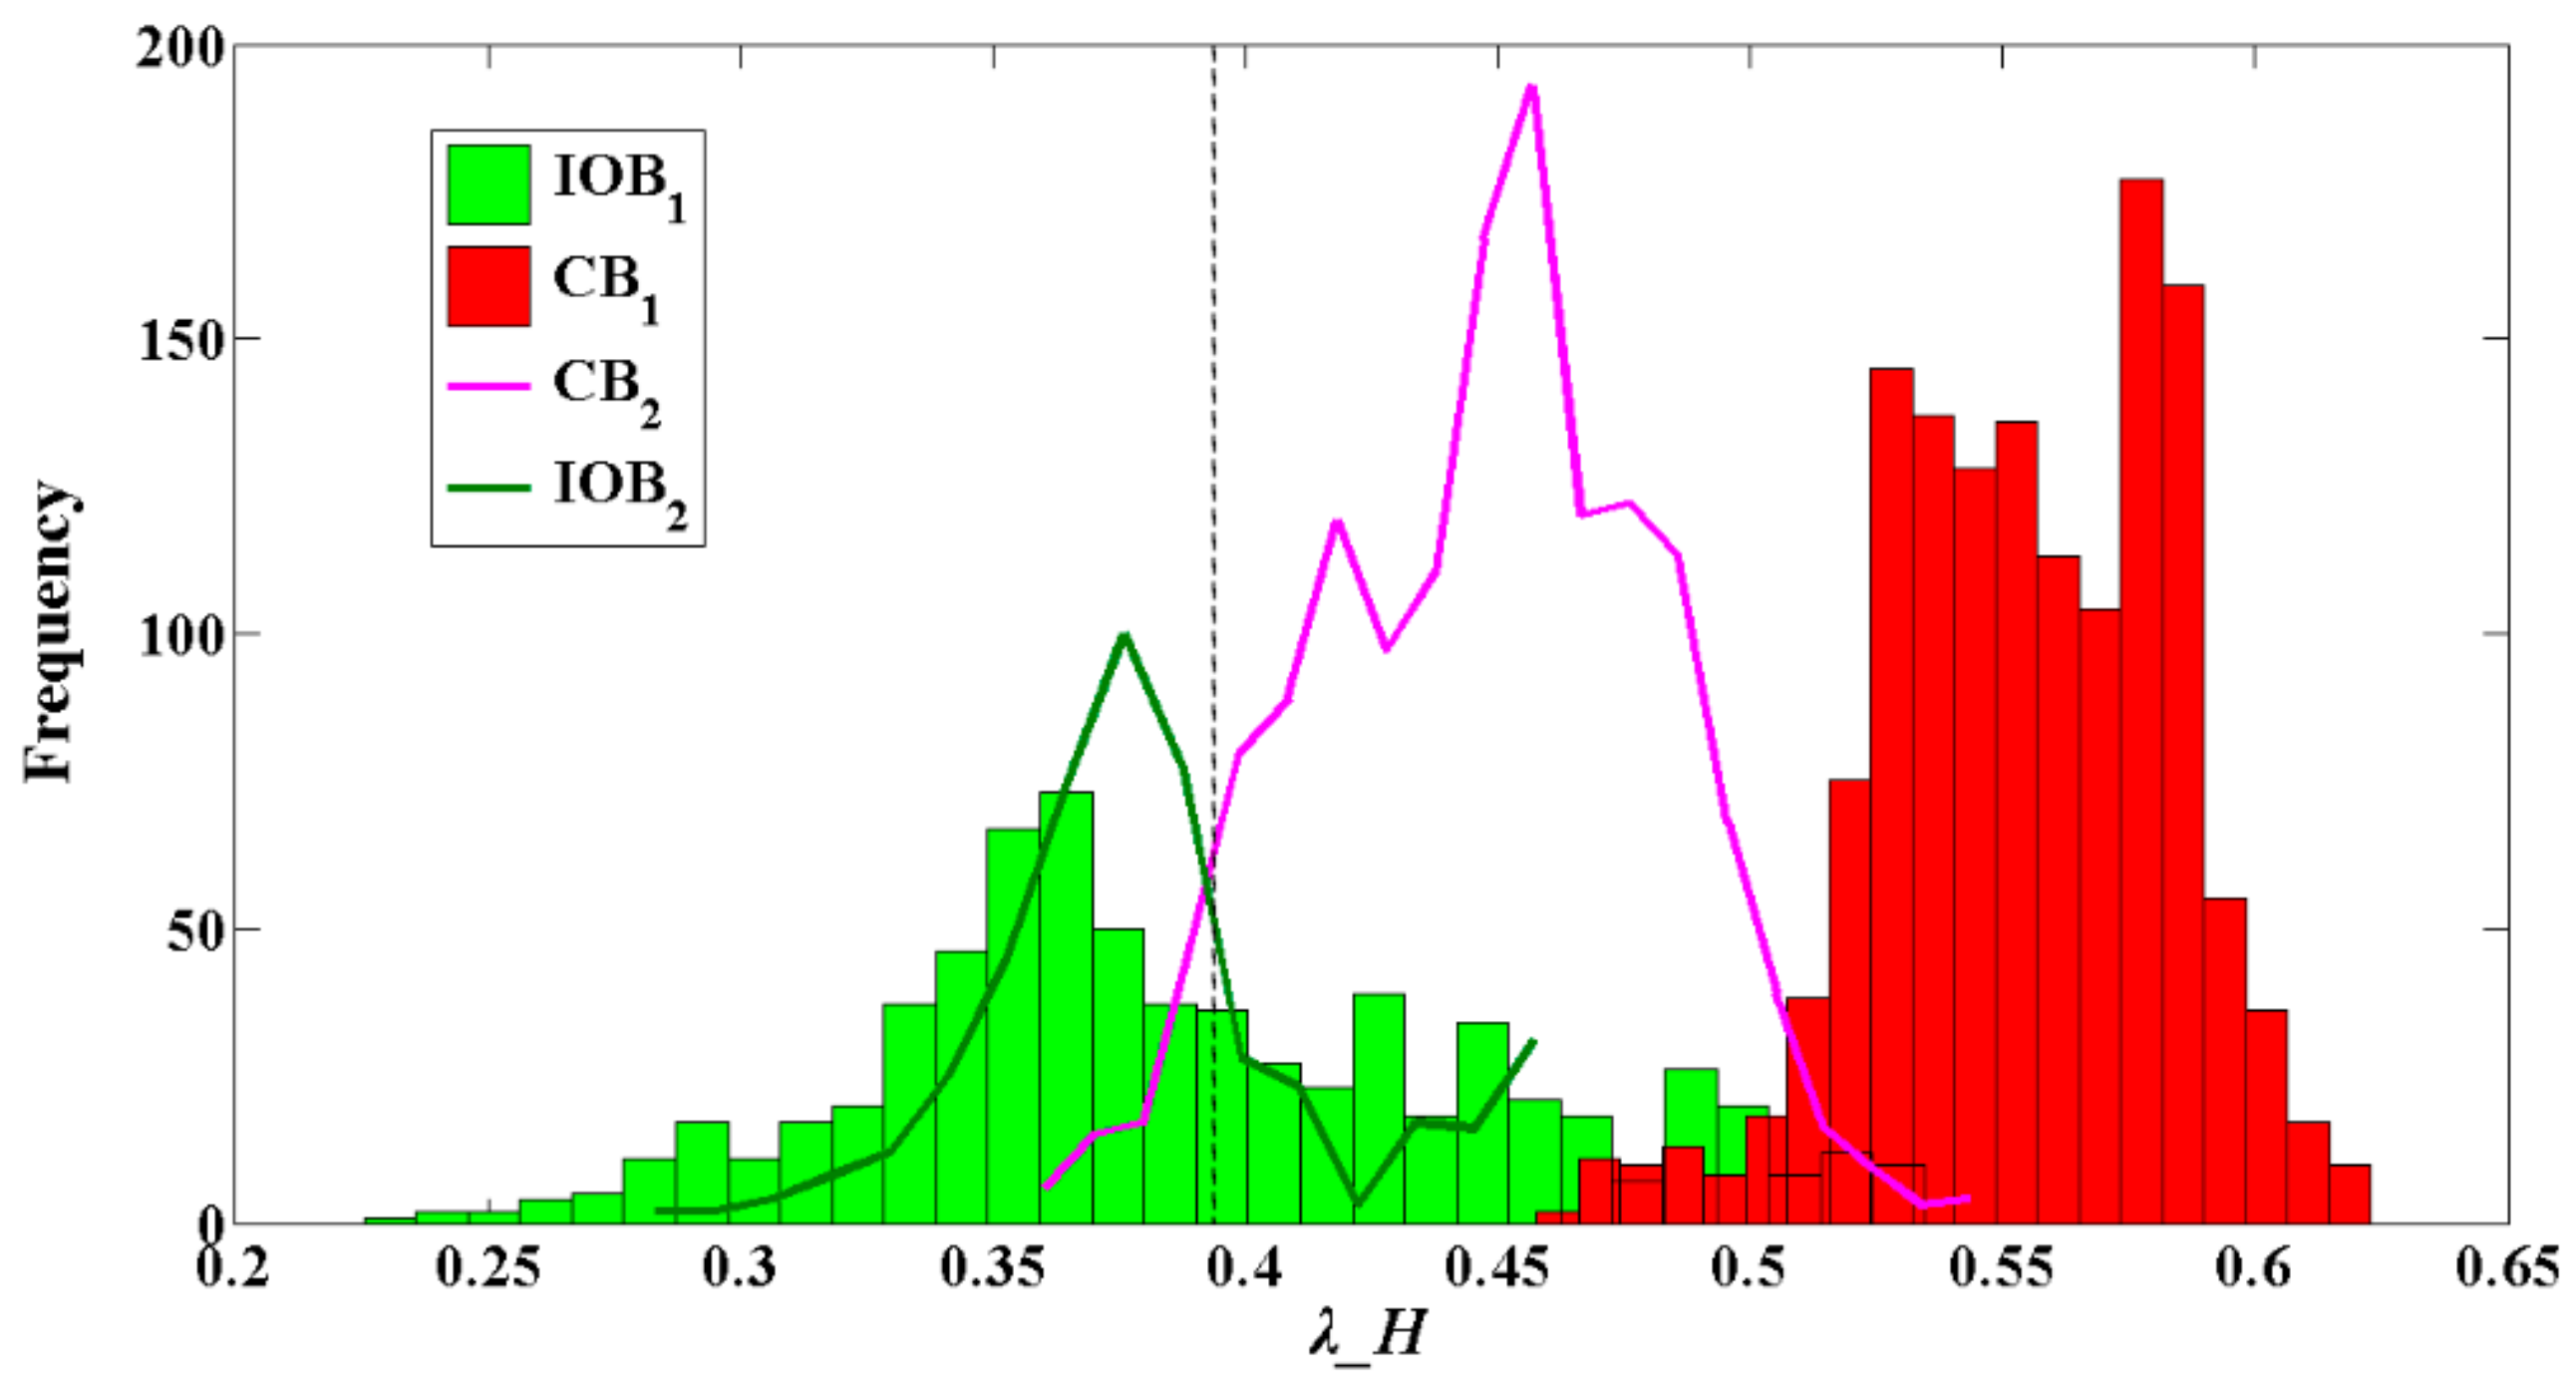
In conclusion, the
λ_H values of the collapsed buildings are bigger than the
λ_H values of the intact oriented buildings. This conclusion is consistent with our experimental results, which are described in
Section 4.2. Therefore, the parameter
λ_H is also used to recognize the intact oriented buildings and the collapsed buildings. Using
λ_H to identify the two kinds of buildings can be expressed as:
where
ε2 represents the threshold value.
3.5. Using H_λ to Extract the Damaged Oriented Walls from the Intact Oriented Buildings
Although the collapsed buildings and the intact oriented buildings are separated from the volume-dominated buildings, there will still be some damaged oriented walls mixed with the intact oriented buildings. Therefore, the damaged oriented walls need to be extracted from the intact oriented buildings. In this paper, parameter H_λ is proposed to identify the two kinds of buildings.
The array direction of both damaged oriented walls and intact oriented buildings is not parallel to the flight direction, and their polarization basis is rotated, so they both have a strong depolarization effect and their polarimetric scattering characteristics are very similar. As such, the identification of the two kinds of buildings is very difficult. However, the damaged oriented walls are components of the damaged buildings, and there will be some ruins around the damaged oriented walls. The objects around the damaged oriented walls possess the characteristics of the collapsed buildings, so the scattering power of the damaged oriented walls is higher than that of the intact oriented buildings. Therefore, the λeigen values of the damaged oriented walls are bigger than the λeigen values of the intact oriented buildings.
Although the damaged oriented walls are the main parts of the oriented walls, the surrounding ruins, as the subsidiary portions of the damaged oriented walls, gives the damaged oriented walls some of the characteristics of collapsed buildings. Thus, the depolarization effect of the damaged oriented walls is weaker than that of the intact oriented buildings, and the Hentro values of the damaged oriented walls are smaller than the Hentro values of the intact oriented buildings.
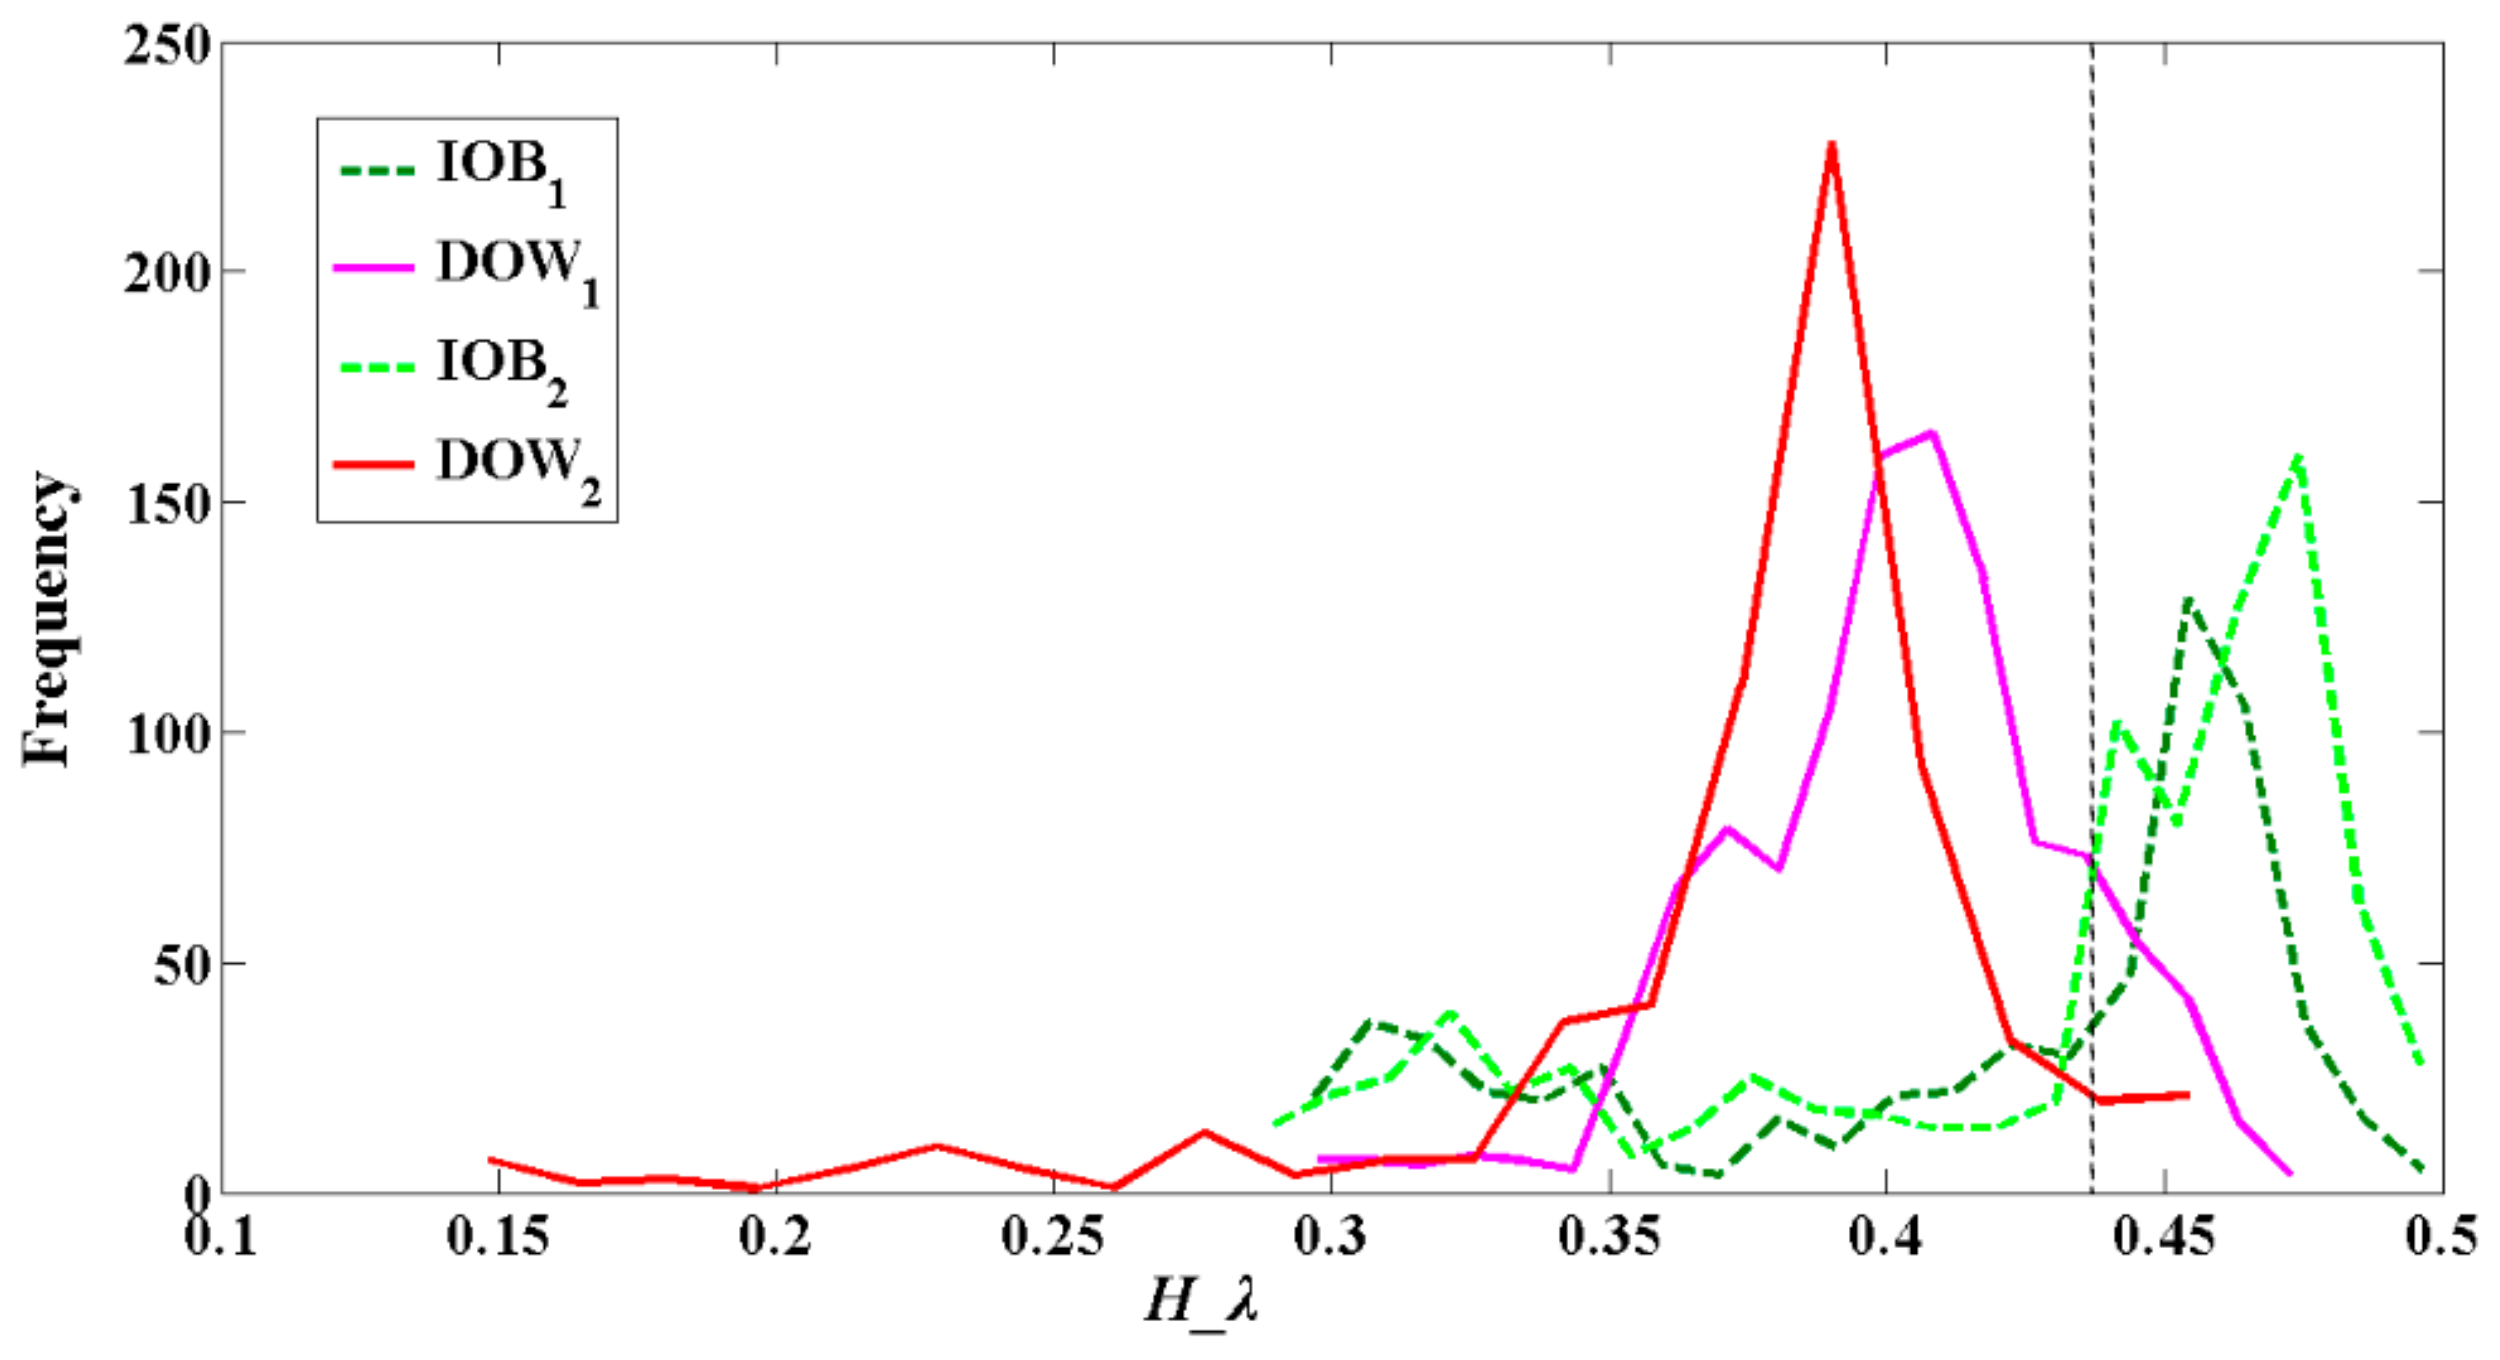
In conclusion, the
H_λ values of the intact oriented buildings are bigger than the
H_λ values of the damaged oriented walls. This conclusion is consistent with our experimental results, which are described in
Section 4.2. Therefore, parameter
H_λ can be used to extract the damaged oriented walls from the intact oriented buildings. Using
H_λ to recognize the two kinds of buildings can be expressed as:
where
ε3 represents the threshold value.
3.6. Wishart Clustering
The Wishart clustering algorithm proposed in [
30] is based on the complex Wishart distribution of the polarimetric coherency matrix [
30,
31], and is the recommended clustering method for PolSAR images. The complex Wishart classifier is one of the most widely used classifiers in the application of PolSAR image classification, and it can make full use of the intensity information and phase information of PolSAR data. Full details of the Wishart clustering algorithm can be found in [
30]. In this work, the five kinds of buildings partitioned by the parameters of
λ_H and
H_λ are the initial classification results. To ameliorate the effect of the threshold value selection and obtain a higher classification accuracy, the initial partitioning needs to be clustered using the Wishart clustering method.
3.7. The BBCR Building Damage Index
The outlines of the individual buildings in PolSAR imagery are usually not clear, and the radar image speckle noise has an impact on the shape and outline of the buildings. Therefore, the damage assessment of individual buildings can result in large errors. To obtain a more accurate evaluation, the building damage levels are measured at the city block scale. In addition, the assessment at the city block scale is also an efficient way to overcome the differences of different source data. The building damage level of each city block is measured by the building block collapse rate (
BBCR) building damage index [
32]. The
BBCR is defined as the ratio of the damaged buildings to the total buildings in one block. The total buildings are the sum of the undamaged buildings and the damaged buildings. Each block is assigned a
BBCR value to assess the damage level of the block.
The
BBCR of the
jth block can be expressed as:
where
Dj indicates the sum of the damaged buildings in the
jth block, and
Uj represents the sum of the undamaged buildings in the
jth block.
In this paper, the damage levels of the buildings are divided into slight, moderate, and serious damage levels, according to the threshold values of the
BBCR. The damage levels can be expressed as:
where
ε4 and
ε5 are the two threshold values of the
BBCR for separating the three damage levels.
5. Discussion
As can be seen from
Table 2, the overall accuracy of the building damage assessment of the proposed method is increased by 11.11% compared to the IYFD method. The proposed method thus results in a great improvement in overall accuracy. This indicates that the buildings in the earthquake-stricken area being divided into five kinds of buildings and using parameters
λ_
H and
H_
λ to classify the five kinds of buildings can effectively improve the extraction accuracy of building earthquake damage information. One of the reasons for this is the fact that the division of the five kinds of buildings is based on the consideration of three kinds of confusion, i.e., the confusion between intact parallel buildings and damaged parallel walls, the confusion between intact oriented buildings and collapsed buildings, and the confusion between intact oriented buildings and damaged oriented walls. Another reason is that parameters
λ_
H and
H_
λ can be used to effectively resolve the three kinds of confusion, which can improve the recognition accuracy for damaged buildings and undamaged buildings.
As shown in
Table 2, there are actually 25 blocks with the serious damage level, and 22 blocks are correctly identified using the proposed method, giving a correct recognition rate of 88%. The other three misclassified blocks are underestimated by one damage level. In the 33 blocks with the moderate damage level, there are 27 blocks correctly recognized, giving a correct recognition rate of 81.82%. For the other six misclassified blocks, five blocks are underestimated by one damage level and one block is overestimated by one damage level. For the slight damage level, there are actually 14 blocks, and 11 blocks are correctly identified, giving a correct recognition rate of 78.57%. The other three misclassified blocks are overestimated by one damage level. The correct recognition rates for the serious level, the moderate level, and the slight level using the IYFD method are 88%, 63.64%, and 64.29%, respectively. Compared with the IYFD method, the recognition accuracy of the proposed method for the serious damage level is not reduced and the correct recognition rates for the blocks with the slight and moderate damage levels are increased by 18.18% and 14.28%, respectively. This indicates that the proposed method can not only avoid the risk of underestimation for the areas with the serious damage level, but it can also effectively reduce the overestimation of the building collapse rate.
As shown in
Table 2, using the proposed method, there are 12 blocks misclassified in the 72 blocks of the Yushu urban area. In the accuracy evaluation table, there are four blocks in the right-upper triangle of the confusion matrix and eight blocks in the left-lower triangle. That is to say, there are four overestimated blocks and eight underestimated blocks. The overestimation rate for the blocks is 5.56% and the underestimation rate for the blocks is 13.89%. This shows that most of the misclassified blocks are underestimated. In
Figure 10, the misclassified blocks are marked by colored numbers from 1 to 12, where the color of the number denotes the color of the correct building damage level. Among them, the blocks with Nos. 1–3, which should be the serious damage level, are misclassified as moderate damage. Block Nos. 4–8, whose actual damage level is moderate damage are misclassified as slight damage, and block No. 9, which should also be the moderate damage level, is misclassified as serious damage. Block Nos. 10–12, which should be the slight damage level, are misclassified as moderate damage. On the whole, the damage levels of block Nos. 1–8 are underestimated and the damage levels of block Nos. 9–12 are overestimated. Moreover, all of the 12 misclassified blocks are underestimated or overestimated by only one damage level, and no blocks are misclassified by two damage levels. This suggests that the results obtained using the proposed method are not far from reality. Meanwhile, in order to directly compare the estimated damages using the proposed method with the real damages shown in
Figure 4, the comparison histogram is drawn in
Figure 12. It can also be seen from
Figure 12 that the estimated damage results using the proposed method are approximate to the real damages.
In general, for the 12 misclassified blocks, the main situation of misclassification is underestimation of the building damage level. The main reason for this misclassification is the excessive recognition of undamaged buildings and the miss-detection of damaged buildings. The three possible reasons for the excessive recognition of undamaged buildings are: (1) both damaged parallel walls and damaged oriented walls are not fully extracted; (2) the threshold value selection is not accurate enough; and (3) over-iteration may occur during the process of using the Wishart clustering method. In addition, after carrying out the improved Yamaguchi four-component decomposition, the double-bounce scattering power of the damaged oriented walls is increased and they are mistakenly identified as intact parallel buildings. Therefore, in our future work, an improved threshold selection method will be considered, and how to improve the extraction accuracy of the two kinds of damaged walls will be a research priority.
In short, the proposed approach can be effectively applied to distinguish damaged buildings and undamaged buildings in an earthquake-stricken area. Although there is some underestimation and overestimation of the building damage levels, the overall recognition accuracy is improved when compared to the IYFD method, and the recognition accuracies of the blocks with the slight and moderate damage levels are greatly improved. Meanwhile, the identification accuracy for the blocks with the serious damage level is not reduced. The proposed method can distinguish the intact oriented buildings from the collapsed buildings, also can distinguish the damaged buildings with residual walls from the intact buildings. However, the IYFD method only distinguishes two kinds of buildings, i.e., the intact buildings and the collapsed buildings. The proposed method can resolve the three kinds of building confusion problems, i.e., the confusion between intact parallel buildings and damaged parallel walls, the confusion between intact oriented buildings and collapsed buildings, and the confusion between intact oriented buildings and damaged oriented walls. Whereas the IYFD method cannot resolve these confusions. This indicates that the division of the five kinds of buildings in earthquake-stricken areas and using the two polarimetric feature parameters of λ_H and H_λ to estimate the five kinds of buildings is an effective way to achieve building earthquake damage assessment.
6. Conclusions
The use of a single-temporal post-earthquake PolSAR image to extract the building collapse information can meet the needs of rapid and accurate disaster information acquisition. During this research, we found that there were three kinds of confusion in the buildings of the earthquake-stricken area, i.e., the confusion between intact parallel buildings and damaged parallel walls, the confusion between intact oriented buildings and collapsed buildings, and the confusion between intact oriented buildings and damaged oriented walls. Therefore, in this study, we divided the buildings in the earthquake-stricken area into these five kinds of buildings. At the same time, in order to resolve the confusion, the two polarimetric feature parameters of λ_H and H_λ were applied to recognize the five kinds of buildings. Parameter λ_H was used to separate the objects characterized by double-bounce scattering into undamaged parallel buildings and damaged parallel walls, and to separate the buildings characterized with volume scattering into undamaged oriented buildings and collapsed buildings. Parameter H_λ was proposed to separate the damaged oriented walls from the undamaged oriented buildings. The post-event airborne PolSAR image of the Yushu “4.14” earthquake was selected as the experimental data, to validate the proposed method. The experimental results showed that the proposed method can obtain better results than the IYFD method for the damaged buildings and the undamaged buildings, and can greatly improve the accuracy of building earthquake damage assessment. Therefore, the proposed method is very effective for building damage information extraction. In addition, the proposed method is relatively simple and is concise and easy to operate, making it suitable for rapid post-earthquake emergency response.


