Article

Fifteen Years of Cal/Val Service to Reference Altimetry Missions: Calibration of Satellite Altimetry at the Permanent Facilities in Gavdos and Crete, Greece

by
Stelios P. Mertikas
1,*,
Craig Donlon
2,
Pierre Féménias
3,
Constantin Mavrocordatos
2,
Demitris Galanakis
4,
Achilles Tripolitsiotis
4,
Xenophon Frantzis
1,
Ilias N. Tziavos
5,
George Vergos
5 and
Thierry Guinle
6
1
Geodesy and Geomatics Engineering Laboratory, Technical University of Crete, GR-73100 Chania, Greece
2
European Space Agency/European Space Research and Technology Centre (ESA/ESTEC), Keplerlaan 1, 2201 AZ Noordwijk, The Netherlands
3
European Space Agency/European Space Research Institute (ESA/ESRIN), Via Galileo Galilei, I-00044 Frascati, Italy
4
Space Geomatica P.C., Xanthoudidou 10A, GR-73132 Chania, Greece
5
School of Geodesy and Surveying, Aristotle University of Thessaloniki, University Box 440, 54124 Thessaloniki, Greece
6
Centre National d’ Etudes Spatiales (CNES), 31401 Toulouse CEDEX, France
*
Author to whom correspondence should be addressed.
Remote Sens. 2018, 10(10), 1557; https://doi.org/10.3390/rs10101557
Submission received: 10 September 2018 / Revised: 21 September 2018 / Accepted: 24 September 2018 / Published: 27 September 2018
(This article belongs to the Special Issue Radar Remote Sensing of Oceans and Coastal Areas)

Abstract

:
Satellite altimetry provides exceptional means for absolute and undisputable monitoring of changes in sea level and inland waters (rivers and lakes), over regional to global scales, with accuracy and with respect to the center of mass of the Earth. Altimetry system’s responses have to be continuously monitored for their quality, biases, errors, drifts, etc. with calibration. Absolute calibration of altimeters is achieved by external and independent to satellite facilities on the ground. This is the mainstay for a continuous, homogenous, and reliable monitoring of the earth and its oceans. This paper describes the development of the Permanent Facility for Altimetry Calibration in Gavdos/Crete, Greece, as of 2001 along with its infrastructure and instrumentation. Calibration results are presented for the reference missions of Jason-1, Jason-2, and Jason-3. Then, this work continues with the determination of relative calibrations with respect to reference missions for Sentinel-3A, HY-2A, and SARAL/AltiKa. Calibration results are also given for Jason-2 and Jason-3 altimeters using the transponder at the CDN1 Cal/Val site on the mountains of Crete, with simultaneous comparisons against sea-surface calibration and during their tandem mission. Finally, the paper presents procedures for estimating uncertainties for altimeter calibration to meet the Fiducial Reference Measurement standards.

Graphical Abstract

1. Introduction

Current satellite altimetry provides outstanding means for absolute and undisputable monitoring of changes in sea level and inland waters (rivers and lakes), over regional to global scales, with accuracies of mm/Year and with respect to the center of mass of the Earth. Altimetry also observes wind speed on the sea surface; sea state; determines ocean circulation; bathymetry; monitors melting rates of ice sheets in Arctic, Antarctica, and the Himalayas; and measures the amounts of the sea ice and freeboard. All these measurements are made with an accuracy of less than 1 cm (or even 1 mm for Sentinel-6 for example) and from an attitude of 800–1300 km above the Earth’s surface.
Altimetry plays a central role in monitoring climate change and in establishing fundamental environmental parameters. It provides a consistent and comprehensive view of the Earth by measuring changes of sea level in an objective and uniform way, but it also helps us better understand what is happening in remote and non-accessible areas of our planet [1,2]. Satellite altimetry observes processes and states of the oceans and inland waters and provides a picture of variations over time and space. For example, it reveals patterns and details of sea and water surfaces (rivers and lakes, i.e., Amazon River in Brazil and Issyk-Kul Lake in Kyrgyzstan) which could not be previously detected by climate models and conventional observations [3,4,5,6].
Sea level is a fundamental environmental parameter as it integrates different physical processes by reflecting changes in the ocean, the atmosphere, and the Earth’s surface [7]. Throughout history, the level of the sea has been constantly changing with time and in space and certainly will continue changing into the future [8]. Nonetheless over the last few decades, greenhouse gas concentrations in the Earth’s atmosphere have increased as a result of human activities. This has led to global warming, ocean acidification, thermal expansion of the sea mass, melting of glaciers and ice sheets, and changes in land-stored water; all of these cause additional variations to marine properties and sea level.
A rise in global sea level is one the most certain consequences of climate change [9]. This is why sea level has been selected to become one of the 50 essential climate variables (ECV) introduced by the Global Climate Observing System [10] and also one of the 13 ECVs monitored by the Climate Change Initiative [11] in the European Space Agency.
Even small amounts in sea-level rise, measured at +3.2 mm/year today with altimetry, can cause devastating effects. Sea level rise causes destructive erosion on coasts, contaminates faster aquifers and water resources with sea water (e.g., Messara valley in Crete, Greece), and also harms agriculture and productive soils. For every 30 cm of sea level rise, coastlines move inland by 30–100 m on average [12,13]. Coastal flooding destroys wildlife (birds, fish, animals, vegetation, etc.), and sea level rise causes hurricane surges to become powerful, higher, and with frequent flooding of vast coastal areas. In the near future, islands may be lost and people living on low-lying lands may abandon their homes and relocate.
Over the past 20–25 years, satellite altimetry clarified our understanding of sea level rise and ocean circulation, as well as of ocean bathymetry from space [3,14]. It provides global, all-weather, absolute, and detailed measurements for the sea surface height with respect to the center of mass of the Earth. In other words, it has now become possible to monitor sea level, marine environment, and inland waters with satellite altimeters and to complement observations made by tide gauges.
The Intergovernmental Panel on Climate Change has reported that over 1993–2012, a global mean sea level (GMSL) of 3.2 mm/year (2.8 mm/year to 3.6 mm/year) has been established by satellite altimetry [15,16]. Although there is observational evidence that GMSL is rising, considerable debate still remains as whether the rate of sea level rise is currently increasing as a result of human activity and, if so, by how much [9]. To answer this question the sea-level variability over the short-term has to be removed from the climate records [17], while instrumental drifts have to be carefully scrutinized as they may distort the GMSL observations [18].
Climate change monitoring requires longstanding observations of several decades; a duration going beyond the typical observation length and lifetime for a satellite altimeter of about 5–7 years. In addition, the sound identification of sea-level signals connected to long-term climate changes still remains a challenge, although current altimeters provide remarkable accuracies [19] (also Table 1). Consequently, to support a seamless, reliable, and objective monitoring for sea level and inland waters tied to an inertial reference system [20], diverse satellite altimeters have to be calibrated and also cross-calibrated against each other continuously and in an absolute sense using ground-truth research infrastructures.
Absolute calibration of satellite altimeters by external, permanent, and independent to satellite facilities is a prerequisite for a continuous, homogenous, and reliable monitoring of the Earth, its oceans, and climate change. These calibration/validation (Cal/Val) facilities on the Earth’s surface ensure that altimetry observations are free of errors and biases, uninterrupted, and tied from one mission to the next in an objective and absolute sense. Altimeter systems’ responses have to be, thus, continuously monitored and controlled for their quality, biases, errors, drifts, etc. Relations also among different missions have to be established on a common and reliable Earth-center reference system, maintained over a long period of time.
Up to now, absolute calibration of satellite altimetry is primarily provided by permanent ground calibration and validation facilities. These are located either offshore or on land (e.g., microwave transponders) exactly under (absolute direct Cal/Val) or adjacent to satellite’s ground track on nearby coasts to ensure monitoring of uncontaminated satellite observations (absolute indirect Cal/Val). Relative calibration of satellite measurements is also performed using either multi-mission crossover analysis between reference altimeters and other missions (relative direct Cal/Val) or distributed tide-gauge networks (relative indirect Cal/Val). Today, there exist four absolute, permanent, and historic such Cal/Val facilities in the world: one is operated by CNES (French Space Agency) in Corsica, France [21], one run by the Jet Propulsion Lab/NASA in California, USA [22], one managed by The University of Tasmania in Bass Strait, Tasmania, Australia [23], and one operated by the Technical University of Crete in western Crete and Gavdos in Greece [24].
Each calibration method presents advantages and disadvantages. Nonetheless, there exist several international groups dedicated to satellite altimetry calibration, while periodic campaigns had been conducted in the past to support mission-specific Cal/Val services [6,25,26,27,28,29].
With the recent advent of diverse satellite altimeters along with advanced measuring techniques (Nadir, Delay-Doppler altimeters, wide swath, Ku-band, and Ka-band frequencies), it has become mature and is high time to maintain absolute reference Cal/Val sites to regularly monitor any altimeter but based upon fundamental and undisputable reference and metrology standards, i.e., speed of light, absolute time, etc. This fiducial reference measurement (FRM) concept had been introduced by the European Space Agency and ESA plans to calibrate all its present and future altimeters in that manner. The international altimetry community expects continuity and upscaling of Cal/Val services to maintain measurement conformity and error reporting, and also to support the right decisions concerning Earth observation. Such an FRM Cal/Val site will constitute the fundamental mainstay for building up capacity for monitoring climate change in an objective and unequivocal manner with altimetry. It will be capable of assessing any altimeter measurements to absolute reference signals traceable to SI-standards (Système International, such as speed of light, absolute time reference, etc.) with different techniques, various processes, and diverse instrumentation and settings.
The Permanent Facility for Altimeter Calibration (PFAC) in western Crete, Greece, is such a Cal/Val infrastructure where calibration of satellite altimeters takes place making use of several of the calibration techniques (i.e., absolute indirect, relative direct Cal/Val), both at sea as well as on land using a prototype microwave transponder (Figure 1).
The present paper presents the evolution of the Permanent Facility for Altimetry Calibration in Gavdos/Crete, Greece, along with its infrastructure and instrumentation as of 2001. The latest results are presented for the calibration of past (Jason-1, Jason-2, and SARAL/AltiKa) and current (Jason-3 and Sentinel-3A) satellite altimetry missions using the latest GDR products and employing sea-surface calibration around Gavdos and western Crete. First calibration results of Jason-2 and Jason-3 altimeters are given using the microwave transponder at the CDN1 Cal/Val site on the mountains of Crete and compared against sea-surface calibration. Finally, concise procedures are given for upgrading an existing permanent altimeter calibration facility to meet the fiducial reference measurement status and the uncertainty budget estimation for final results.

2. The Permanent Facility for Altimeter Calibration

This section describes the evolution over time of the permanent Altimeter Calibration Facility in Crete, Greece, in terms of its infrastructure, instrumentation, and also presents field measurements carried out to develop local and regional reference models for essential geophysical and geodetic parameters.
The Gavdos/Crete Permanent Facility for Altimetry Calibration has been continuously operating and providing absolute altimeter biases for more than 15 years. It includes a major set of permanent Cal/Val sites and prototype scientific equipment at various locations in Crete and Gavdos. At present, this infrastructure includes 17 permanent Global Navigation Satellite System stations, 8 tide gauges, 6 meteorological systems, several communication links, one microwave transponder and a central facility for data archiving and processing, and also to remotely control all field units. The PFAC allows calibration of satellite altimeters over ascending and descending passes, and it also permits multi-mission calibration at crossover locations and over land and water at the same time. At the same locale, connection and cross-comparison of various altimeters can be made using the same orbits, conditions, and settings by employing diverse methods and instrumentations on the ground (sea surface and transponder) for absolute assessment.
All international altimetry missions (i.e., Sentinel-3 and CryoSat-2 (European), Jason series (American-French), HY-2 (Chinese), and SARAL/AltiKa (Indian-French) have been calibrated at this facility with sea-surface techniques as of 2004. In the sequel, the different components of the Cal/Val sites of the infrastructure are described.

2.1. Infrastructure and Instrumentation

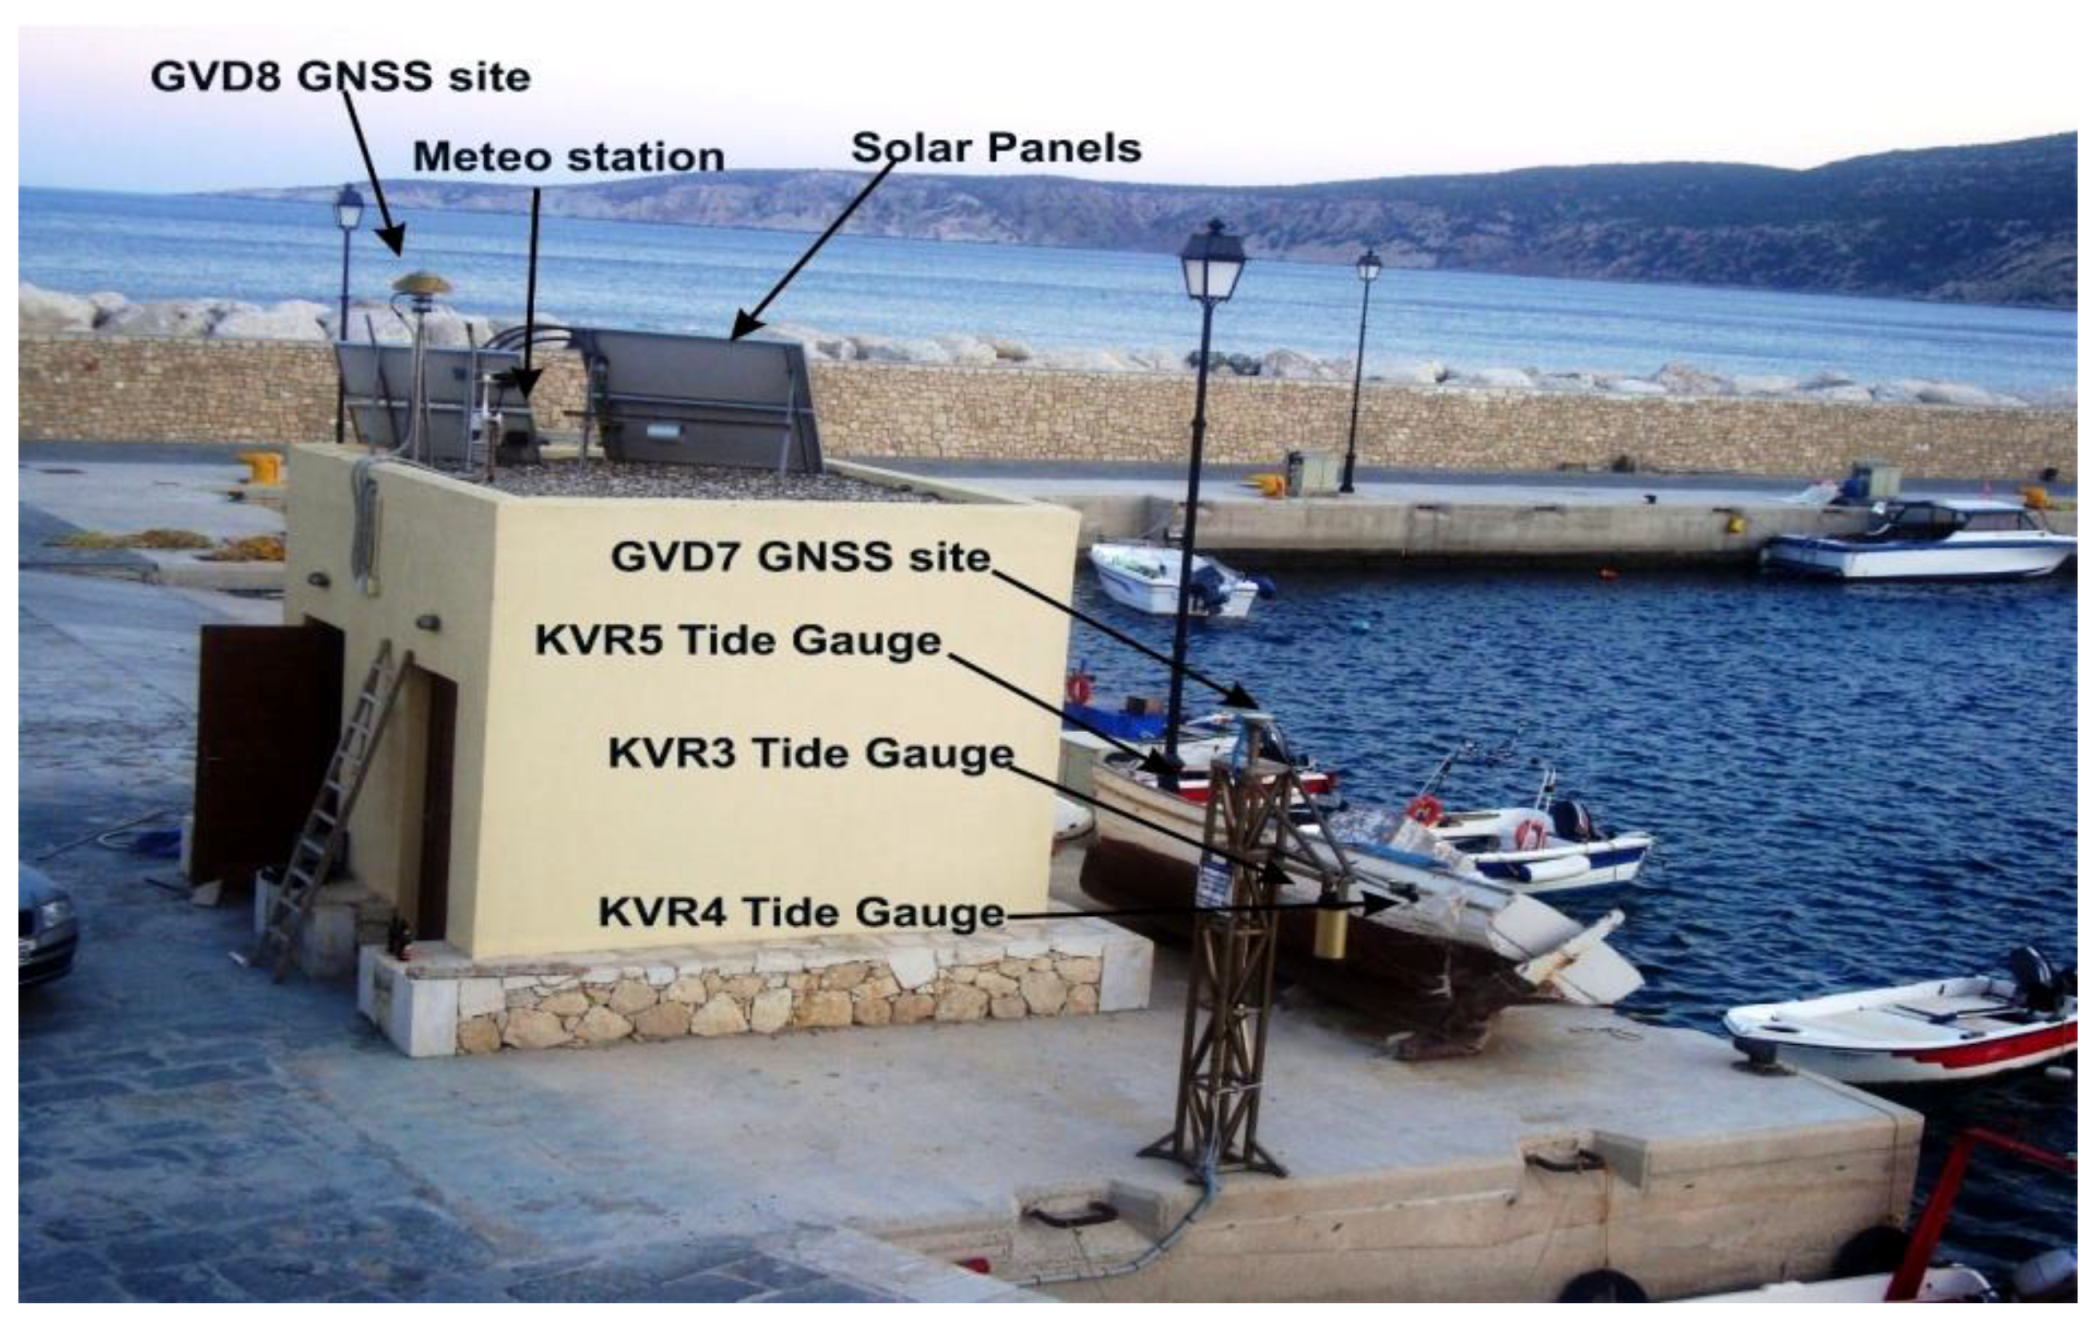
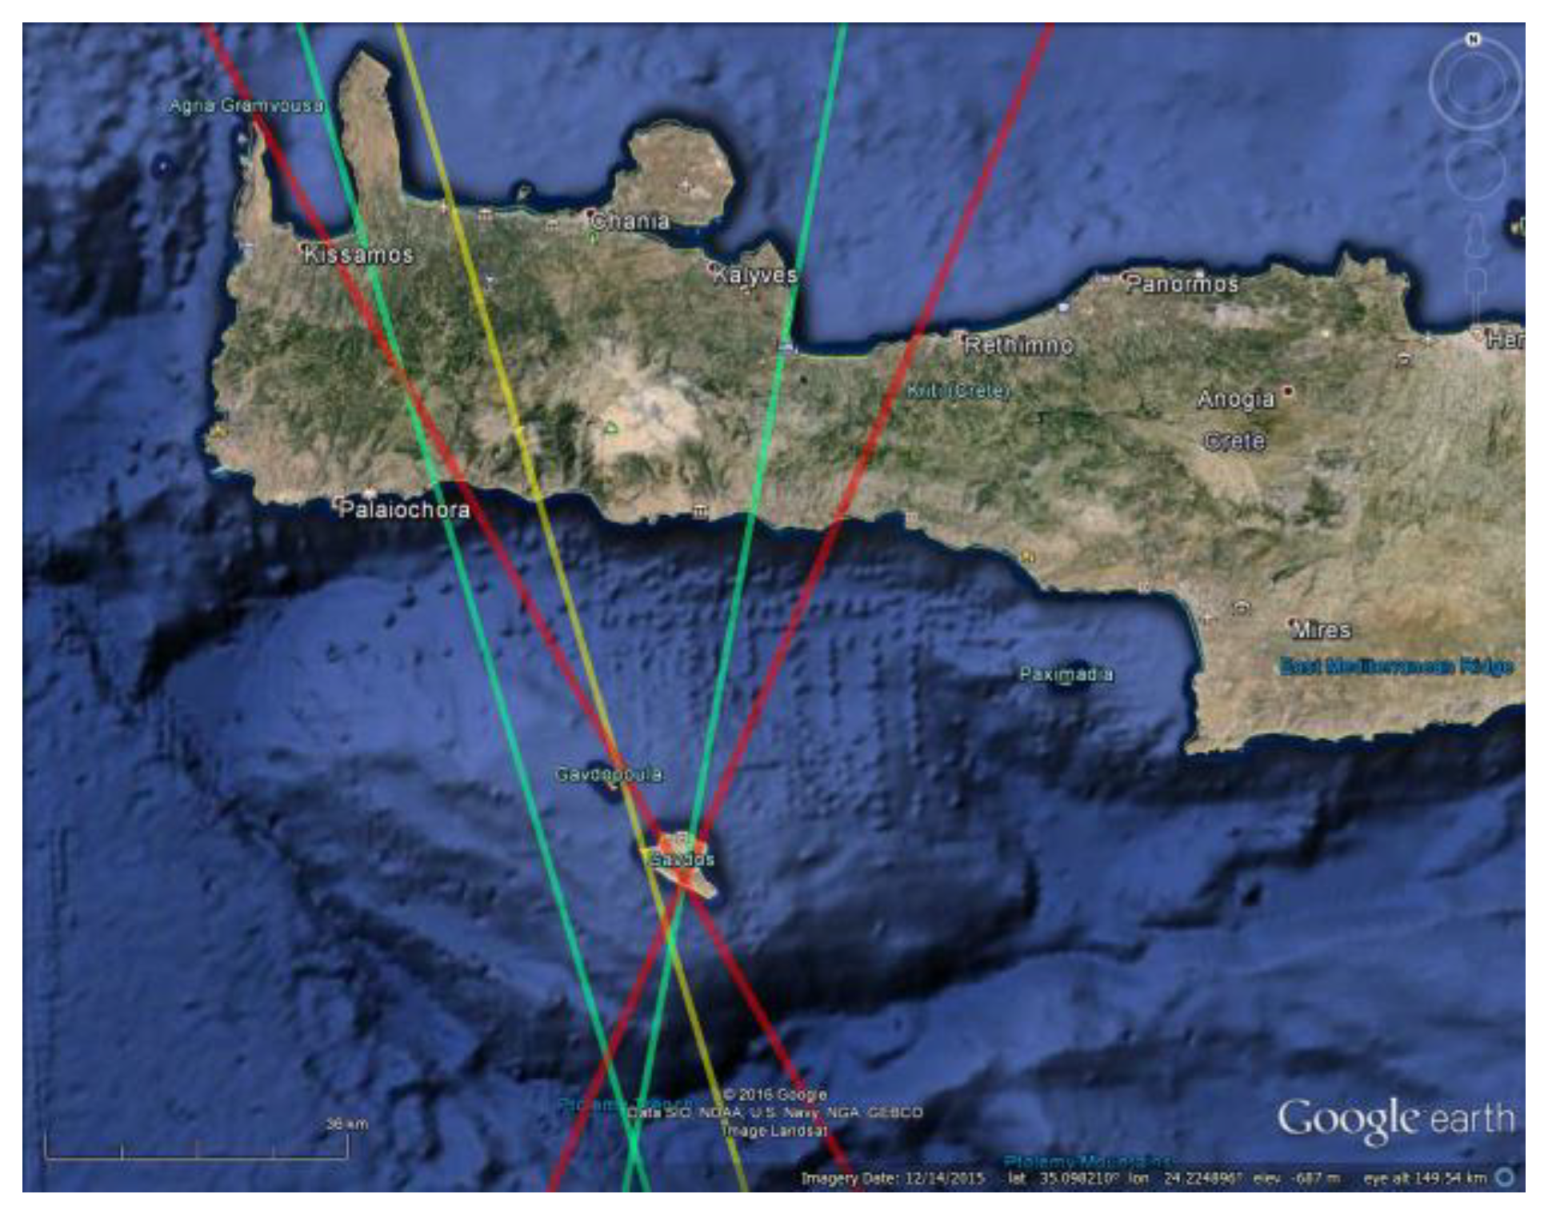
2.1.1. The Gavdos Cal/Val Site

Preparation plans, procedures, and works to establish an absolute sea-level monitoring and altimeter calibration facility on the island of Gavdos were initiated in late 2001, and have been in continuous operation since 2004.
The island of Gavdos occupies a place just in the center of eastern Mediterranean. It is a strategic location for the calibration of satellite altimetry missions, as south of it extends a deep ocean in an over 500 km stretch till Africa with no islands in between to contaminate satellite signals. Ocean tides at this location are small (a few cm); however, ocean circulation, and reference models (gravity models, mean dynamic topography, ocean circulation, bathymetry, etc.) are well established. The location was exactly under a crossing point of the ground tracks of the Jason series satellites (TOPEX/Poseidon, Jason-1, Jason-2, Jason-3, and Jason-CS), and adjacent to an Envisat pass [30] (Figure 1, Figure 2 and Figure 3). Thus, this Cal/Val site has been capable of calibrating ascending and descending orbits of the Jason series.
Gavdos is an isolated island about 40 km south of the mainland of Crete in Greece with only 30–50 permanent residents and sparse boat connections, especially during the winter time when extreme weather conditions prevail for its most part. The infrastructure to accommodate the scientific instruments was built up at three different locations: the “Karave” port (the harbor of the island where boats are berthed), the “Theophilos” site (a University owned land bought in 2001 to host the central Cal/Val site), and the “DIAS” crossover site for the deployment of a microwave transponder (Figure 2 and Figure 3).
During the initial setup of the Gavdos Cal/Val facility, several instruments were installed: two GNSS receivers, two tide gauges (one acoustic and one pressure sensor), a DORIS beacon, a microwave transponder, and meteorological sensors. Throughout its 15 years of operation, several instruments have been replaced at times either because they were damaged by extreme weather or substituted after some period of regular “wear and tear”.
At times, parts of infrastructure have been expanded or upgraded to meet new altimetry measuring techniques and accommodate different satellites, but also to gain confidence in establishing the uncertainty budget of the Cal/Val results. The development timeline of the Gavdos Cal/Val instrumentation is presented in Figure 4 and its present setup at the harbor is shown in Figure 5.
At the outset in 2001, there was no mains power on the island of Gavdos. This forced us to depend upon renewable energy sources, i.e., solar panels and wind generators, to charge batteries at first, and those in turn to supply continuous and stable power to all scientific instruments operating in the field. It was only in 2010 when the mains power was supplied by government on the island. Since then, a hybrid system (mains and renewable power supply) has been implemented in Gavdos for safety and continuity of operations at the Cal/Val facility.
When running scientific instruments in the field on remote islands, access, operations, and control of them becomes a difficult issue. At the early establishment of Gavdos Cal/Val, the island lacked decent and stable telephone and communications links. Therefore, several alternate channels in communications were sought and examined, e.g., UHF, GPRS, and satellite links (see also Figure 6) in an effort to ensure that observations were always accessed by the Operations Control Center (OCC) at the Technical University of Crete on the mainland of Crete. After several trials and errors, it has been evident that satellite communications had been the most reliable means, especially after their recent reduction in service cost. These satellite links serve as the essential communications carrier for the PFAC at the moment. By following the same example as done regarding the power supply, two independent communication channels (e.g., satellite and GPRS links) have been put into action to safeguard access to the scientific instruments, and to download and archive field observations immediately and automatically onto the Operations Control Center in Crete.
Gavdos Cal/Val has been providing absolute calibration over sea surface for all altimeters of the Jason series (Jason-1, Jason-2, and Jason-3) along their descending and ascending passes No. 18 and No. 109, in conjunction with transponder calibration at the crossover point over the land of Gavdos (DIAS Cal/Val site). Later in 2013, this Gavdos Cal/Val site could calibrate SARAL/AltiKa using its ascending Pass No. 571 as this groundtrack intersects the island from the south to northwest and finally reaches southwest Crete (Figure 7). As of 2016, the European Sentinel-3A has been calibrated by the Gavdos Cal/Val using its ascending Pass No. 14 at sea, as well as its descending Pass No. 335. This last pass of S3-A has been used for sea-surface calibration north and south of Gavdos, and could be simultaneously used for land calibration, plus it crosses the DIAS Cal/Val site of the transponder on Gavdos (Figure 7).

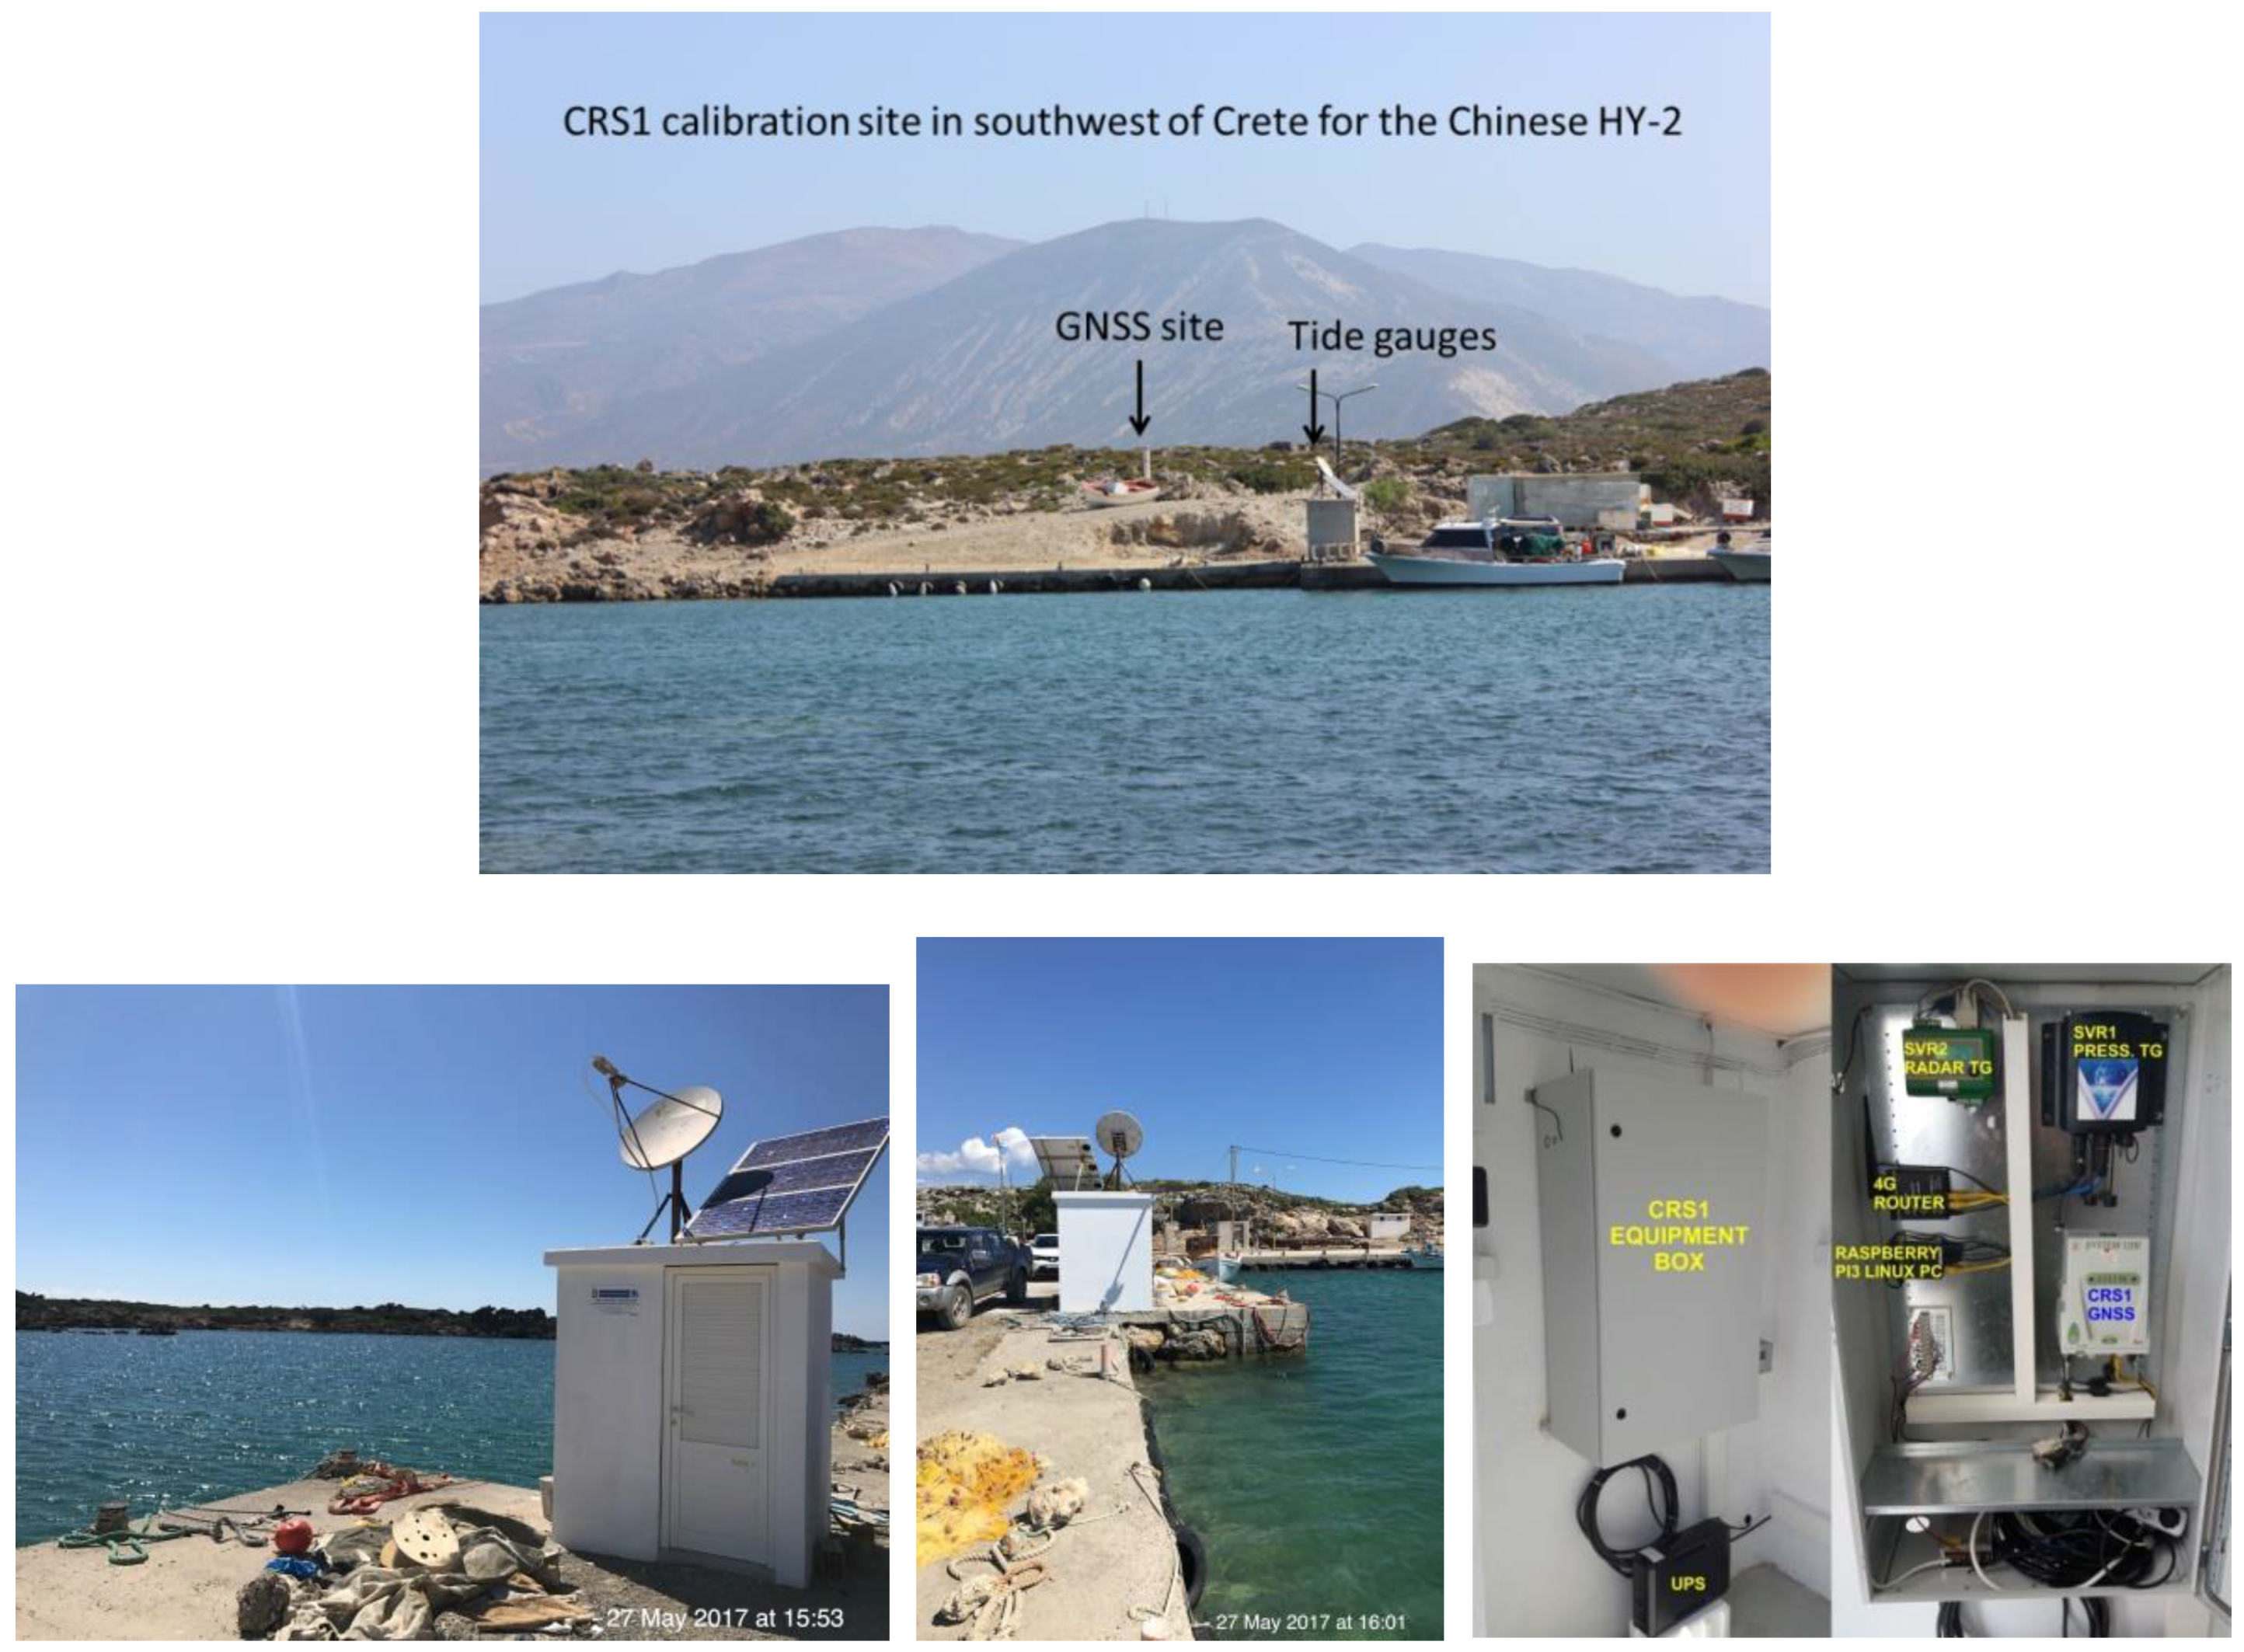
2.1.2. The CRS1 Cal/Val Site

The CRS1 Cal/Val site is located in a small, well-protected fishing harbor at the tip of southwestern Crete. Its establishment was initiated in 2007 primarily for the calibration of the American Navy’s Geosat Follow-On (GFO) altimetric mission (Figure 8) as it is almost under a crossover of its ascending and descending orbits. The site had been fully operational in March 2008 but unfortunately it did not serve that purpose as an onboard problem of the GFO satellite led to its termination on 26 November 2008. A decision was then made to continue to maintain the CRS1 Cal/Val site as operational to monitor tectonic deformation and tsunamis.
Then later in August 2011, the launch of the Chinese HY-2A altimeter mission provided the impetus for re-activating the CRS1 as a satellite altimetry Cal/Val site. The HY-2A descending Pass No. 280 happens to pass close by and only 9 km west of the CRS1 Cal/Val site (Figure 8).
A set of a pressure and a radar tide gauges has been operating at the CRS1 Cal/Val site, supported by a GNSS receiver and a meteorological sensor (Figure 9).
Till now, the CRS1 Cal/Val site has been primarily employed for the calibration of the HY-2A altimeter [31]. It is also planned to act as a calibration site for both Sentinel-3A (Pass No. 278) and Sentinel-3B (Pass No. 014) altimeters as a crossover of these satellites takes place 20 km west of CRS1 in open and deep ocean (3000 m deep, Figure 10).

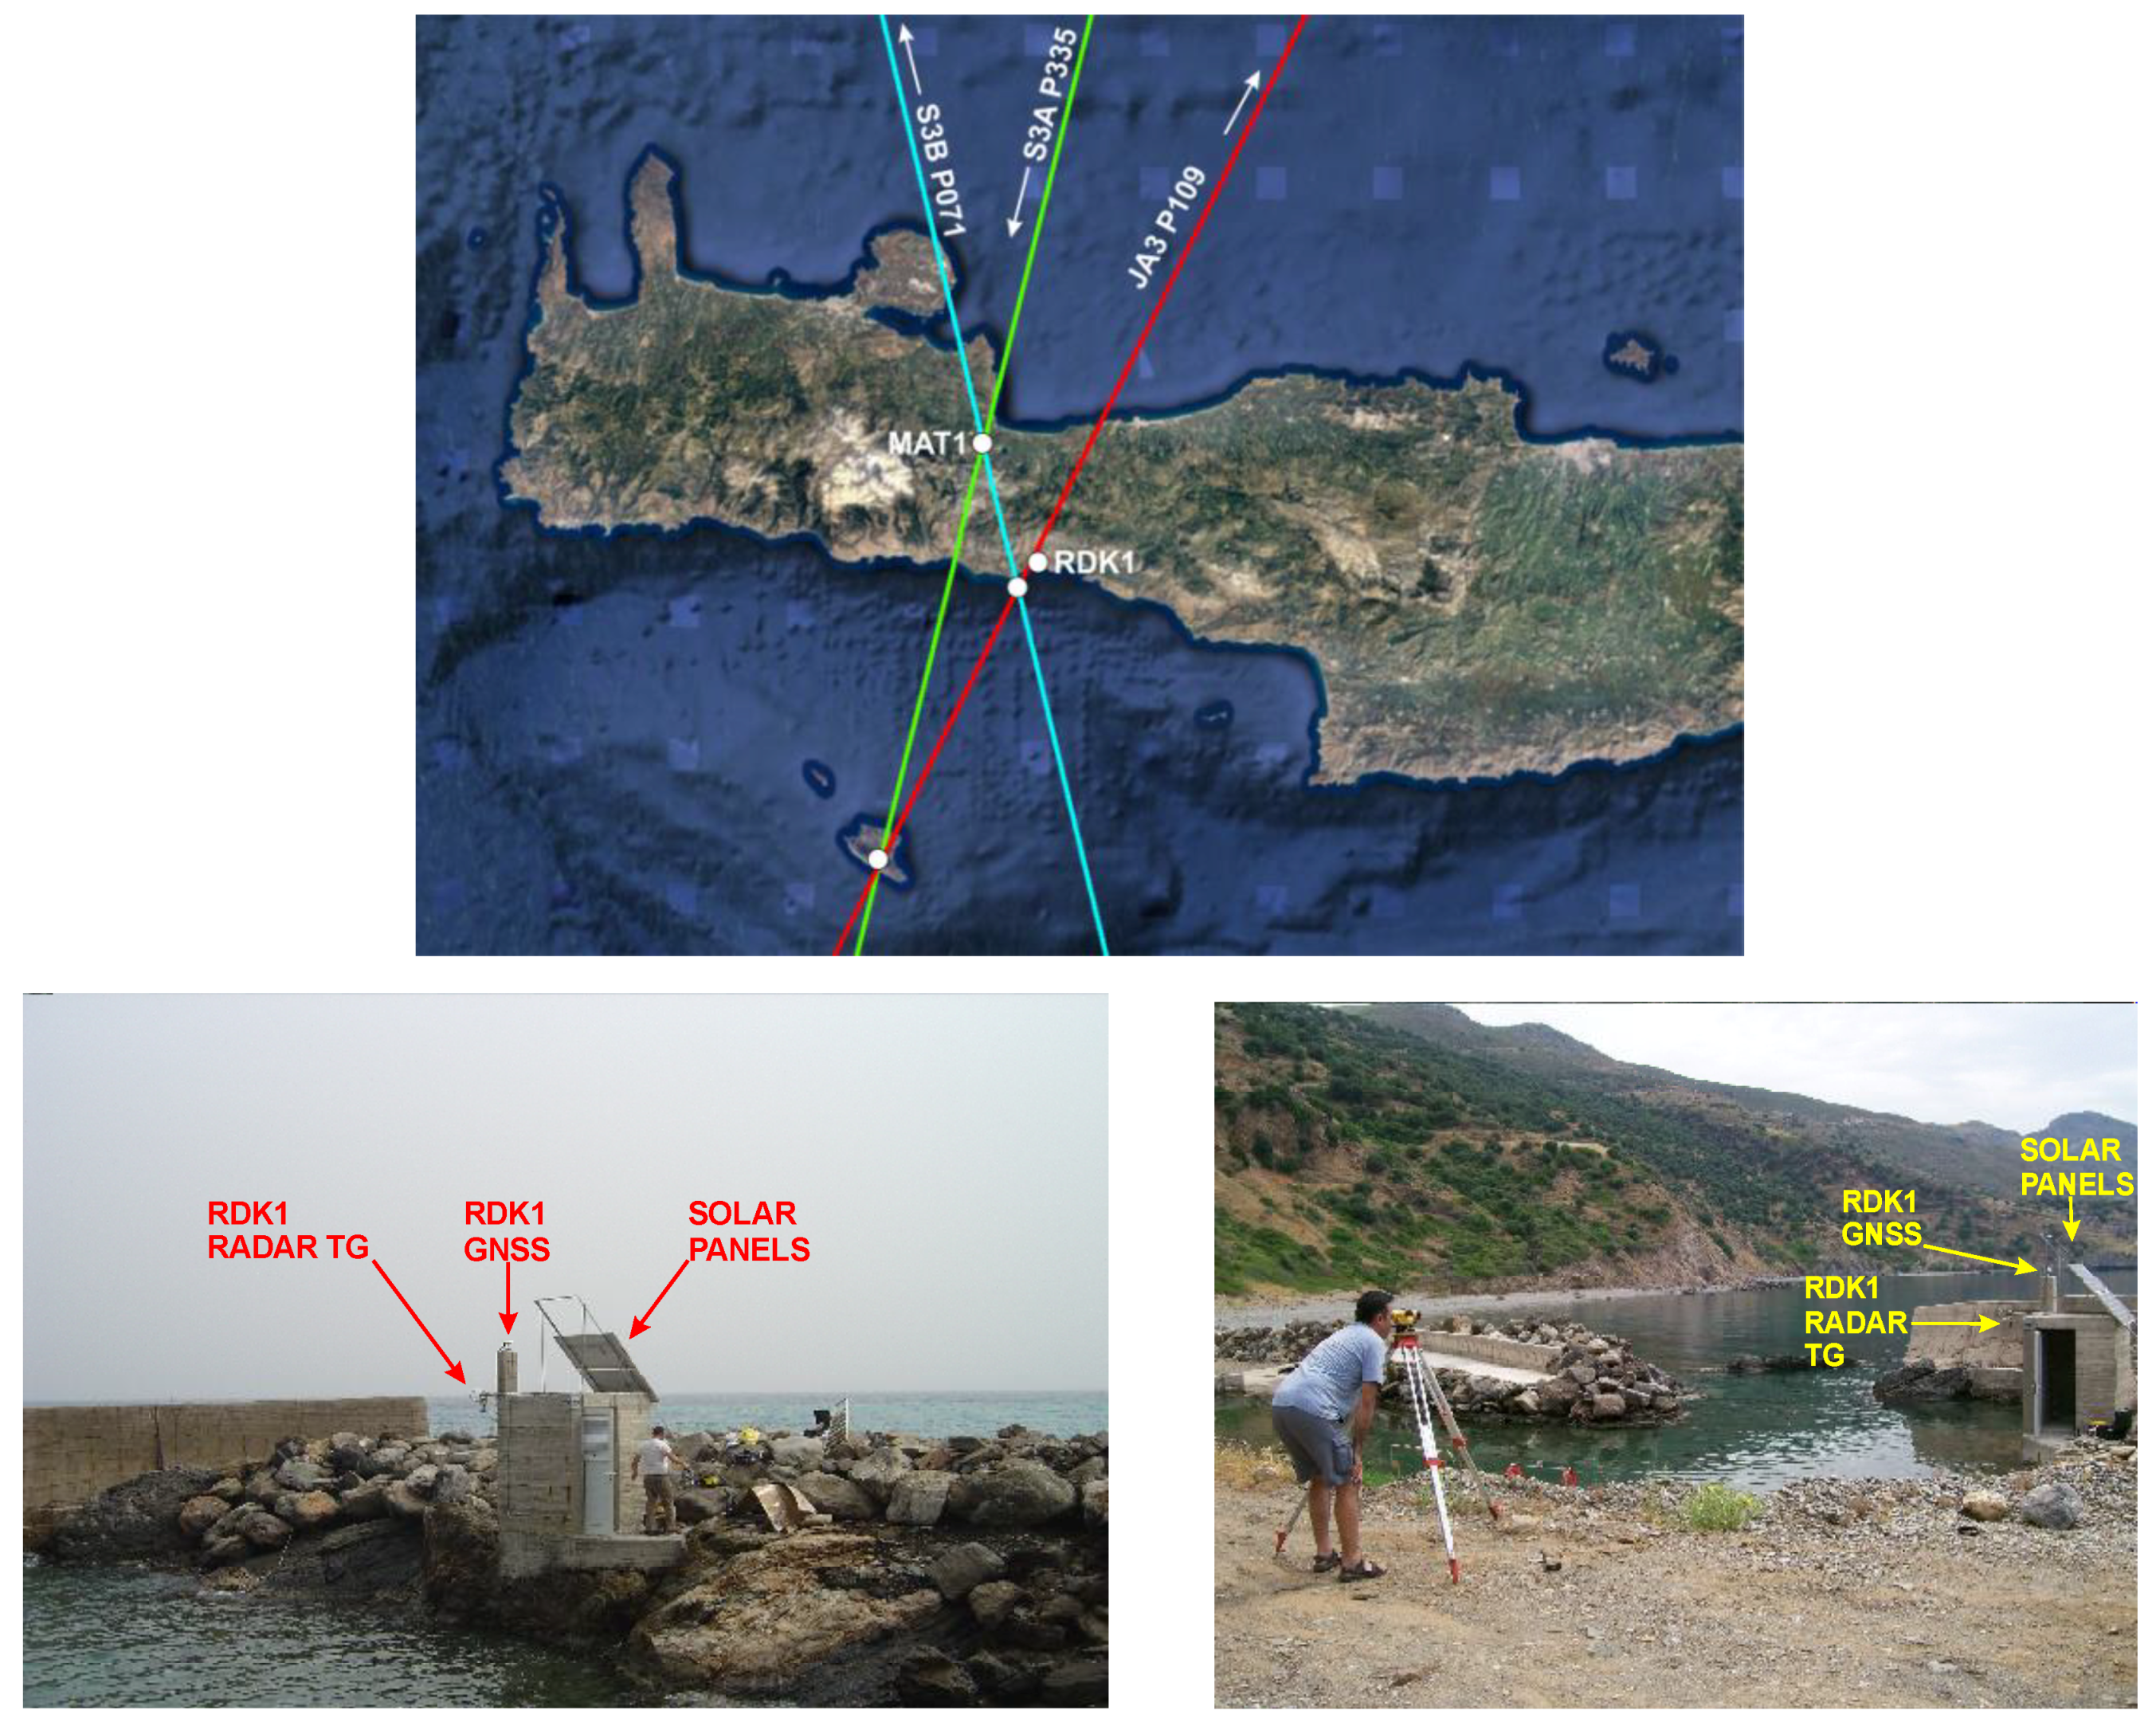
2.1.3. The RDK1 Cal/Val Site

The RDK1 Cal/Val site is located in a small private fishing harbor south of Crete and is exactly under the Jason No. 109 ascending orbit. It was established in February 2009. The Jason satellite moves up from south of Gavdos, intersects the island, and then continues to meet the RDK1 Cal/Val site in southern Crete. The segment of the Jason orbit (No. 109), south of Gavdos, has already been used for sea-surface calibration for more than a decade. The RDK1 site comes to fill in the gap and strengthen the calibrating region from south to the north, astride Gavdos, and certainly restores confidence for the results produced in the southern part. The RDK1 Cal/Val site not only happens to serve the Jason calibration but it presents itself to calibrate Sentinel-3B as it lies along its ascending Pass No. 71. In addition, the Sentinel-3A Pass No. 335 descends from RDK1 (9 km west of it) towards Gavdos and completely converges to Jason groundtrack when it comes nearer to Gavdos. Therefore, this RDK1 can serve as a testing area for different altimetric missions, but also ascending and descending orbits could be compared against each other.
The sea that extends between Crete and Gavdos is deep enough with a depth of about 1400 m. Thus, it is suitable for satellite calibration over a stretch of 20 km with uncontaminated observations. The area has been experiencing strong west to east currents, so the dynamic topography has to be carefully examined. Over the period of 1990–2008, ocean circulation has been thoroughly investigated [32]. At the same time, several underwater sensors are regularly deployed at various locations in this water channel. These instruments are operated by government institutes to monitor different geophysical parameters (e.g., wind, pressure, temperature, wave height, salinity, currents, turbidity, etc.), and thus a good picture of what is happening in terms of the ocean currents and circulation is known.
At the moment, the RDK1 Cal/Val site is equipped with a radar tide gauge, a GNSS receiver and a set of communication links with a solar power system (Figure 11). It is planned that another tide gauge is to be setup there to increase confidence in water level observations. All instrumentation is under either lab or factory testing and characterization.

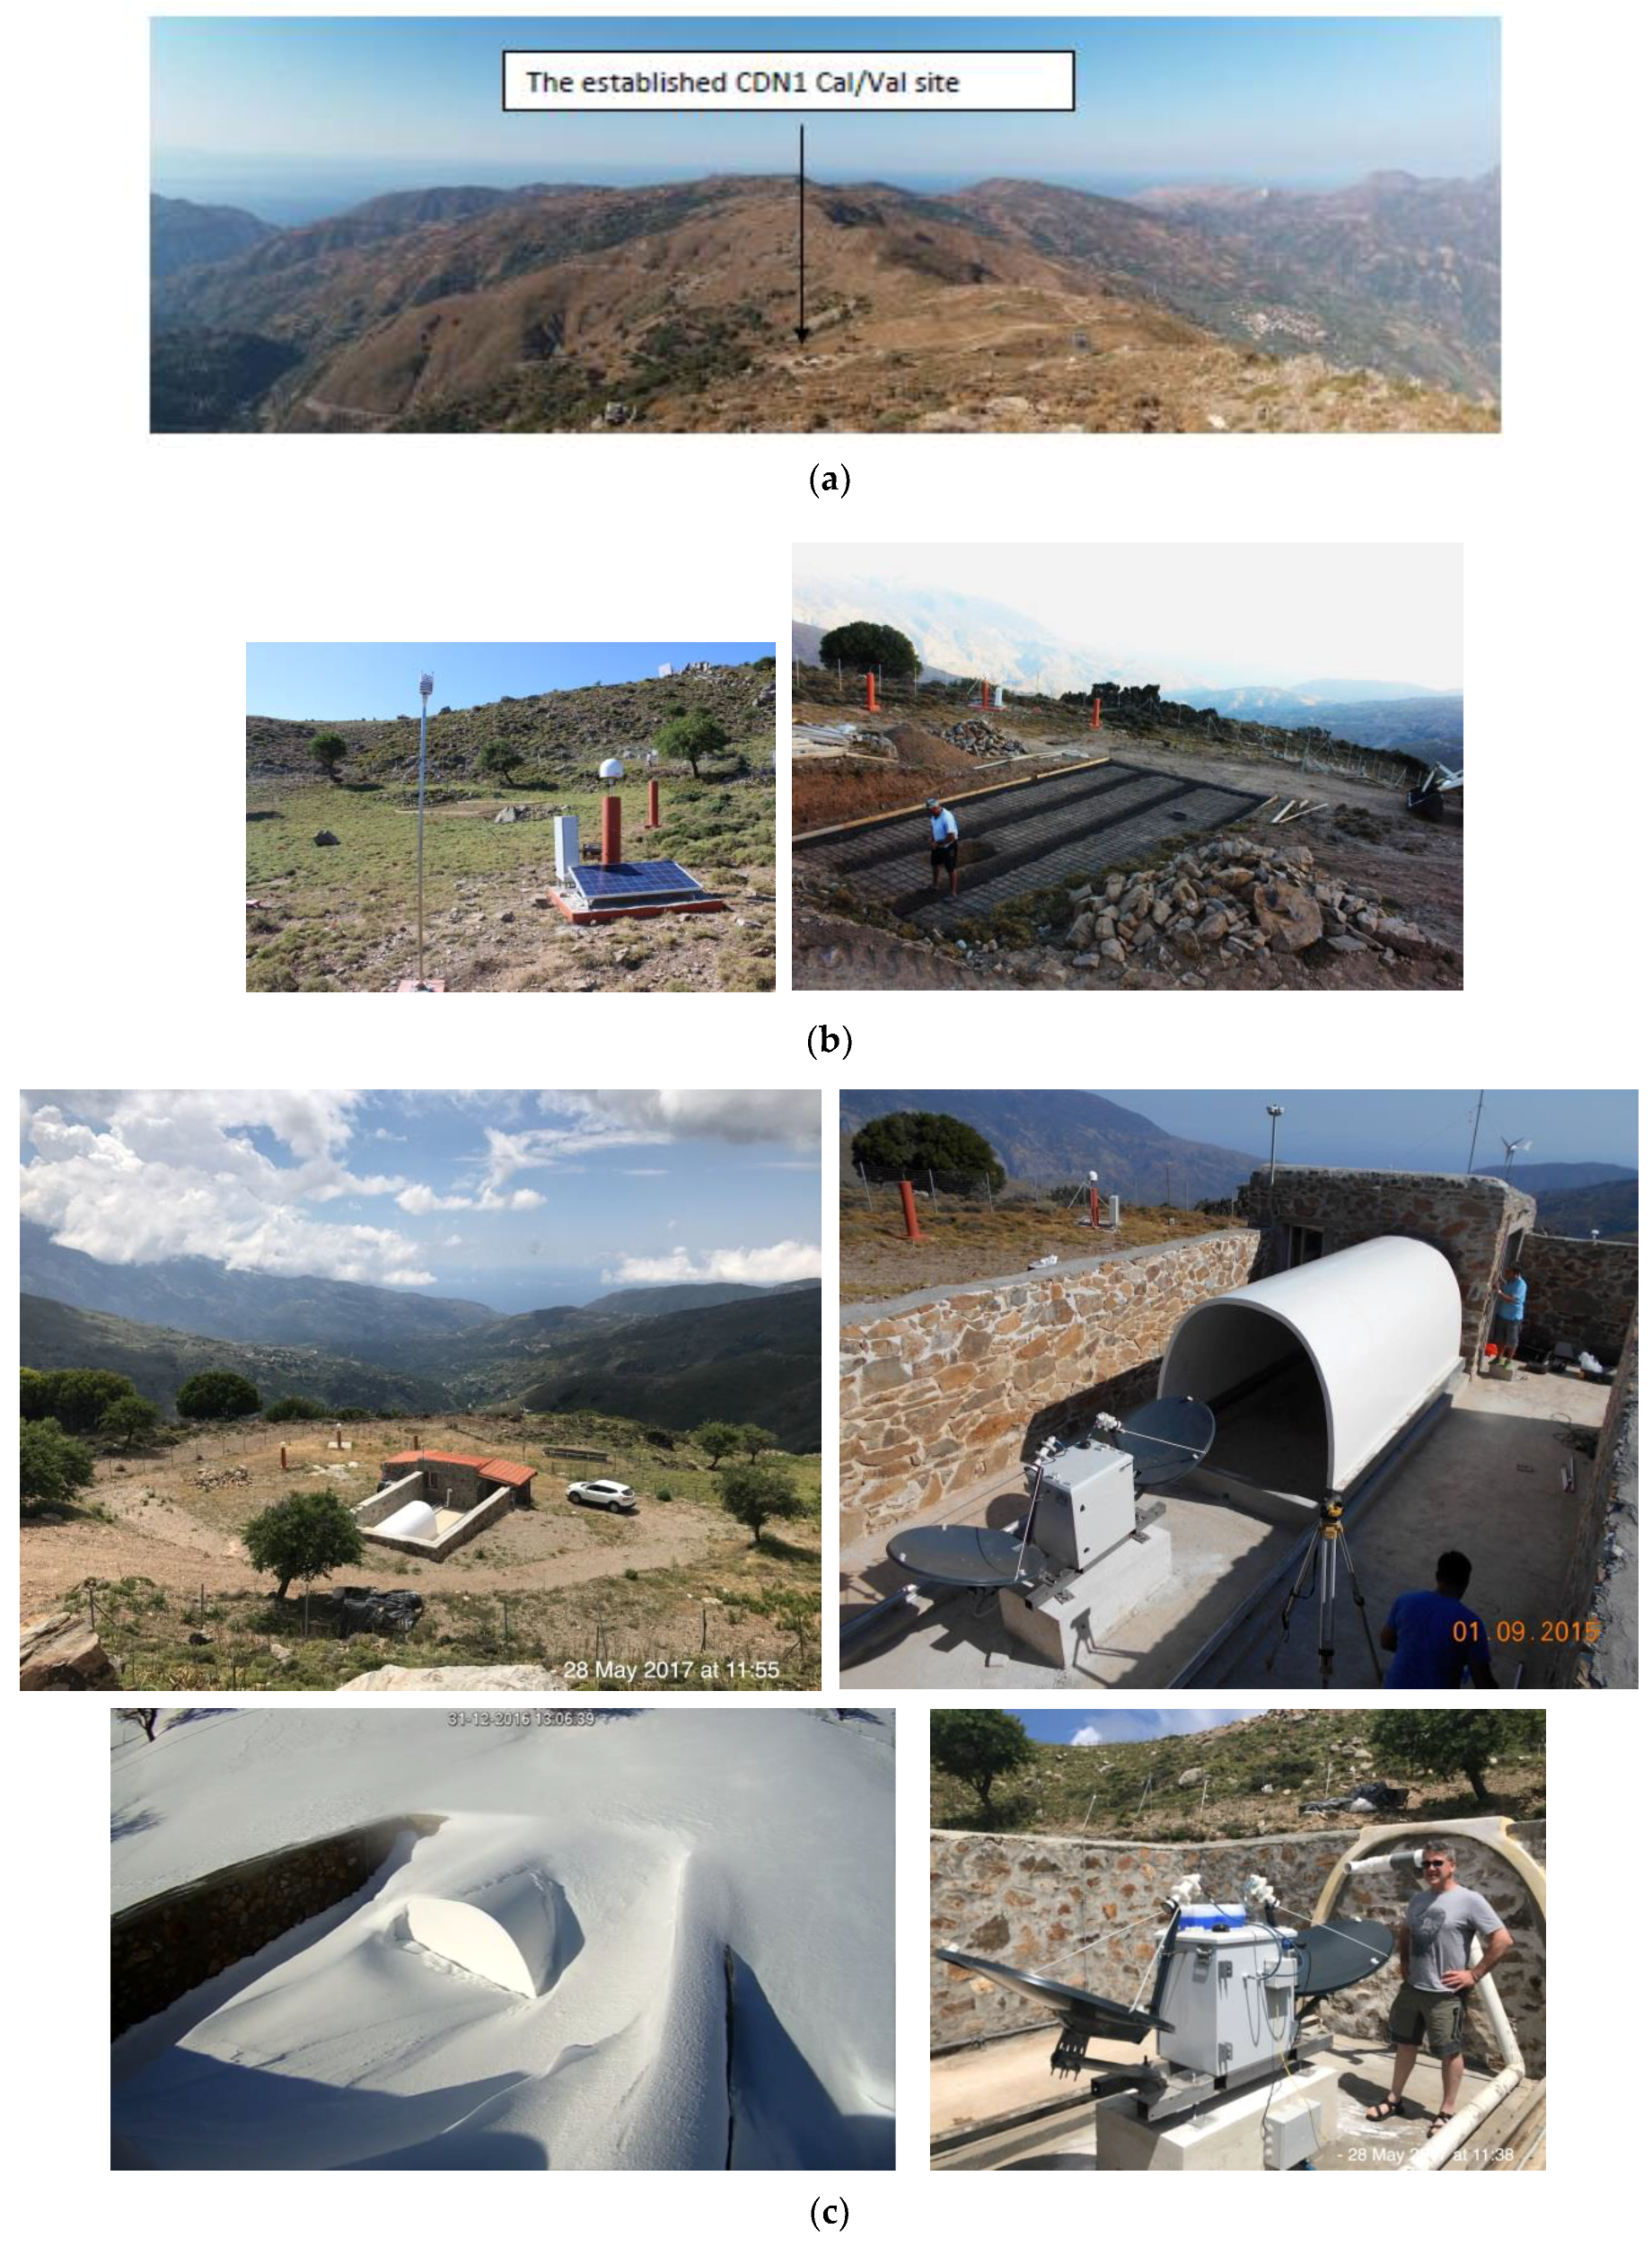
2.1.4. The CDN1 Transponder Cal/Val Site

A permanent Sentinel-3 altimeter site of the European Space Agency has been established in western Crete for calibrating both Sentinel-3A and Sentinel-3B at the same location. During early surveys for field reconnaissance in 2013, the location was looked after to be able to calibrate other altimeters as well, and particularly the baseline/reference missions of Jason (i.e., Jason-2, Jason-3, and Jason-CS/Sentinel-6). A thorough examination of several sites has taken place in the region and a site had been identified and finally selected at a mountainous location in western Crete. That was named the CDN1 Cal/Val site. It has been picked to be a triple crossover point between Sentinel-3A, -3B, and Jason; actually, it is a quadruple crossover place, as it is also only 2 km away from the ground track of SARAL/AltiKa (previously of Envisat).
In the sequel, a signal analysis of the altimeter satellite at the proposed site was performed by CNES, France. The investigation revealed that altimetry signals from Jason-2 scattered from the surrounding surface at CDN1 were sound and perfectly compatible with the needs and the requirements set for transponder calibration.
Meanwhile, a prototype microwave transponder had been constructed by the Technical University of Crete, Greece [33]. It took almost three years (2008–2011) to manufacture it and during this period ESA provided specifications and technical support. This transponder had been fully characterized for 4 months (March–July 2012) at the Compact Payload Test Range facilities in ESA/ESTEC, the Netherlands. (Figure 12). This instrument has been setup at the CDN1 Cal/Val site and has been operational as of 2015.
The transponder Cal/Val site is located on a mountainous area at about 1000 m altitude. Control and access to the instrumentation is achieved remotely via central and backup communications links. The instrumentation at this altitude needs to be, and certainly is, protected from extreme weather conditions (snow, wind, lightning, etc.). The external GNSS antennas and the meteorological sensors are built to operate under a harsh environment in the field. Therefore, no special protection has been necessary for these instruments. This is not however the case for the transponder, the GNSS receivers, the communications links, and the power supply units (wind generator, solar panels, inverters, etc.).
Along those lines, special protective housing for the transponder and the instrumentation had been designed and constructed. This is because if the transponder’s antennas are exposed to, for example, strong winds, then any minor alterations in their orientation (even in sub-mm level) may lead to erroneous observations. Several solutions for the transponder housing had been evaluated given certain constraints regarding construction material, operating environment, etc. In the end, it has been decided that the transponder be protected by a sliding roof that will move and leave the instrument free of any signal interference during calibrations (Figure 13). In summary, the CDN1 Cal/Val site has been fully operational as of September 2015. It provides external, independent post-launch calibration services for all Ku-band altimeters that fly over the area.

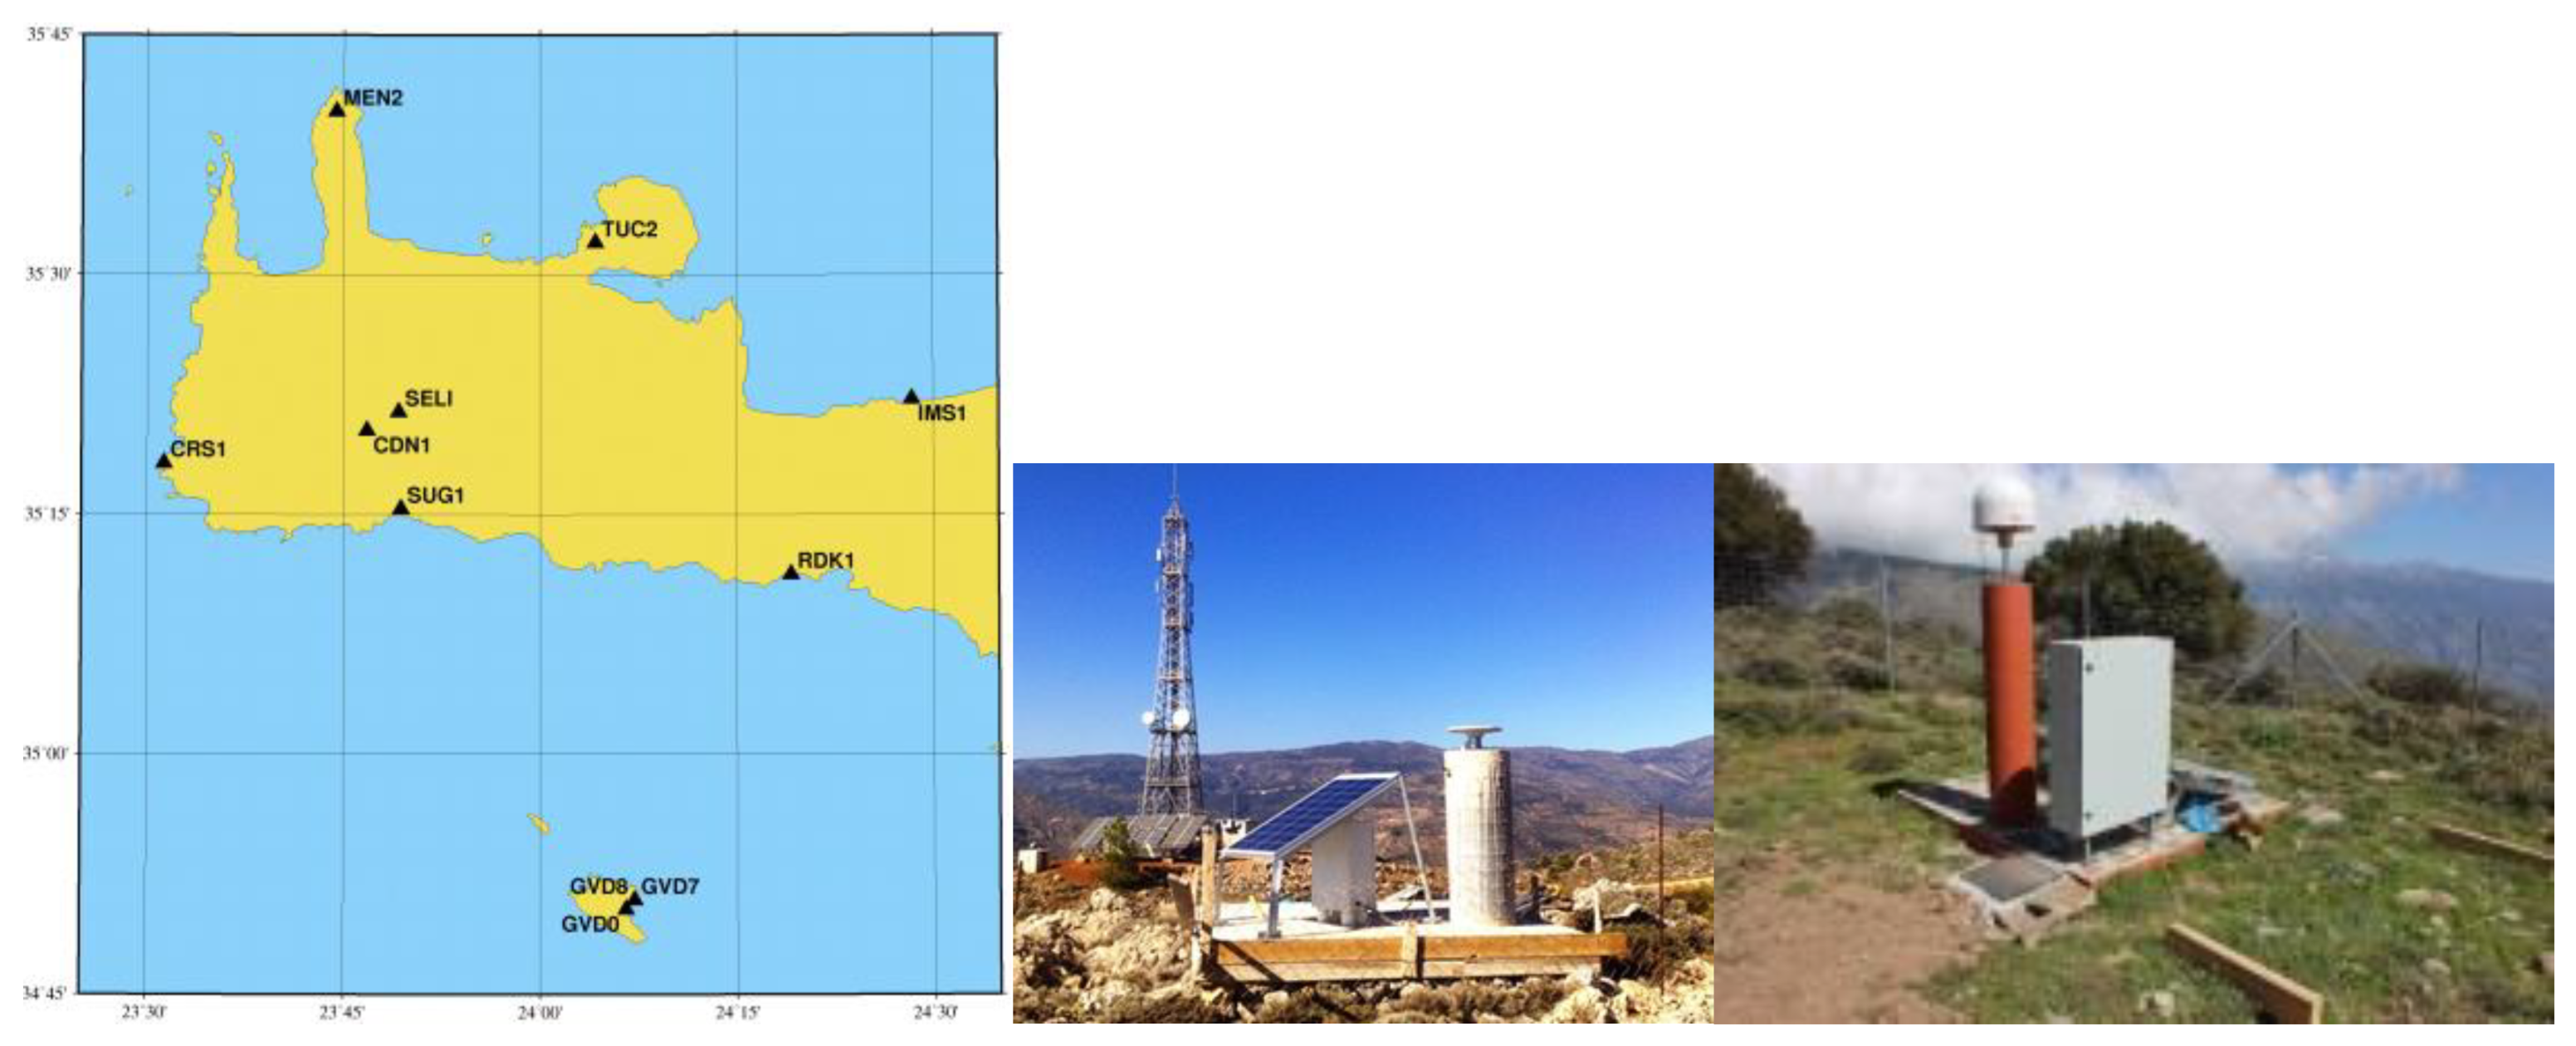
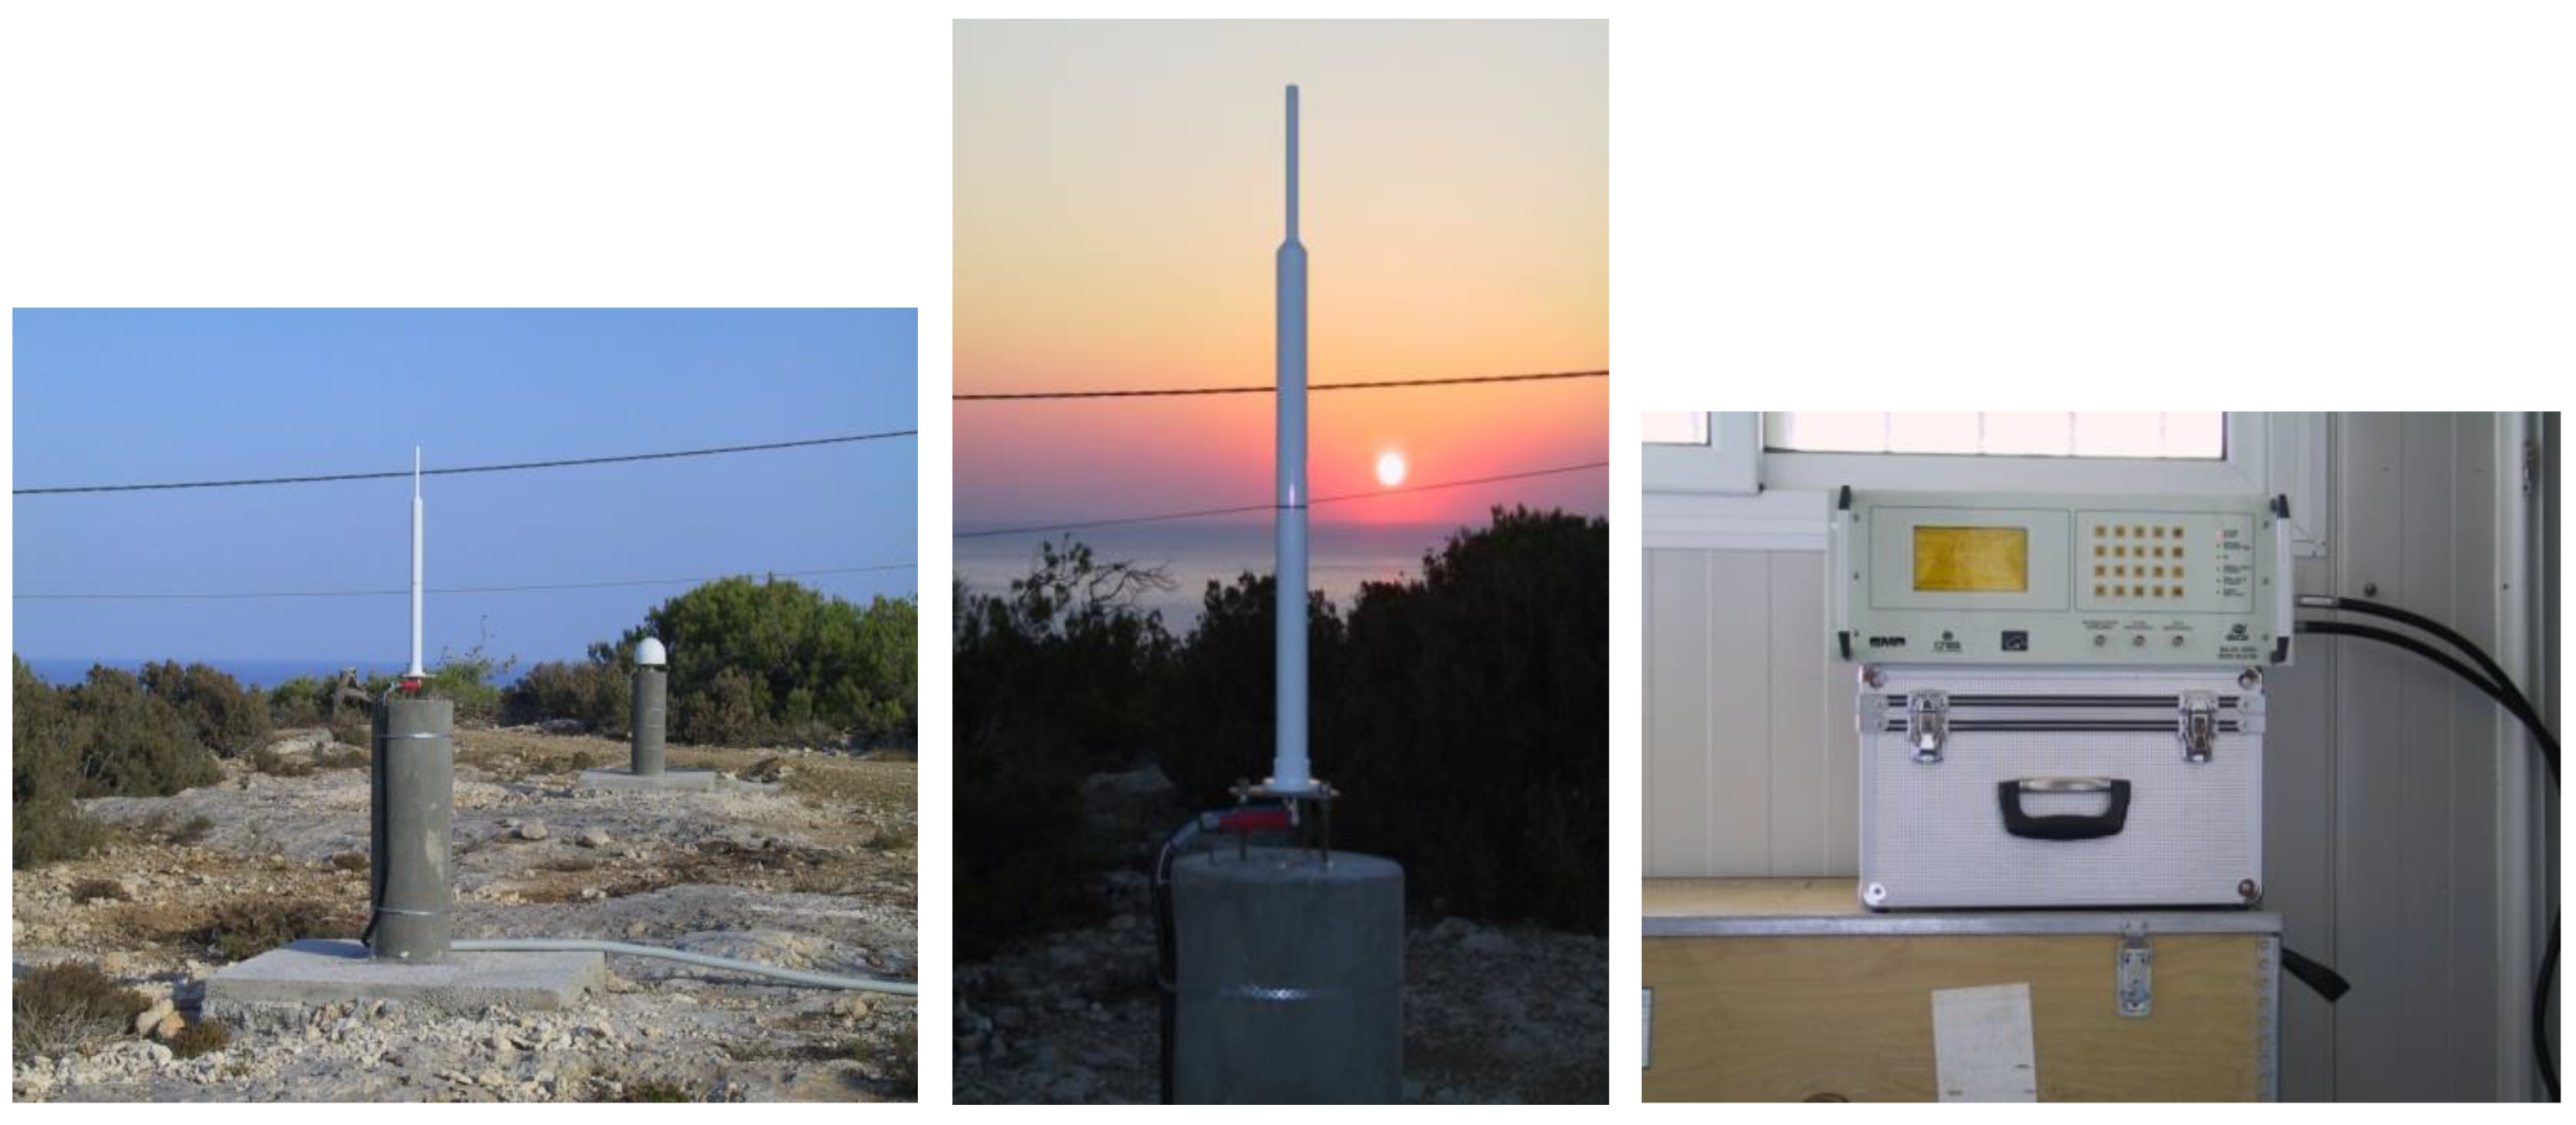
2.1.5. The GNSS Monitoring Network

A network of continuously operating GNSS reference stations [34] has been established by the Technical University of Crete in western Crete as early as 2001. This supports the PFAC operations. A map with the various locations of the GNSS monitoring network as distributed in western Crete and some of site pictures are shown on Figure 13. This permanent array has been providing absolute determination for the coordinates of the Cal/Val sites, as well as keeping track of ionosphere and wet troposphere delays of satellite signals in the region. It also acts as a geodetic infrastructure for monitoring tectonic deformation in this earthquake prone part of Crete.
Three GNSS stations also operate inside the campus of the Technical University of Crete: (a) The “TUC2” GNSS station (Figure 14 Upper), continuously operating as of June 2004. This was officially the first station in Greece to be part of the European Reference Frame Permanent Network. (b) The “TUC3” station (Figure 14 Lower Left) established in February 2013 as part of the EGNOS (European Geostationary Navigation Overlay System) Resources Real Time Performance Array. (c) A BeiDou Chinese station (called “TUC4”) (Figure 14 Lower Central and Right) set up in May 2012 (Figure 15).
Processing of this network data from those permanent GNSS sites is carried out using three different types of scientific software: GAMIT [35], Bernese [36], and GIPSY [37]. The coordinates and their velocities for each GNSS site are estimated along with the ionospheric and tropospheric signal delays. These atmospheric signal delays are also used to provide ground truth verification for the radiometer on board the satellite altimeter. Table 2 and Table 3 show the latest results for the coordinates, velocities, and their processing uncertainties of 11 such GNSS stations in the ITRF 2008 reference system.
Independent positioning systems and processing techniques have been applied to achieve FRM standards for the determination of geodetic coordinates and results. For example, an inter-comparison and cross-examination of tropospheric delays, as determined by GPS [called “GVD0”] in Gavdos but also with a collocated DORIS beacon (less than 50 m away, called “GAVB”) (Figure 16), have been carried out [38]. This DORIS site had been installed on 27 September 2003, as part of the permanent facility for satellite altimetry calibration. Both of these sites are less than 1.5 km away from the harbor Cal/Val site in Gavdos where the main tide gauges are located.
In the past, a Geodetic Mobile Solar Spectrometer (GEMOSS-I), developed by ETH Zurich, Switzerland, was used at the PFAC to retrieve the precipitable water vapor content in the atmosphere [39] during a satellite altimeter pass. From 11 January to 11 January 2003, a GEMOSS-I radiometer campaign was conducted in Rethymnon, Crete, to measure the zenith wet path delay during the overflight of Jason-1 on 11 January 2003 (Figure 17).

2.1.6. The Operations Control Center

The central control of the PFAC takes place at the Operations Control Center at the Technical University of Crete, where all observations from all instrumentation in the field are transferred for archiving and analysis. Two file servers (one acts as back-up unit) are used for data archiving. The main file server, called “THALES,” and the back-up units are installed inside the University Data Center, where optimal and controlled computer conditions are kept throughout the year. Scientific software for data processing is installed in dedicated computer servers at the University as well (Figure 18).
At times, precise orbit determination for the satellite altimeters has been supported by local Satellite Laser Ranging. As altimeters fly over Cal/Val sites and eccentric to their ground track, their orbit has been tracked by the French Ultra-Mobile Transportable Laser Ranging System, operated by the Observatoire de la Cote d’Azur, France. The observation campaigns took place between March and October 2003 (Figure 19). During these 6 months, the Jason-1 satellite has been tracked in ascending and descending orbits over the Gavdos Cal/Val sites. About 1400 observation passes have been collected for Jason-1 and TOPEX/Poseidon, as well as the Lageos, Starlette, and Stella satellites.
Between May 2013 and May 2014, and before the transponder was transferred and installed to its permanent CDN1 Cal/Val site on the mountains of Crete, the transponder had been deployed at another site on University Campus for testing and evaluation. At this site, called “SLR2,” several transponder calibrations took place for CryoSat-2 (Figure 20 and Figure 21).

2.2. Regional Models and Reference Surfaces

Calibration of a satellite altimeter is carried out in open sea about 20 km away from the land Cal/Val site to avoid any contamination or interference of altimeter signals. This transfer of precise measurements from the Cal/Val site on land to the open sea requires absolute and accurate knowledge of the reference geoid and mean dynamic topography in the area (MDT).
Geoid and MDT models in the region of western Crete and Gavdos have been developed after almost 20 years through dedicated gravity surveys (terrestrial, marine, and airborne), as well as by other independent satellite observations. To determine heights for geoid and MDT at certain locations at sea needed for calibration, various gravimetric and estimation techniques have been applied to original observations. These have been, for example, spatial statistics, colocation, Kriging, remove and restore, and several approximation and interpolation methods. The final produced uncertainty with these geoid models depends upon the instrumentation used for gravity observation, the models applied to convert gravity into heights, and the digital terrain models, including bathymetry, local conditions, etc., for observation reductions. All in all, the final height discrepancy in the absolute sense between the geoid and the ellipsoid is no less than ±35 cm as an absolute value, though it does not exceed ±1 cm in a relative sense for the region of calibration. Recent observations, for example with GOCE and GRACE gravity satellites may enable us to claim that the final produced accuracy of the absolute geoid height is about ±8 cm for the Gavdos/Crete Cal/Val site. The absolute determination of the orthometric height at the Cal/Val site based on these models is not that clear and definitive, even today. It requires extreme and careful fine-tuning for satellite altimeter calibration whose confidence and accuracy improves over time and with experience. Height determination for the Cal/Val observations is an extremely sensitive component in satellite calibration but at the same time it constitutes an influential but less known parameter when establishing a new Cal/Val site.
In the past (circa 2010), the relative accuracy of the applied geoid and MDT models and calibrating techniques has been verified by boat, ship, and buoy campaigns, as bathymetry is deep and changes abruptly around Gavdos and western Crete [40,41]. These campaigns were made predominately along the satellite groundtracks at sea. In 1990–2008, ocean observations with drifters, but also dedicated cruises, have also established the local ocean circulation and sea conditions. In January 2003, an area of about 200 km × 200 km was surveyed by an aircraft with an absolute gravimeter and laser altimetry, along with a dedicated survey ship at sea, around the PFAC [42] (Figure 22 and Figure 23). The data collected were integrated with previous gravity campaigns using airborne [43], shipborne, and terrestrial resources to generate, through optimal combinations, several regional geoid models [44]. Details of those reference surfaces currently used to perform sea-surface calibration at the Gavdos/Crete PFAC are presented in Reference [40].
Bias results for all these altimeters (i.e., Jason-1, Jason-2, Jason-3, SARAL, HY-2A, and Sentinel-3A) have been obtained with sea-surface measurements, but also with crossover comparisons at sea. For the crossover analysis, heights have been compared for various altimeters when they happen to fly within a short period of time (i.e., 1–3 days) at the same location at sea.
Transponder results for Jason-2, Jason-3, and Sentinel-3A have been produced at the CDN1 Cal/Val site, while along the same orbit and cycle but 4–7 s apart, calibration with sea surface techniques is determined with the Gavdos Cal/Val facility. The following section presents the latest calibration results for several altimetric missions employing the sea-surface calibration.

3. Sea-Surface Calibration Results

The first calibration results for Jason-1 with Gavdos Cal/Val were reported in 2004 [45]. Since then, a standardized sea-surface methodology has come out for calibrating satellite altimeters using the ascending orbit No. 109 and the descending orbit No. 18 for Jason satellites [24,40,46,47,48,49]. It is not the purpose of this paper to provide details on calibration procedures over the sea surface. The reader is referred to the previous literature for details on the methodology.
The latest results for the Jason satellites, when the sea-surface calibration methodology is applied, are presented in Figure 24 with the following product versions: Jason-1 (GDR-E), Jason-2 (GDR-D), and Jason-3 (GDR-D) (Table 4).
Calibration is carried out at sea zones between 14.5 km to 24 km for Pass No. 109 (ascending), and 9 km to 20 km for the Pass No. 18 (descending). Sea calibrating zones are with respect to the point of closest approach and south of Gavdos. The segment of the ascending orbit No. 109 in Jason, north of Gavdos (extending 12–20 km North), provides bias results as well, but based on two Cal/Val sites, i.e., Gavdos and RDK1 Cal/Val. These calibrating zones have been selected after careful and detailed examination of geoid and MDT models at these regions against bias performance, bathymetry changes, and are also measured and verified by boat campaigns [40].
For Jason-1, sea-surface calibrations started at cycle No. 70 (December 2003), as site constructions had not been concluded earlier, along with instrument set up at the Cal/Val site in Gavdos. The Jason-1 calibration ended at cycle No. 101 (October 2004), as at this time works for building a new harbor in Gavdos had been initiated and instruments were temporarily removed from the Cal/Val area.
Calibration results for Jason-2 are complete for all of its cycles (2–303) and presented in Figure 24 and Table 4. The Jason-3 biases have been determined as well for cycles 1–80 (18 February 2016, till 11 April 2018) and also shown in Figure 24e,f and Table 4.
In the above results, altimeter biases represent mean values. Uncertainties, as shown in Table 4 and Figure 23, declare a statistical measure (standard deviation of the mean) for the dispersion of the values in the derived bias for each satellite. They, however, reflect a rather misleading and incomplete indicator for the bias uncertainty of each satellite. The “true” uncertainty for the altimeter bias is approached and should be evaluated using the concept of fiducial reference measurements [50,51].
It seems that some minor directional errors are revealed on the derived bias for Jason altimeters along its ascending and descending orbits. This could be justified as a similar pattern for orbital errors for those satellites that seem to exist over the globe as well (OSTST Report 2013). Nonetheless, peculiarities in this calibration locale, instrumentation, models, and processing might also influence and attribute to this discrepancy in bias along different orbit directions.
Sea-surface calibration of Sentinel-3A has been also carried out using the same infrastructure for both its ascending (Pass No. 14) and descending (No. 335) orbits around and in proximity to Gavdos [52]. The same Cal/Val infrastructure has also been used for the calibration of the SARAL/AltiKa altimetric mission along its ascending Pass No. 571 [53] as well as for the Chinese mission HY-2A (descending Pass No. 280) [31]. Some recent results for the Chinese HY-2A mission are given in Figure 25, based on the CRS1 Cal/Val site on southwestern Crete for cycles 23 to 98 and for I-GDR products. It can be observed using Figure 23 that the altimeter of HY-2A is not stable but presents a linear and downgrading trend.

4. Transponder Calibration Results

Sea-state bias is one of the largest sources of uncertainty linked with altimetric signals [54]. This is primarily because altimeter measurements are subject to interference originating by multiple and heterogeneous scatterers at sea [55]. A transponder on land overcomes this sea-state and scattering problem. Its image appears as a sharp point target to the radar altimeter, therefore it is easier to distinguish than sea [56]. Thus, during an overpass, the process for determining the range from the satellite to the transponder is straightforward [57,58].
The PFAC infrastructure has been involved in calibrations in the past with another and older transponders in Gavdos Island for Envisat [59] and Jason-2 [60]. In this work, calibration results have been derived based on the new CDN1 Cal/Val transponder site for Jason-2 and Jason-3, as well as for their tandem mission. Finally, first transponder results for Sentinel-3A are also given.
Specifically, a series of Jason-2 calibrations at CDN1 Cal/Val site has been performed for its Pass No. 18 and Cycles 267–277, from October 2015 to January 2016. Afterwards, twenty more calibrations for the tandem mission of Jason-2 and Jason-3 have been carried out during March–September 2016, i.e., for Jason-2 Pass No. 18, Cycles 285–303, and for Jason-3 Pass No. 18, Cycles 5–23.
Absolute transponder coordinates for its reference point have been determined using various geodetic techniques and during several years of observations. Two permanent GNSS receivers (i.e., CDN0 and CDN2) continuously operating on site since June 2014 have helped in that direction. Station coordinates are determined in ITRF using scientific software. In addition, local geodetic surveys take place every six months to transfer the GNSS station coordinates to the transponder’s reference point.
Delays in satellite signals as they travel through the transponder electronics need to be known precisely (uncertainties less than ±10–30 picosec) as they introduce raised biases for the satellite range. This internal delay in the transponder electronics has been measured thoroughly in 2013 (see also Section 2.1.4). Supplementary measurements on the transponder’s internal delay have been conducted in specialized labs in Greece as well to verify previous results conducted at ESA, the Netherlands.
Atmospheric propagation delays are precisely estimated via dedicated GNSS processing. Algorithms and subsequent software for processing transponder signals have already been designed and developed for deriving calibration results at the CDN1 Cal/Val transponder site. Steps and explanations of this transponder processing are given in Reference [60]. Some representative transponder responses for Jason-2, Jason-3, CryoSat-2, and Sentinel-3A are portrayed on Figure 26 below.

4.1. Transponder Versus Sea-Surface Biases: Jason-2 and Jason-3

Figure 27 presents, at first, the Jason-2 range calibration using the transponder at the CDN1 Cal/Val site along its descending orbit No. 18 and for cycles 267–303 (2 October 2015, to 23 September 2016). Figure 28 depicts the Jason-2 bias derived using sea-surface calibration and based on the Gavdos Cal/Val for the same period (Cycles 265–303). Sea calibration follows a few seconds immediately after the transponder calibration at CDN1 transponder Cal/Val. The gap of range bias results in Figure 26 between Cycle 277 (9 January 2016) and 285 (28 March 2016) exists as the transponder had not been operating during that period.
The mean value of Jason-2 for its range bias with the transponder along the descending Pass No.18 is computed as range bias (Jason-2, Cycles 267–303) = −1.2 cm ± 0.6 cm (Figure 27), whereas during the same period, the sea surface bias amounts to a SSH bias (Jason-2, No. 267–303) = +1.7 cm ± 0.5 cm (Figure 28). Biases derived using transponder and sea-surface techniques exhibit absolute values of about the same magnitude but with opposite signs, as expected. These results support and also corroborate each other as they are determined using diverse calibration techniques, locations, settings, and instrumentation.
Similar conclusions were found for the Jason-3 altimeter with transponder and sea-surface calibrations. Jason-3 transponder results for Cycles 5–80 are shown on Figure 29. The first four transponder cycles could not be calibrated and are missing in Figure 29. During that period, fine-tuning had to be put into action with parameters to upload onto Jason-3 such that its altimeter would be able to observe the transponder at that mountain height (i.e., 1050 m altitude).
The transponder produces a mean value of +0.76 cm ± 0.4 cm for the range bias of Jason-3. Results have been produced with Level-2 data products and precise orbits. The distinctive variation pattern on the results of transponder biases in Figure 29 could be generated by yaw steering applied in Jason-3 satellite (as well as in Jason-2). No such variation pattern appears, for example, in Sentinel-3A where no such yaw steering is implemented.
Sea surface calibration generates a Jason-3 bias of −0.74 cm ± 0.4 cm (Figure 24f), observed a few seconds immediately after transponder calibration along the same descending orbit No.18. Sea-surface results for Jason-3 were based on cycles 1–80 (18 February 2016, till 11 April 2018) for orbit No. 18 and with GDR-D data products.

4.2. Tandem Mission for Jason-2 and Jason-3

There was a tandem mission for Jason-2 and Jason-3 in 2016. In that period, transponder calibration was initiated on 28 March 2016, approximately two months after the Jason-3 launch (i.e., 17 January 2016). It ended on 23 September 2016, when Jason-2 shifted to a different orbit. During this tandem period, both satellites were flying as a group of satellites together on the same orbit but separated by just 80 s (560 km, Jason-3 directly behind Jason-2). Both satellites have been calibrated almost simultaneously with the sea-surface facility at Gavdos and the transponder at the CDN1 Cal/Val site along their descending pass No. 18. The first four cycles in Jason-3 have not been measured with the transponder, as previously explained.
Figure 30 illustrates the differences in range bias of Jason-3 with respect to Jason-2, as measured with the transponder during their tandem period. The mean value for this range bias difference has been estimated to be JA3 − JA2 = +1.37 cm − (−0.40 cm) = + 1.77 cm ± 0.7 cm for that specific tandem period and based upon 15 calibration points. It should be pointed out that during Cycles 285–289 (28 March 2016, till 7 May 2016), there have been some functional problems with meteorological sensors at the CDN1 site, and models have been applied to determine atmospheric delays. If we take into account the up to now duration of transponder calibrations for Jason-3 (Cycles 5–80) and compare it against Jason-2 (Cycles 267–303), then this difference between the two satellites comes to a mean value of JA3 − JA2 = + 0.76 cm − (−1.2 cm) = +1.96 cm ± 0.8 cm.
A comparable performance has been observed between Jason-3 against Jason-2, if both satellites are calibrated with sea-surface techniques using the Gavdos Cal/Val for their tandem period. This tandem calibration is shown in Figure 31. Even though the results were based upon a very small sample of 16 data values for the tandem mission, Jason-3 appears to measure shorter sea-surface heights by 2.66 cm with respect to Jason-2. Biases for these sea-surface heights were based on the descending orbit No. 18 and on the GDR-D products.
During their tandem mission, both satellites measured the same sea region south of Gavdos, but on another ascending orbit No. 109 (Figure 32). The mean value of Jason-2 bias for Cycles 281–298 has been computed as JA2 = +2.25 cm (No. 109). Also, the mean value for the Jason-3 bias for its corresponding Cycles 1–19 has been determined as JA3 = −1.05 cm (No. 109). Therefore, based on the other orbit No. 109 and sea-surface calibration, the difference between those satellite observations amounts to JA3 − JA2 = (−1.05 − 2.25 cm) = −3.3 cm. This analysis reconfirms that Jason-3 measures lower sea-surface heights by 3.3 cm with respect to Jason-2. The produced results seem to agree with other publications on the subject [61].
Figure 33 shows a profile of sea-surface biases of Jason-3 and Jason-2 with respect to distance from the point of closest approach at the Gavdos Cal/Val. It can be clearly seen that Jason-3 measures lower heights than Jason-2.

5. Crossover Calibration Results

On 11 November 2016, Sentinel-3A (Cycle No. 11) and Jason-3 (Cycle No. 28) flew almost simultaneously over the transponder site, in ascending and descending passes, respectively. They were separated in orbit by 24 s (Figure 34). Therefore, atmospheric conditions, tidal effects, transponder characteristics, etc. are exactly the same for both S3A and Jason-3 calibrations. The range bias of Sentinel-3A was estimated for this pass as S3A = +20 mm, while the range bias of Jason-3 was JA3 = +45.0 mm. Thus, the range as measured by Jason-3 was longer than that of S3A by +45.0 mm − 20 mm = +25.00 mm. This shows that Jason-3 at the sea surface will observe shorter sea-surface heights than Sentinel-3A by 25 mm. Although this is a very rare event to happen over the transponder, it is a reliable indication of the offset of Jason-3 with respect to Sentinel-3A.
Comparisons have been made between different altimeters at sea within a time window of 3 days or shorter. Sea surface heights observed using SARAL/AltiKa with respect to the reference mission of Jason-2 at a crossover point south of Gavdos (Figure 34) have been presented in Reference [41]. The sea surface height measured by altimeters has to be estimated exactly at the point of their crossover. This process involves errors as satellites do not pass at the same time over the crossover point and different conditions and heights may prevail at sea during a satellite pass. Nonetheless, crossover analysis could provide relative performance of one altimeter against another.
Figure 35 shows the ground tracks of SARAL/AltiKa Pass No. 571 (yellow) and Jason-2 Pass No. 109 (red) (both ascending) where they converge at a point about 4 km south of the Gavdos Island. Sea-surface heights as measured by these two altimetric missions have been compared within a time window of less than 3 days. It can be seen from Figure 32 that SARAL/AltiKa measures sea-surface heights as a general rule less than the Jason-2 at this specific point at sea. Also, in the same Figure, the linear degradation of HY-2A bias with respect to Jason-2 is quite clear at a point north of Crete where both satellites converge. Finally, Sentinel-3A exhibits an average sea surface higher than Jason-3 by about +4 cm when compared at a crossover location south of Gavdos.

6. Conclusions

The produced results on absolute calibration are concisely presented in Table 5 for Jason-1, Jason-2, and Jason-3. Bias results for the altimeters are based on sea-surface and transponder calibrations at Gavdos and western Crete Cal/Val facilities. Jason-2 and Jason-3 have been calibrated along the descending orbit No. 18 by the microwave transponder at the CDN1 Cal/Val site on the mountains of Crete and immediately 10 s later, the same satellites continued calibration relative to the sea surface with diverse techniques, infrastructure, and instrumentation with the Gavdos Cal/Val facility. Furthermore, relative calibrations of Sentinal-3A, HY-2A, and SARAL/AltiKa altimeters with respect to the reference mission of Jason-2 are given in the same Table 5.
In the sequel, the performance of Jason-2 and Jason-3 has been investigated and cross-examined during their tandem mission from 28 March 2016, till 23 September 2016. Results have been based also upon the same CDN1 and Gavdos ground Cal/Val instrumentation and setting when satellites were flying on the same orbit for six months in unison, separated 80 s apart. Transponder calibration has been carried out based on their descending pass No. 18 only. A few seconds later, this satellite pass No. 18 has been calibrated with the other Gavdos Cal/Val facility, as Jason-2 and Jason-3 were flown immediately down south over the sea. Hence, cross-comparisons could be made for the same orbit, but with two and diverse independent calibration techniques of the sea surface and transponder.
A short summary statement regarding the altimeter bias for all these satellites is as follows (see also Table 5, and Figure 36):
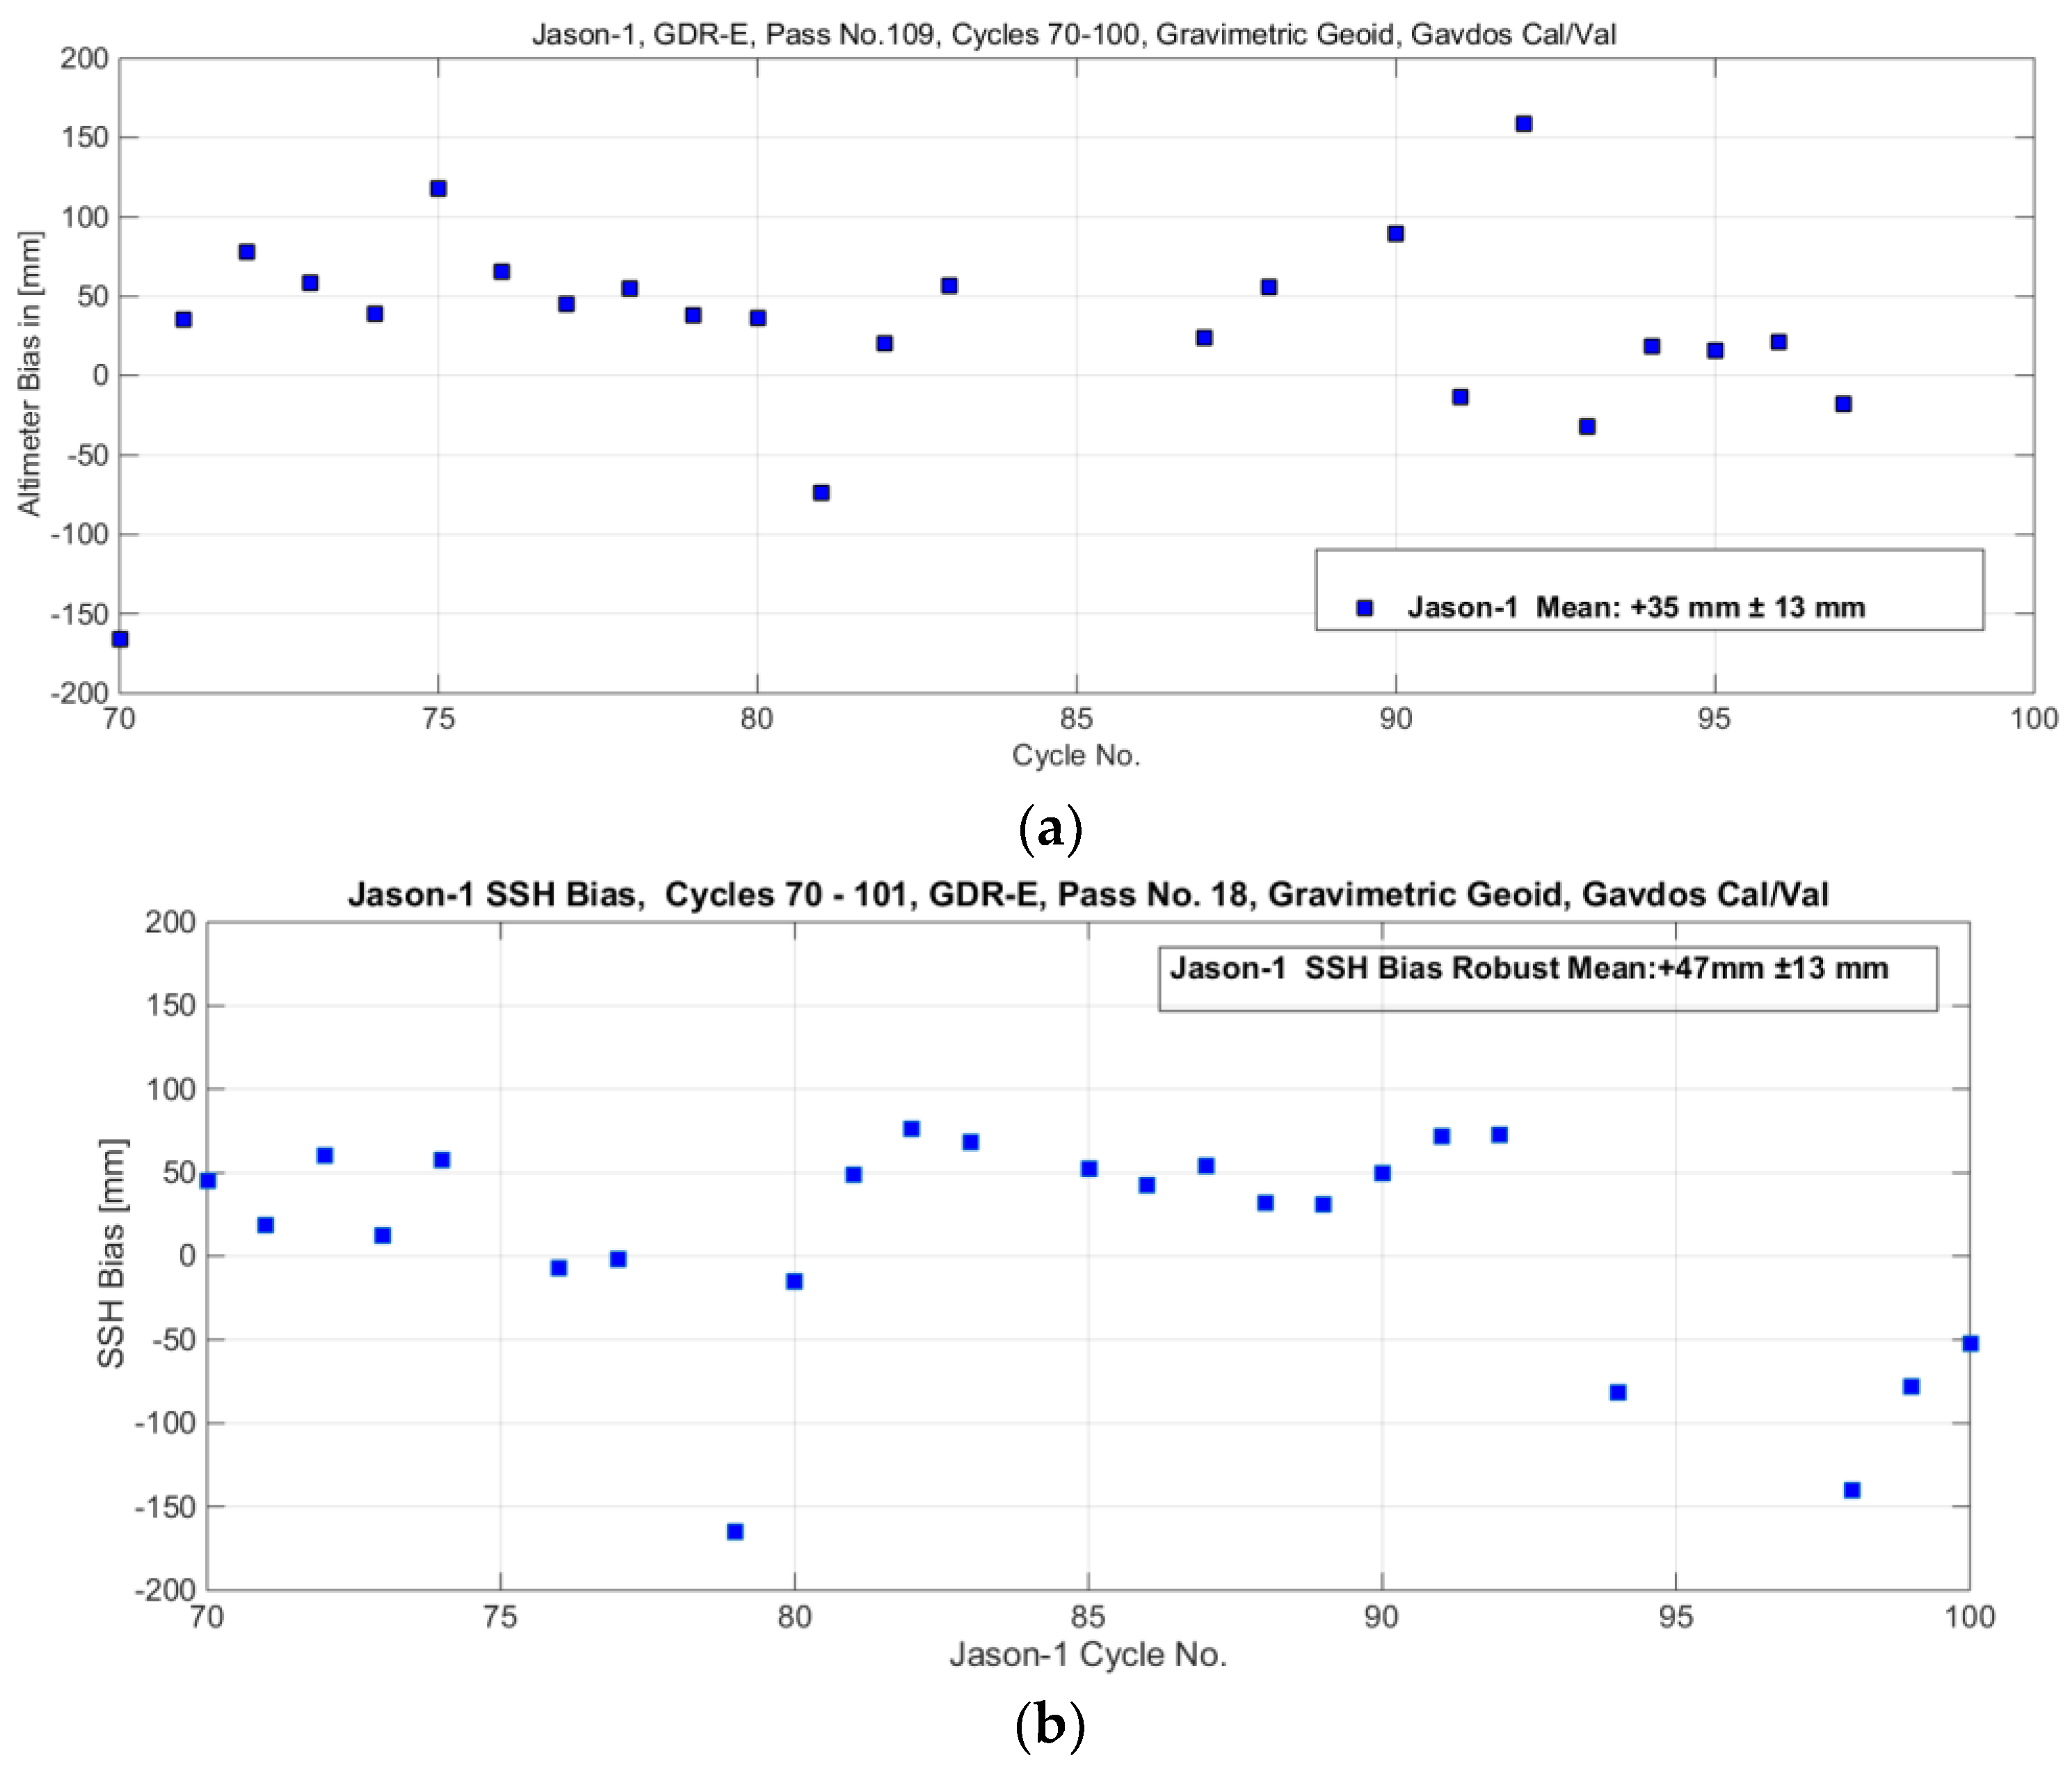
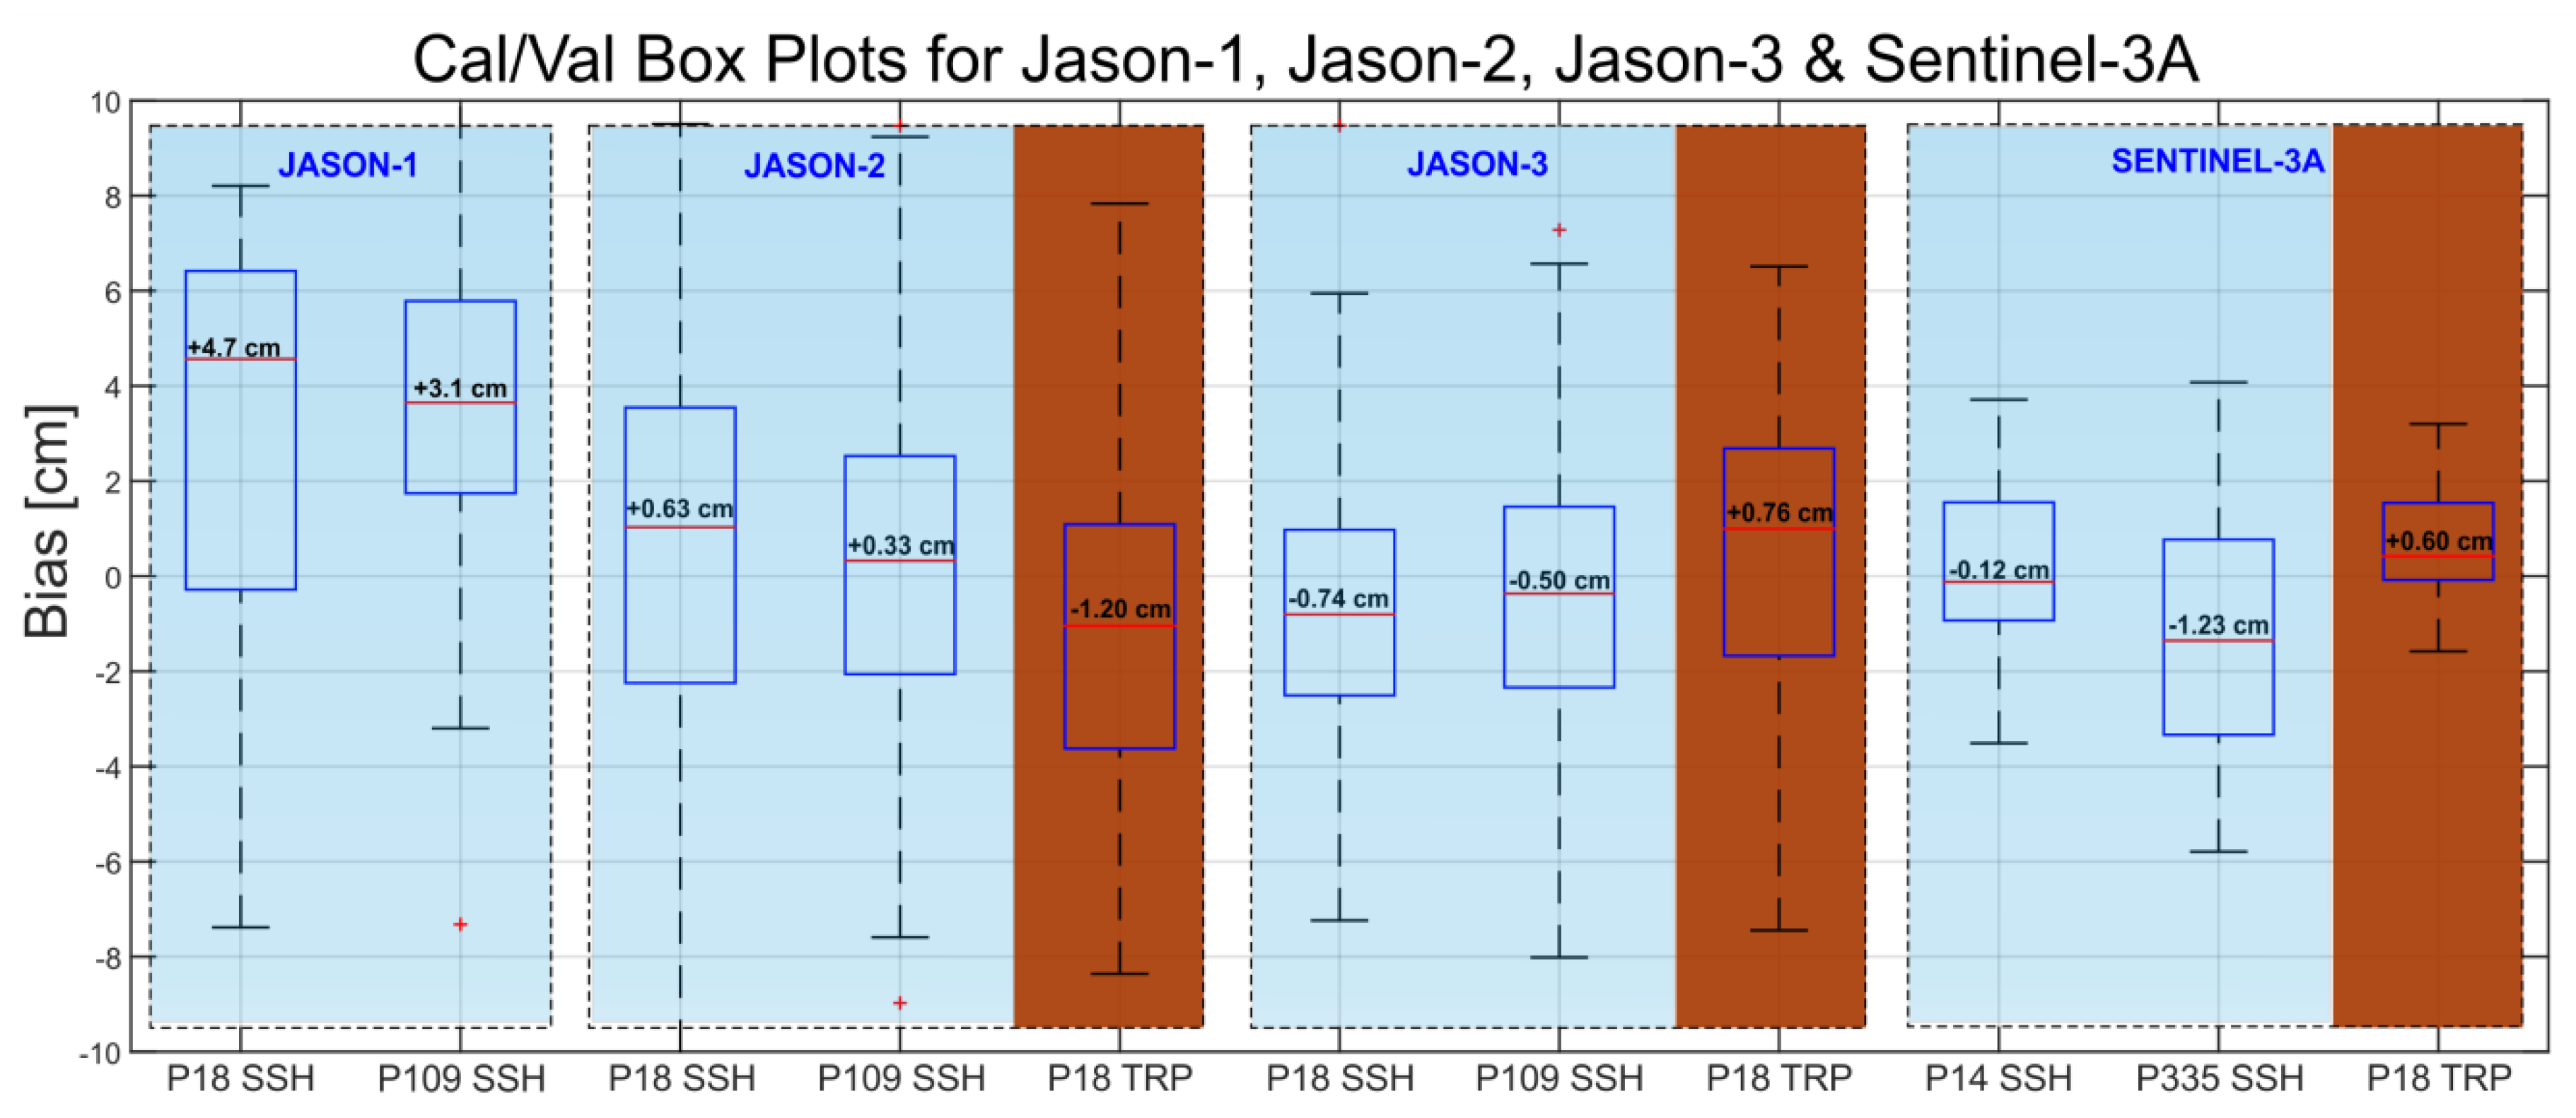
  • Jason-1 has produced a sea-surface height bias of +3.5 cm and +4.7 cm along the ascending and the descending orbits, respectively, around Gavdos. The mean value of this Jason-1 altimeter comes to +4.1 cm based on cycles 70 to 100 and the GRD-E data products.
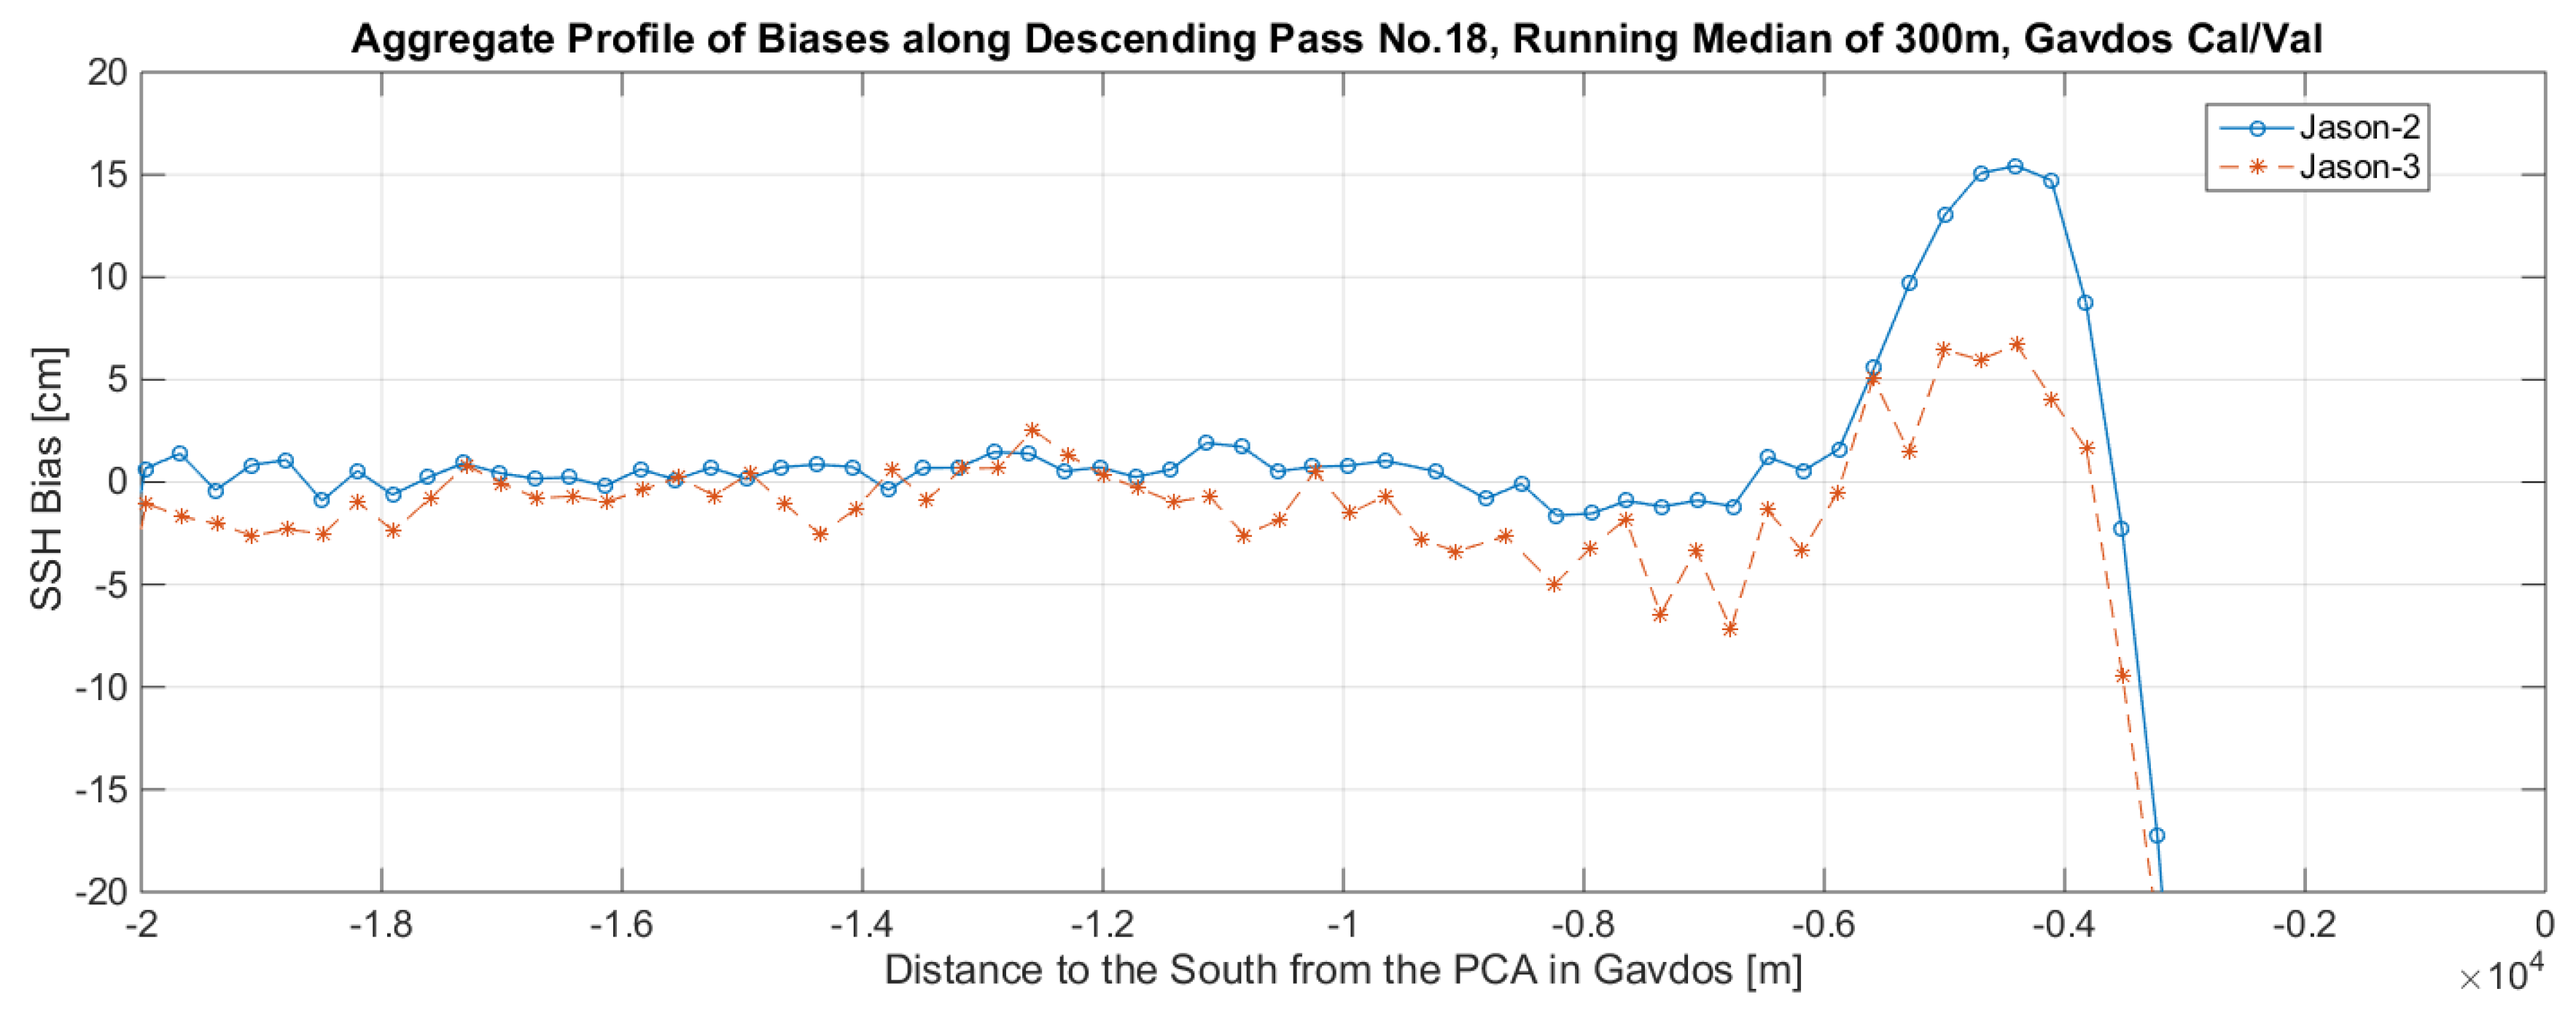
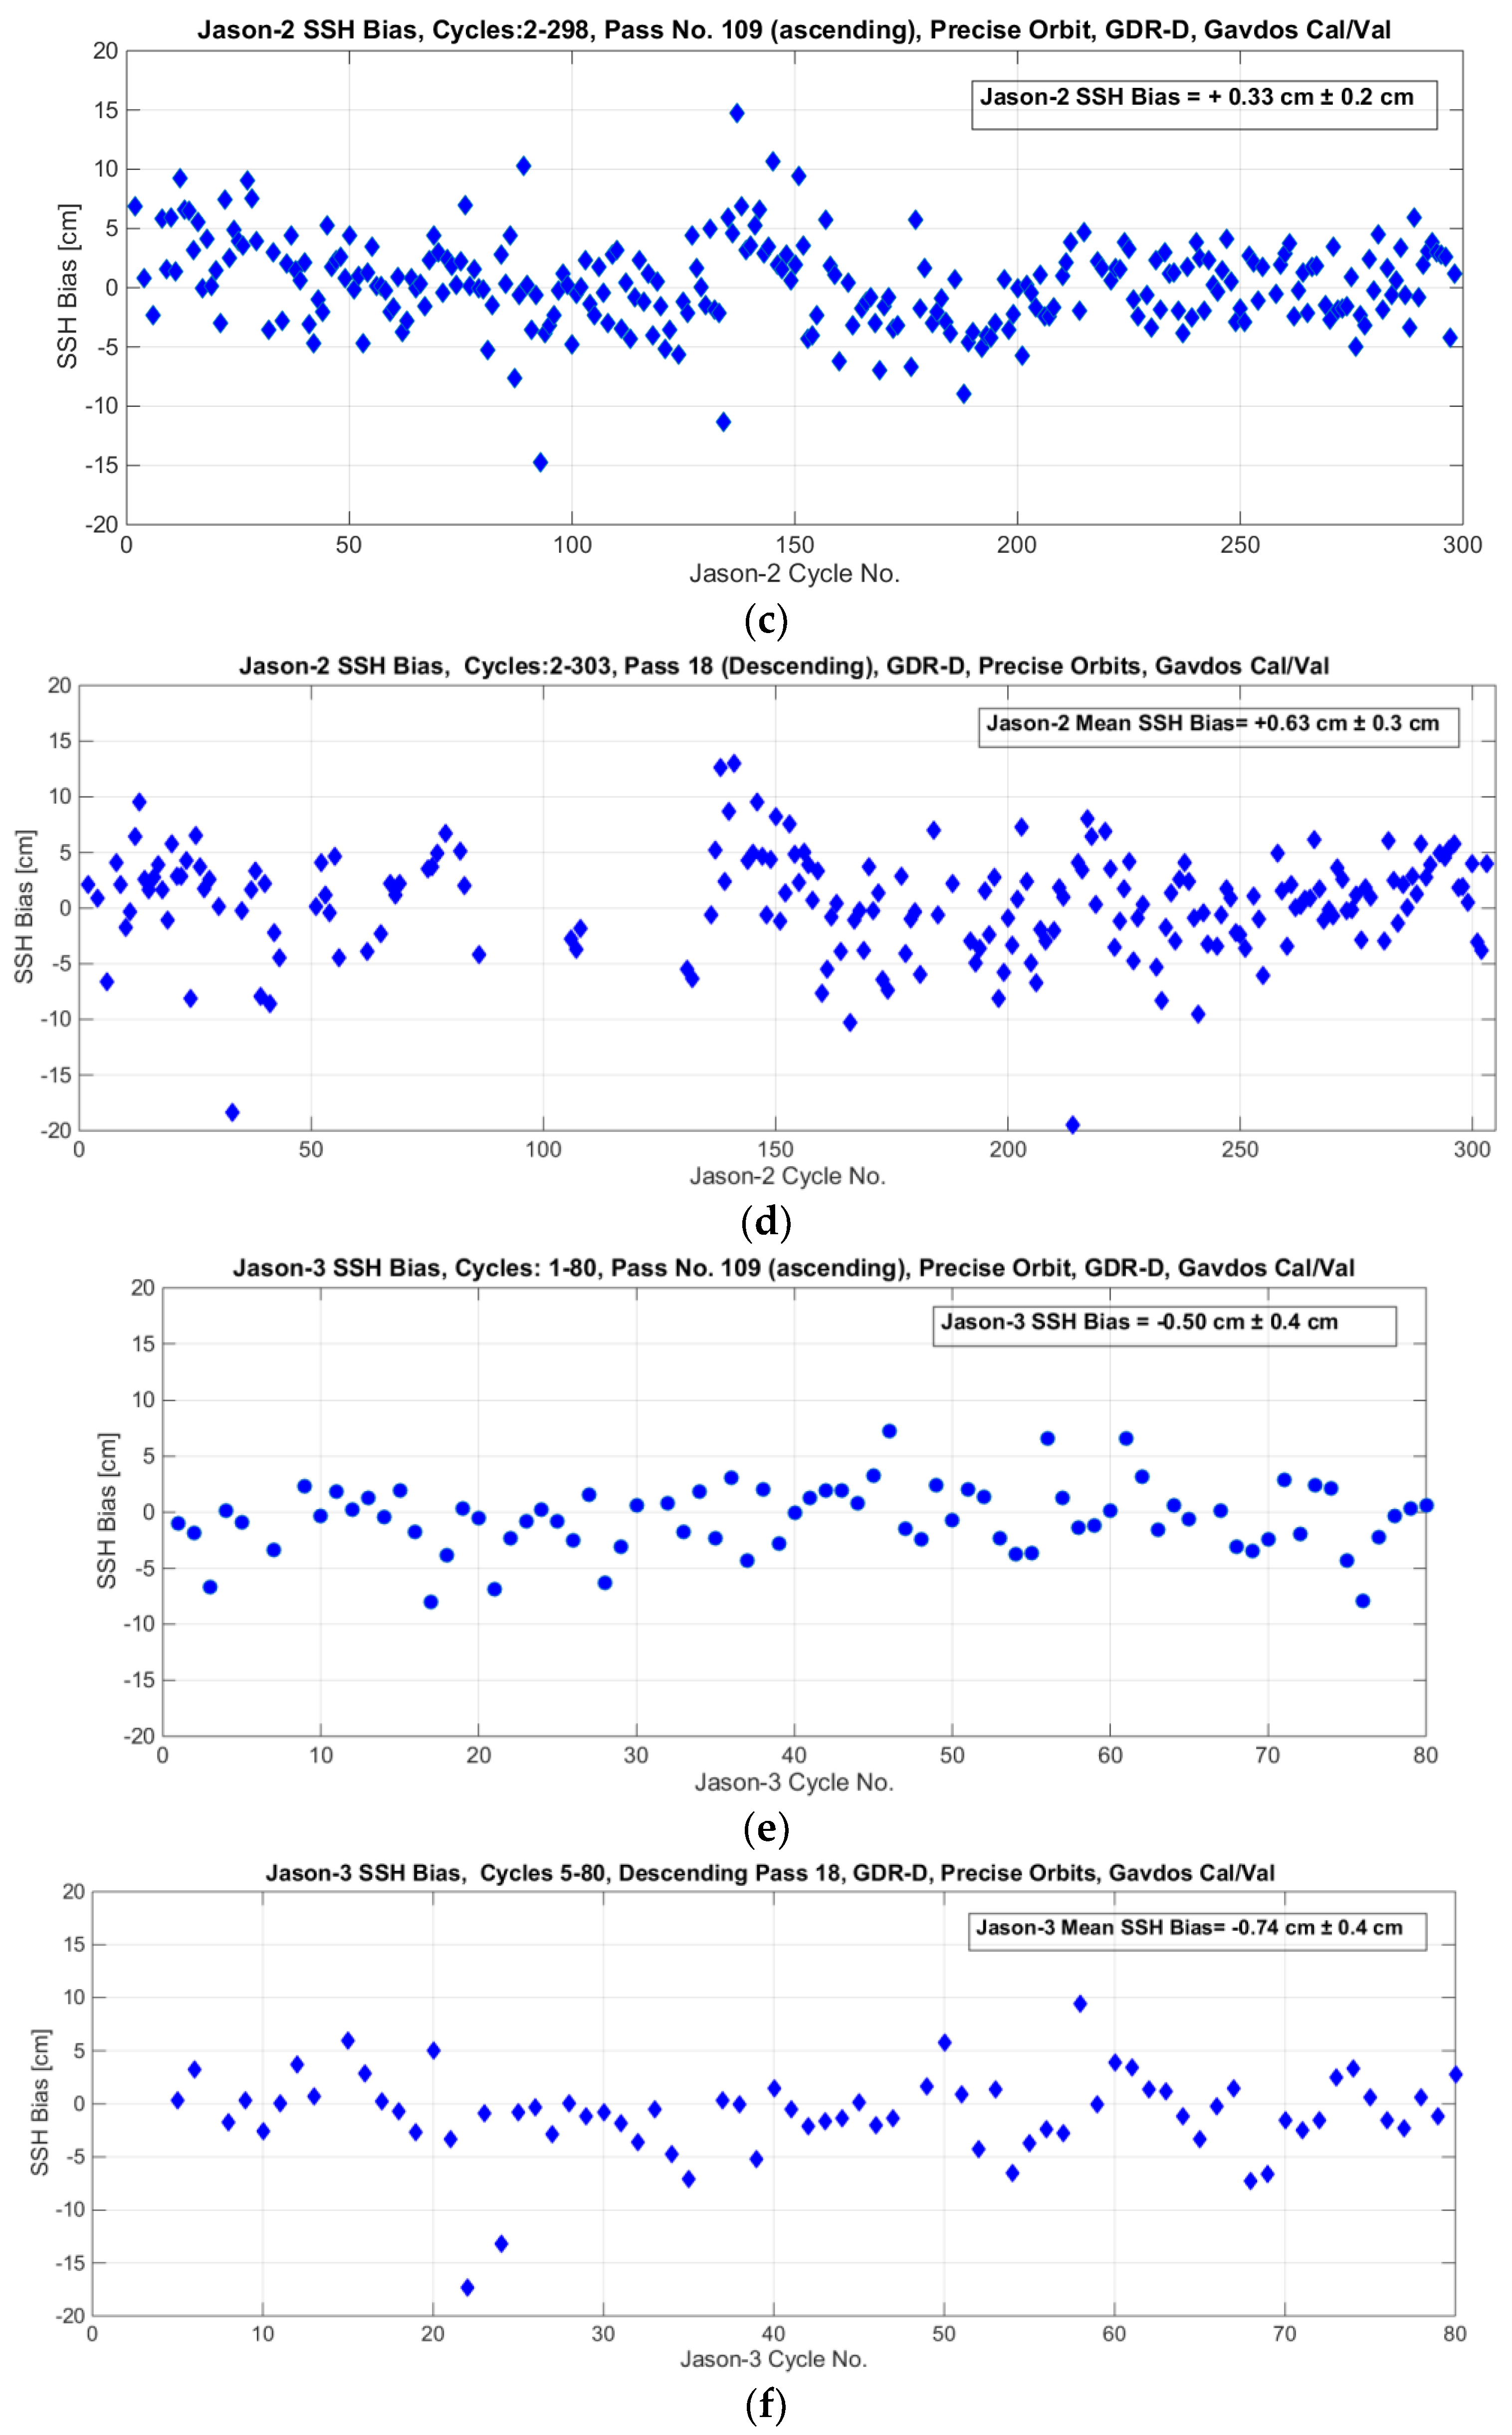
  • Jason-2 exhibits an altimeter bias in determining sea-surface heights of +0.33 cm (ascending No. 109) and to a value of +0.63 cm for its descending orbit No. 18. Hence, the mean value for Jason-2 comes to almost zero (i.e., +0.48 cm). These results were based on the Gavdos Cal/Val, and Cycles 2–303 with GDR-D data products for Jason-2.
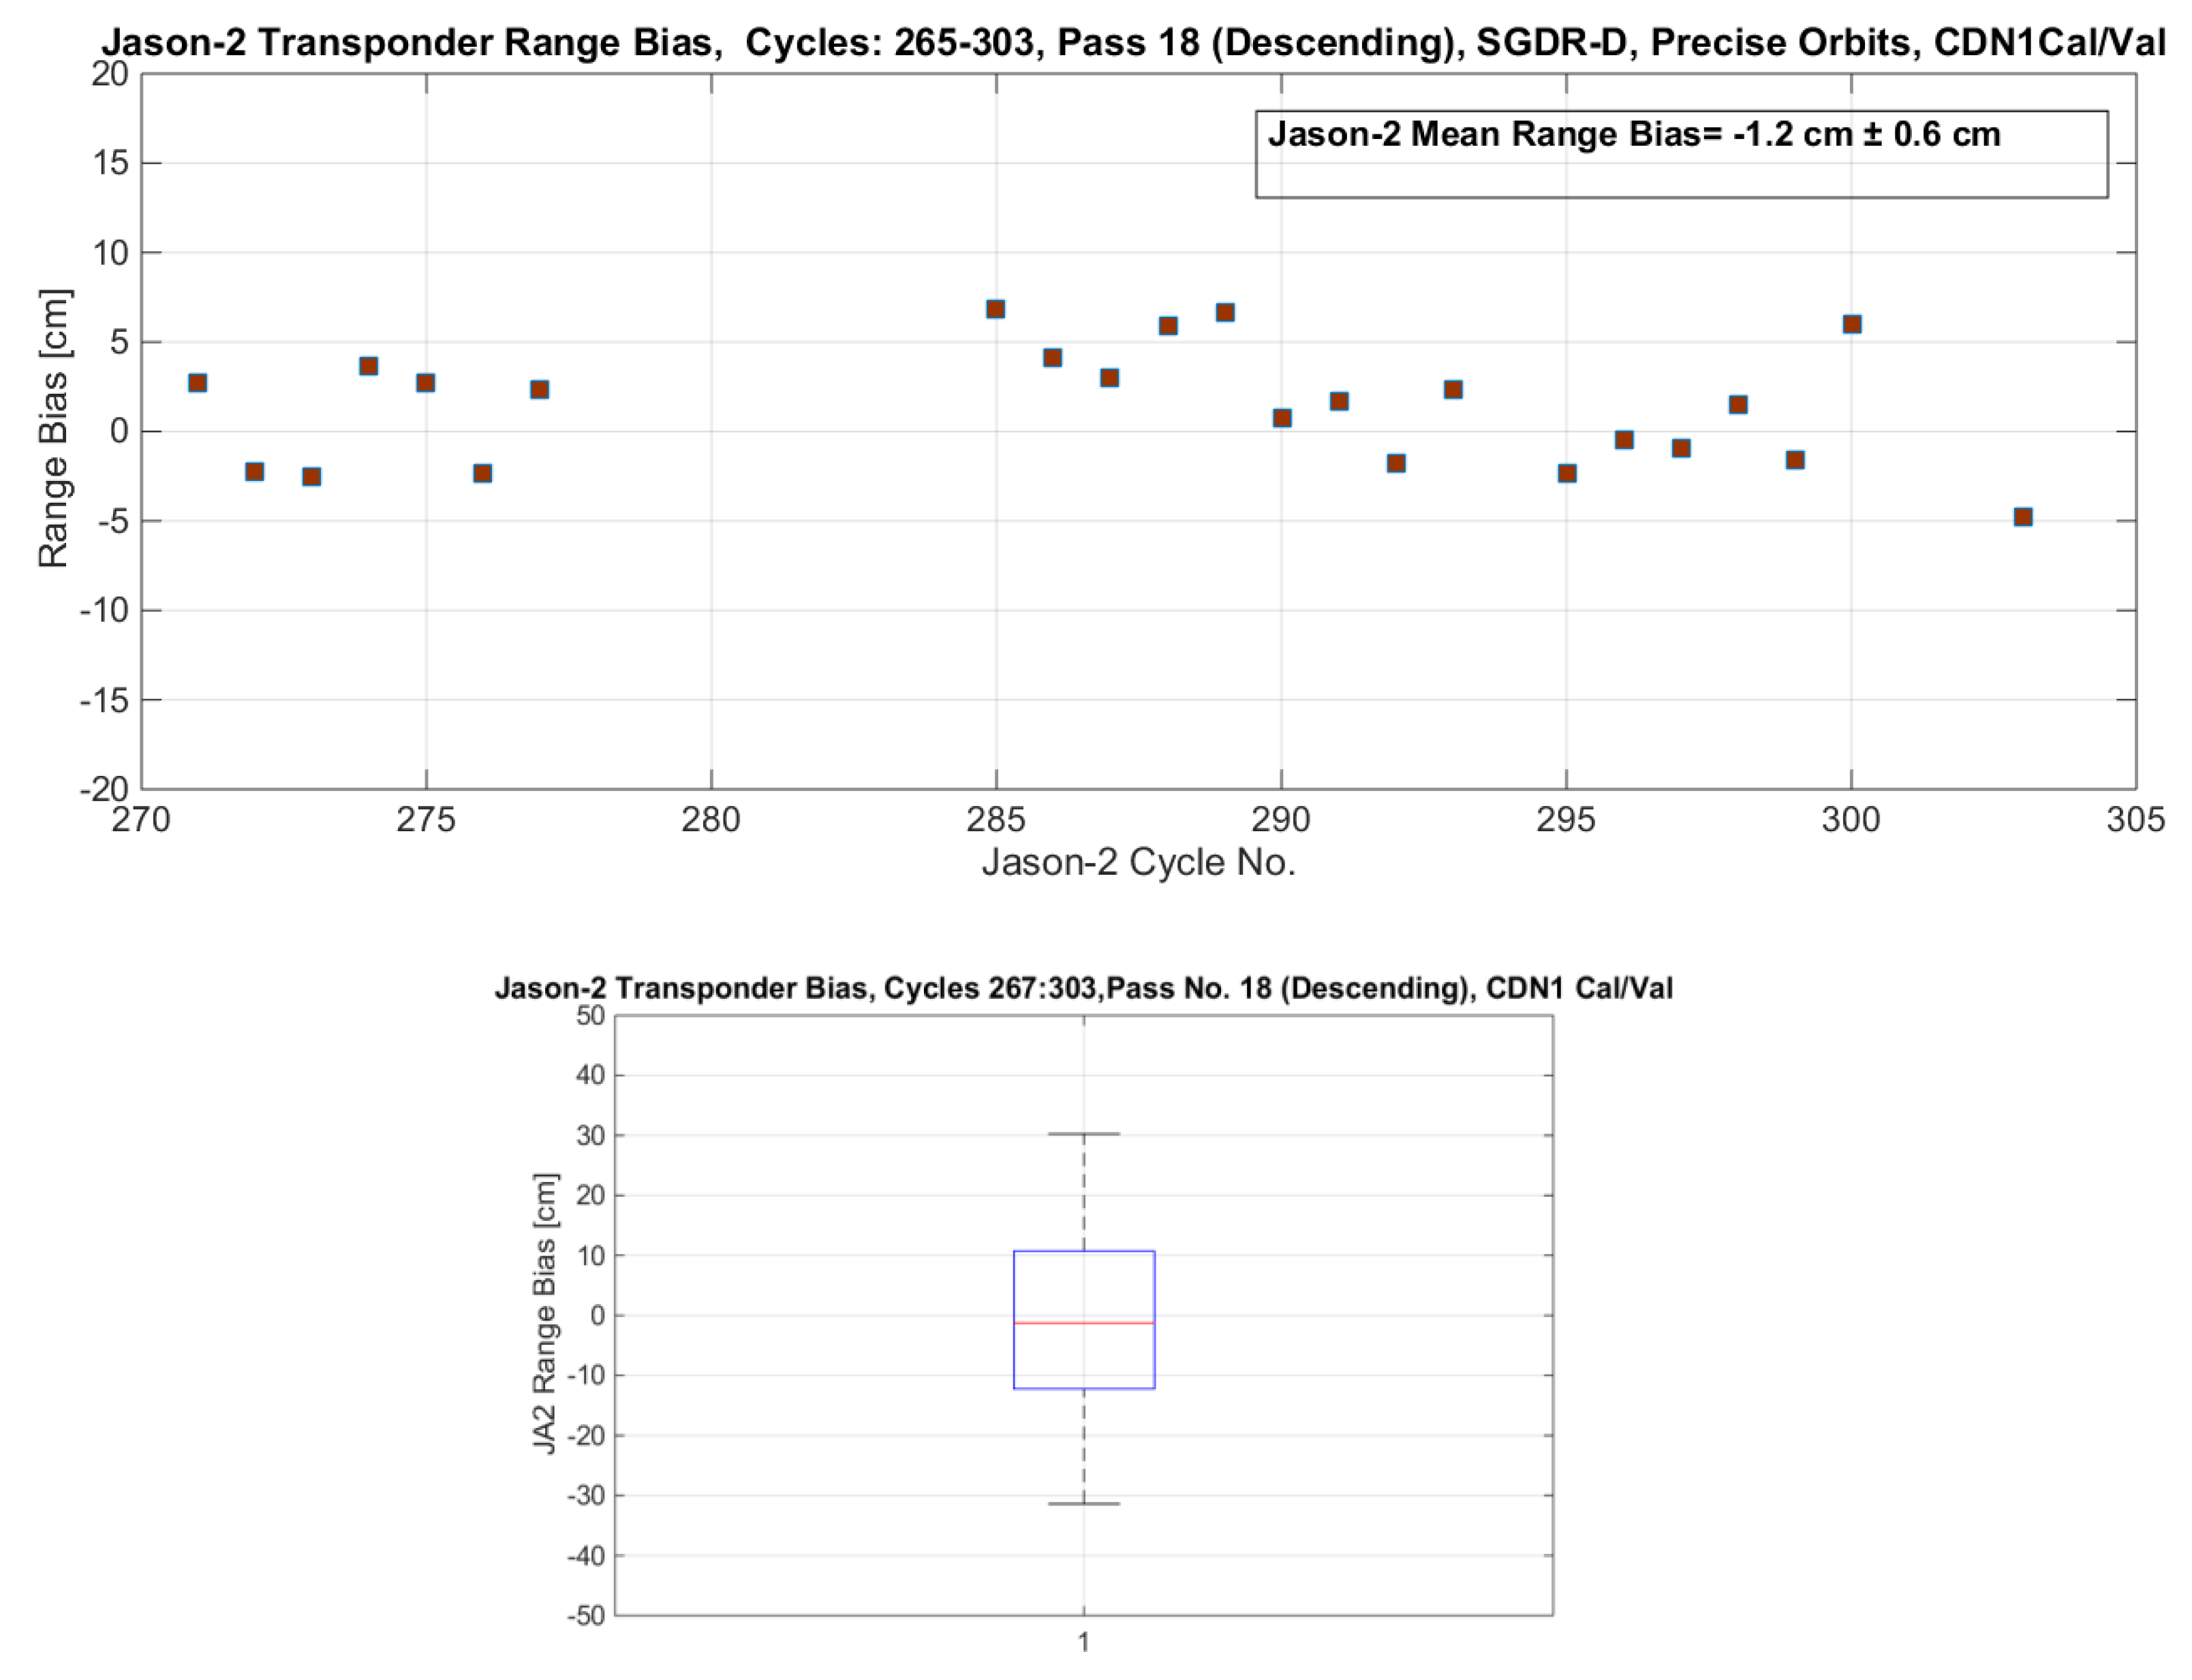
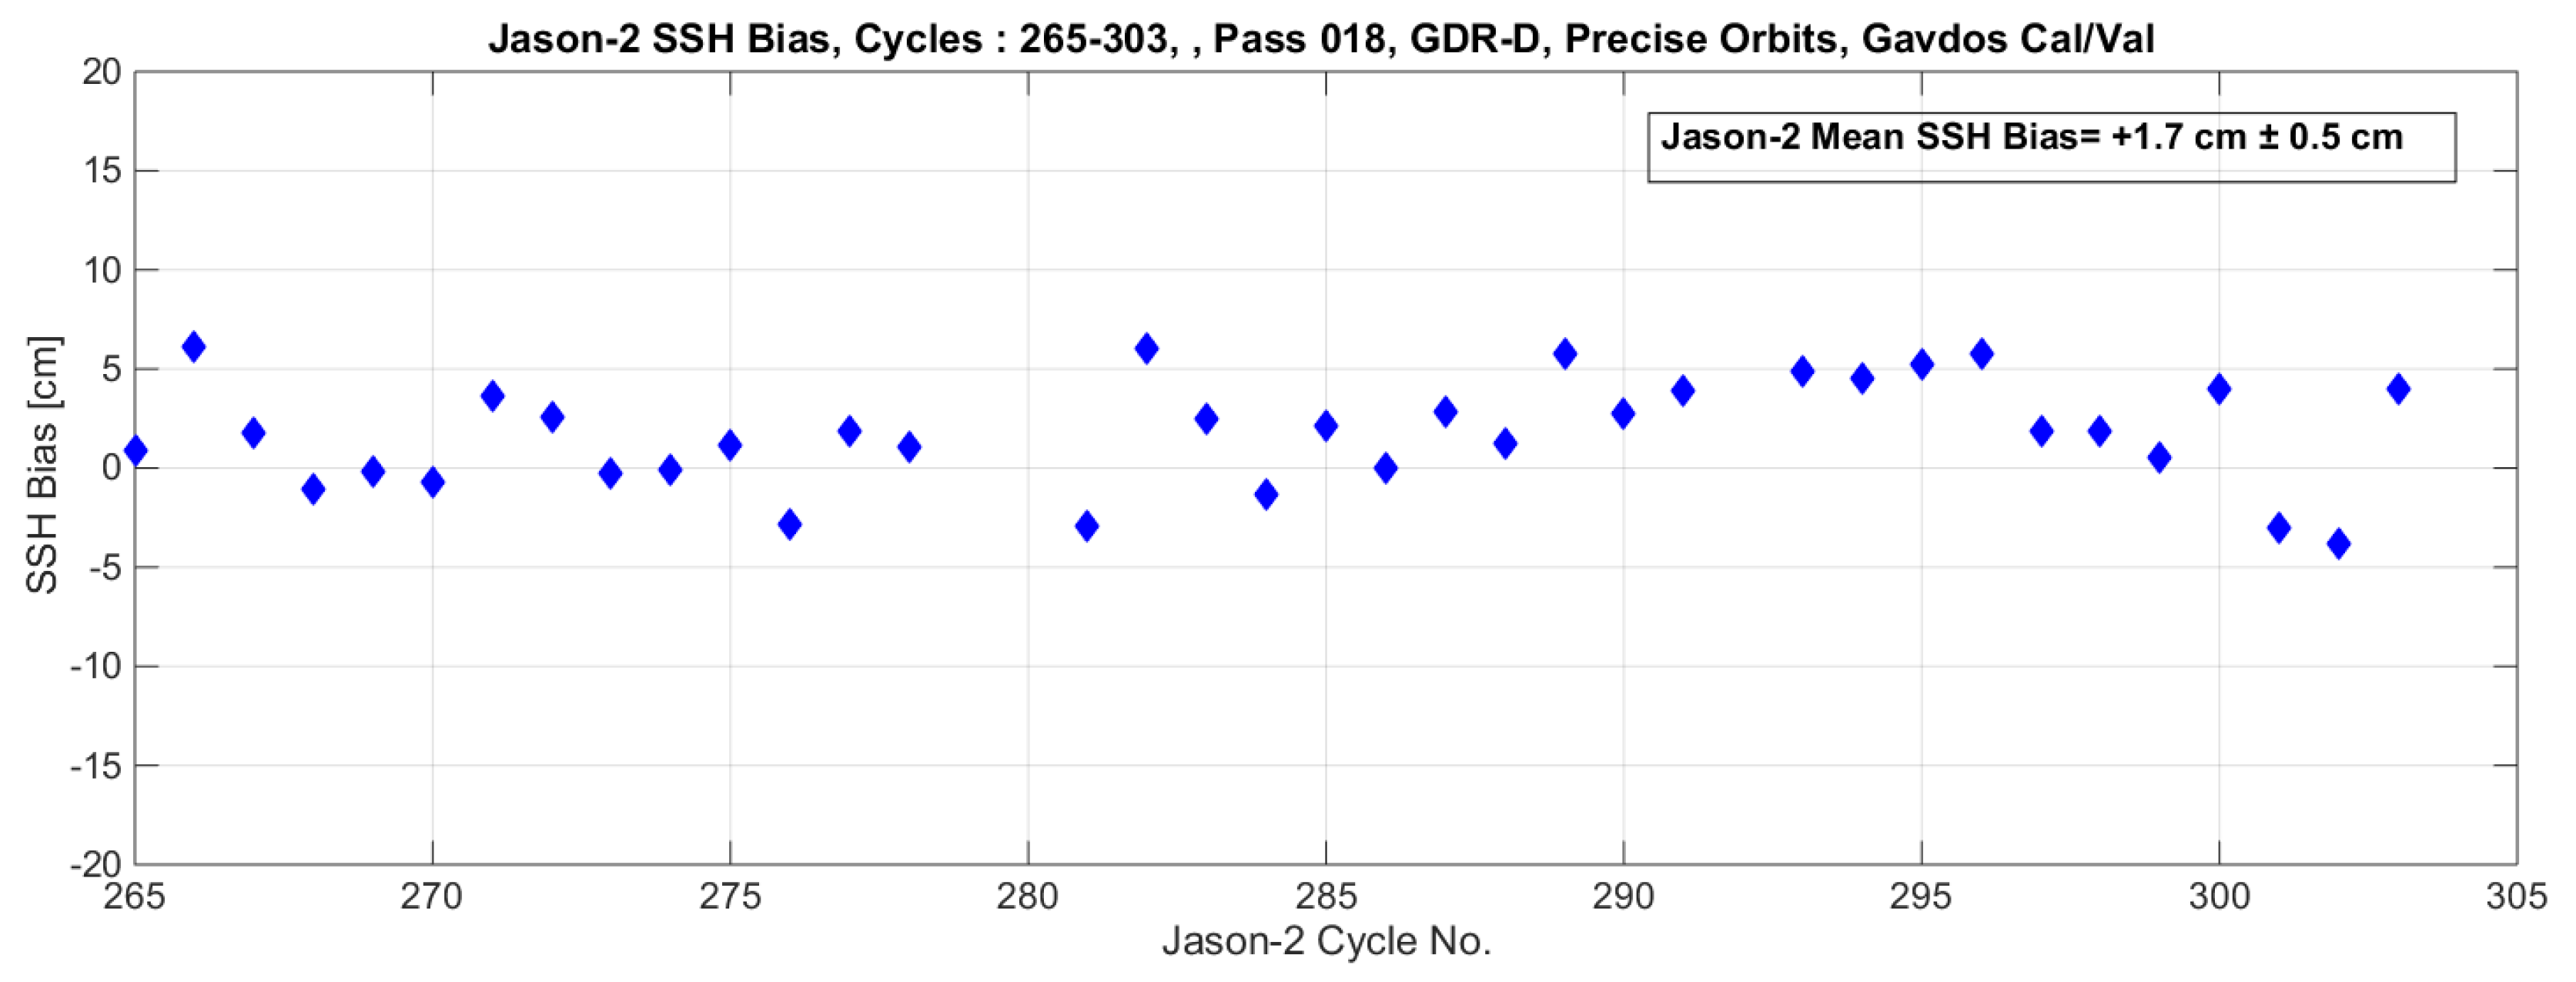
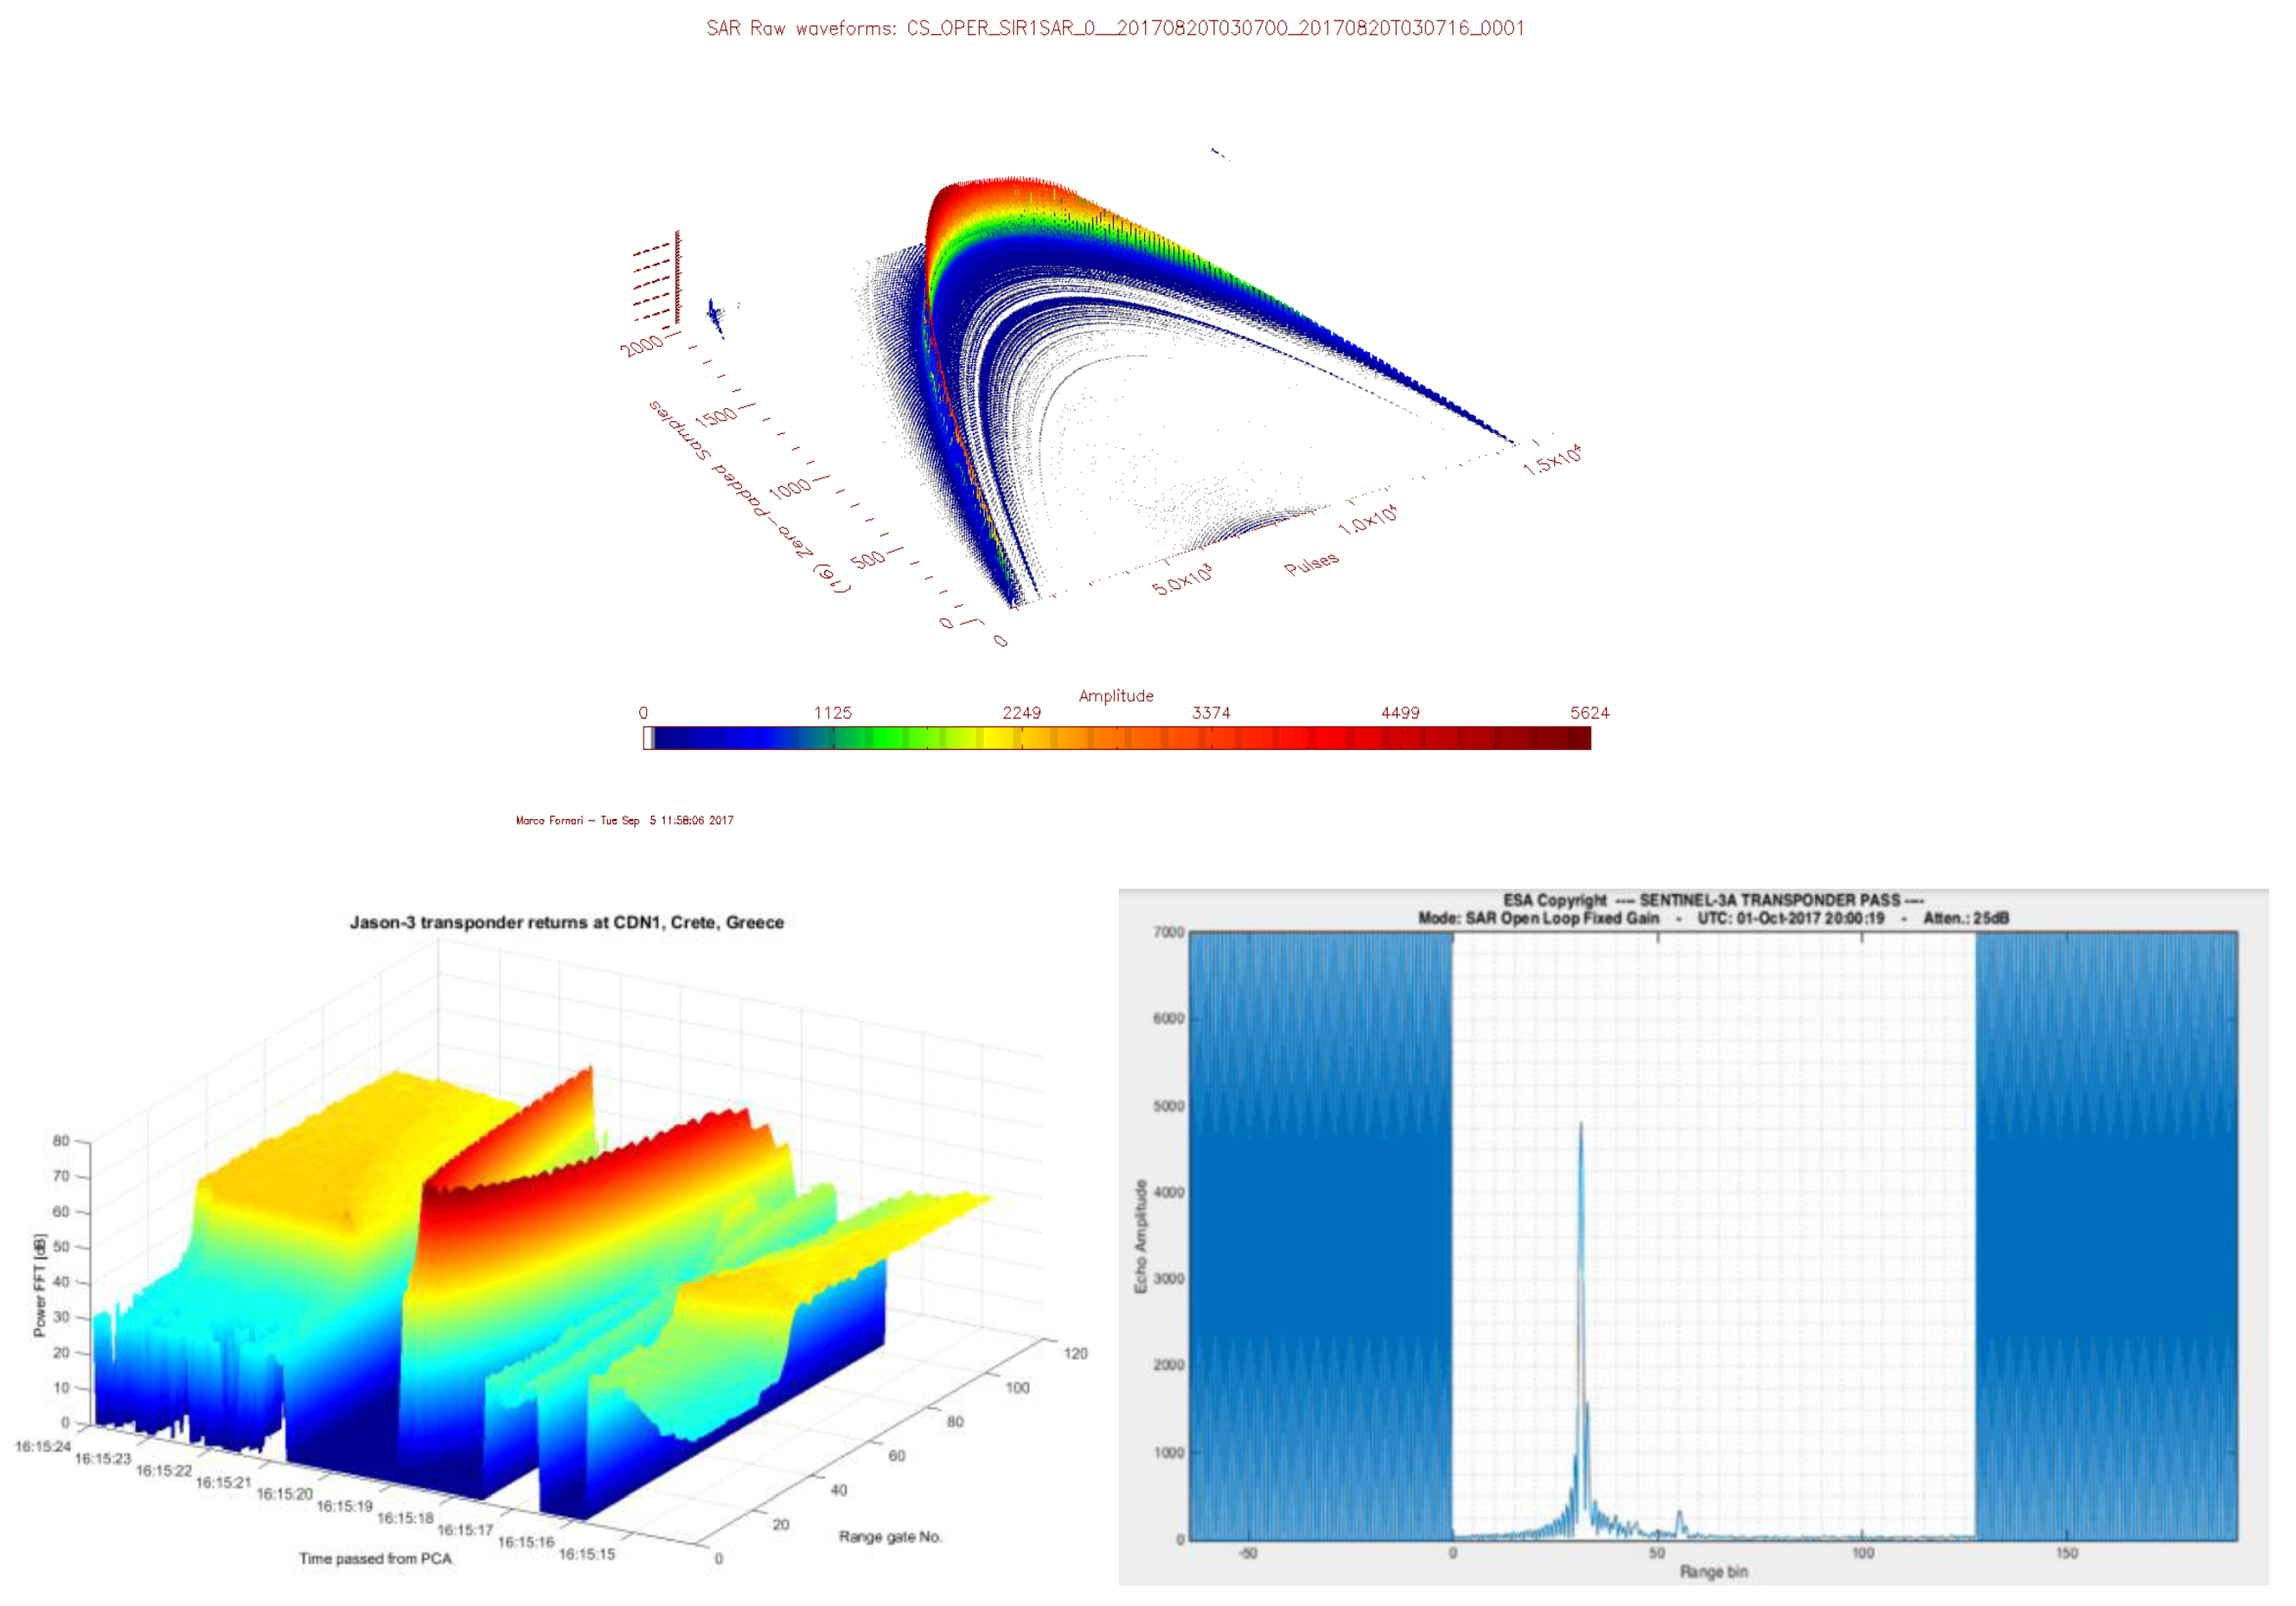
  • The transponder at CDN1 Cal/Val facility has produced a range bias for Jason-2 of −1.2 cm for Cycles 267–303 with SGDR-D and Level-2 data products. The associated SSH bias of Jason-2 along Pass No. 18 for the same cycles amounts to +1.7 cm based on Gavdos Cal/Val facility. Biases derived using transponder and sea surface techniques exhibited absolute values of about the same magnitude but with opposite signs. These results back each other up as they are determined by diverse calibration techniques, different locations, settings, and instrumentation;
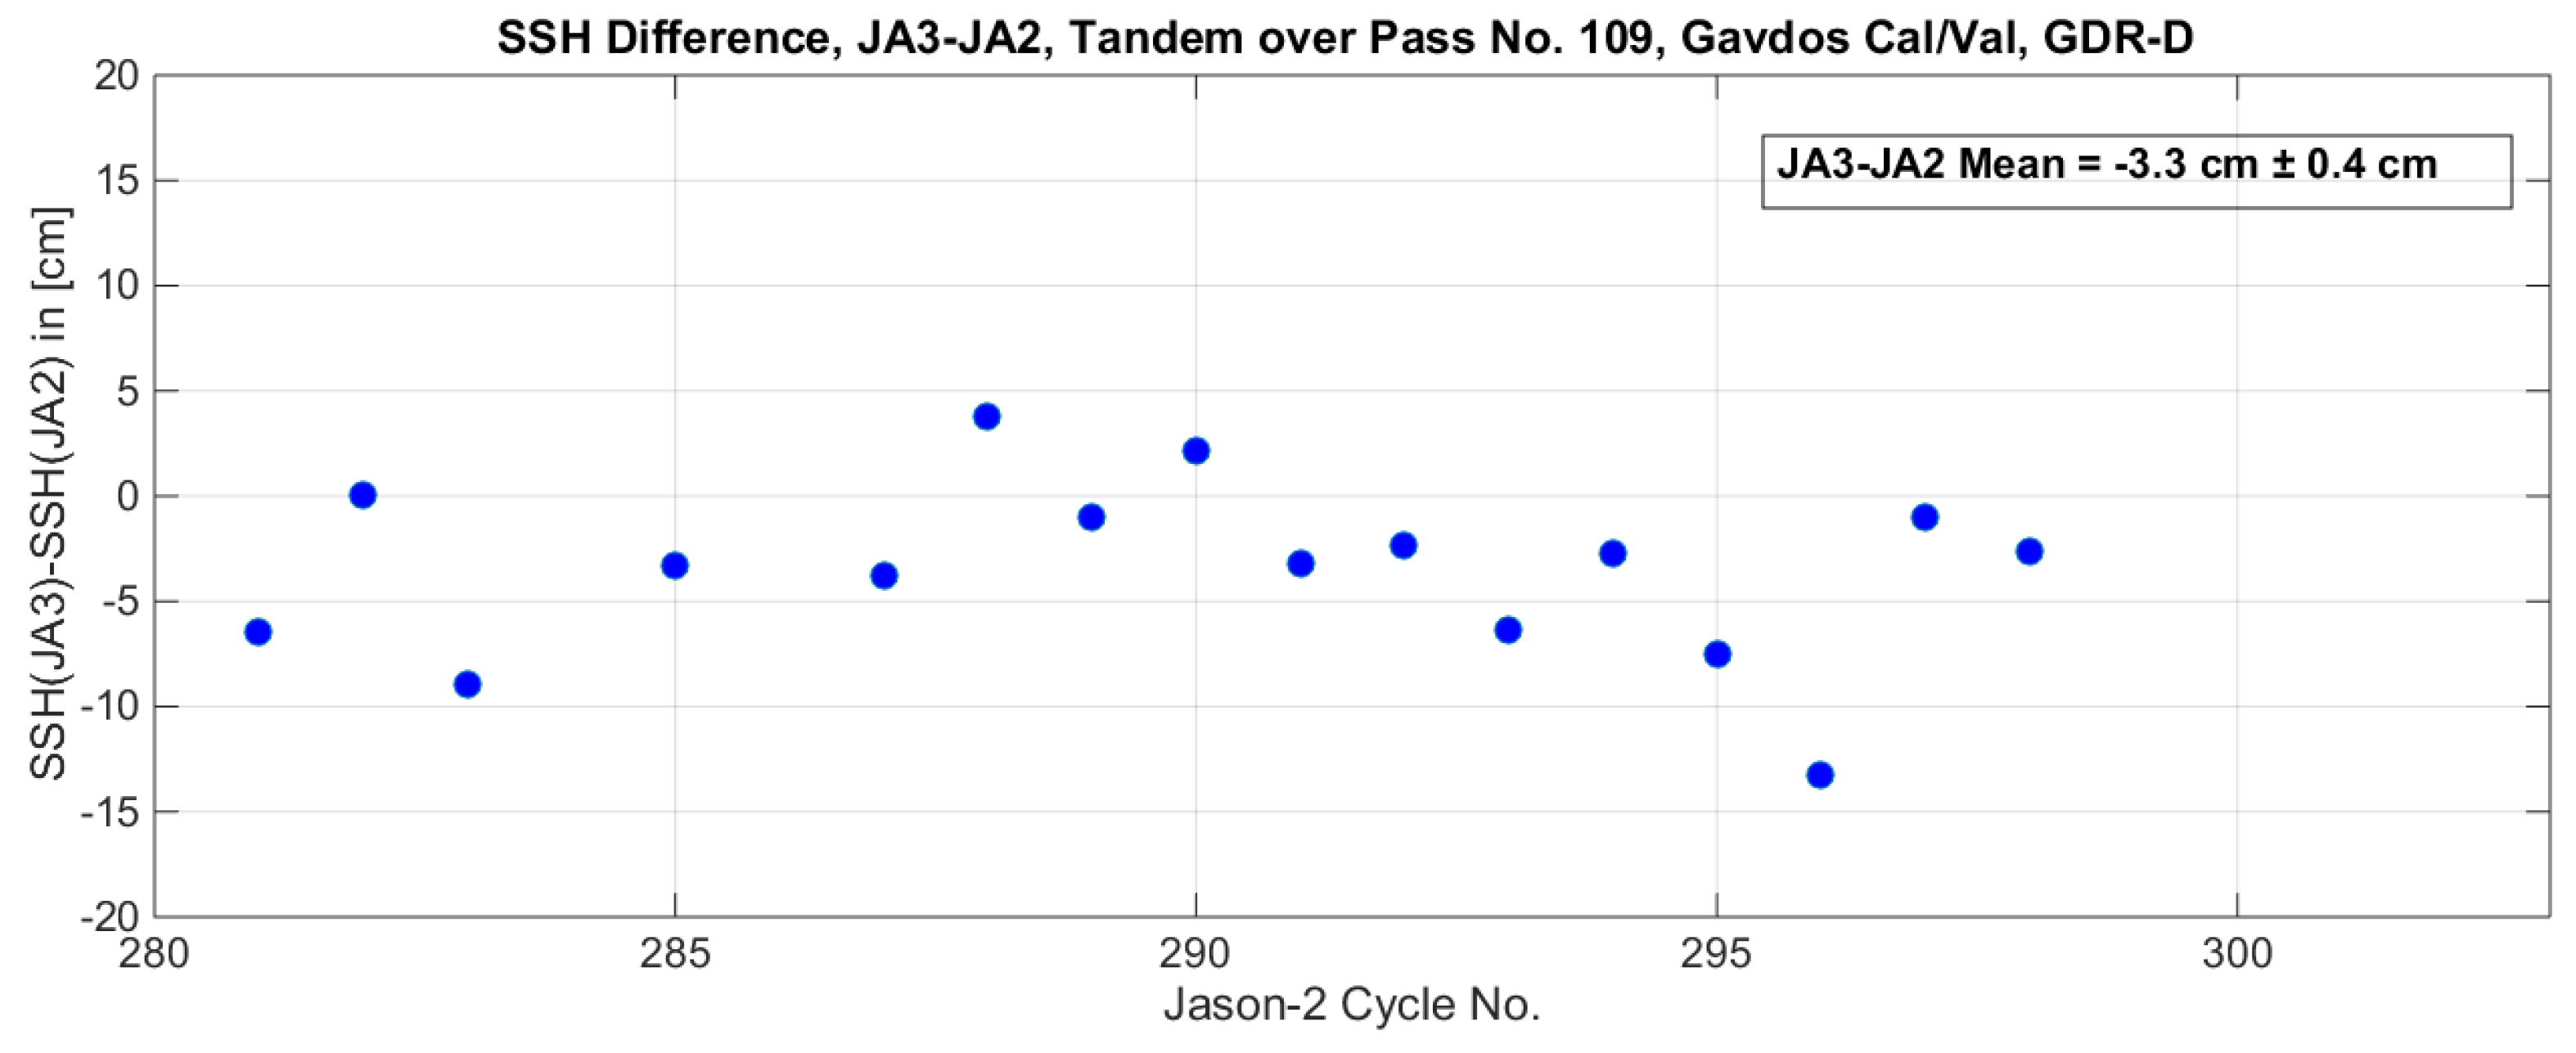
  • Jason-3 demonstrated a bias at determining sea-surface heights of −0.50 cm along the ascending orbit and −0.74 cm along its descending orbit, as determined by the Gavdos Cal/Val site. Results were based on GDR-D products and its first 80 cycles of Jason-3. The mean value of the SSH bias of Jason-3 came to −0.62 cm when averaged over the ascending and its descending pass.
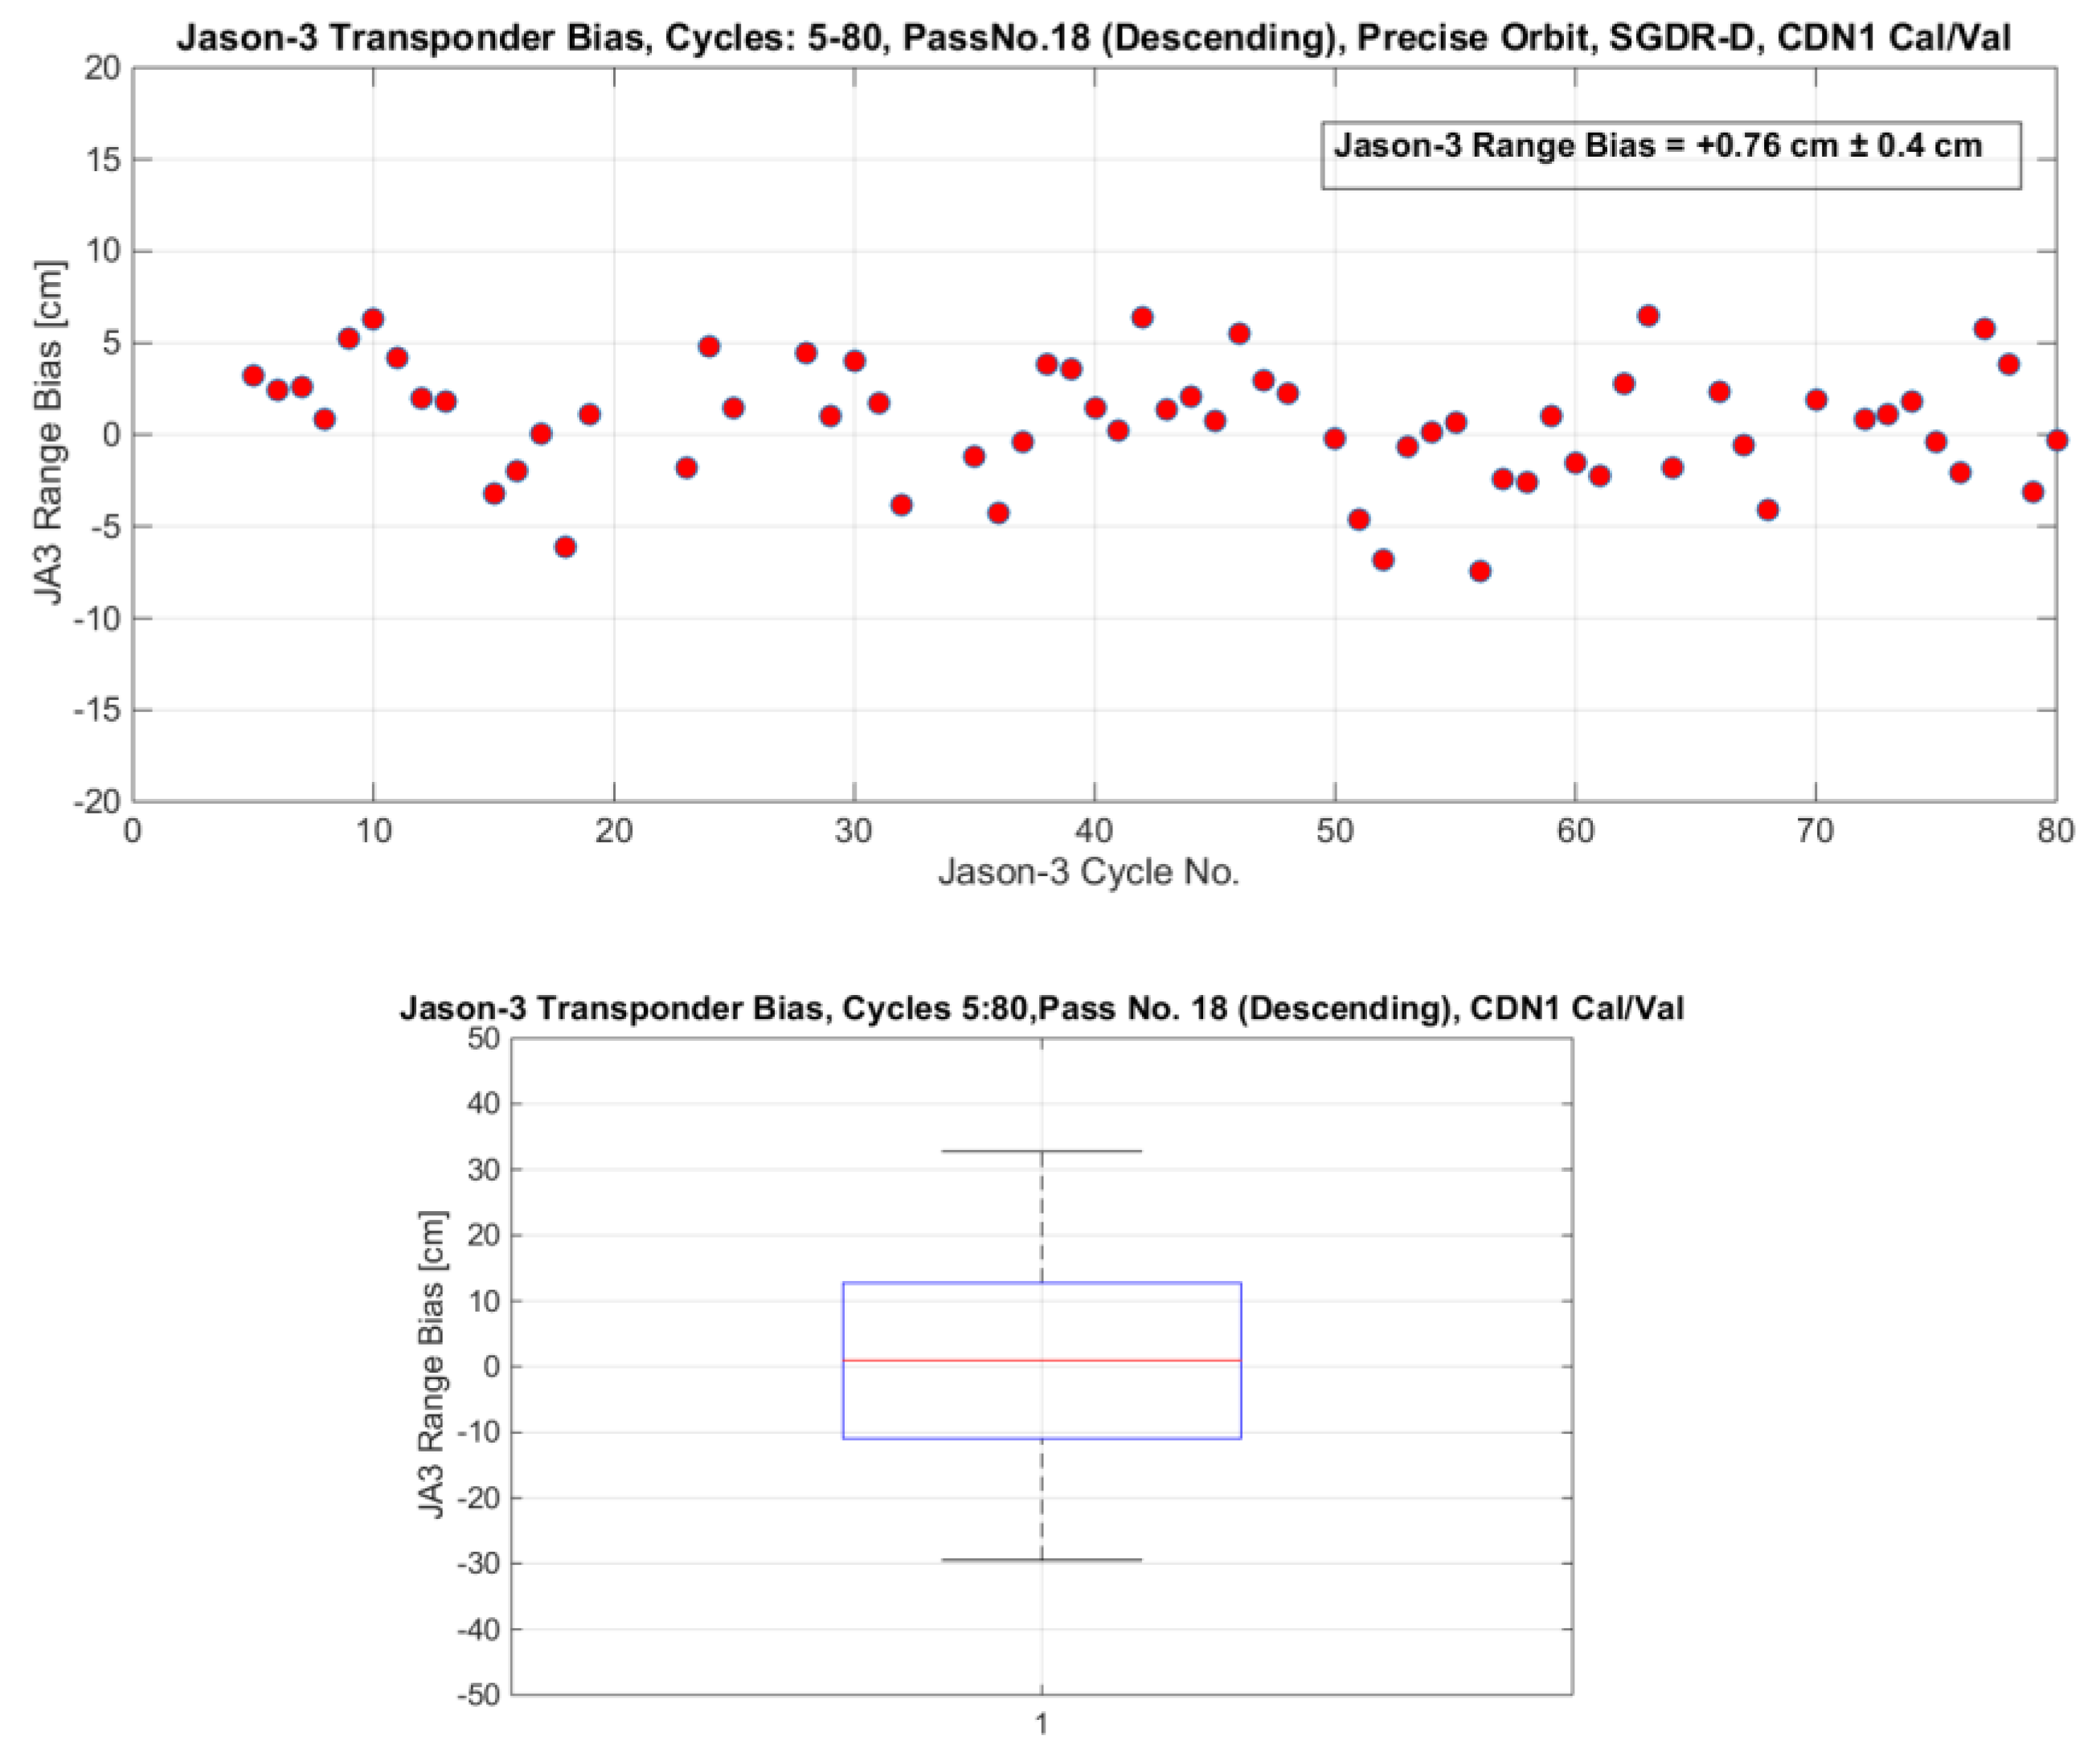
  • The transponder at the CDN1 Cal/Val site demonstrated a range bias of +0.76 cm for Jason-3, based on Cycles 5–80 with S-GDR products and precise orbits.
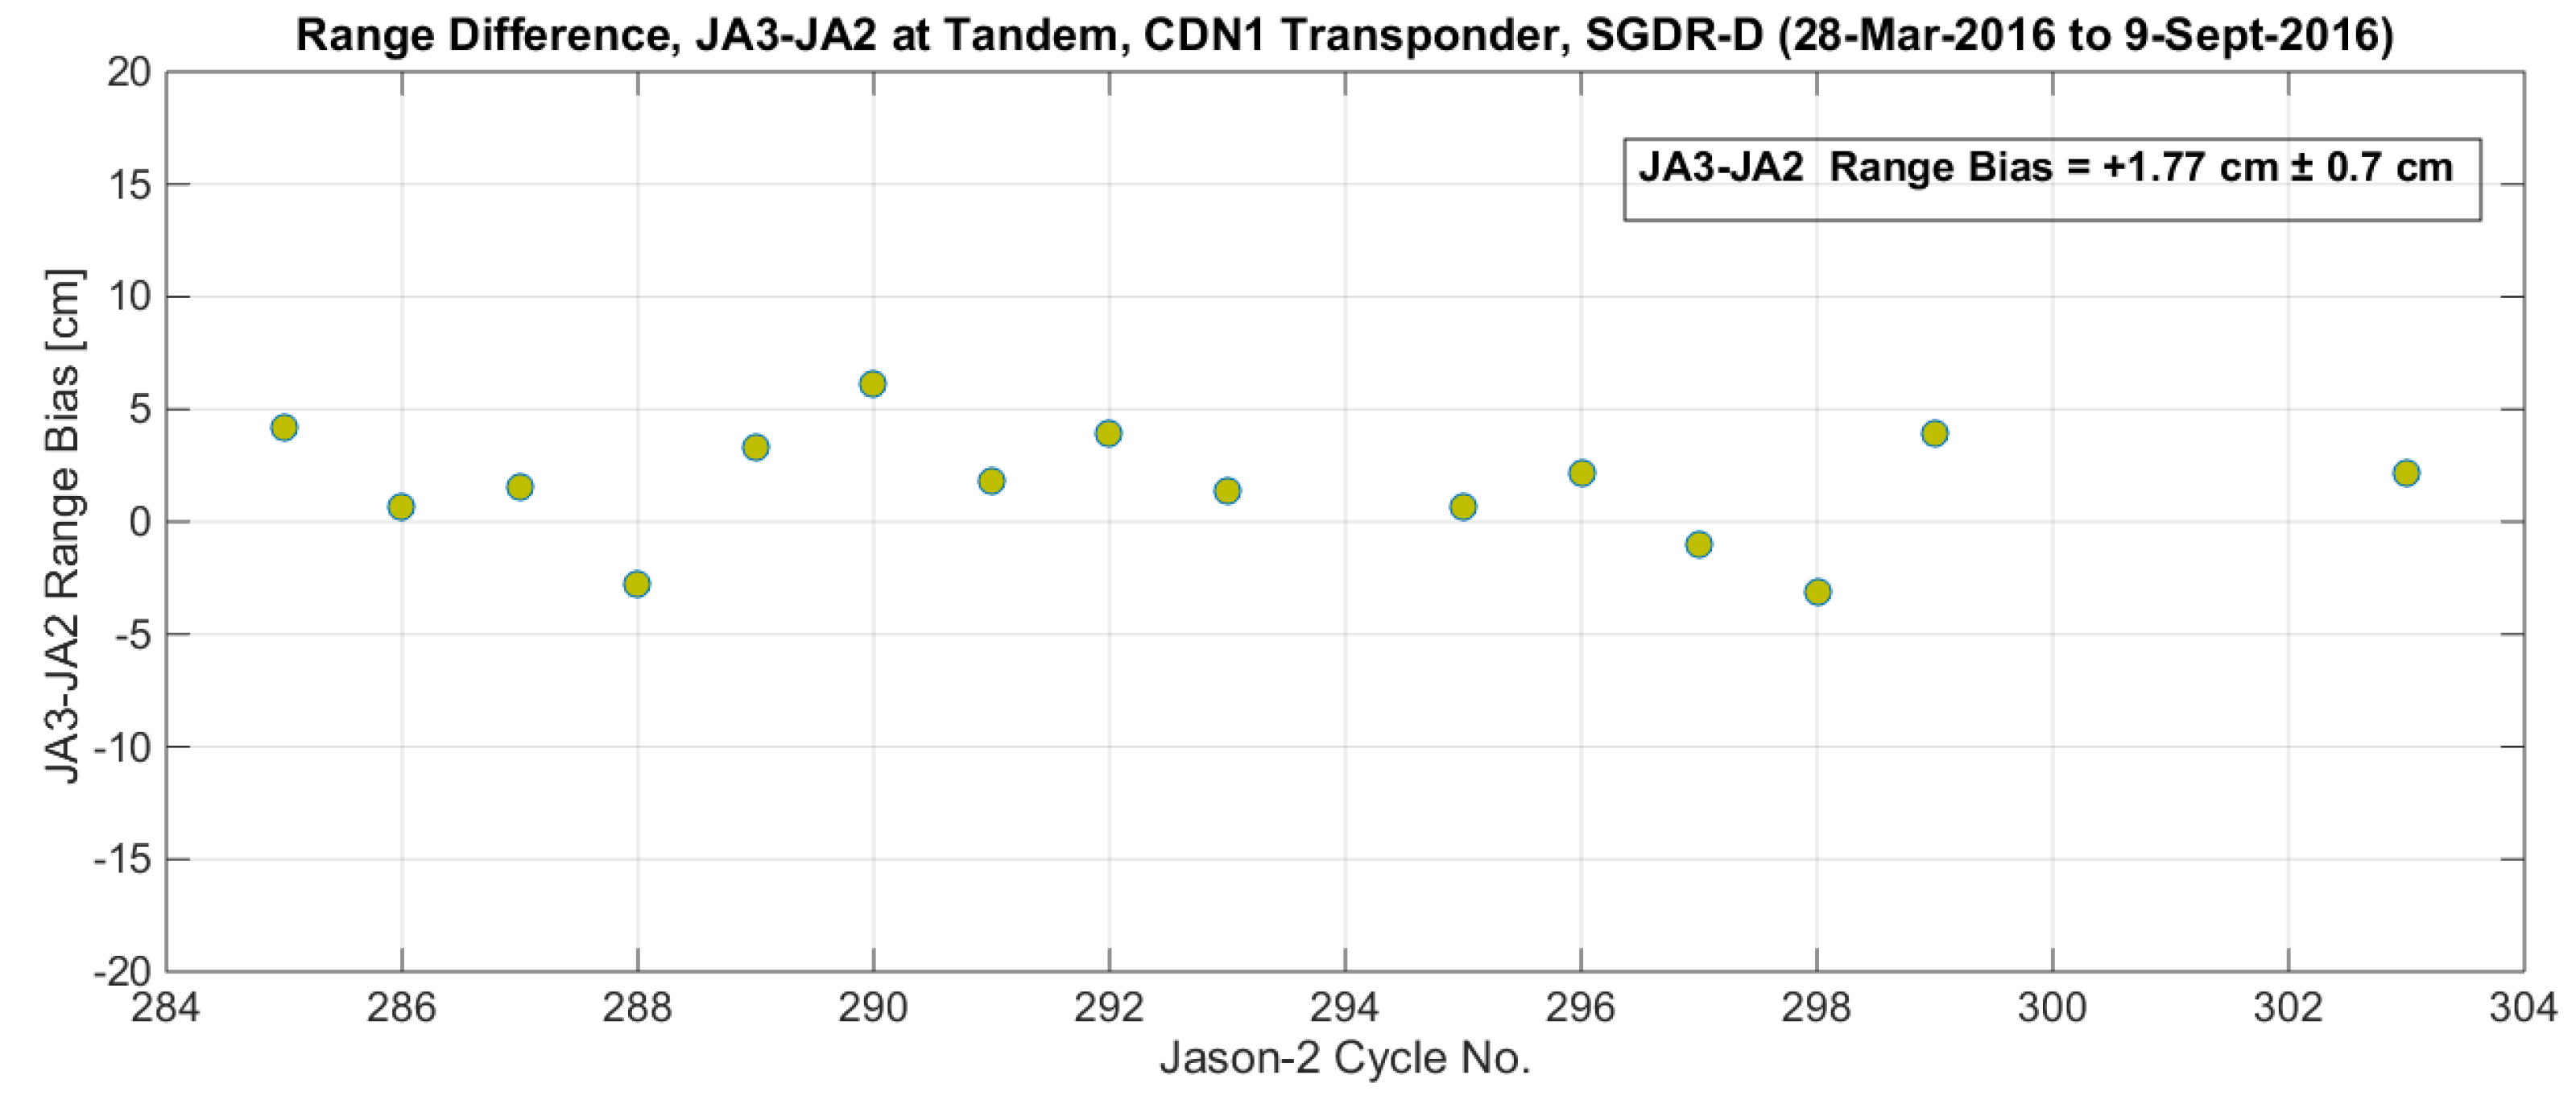
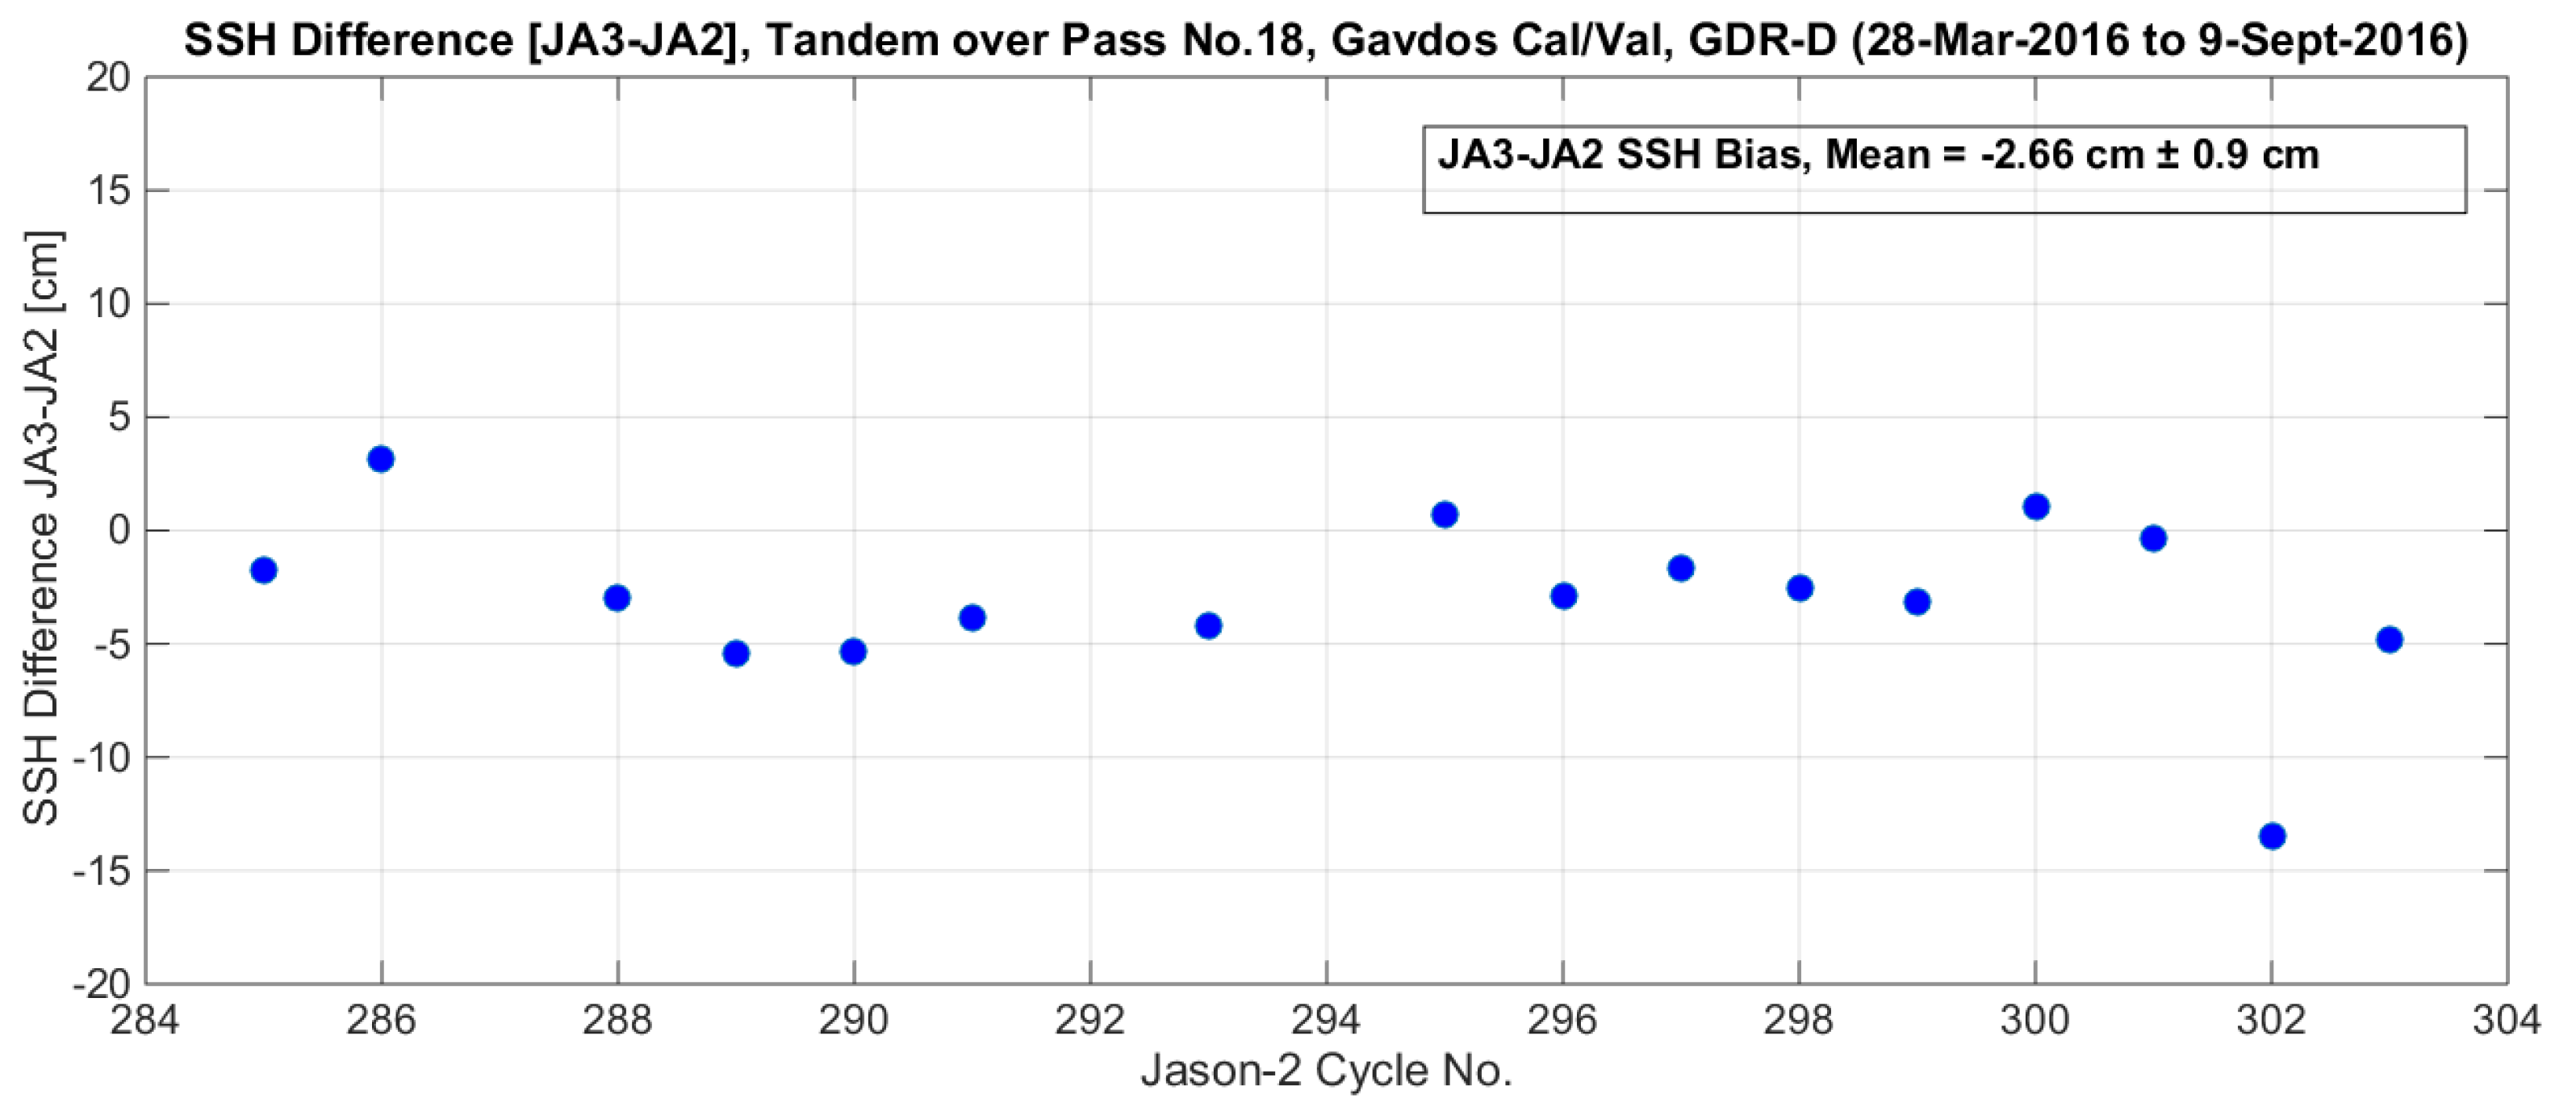
  • During the tandem mission, the offset in biases of Jason-3 with respect to Jason-2 for the SSH came to −2.66 cm, while it became +1.77 cm when ranges were directly evaluated with the transponder. The average bias offset of Jason-3 with respect to Jason-2 amounted to +2.21 cm (mean of transponder and SSH);
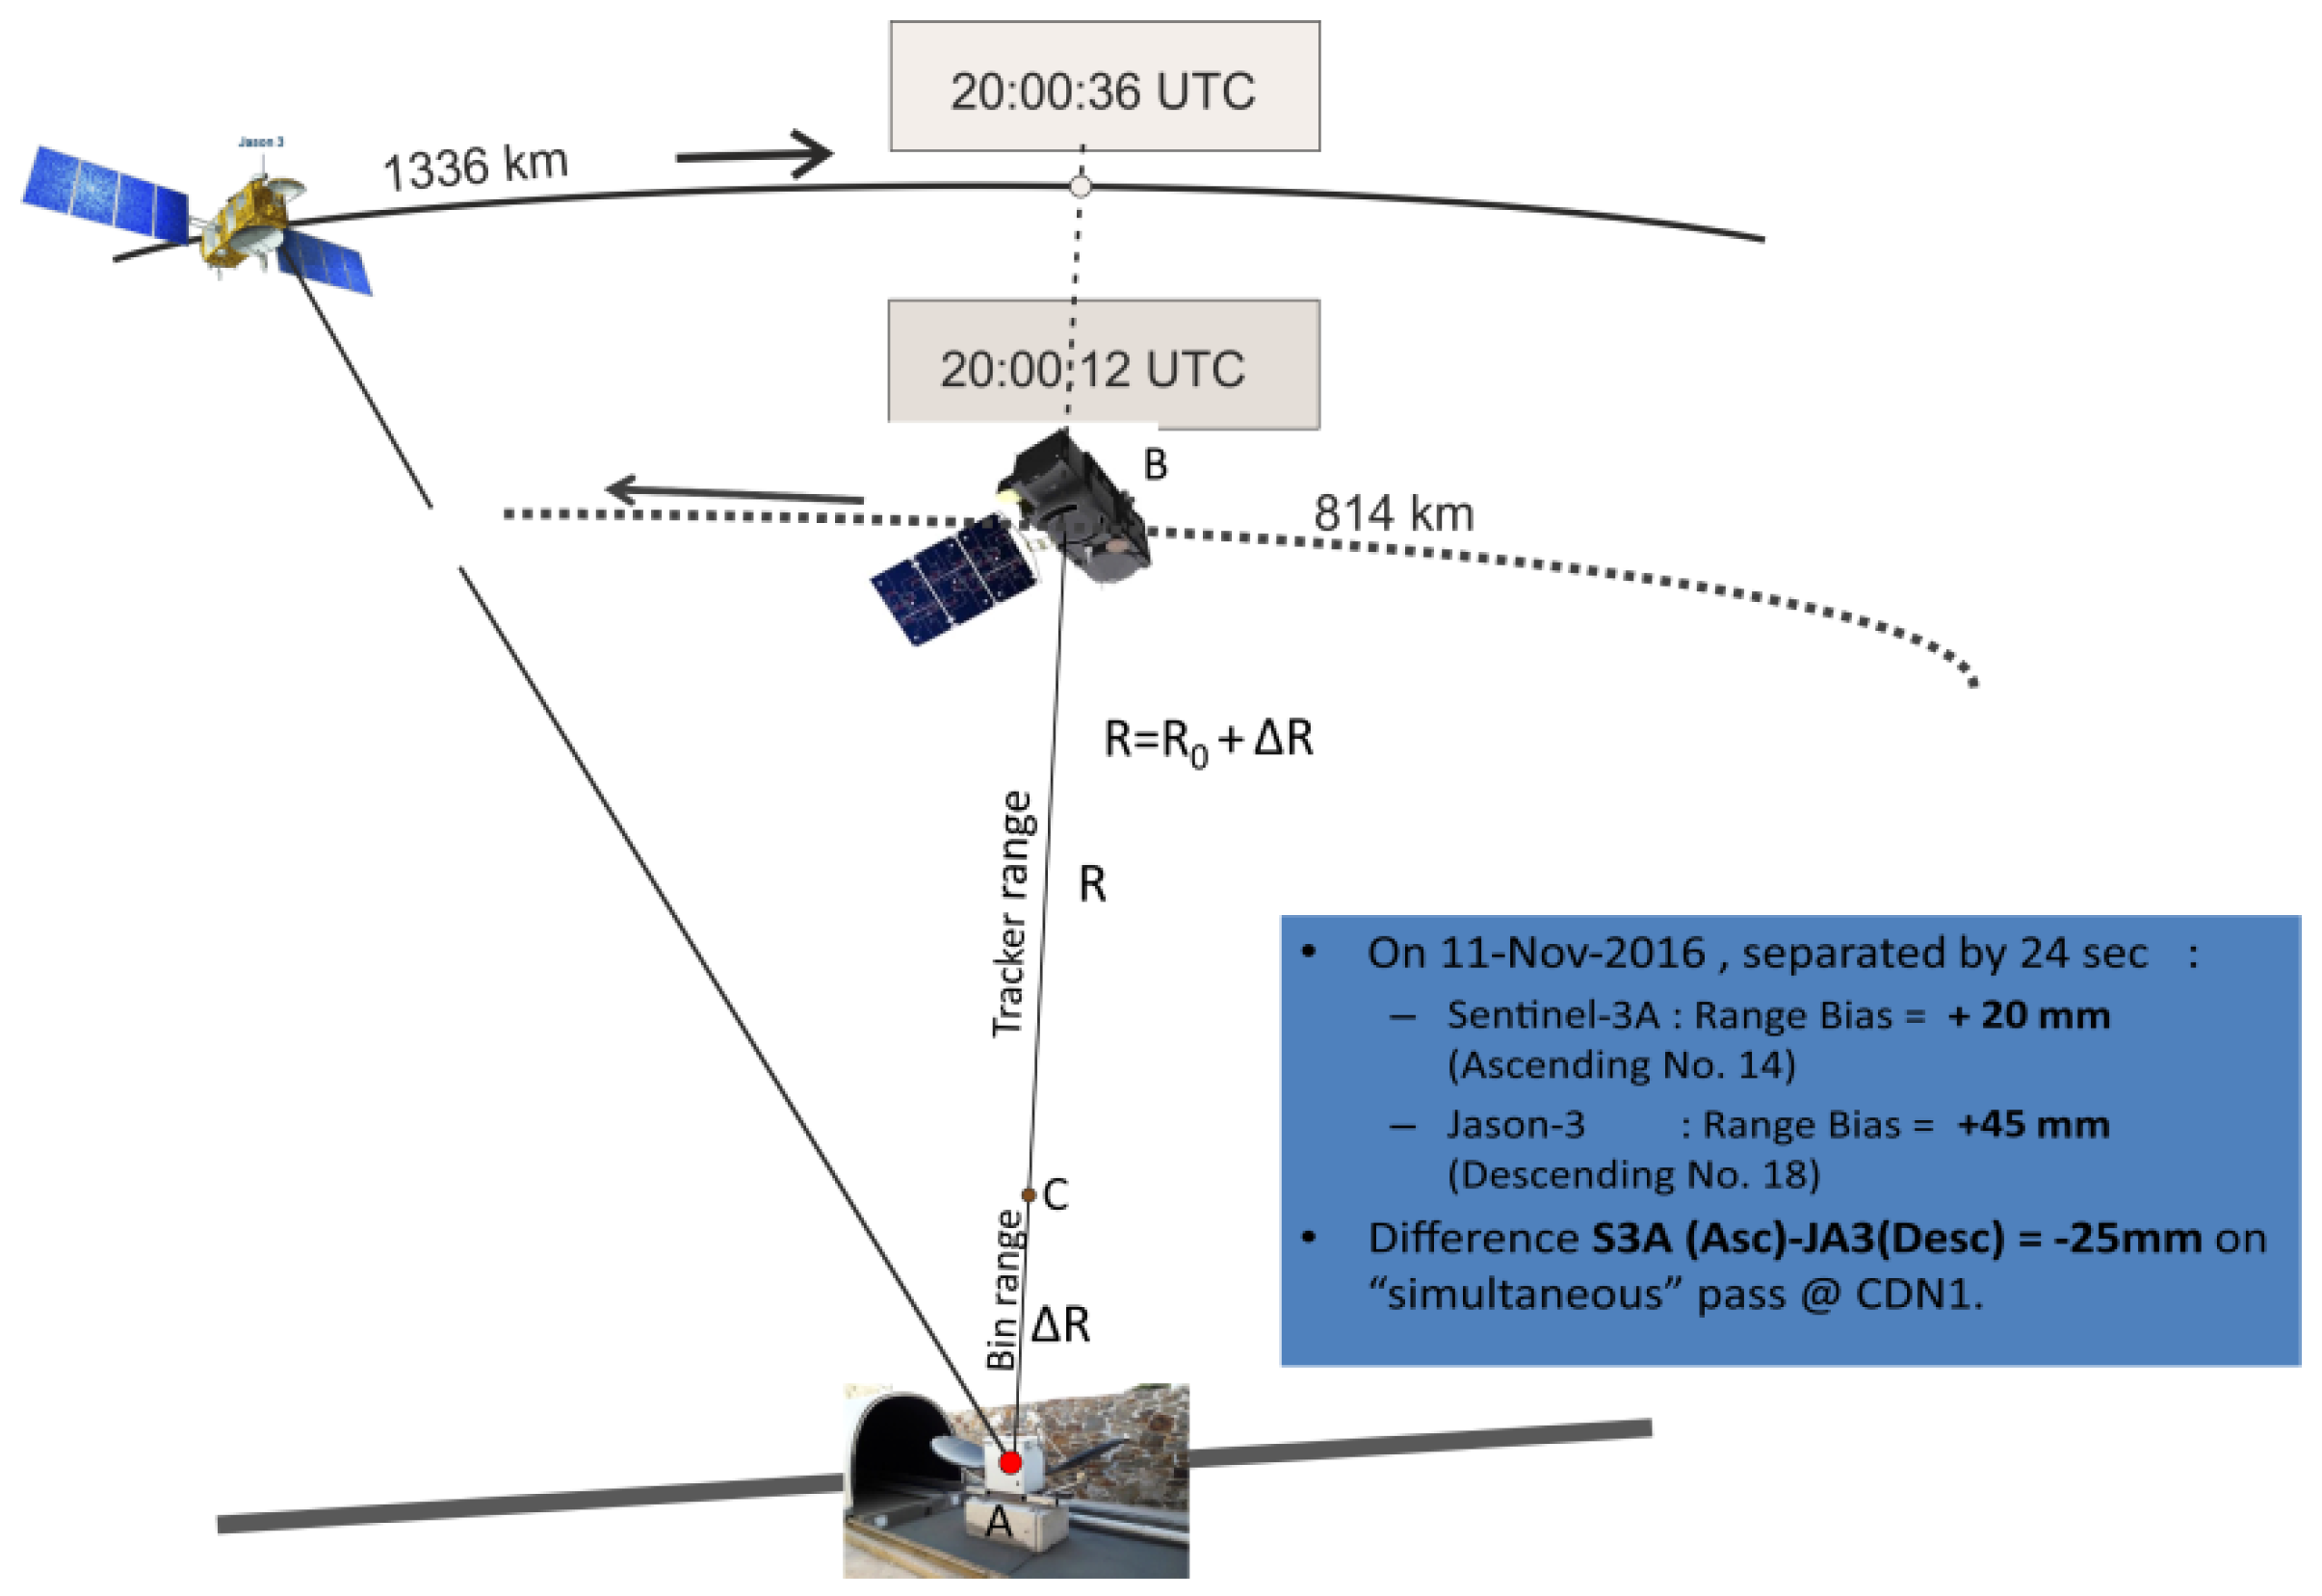
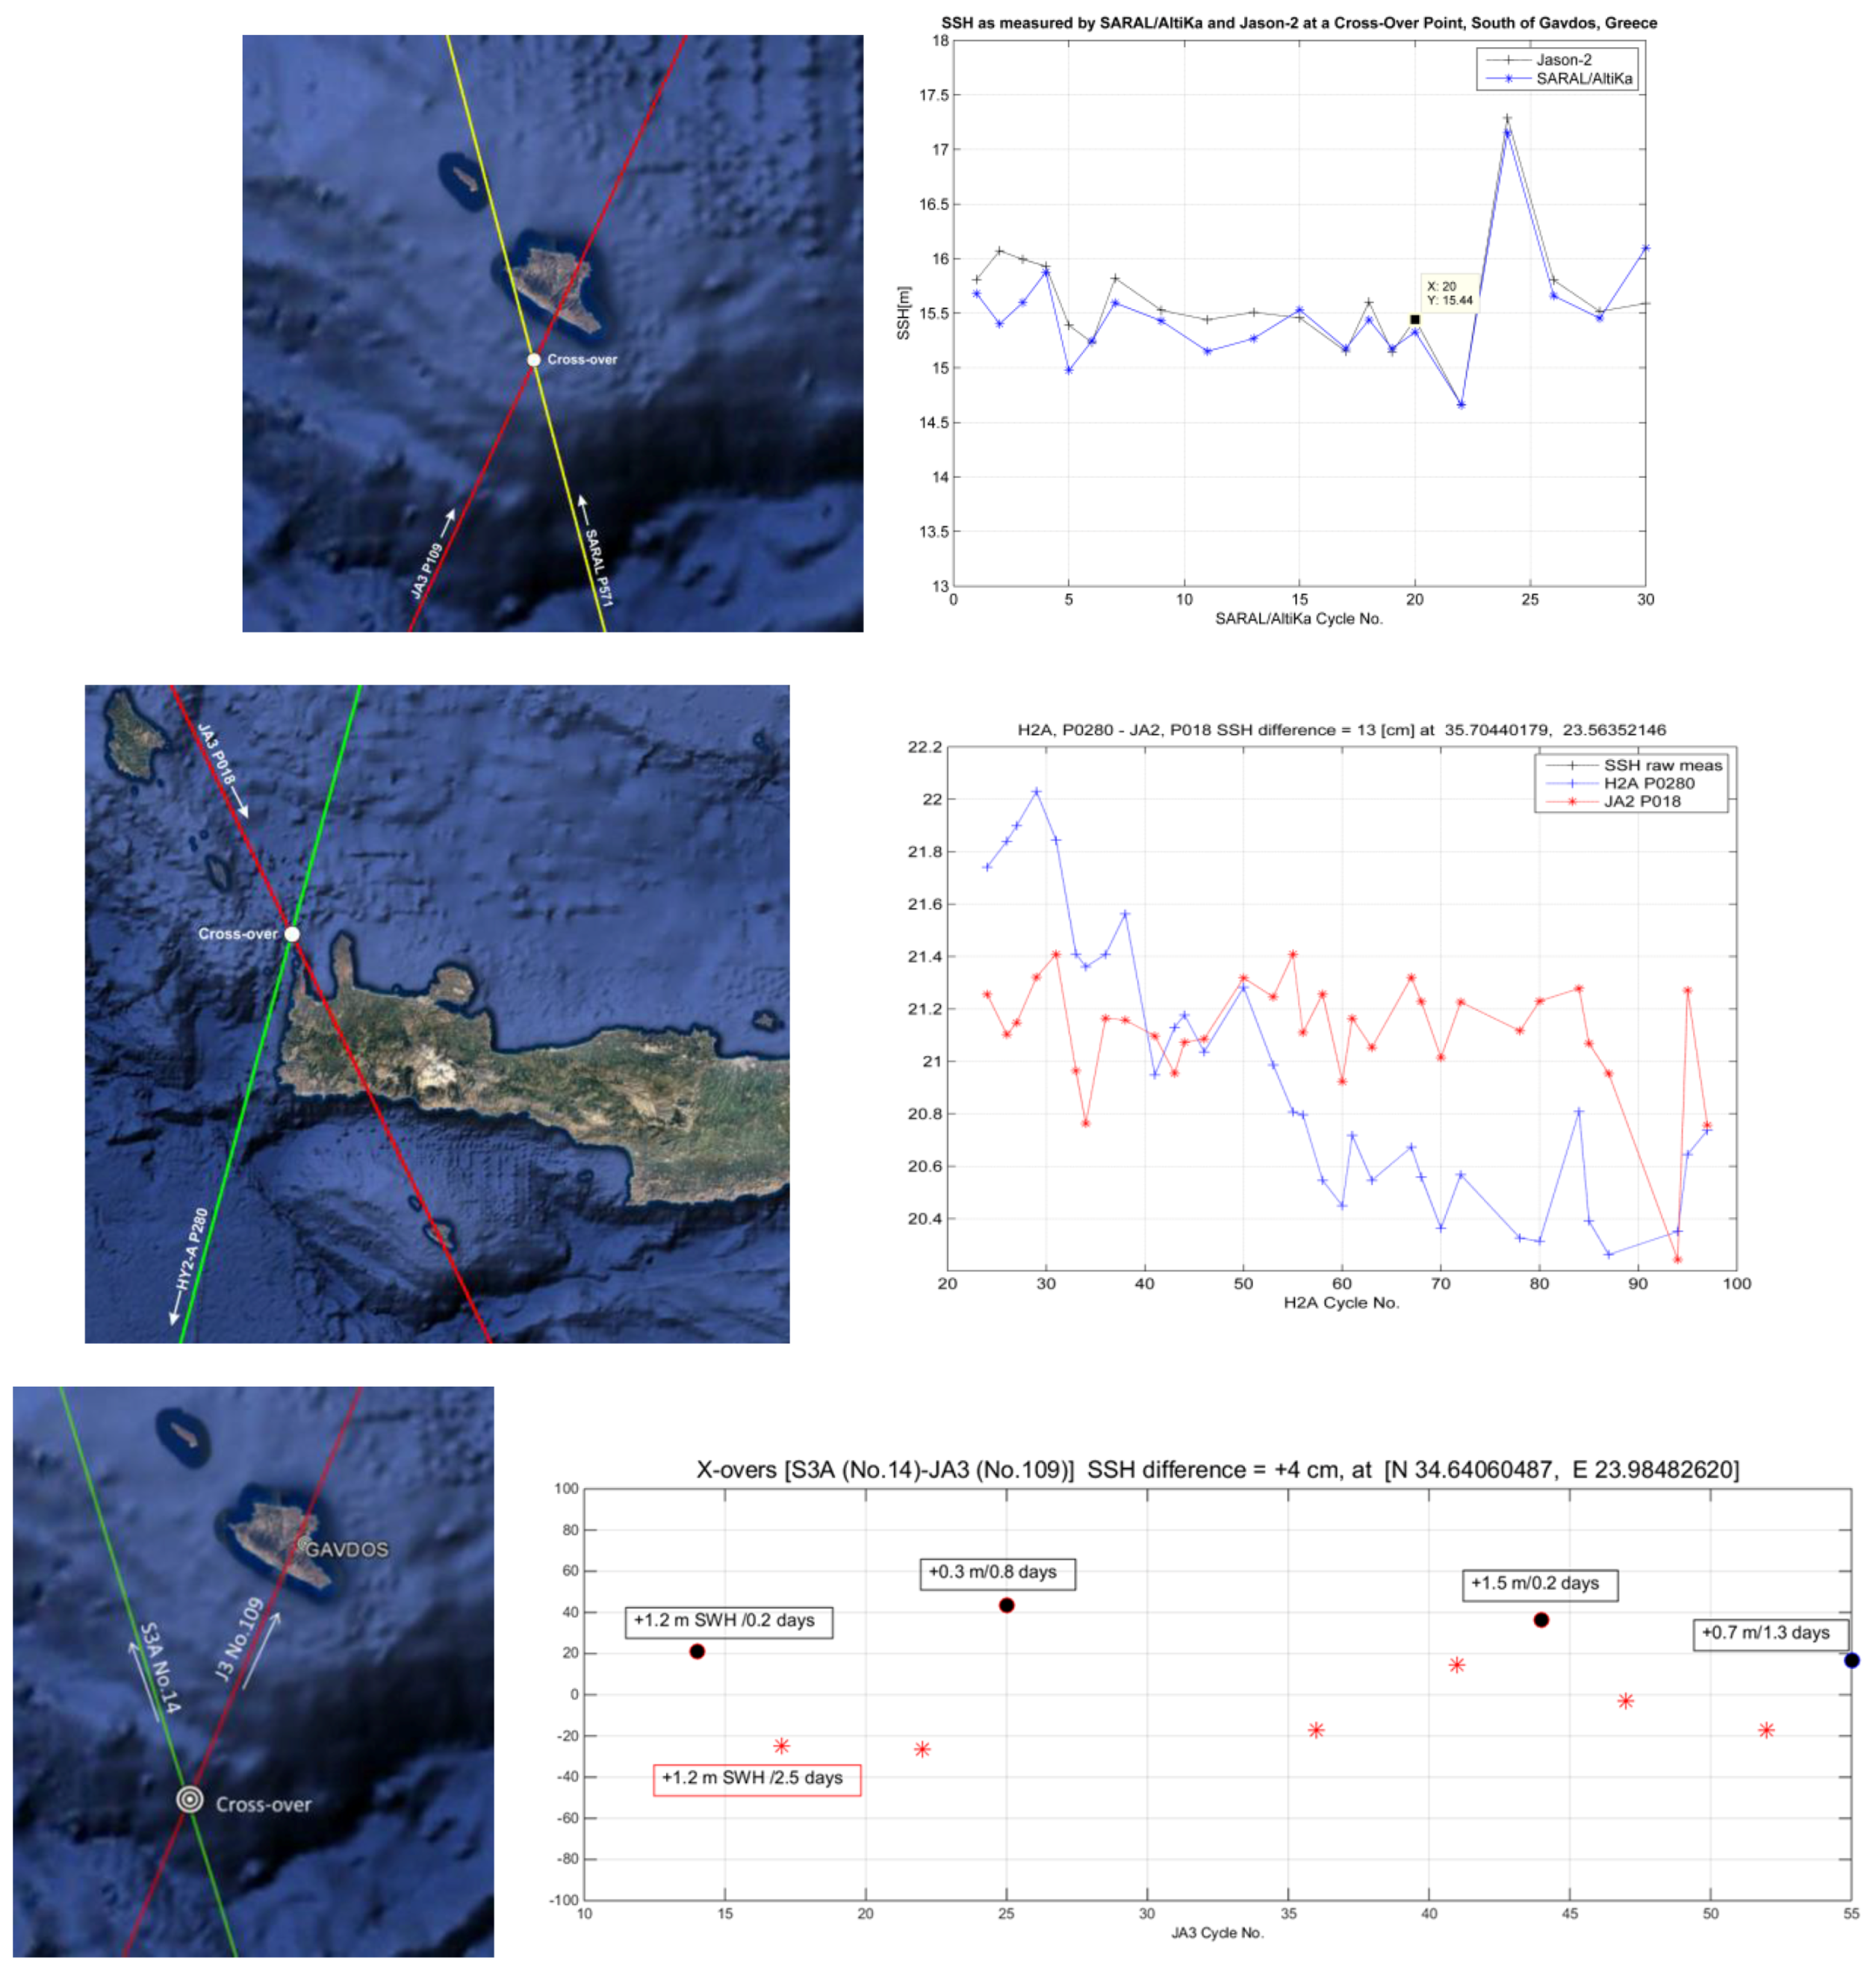
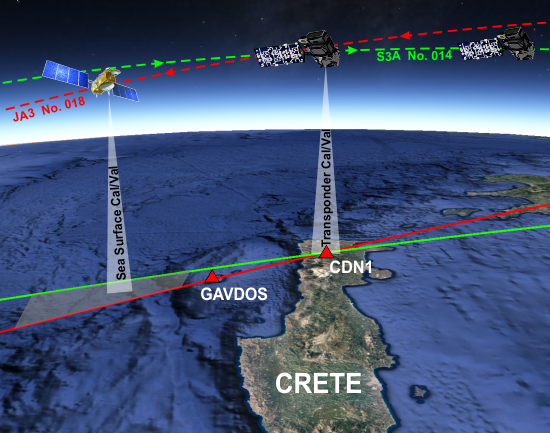
  • Sentinel-3A appeared to exhibit a relative offset in sea surface heights of +4 cm with respect to Jason-3 with crossover analysis. This value was also confirmed using a simultaneous transponder pass over the CDN1 Cal/Val site on 11 November 2016, where a range bias of −2.5 cm (i.e., opposite sign when compared to SSH bias) was determined.
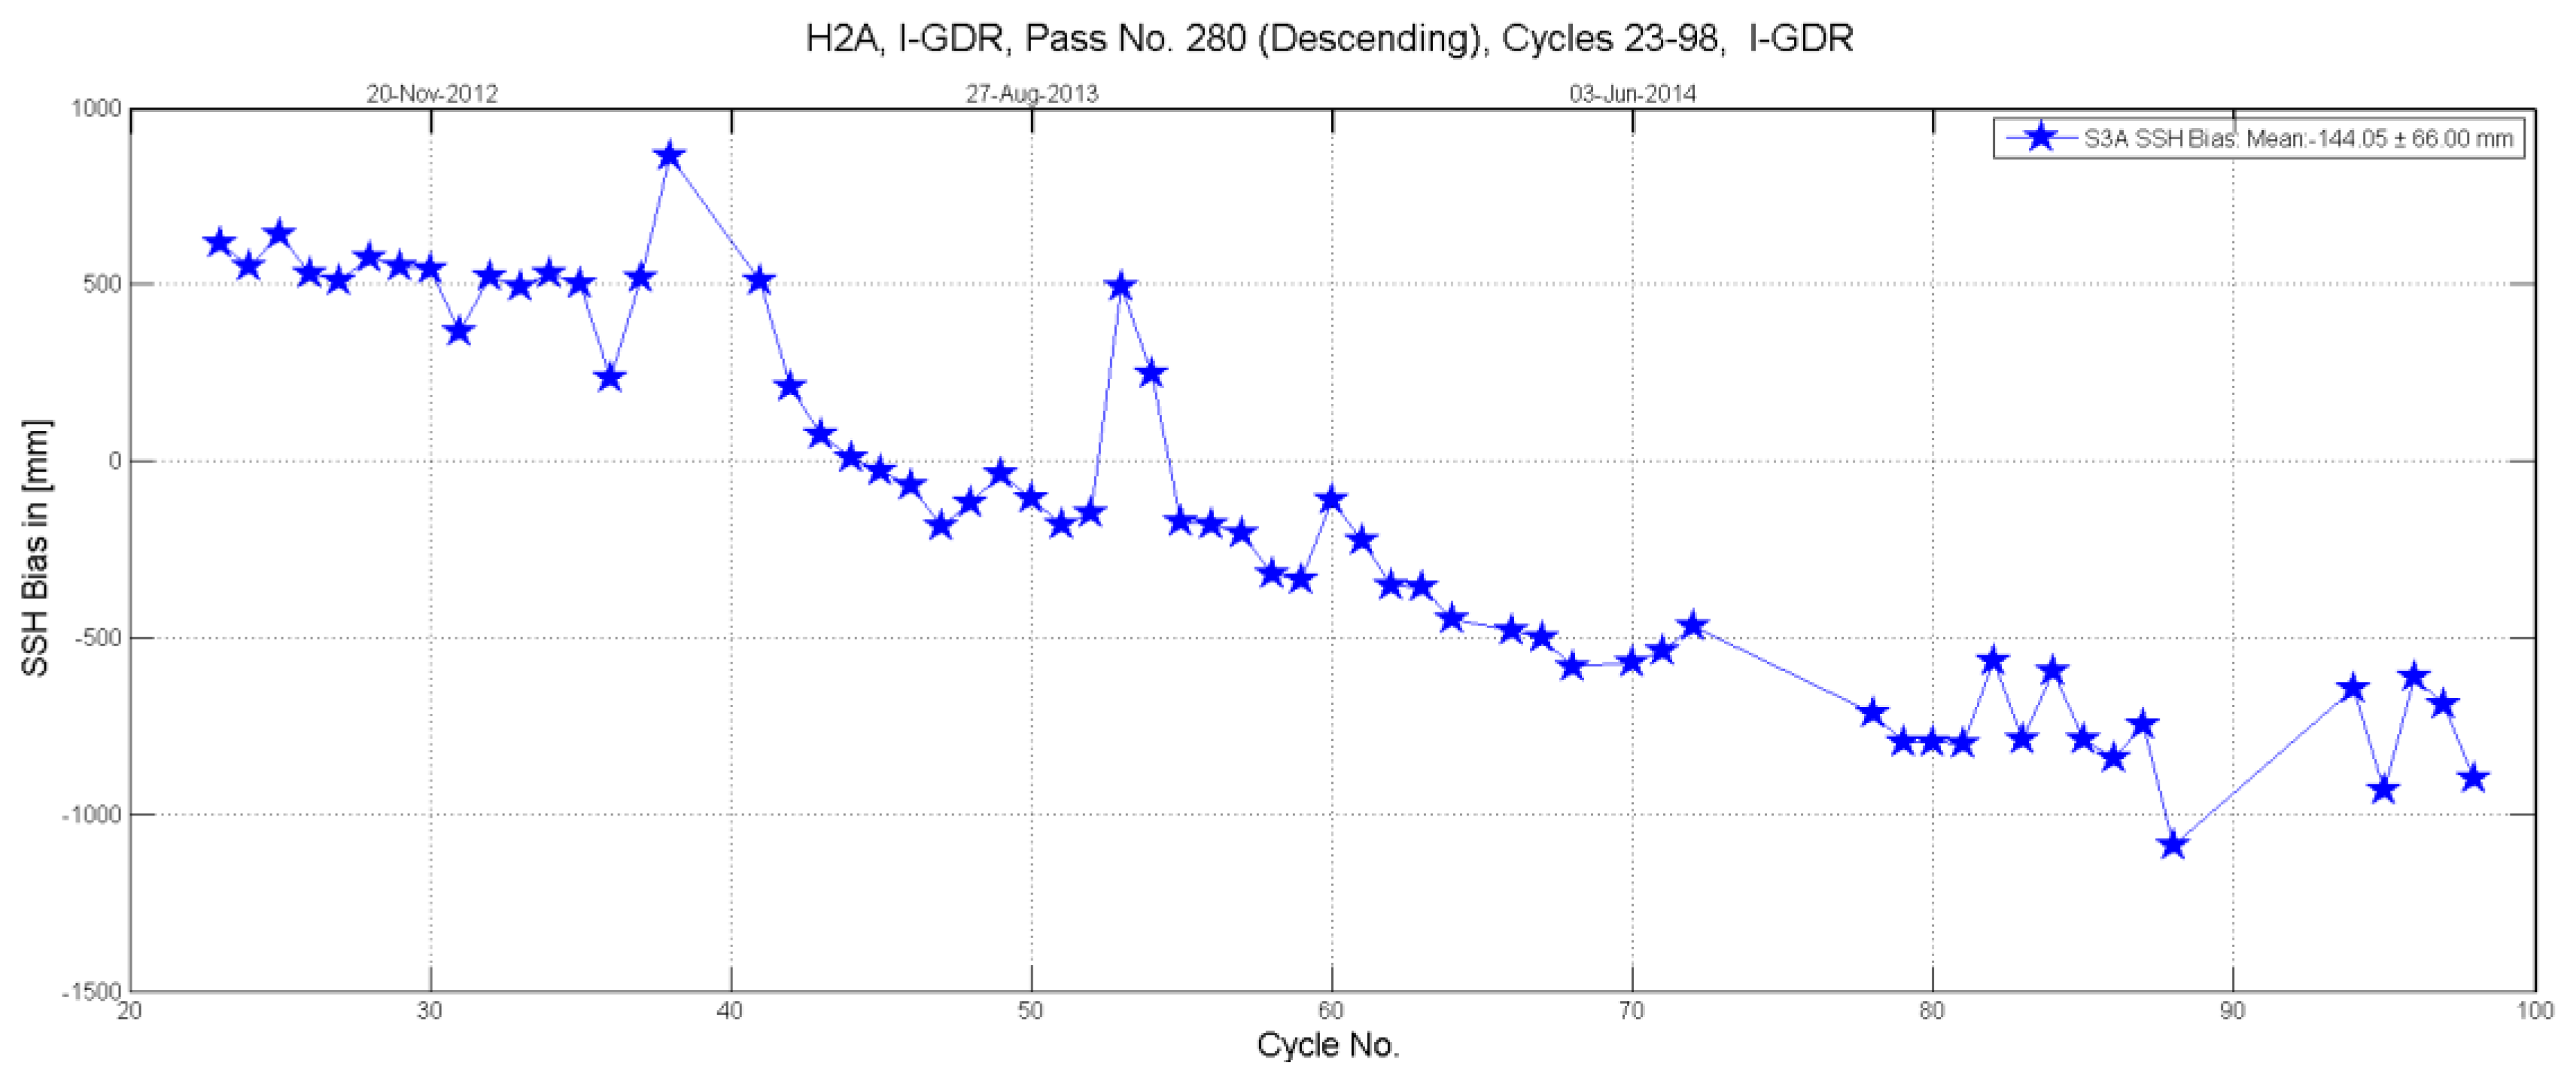
  • Relative calibration of HY-2A against Jason-2 with crossover analysis at sea shows that HY-2A displayed a performance that looks like a linear downward trend in bias, starting from +60 cm at Cycle 23 and reaching about −60 cm at Cycle 98. This kind of behavior might be explained by realizing it was generated by a satellite clock defect (oscillation) onboard HY-2A. Comparable bias results for HY-2A have been verified with cross over analysis at sea north of western Crete (Figure 31).
  • SARAL/AltiKa displays a bias in sea surface height determination which was larger than that of Jason-2.
Various error sources may be involved in and contribute uncertainties to delivered results for altimetry calibration. These are related to instrument type, measurement kind, measuring procedures and conditions, applied approximations, environmental conditions, etc. To maintain a comprehensive uncertainty budget for altimetry calibration in support of reliable, long-term, consistent calibration products, the new established standard of fiducial reference measurements for altimetry [50,51] has to be adopted for the future. Uncertainties in altimetry calibration using sea-surface techniques may arise from constituents related to site location (e.g., sea local effects, specs, etc.), conditions and settings (e.g., tide gauges, instrument types, offsets, measuring water methods, thermal expansion, harbor local conditions, etc.), tide gauges (e.g., zero-reference point of measurement, different measuring techniques, trends, gaps, etc.), local reference surfaces (e.g., connection with ellipsoid, mean sea surface, open sea and satellite measuring relation, etc.), and measuring strategies (e.g., averaging for an observation, sampling rates, simultaneity, quality control, time-tagging, etc.). The list may be endless, but the contribution generated by each constituent should be commensurate with its relative contribution to the final result in altimetry calibration.
According to the FRM4ALT principle, ground Cal/Val facilities, instrumentation and procedures, set up for calibration and validation of observations, and products in satellite altimetry shall follow well-documented procedures and protocols. Thus, uncertainty budgets have to be built upon metrological standards and capable of being traced to Système international units [51].
For the sake of demonstration, we provide an indicative example in Table 6 of how this uncertainty is to be determined for sea-surface calibration. This illustrating example has followed, at this initial stage, the methodology described in a reference document by the Joint Committee for Guides in Metrology [62]. This given demonstration model is the beginning of estimating uncertainty with FRM standards and is to be improved after additional and accurate information is assimilated in the Cal/Val. Details on the way this table is constructed are given in an upcoming publication for the FRM4ALT standardization [63], but it will not be detailed here as it is not the intent of this paper.
All in all, the Gavdos and western Crete Cal/Val infrastructure includes at present 17 permanent Global Navigation Satellite System stations, 9 tide gauges, 7 meteorological systems, and one microwave transponder. Ocean tides in this part of the world are neither extreme nor vary drastically (a few cm), while the ocean circulation and the reference models have been well established for altimeter calibration over several decades. This Cal/Val facility is capable of calibrating ascending and descending orbits of the same altimeters, but also at crossover locations at sea in the open ocean around Crete. At the same location, connection and cross-comparison of various calibration processes can be made, using the same orbits, conditions, and settings, but also employing diverse methods and instrumentations (sea-surface and transponder).
This work has presented calibration results based on the Cal/Val infrastructure in Gavdos and western Crete primarily for the reference missions of Jason-1, Jason-2, and Jason-3. It has also provided relative calibrations with respect to reference missions for other satellite altimeters, such as Sentinel-3A, HY-2A, and SARAL/AltiKa. At first, an attempt has been made to present the gradual and step by step development of the permanent ground infrastructure in Gavdos and western Crete for sea-surface and transponder altimeter calibration. This description covers a period from the early stages of this infrastructure development, more than about 15 years ago, till today (2018). This facility was originally built up in 2001 to calibrate the Jason satellite altimeters, but it eventually has contributed throughout its many years of operation into calibrating all international altimeters, such as those from the European Space Agency, as well as American, French, Chinese, and Indian satellites.

Author Contributions

Conceptualization: S.P.M., C.D., and C.M.; Data curation: X.F. and G.V.; Formal analysis: S.P.M.; Funding acquisition: S.P.M.; Investigation: S.P.M., C.M., D.G., and I.N.T.; Methodology: S.P.M. and C.M.; Project administration: S.P.M., C.D., P.F., A.T., and T.G.; Resources: C.D., C.M., A.T., and T.G.; Software: D.G. and G.V.; Supervision: S.P.M., C.D., and A.T.; Validation: X.F.; Visualization: X.F.; Writing—original draft: S.P.M. and A.T.; Writing—review and editing: S.P.M.

Funding

This research has been partially funded by the European Union and the European Space Agency, grant number [4000117101/16/I/BG and 4000122240/17/I-BG]” and “The APC was funded by the Technical University of Crete”.

Acknowledgments

Part of this work has been supported and funded by the European Union, the European Space Agency, and the Centre National d’Etudes Spatiales, France. We greatly thank Joana Fernandes and Telmo Vieira, University of Porto, Portugal, for helping us better understand the wet troposphere delays and for verifying the produced results. We also thank Mingsen Lin and Hailong Peng, the National Ocean Satellite Application Center, China, for providing help and support for the HY-2A satellite. Ole Andersen of the Danish Space Center has provided mean sea surface models for the region.

Conflicts of Interest

The authors declare no conflict of interest.

References

  1. Lewis, J.A.; Ladislaw, S.O.; Zheng, D.E. Earth Observation for Climate Change: A Report of the CSIS Technology and Public Policy Program. Center for Strategic and International Studies 2010. Available online: https://goo.gl/xB6OyX (accessed on 25 September 2018).
  2. Yang, J.; Gong, P.; Fu, R.; Zhang, M.; Chen, J.; Liang, S.; Xu, B.; Shi, J.; Dickinson, R. The role of satellite remote sensing in climate change studies. Nat. Clim. Chang. 2013, 3, 875–883. [Google Scholar] [CrossRef]
  3. Sandwell, D.T.; Müller, R.D.; Smith, W.H.F.; Garcia, E.; Francis, R. New global marine gravity model from CryoSat-2 and Jason-1 reveals buried tectonic structure. Science 2014, 346, 65–67. [Google Scholar] [CrossRef] [PubMed]
  4. Smith, W.H.F.; Sandwell, D. Global Sea Floor Topography from Satellite Altimetry and Ship Depth Sounding. Science 1997, 277, 1956–1962. [Google Scholar] [CrossRef]
  5. Cretaux, J.F.; Kouraev, A.; Berge-Nguyen, M.; Cazenave, A.; Papa, F. Satellite Altimetry for monitoring lake level changes. In Transboundary Water Resources: Strategies for Regional Security and Ecological Stability; NATO Science Series (Series IV: Earth and Environmental Sciences); Vogtmann, H., Dobretsov, N., Eds.; Springer: Dordrecht, The Netherlands, 2005; Volume 46. [Google Scholar]
  6. Cretaux, J.F.; Calmant, S.; Romanovski, V.; Shibuyin, A.; Lyard, F.; Berge-Nguyen, M.; Cazenave, A.; Hernandez, F.; Perosanz, F. An absolute calibration site for radar altimeters in the continental domain: Lake Issyk-Kul in Central Asia. J. Geod. 2009, 83, 723–735. [Google Scholar] [CrossRef]
  7. Gornitz, V. Monitoring sea level changes. Clim. Chang. 1995, 31, 515–544. [Google Scholar] [CrossRef]
  8. IRGC. The Emergence of Risks: Contributing Factors, Emerging Risks: Sea Level Rise; International Risk Governance Council: Lausanne, Switzerland, 2010; ISBN 978-2-9700672-7-6. [Google Scholar]
  9. Haigh, I.D.; Wahl, T.; Rohling, E.J.; Price, R.M.; Pattiaratchi, C.B.; Calafat, F.M.; Dangendorf, S. Timescale for detecting a significant acceleration in sea level rise. Nat. Commun. 2014, 5, 3635. [Google Scholar] [CrossRef] [PubMed] [Green Version]
  10. Bojinski, S.; Verstraete, M.; Peterson, T.C.; Richter, C.; Simmons, A.; Zemp, M. The concept of essential climate variables in support of climate research, applications, and policy. Bull. Am. Meteorol. Soc. 2014, 95, 1431–1443. [Google Scholar] [CrossRef]
  11. Hollmann, R.; Merchant, C.J.; Saunders, R.; Downy, C.; Buchwitz, M.; Cazenave, A.; Chuvieco, E.; Defourny, P.; de Leeuw, G.; Forsberg, R.; et al. The ESA Climate Change Initiative: Satellite Data records for Essential Climate Variables. Bull. Am. Meteorol. Soc. 2013, 94, 1541–1552. [Google Scholar] [CrossRef]
  12. Carlowicz, M. Sea Level Rise Hits Home at NASA: Watching Water Rise Right outside the Front Door. Earth Observatory. Available online: https://earthobservatory.nasa.gov/Features/NASASeaLevel (accessed on 25 January 2018).
  13. Englander, J. Sea Level Rise-Fact & Fiction. TEDX-Boca Raton. Available online: https://www.youtube.com/watch?v=TH8Q8Ki9fCA (accessed on 21 April 2018).
  14. Le Traon, P.Y. From satellite altimetry to Argo and operational oceanography: Three revolutions in oceanography. Ocean Sci. 2013, 9, 901–915. [Google Scholar] [CrossRef]
  15. IPCC. Summary for Policymakers. In Climate Change 2013: The Physical Science Basis. Contribution of Working Group I to the Fifth Assessment Report of the Intergovernmental Panel on Climate Change; Stocker, T.F., Qin, D., Plattner, G.-K., Tignor, M., Allen, S.K., Boschung, J., Nauels, A., Xia, Y., Bex, V., Midgley, P.M., Eds.; Cambridge University Press: Cambridge, UK; New York, NY, USA, 2013. [Google Scholar]
  16. National Academies of Sciences, Engineering and Medicine. Thriving on Our Changing Planet: A Decadal Strategy for Earth Observation from Space; The National Academies Press: Washington, DC, USA, 2018. [Google Scholar]
  17. Cazenave, A.; Dieng, H.B.; Meyssignac, B.; von Schuckmann, K.; Decharme, B.; Berthier, E. The rate of sea-level rise. Nat. Clim. Chang. Lett. 2014, 4, 358–361. [Google Scholar] [CrossRef]
  18. Watson, C.; White, N.J.; Church, J.A.; King, M.A.; Burgette, R.J.; Legresy, B. Unabated global mean sea-level rise over the satellite altimeter era. Nat. Clim. Chang. Lett. 2015, 5, 565–568. [Google Scholar] [CrossRef]
  19. Fu, L.L.; Haines, B.J. The challenges in long-term altimetry calibration for addressing the problem of global sea level change. J. Adv. Space Res. 2012. [Google Scholar] [CrossRef]
  20. Müller, R. Calibration and verification of remote sensing instruments and observations. Remote Sens. 2014, 6, 5692–5695. [Google Scholar] [CrossRef]
  21. Bonnefond, P.; Exertier, P.; Laurain, O.; Jan, G. Absolute calibration of Jason-1 and Jason-2 altimeters in Corsica during formation flight phase. Mar. Geod. 2010, 33 (Suppl. S1), 80–90. [Google Scholar] [CrossRef]
  22. Haines, B.J.; Desai, S.; Born, G. The Harvest Experiment: Calibration of the climate data record from TOPEX/Poseidon, Jason-1 and the Ocean Surface Topography Mission. Mar. Geod 2010, 33 (Suppl. S1), 91–113. [Google Scholar] [CrossRef]
  23. Watson, C.; White, N.; Church, J.; Burgette, R.; Tregoning, P.; Coleman, R. Absolute calibration in Bass Strait, Australia: TOPEX, Jason-1 and OSTM/Jason-2. Mar. Geod. 2011, 34, 242–260. [Google Scholar] [CrossRef]
  24. Mertikas, S.P.; Ioannides, R.T.; Tziavos, I.N.; Vergos, G.S.; Hausleitner, W.; Frantzis, X.; Tripolitsiotis, A.; Partsinevelos, P.; Andrikopoulos, D. Statistical models and latest results in the determination of the absolute bias for the radar altimeters of Jason satellites using the Gavdos facility. Mar. Geod. 2010, 33 (Suppl. S1), 114–149. [Google Scholar] [CrossRef]
  25. Cancet, M. Regional In Situ Cal/Val of Satellite Altimeter Range at Non-Dedicates Sites. In 2017 Ocean Surface Topography Science Team. Available online: https://goo.gl/w2tUeA (accessed on 25 September 2018).
  26. Calmant, S. Evaluation of the Sentinel-3A Water Levels over Large Hydrological Basins. In 2017 Ocean Surface Topography Science Team. Available online: https://goo.gl/ThTLNQ (accessed on 25 September 2018).
  27. Babu, K.N.; Shukla, A.K.; Suchandra, A.B.; Arun-Kumar, S.V.V.; Bonnefond, P.; Testut, L.; Mehra, P.; Laurain, O. Absolute calibration of SARAL/AltiKa in Kavaratti During its initial calibration-validation phase. Mar. Geod. 2015, 38, 156–170. [Google Scholar] [CrossRef]
  28. Martinez-Benjamin, J.J. Contribution of Ibiza, Estarit and Barcelona Harbours Sites for Altimeter Calibrations. In 2017 Ocean Surface Topography Science Team. Available online: https://goo.gl/2TneV5 (accessed on 25 September 2018).
  29. Peng, H.; Mu, B.; Lin, M.; Zhou, W. HY-2A satellite calibration and validation approach and results. In Proceedings of the IEEE Geoscience and Remote Sensing Symposium, Quebec City, QC, Canada, 13–18 July 2014. [Google Scholar]
  30. Mertikas, S.P.; Pavlis, E.C.; Drakopoulos, P. GAVDOS: A satellite radar altimeter calibration and sea-level monitoring site on the island of Gavdos, Crete. In Building the European Capacity in Operational Oceanography, Proceedings of the Third EuroGOOS Conference; Elsevier Oceanography Series 69; Dahlin, H., Flemming, N.C., Nittis, K., Petersson, S.E., Eds.; Elsevier: Amsterdam, The Netherlands, 2003; pp. 258–264. [Google Scholar]
  31. Mertikas, S.P.; Zhou, X.; Qiao, F.; Daskalakis, A.; Lin, M.; Peng, H.; Tziavos, I.N.; Vergos, G.; Tripolitsiotis, A.; Frantzis, X. First preliminary results for the absolute calibration of the Chinese HY-2 altimetric mission using the CRS1 calibration facilities in West Crete, Greece. Adv. Space Res. 2015, 57, 78–95. [Google Scholar] [CrossRef]
  32. Velaoras, D.; Krokos, G.; Nittis, K.; Theocharis, A. Dense intermediate water outflow from the Cretan Sea: A salinity driven, recurrent phenomenon, connected to thermohaline circulation changes. J. Geophys. Res. Oceans 2014, 119, 4797–4820. [Google Scholar] [CrossRef] [Green Version]
  33. Mertikas, S.P.; Tripolitsiotis, A.; Mavrocordatos, C.; Picot, N.; Féménias, P.; Daskalakis, A.; Boy, F. A permanent infrastructure in Crete for the calibration of Sentinel-3, Cryosat-2 and Jason missions with a transponder. In Proceedings of the ESA Living Planet Symposium, Edimburgh, UK, 9–13 September 2013. [Google Scholar]
  34. Tserolas, V.; Mertikas, S.P.; Frantzis, X. The Western Crete geodetic infrastructure: Long-range power-law correlations in GPS time series using Detrended Fluctuation Analysis. Adv. Space Res. 2013, 51, 1448–1467. [Google Scholar] [CrossRef]
  35. Herring, T.A.; King, R.W.; McClusky, S.C. GAMIT Reference Manual: GPS Analysis at MIT, Release 10.4.; Massachusetts Institute of Technology: Cambridge, MA, USA, 2010. [Google Scholar]
  36. Dash, R.; Andritsch, F.; Arnold, D.; Bertone, S.; Fridez, P.; Jäggi, A.; Jean, Y.; Maier, A.; Mervart, L.; Meyer, U.; et al. Bernese GNSS Software, Version 5.2.; University of Bern, Bern Open Publishing: Bern, Switzerland, 2015. [Google Scholar]
  37. Desai, S.; Kuang, D.; Bertiger, W. GIPSY/OASIS (GIPSY) Overview and under the Hood. California Institute of Technology. Available online: ftp://ehzftp.wr.usgs.gov/svarc/GIPSY_pdfs/GIPSY_Overview.pdf (accessed on 27 June 2016).
  38. Willis, P.; Mertikas, S.P.; Argus, D.F.; Bock, O. DORIS and GPS monitoring of the Gavdos calibration site. Adv. Space Res. 2013, 51, 1438–1447. [Google Scholar] [CrossRef]
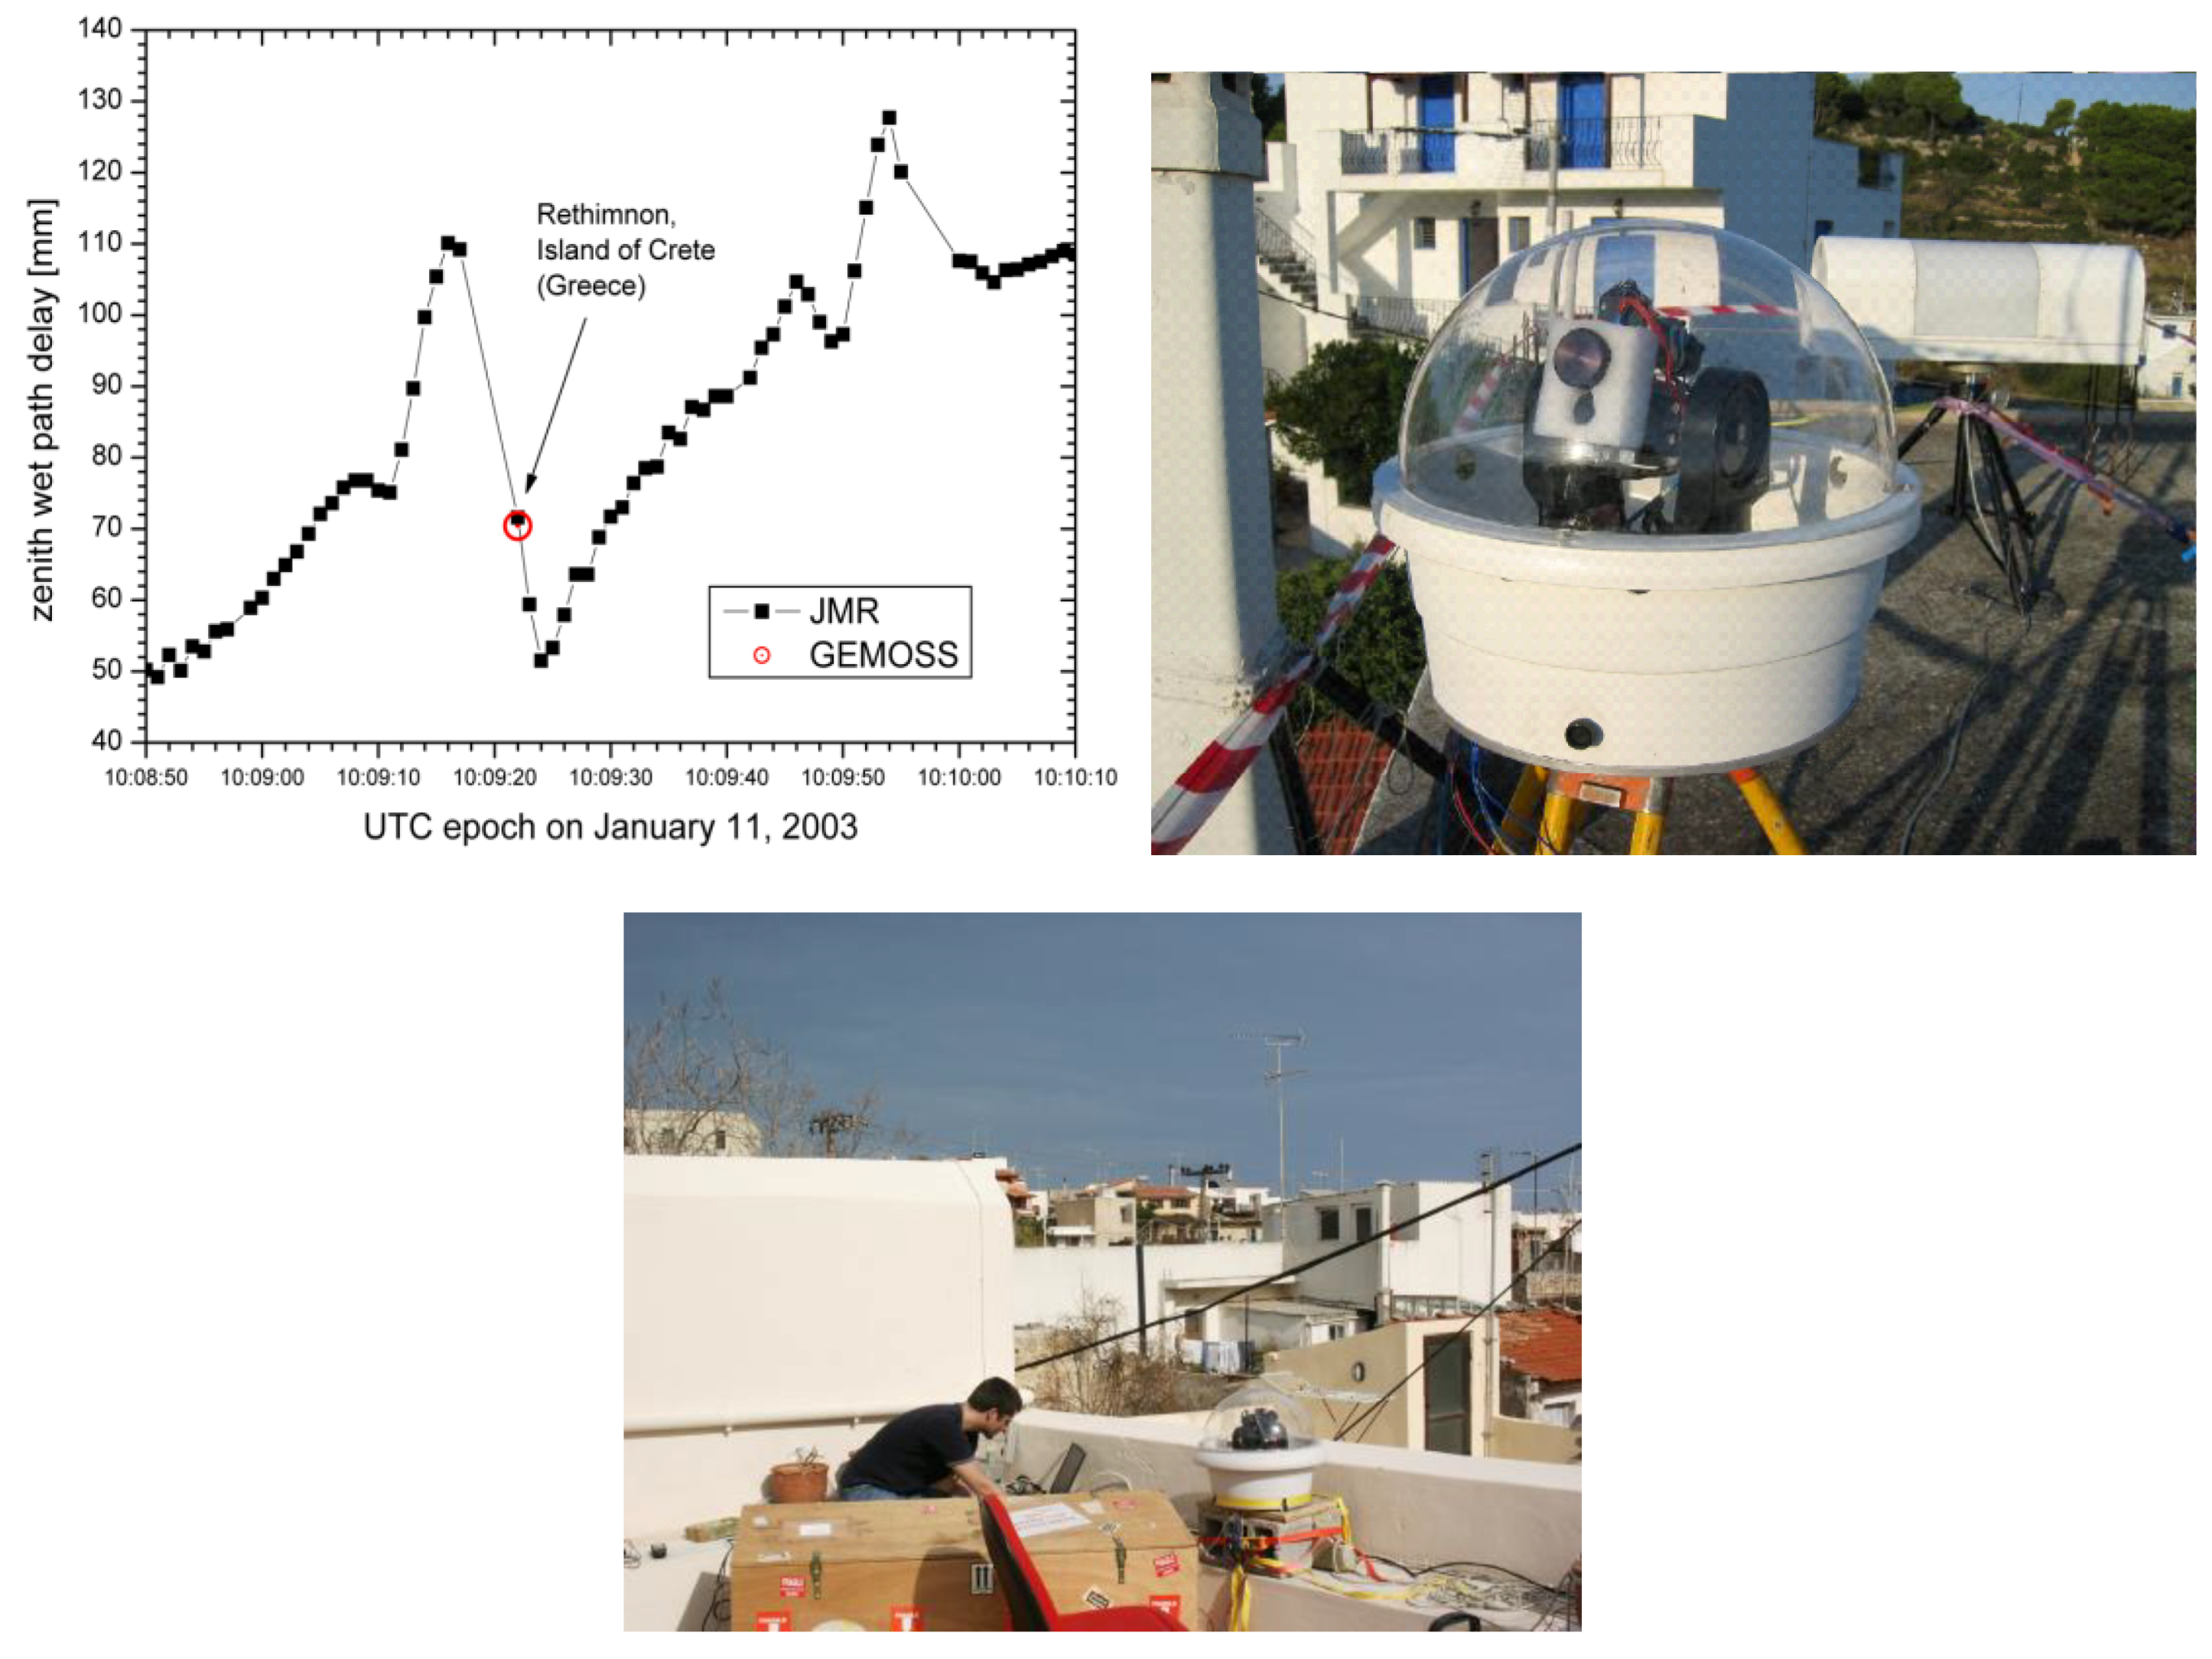
  39. Somieski, A.; Burki, B.; Geiger, A.; Kahle, H.G.; Pavlis, E.C.; Becker-Ross, H.; Florek, S.; Okruss, M. Geodetic Mobile Solar Spectrometer (GEMOSS): Comparison with the microwave radiometer of the altimeter satellite Jason (JMR). Geophys. Res. Abstr. 2005, 7, 02746. [Google Scholar] [CrossRef]
  40. Mertikas, S.P.; Daskalakis, A.; Tziavos, I.N.; Andersen, O.B.; Vergos, G.; Tripolitsiotis, A.; Zervakis, V.; Frantzis, X.; Partsinevelos, P. Altimetry, bathymetry and geoid variations at the Gavdos permanent Cal/Val facility. Adv. Space Res. 2012, 51, 1418–1437. [Google Scholar] [CrossRef]
  41. Mertikas, S.P.; Donlon, C.; Mavrocordatos, C.; Tziavos, I.N.; Galanakis, D.; Vergos, G.; Andersen, O.B.; Tripolitsiotis, A.; Frantzis, X. Gavdos/West Crete Cal-Val site: Over a decade calibration for Jason series, SARAL/AltiKa, Cryosat-2, Sentinel-3 and HY-2 altimeter satellites. In Proceedings of the ESA Living Planet Symposium Prague, Czech Republic, 9–13 May 2016. [Google Scholar]
  42. Cocard, M.; Banks, A.C.; Damianidis, K.; Drakopoulos, P.; Exertier, P.; Forsberg, R.; Forsberg, R.; Frantzis, X.; Gidskehaug, A.; Koutroulis, E.; et al. Airborne laser and gravity project for the altimeter calibration site Gavdos. In 27th European Geophysical Society General Assembly. 2002. Available online: http://adsabs.harvard.edu/abs/2002EGSGA..27.6236C (accessed on 25 September 2018).
  43. Olesen, A.V.; Tziavos, I.N.; Forsberg, R. New airborne gravity data around Crete—First results from CAATER campaign. In Proceedings of the 3rd Meeting of the International Gravity and Geoid Commission, Thessaloniki, Greece, 26–30 August 2002; Tziavos, I.N., Ed.; Available online: https://goo.gl/Cnjap8 (accessed on 25 September 2018).
  44. Vergos, G.S.; Tziavos, I.N.; Andritsanos, V.D. Gravity database generation and geoid model estimation using heterogeneous data. In Gravity Geoid and Space Missions; Jekeli, C., Bastos, L., Fernandes, J., Eds.; IAG Symp. 129; Springer: Berlin/Heidelberg, Germany, 2005; pp. 155–160. [Google Scholar]
  45. Pavlis, E.C.; Mertikas, S.P. The GAVDOS mean sea level and altimeter calibration facility: Results for Jason-1. Mar. Geod. 2004, 27, 631–655. [Google Scholar] [CrossRef]
  46. Mertikas, S.P.; Daskalakis, A.; Tziavos, I.N.; Vergos, G.S.; Frantzis, X.; Tripolitsiotis, A.; Partsinevelos, P.; Andrikopoulos, D.; Zervakis, V. Ascending and Descending Passes for the Determination of the Altimeter Bias of Jason Satellites using the Gavdos Facility. Mar. Geod. 2001, 34, 2011. [Google Scholar] [CrossRef]
  47. OSTST. Report of the Ocean Surface Topography Science Team Meeting, Boulder, CO, USA, 8–11 October 2013; Willis, J., Bonnefond, P., Eds. Available online: http://www.aviso.altimetry.fr/fileadmin/documents/OSTST/2013/oral/OSTST_2013_Meeting_Report.pdf (accessed on 25 September 2018).
  48. OSTST. Report of the Ocean Surface Topography Science Team Meeting, Lake Constance, Germany, 28–31 October 2014; Bonnefond, P., Willis, J., Eds. Available online: http://www.aviso.altimetry.fr/fileadmin/documents/OSTST/2014/OSTST_2014_Meeting_Report.pdf (accessed on 25 September 2018).
  49. OSTST. Report of the Ocean Surface Topography Science Team Meeting, Reston, VA, USA, 19–23 October 2015; Bonnefond, P., Willis, J., Eds. Available online: http://www.aviso.altimetry.fr/fileadmin/documents/OSTST/OSTST_2015_Meeting_Report.pdf (accessed on 25 September 2018).
  50. Donlon, C. Fiducial Reference Measurements for Altimetry. FRM4ALT Project Web Portal. Available online: https://goo.gl/Yn23pQ (accessed on 26 June 2018).
  51. Mertikas, S.P.; Donlon, C.; Femenias, P.; Cullen, R.; Galanakis, D.; Frantzis, X.; Tripolitsiotis, A. Fiducial Reference Measurements for Satellite Altimetry Calibration: The Constituents. In International Altimetry Cal/Val Review & Applications; International Association of Geodesy Symposia; Springer: Basel, Switzerland, 2018; under review. [Google Scholar]
  52. Mertikas, S.P.; Donlon, C.; Femenias, P.; Mavrocordatos, C.; Galanakis, D.; Guinle, T.; Boy, F.; Tripolitsiotis, A.; Frantzis, X.; Tziavos, I.N.; et al. Fiducial Reference Measurements for Satellite Altimetry Calibration: The Constituents. In International Altimetry Cal/Val Review & Applications; International Association of Geodesy Symposia; Springer: Basel, Switzerland, 2018; under review. [Google Scholar]
  53. Mertikas, S.P.; Daskalakis, A.; Tziavos, I.N.; Vergos, G.; Frantzis, X.; Tripolitsiotis, A. First calibration results for the SARAL/AltiKa altimetric mission using the Gavdos permanent facilities. Mar. Geod. 2015, 38, 249–259. [Google Scholar] [CrossRef]
  54. Pires, N.; Fernades, J.F.; Gommenginger, C.; Scharroo, R. A conceptually simple modeling approach for Jason-1 sea state bias correction based on 3 parameter exclusively derived from altimetric information. Remote Sens. 2016, 8, 576. [Google Scholar] [CrossRef]
  55. Denys, P.; Birks, A.; Cross, P.; Powell, J.; Bürki, B. Transponder altimetry: Precise height measurements over land. J. Geophys. Res. 1995, 100, 24347–24359. [Google Scholar] [CrossRef]
  56. Birks, A.R. Radar Altimeter Calibration Using Ground Based Transponders. In Proceedings of the Envisat Symposium, ESA SP-636, Montreux, Switzerland, 23–27 April 2007; pp. 23–27. [Google Scholar]
  57. Powell, R.J. Relative vertical positioning using ground-level transponders with the ERS-1 altimeter. IEEE Trans. Geosci. Remote Sens. 1986, 24. [Google Scholar] [CrossRef]
  58. Pesec, P.; Sunkel, H.; Fachbach, N. Transponders for Altimeter Calibration and Height Transfer. VGI Osterreichische Zeitschrift für Vermessung und Geoinformation 1996, 84, 252–256. [Google Scholar]
  59. Cristea, E.; Moore, P. Altimeter bias determination using two years of transponder observations. In Proceedings of the Envisat Symposium, ESA SP-636, Montreux, Switzerland, 23–27 April 2007; Lacoste, H., Ouwehand, L., Eds.; ESA Publications Division, European Space Agency: Noordwijk, The Netherlands, 2007. [Google Scholar]
  60. Hausleitner, W.; Moser, F.; Desjonqueres, J.D.; Boy, F.; Picot, N.; Weingrill, J.; Mertikas, S.; Daskalakis, A. A New Method of Precise Jason-2 Altimeter Calibration Using a Microwave Transponder. Mar. Geod. 2012, 35, 337–362. [Google Scholar] [CrossRef]
  61. OSTST. Report of the Ocean Surface Topography Science Team Meeting, Miami, FL, USA, 23–27 October 2017; Willis, J., Bonnefond, P., Leulitte, E., Scharroo, R., Donlon, C., Eds. Available online: https://goo.gl/6yQr9t (accessed on 25 January 2018).
  62. BIPM. International Vocabulary of Metrology-Basic and General Concepts and Associated Terms (VIM), 3rd ed.; Bureau International des Poids et Mesures: Sevres, France, 2012. [Google Scholar]
  63. Mertikas, S.P.; Donlon, C.; Cullen, R.; Tripolitsiotis, A. Scientific and Operational Roadmap for Fiducial Reference Measurements in Satellite Altimetry Calibration and Validation. In International Altimetry Cal/Val Review & Applications; International Association of Geodesy Symposia; Springer: Basel, Switzerland, 2018; under review. [Google Scholar]
Figure 1. The sea-surface (Gavdos, CRS1, RDK1) and transponder (CDN1) Cal/Val sites of the Permanent Altimetry Calibration Facility along with the Operations Control Center at the Technical University of Crete in western Crete, Greece (a,b). The multi-mission, diverse Cal/Val service is illustrated by the ground-tracks of existing (Jason-3, Sentinel-3A, Sentinel-3B, and HY-2A), as well as future satellite altimetry missions (a). The CryoSat-2 satellite is also calibrated using either the CDN1 Cal/Val transponder site or the Gavdos Cal/Val site with sea-surface techniques.
Remotesensing 10 01557 g001
Figure 2. The initial motivation for the establishment of the Gavdos permanent altimeter calibration facility was that a crossover of Jason satellite (Pass No. 18 and No. 109) and adjacent to the Envisat Pass No. 571. (a) shows the crossover location of Jason over Gavdos island, and the adjacent Envisat ground track. (b) presents a general overview of the Jason and Sentinel-3 cross over locations over west Crete, along with the Chinese HY-2 ground tracks and associated crossover locations.
Remotesensing 10 01557 g002
Figure 3. (a) An aerial view of the Gavdos island. Photo was taken by the aircraft used for the airborne gravimetry in 2001. The initial setting at the Gavdos island at the “Karave” harbor in 1999 and the first installations of the tide gauge and GPS stations. The right photo shows where the “DIAS” mail Cal/Val site is located with respect to the harbor. (b) Installations of the first tide gauge and GPS site at the Gavdos harbor by NOAA (USA) personnel. The right picture shows the harsh conditions prevailing over that winter of 2001. (c,d) Depiction of the gradual evolution from a stainless-steel equipment box to a concrete housing structure for the equipment in the summer of 2001. (e) The present situation with the new jetty built at the Gavdos harbor and the old site, as well as the new site in relation to the harbor. The right photo is the DIAS Cal/Val site. (f) This is the DIAS location (cross over location of Jason satellites) in the south part of the island where the first transponder was set up in 2003.
Remotesensing 10 01557 g003aRemotesensing 10 01557 g003b
Figure 4. The operational status of the main instrumentation (tide gauges and GNSS receivers) at the Gavdos Cal/Val site as of 2004 till present.
Remotesensing 10 01557 g004
Figure 5. The current setup of the “Karave” Cal/Val site in Gavdos harbor for sea-surface calibrations.
Remotesensing 10 01557 g005
Figure 6. The UHF communications link with relay stations used to connect the Operations Control Center in Chania city, Crete, and Gavdos bypassing and going around the high mountains ridge, having an altitude of more than 2000 m. (a) shows the established network of installed UHF sites to link Gavdos Cal/Val with the central facility at the University in Chania city, Crete. (b) shows the final end-point UHF station in Gavdos, while (c) depicts the middle relay UHF station in Sougia.
Remotesensing 10 01557 g006
Figure 7. The Gavdos Cal/Val facility provides sea-surface calibration for the Jason series (Red: Pass No. 18-descending and No. 109-ascending), SARAL/AltiKa (Yellow: Pass No. 571) and Sentinel-3A (Green: Pass No. 14-descending and No. 335-ascending).
Remotesensing 10 01557 g007
Figure 8. The CRS1 Cal/Val site has been initially installed next to a GFO crossover (left) but later it has been used to calibrate the Chinese HY-2A altimeter (right).
Remotesensing 10 01557 g008
Figure 9. The CRS1 calibration facility has been operational since March 2008 (left). The (right-most) picture shows the established instruments at the site. The (upper) image shows an overview of the CRS1 site with the mountains in its background of West Crete. (Lower) images show the housing with is communication links and solar panels on its roof, its west view with the tide gauges as connected to sea, and the operating instrumentations inside this CRS1 Cal/Val site.
Remotesensing 10 01557 g009
Figure 10. The CRS1 Cal/Val facility is expected to provide calibration services for Sentinel-3A (Pass No. 278) and Sentinel-3B (Pass No. 14).
Remotesensing 10 01557 g010
Figure 11. The RDK1 Cal/Val site located exactly under the Jason ascending Pass No. 109 (lower left) and equipped with a radar tide gauge and a GNSS receiver (lower right). The site will be used not only for Jason calibration, but also for Sentinel-3A (Pass No. 335, descending, 9 km west) and for Sentinel-3B (Pass No. 71, ascending) (upper).
Remotesensing 10 01557 g011
Figure 12. The prototype transponder (left) built by the Technical University of Crete. It was fully characterized at the Compact Payload Test Range facilities in ESA/ESTEC, the Netherlands, for four months (March–July 2012) (right).
Remotesensing 10 01557 g012
Figure 13. (a) The site as is located on top of Crete mountains at an elevation of about 1000 m. (b) The initial setting of the CDN1 site as was inspected by ESA in June 2014 with no construction at that stage. (c) The site as it exists today and fully operational for transponder calibrations. (d) An overview of the site as seen in May 2017 from a higher altitude where groundtracks of Sentinal-3A and Sentinel-3B, as well as SWOT, are depicted. The red ground track extends south to Gavdos island where sea-surface calibrations complement and cross-examine the transponder Cal/Val results.
Remotesensing 10 01557 g013aRemotesensing 10 01557 g013b
Figure 14. Location of the geodetic GNSS network in support for the operations of the Permanent Altimeter Calibration Facility. Example photos of the permanent GNSS stations are from the MEN2 (lower right), SUG1 (Lower central), and SEL1 (Lower left) in western Crete. The (upper) images refer to CDN1 (upper right) and SUG1 sites.
Remotesensing 10 01557 g014aRemotesensing 10 01557 g014b
Figure 15. (Upper) The “TUC2” permanent GNSS station on University Campus. This has been the first Greek site to be part of the EUREF permanent network as of 2004. (Lower Left) The “TUC3” established in February 2013 as part of the EGNOS Resources Real Time Performance Array. (Lower Central and Right) The Chinese BeiDou station (UR240-CORS Receiver), called “TUC4”, installed on campus as of May 2012.
Remotesensing 10 01557 g015
Figure 16. The DORIS beacon (Left and central image) and system (right image) installed in Gavdos calibration facility. It was collocated with a GNSS receiver (Left image). This GAVB Doris station was decommissioned on 27 March 2014. A new installation is underway elsewhere in western Crete.
Remotesensing 10 01557 g016
Figure 17. Time variation of the zenith wet path delay as measured by GEOMOSS-I on 11 January 2003, at Rethymnon, Crete. (Upper left) image shows the results of wet troposphere delays as a function of time. (Upper right) images show a close view of this prototype GEOMOSS-I instrument and the (lower) image depicts the instrument set up on the roof of the building at the Institute of Mediterranean Studies in Rethymnon.
Remotesensing 10 01557 g017
Figure 18. The Data Center at the Technical University of Crete, where field observations, data archiving, and processing is carried out for the Cal/Val operations.
Remotesensing 10 01557 g018
Figure 19. The French Transportable Satellite Laser Ranging System in 2003 collocated with the TUC2 GNSS site on the University Campus, Chania, Crete, Greece. This laser facility conducts laser measurements between the facility and the satellite radar altimeter. It is only a 350 kg unit, which transmits laser pulses with an energy of 20 mJ at a frequency of 10 Hz through a telescope of 13 cm in diameter.
Remotesensing 10 01557 g019
Figure 20. The “SLR2” site was constructed next to the “TUC3” EGNOS site (left) on the University Campus as a temporary location for testing and evaluation of the transponder (right) before its final deployment at “CDN1” on the mountains of West Crete.
Remotesensing 10 01557 g020
Figure 21. Cryosat-2 SAR raw waveforms during 10 May 2013 (left), and 14 May 2014 (right), of transponder calibration at the SLR2 site on the University Campus. The approximate distance between the satellite and the transponder was 236 m and 1100 m, respectively, for those two calibrations.
Remotesensing 10 01557 g021
Figure 22. GPS buoy experiment conducted in the coast of Crete: (left) the boat track, and (right) a floating buoy with its GPS dragged by the ship.
Remotesensing 10 01557 g022
Figure 23. (Left) Airborne surveys have been conducted in PFAC using a DeHavilland Twin-Otter aircraft owned by the Swiss Federal Office of Topography (a) equipped with an array of four GPS receivers, (b) an inertial measuring unit, (c) an Optec Laser profiler sensor, and (d) a LaCoste Romberg Sea/Air-gravimeter (University of Bergen, Norway. (Right) The locations of observations made for conductivity, temperature, and density around the Gavdos made via the research vessel “Philia” of the Hellenic Center for Marine Research.
Remotesensing 10 01557 g023
Figure 24. Altimeter biases for Jason-1 (a,b), Jason-2 (c,d), and Jason-3 (e,f) along descending and ascending orbits over the sea surface around Gavdos Island.
Remotesensing 10 01557 g024aRemotesensing 10 01557 g024b
Figure 25. Altimeter bias for the Chinese HY-2A mission based on the CRS1 Cal/Val site, with its descending pass No. 280, west of Crete, Cycles: 23–98, I-GDR products. It seems that the HY-2A exhibits a linear trend on its bias values starting from +60 cm and going down about the same value with an opposite sign (i.e., −60 cm) at the last cycle No. 98.
Remotesensing 10 01557 g025
Figure 26. Transponder signal responses for Jason-2 (lower left), Jason-3, CryoSat-2 (upper), and Sentinel-3A (lower right) at different calibration dates.
Remotesensing 10 01557 g026
Figure 27. (Top) Jason-2 range biases determined by the CDN1 transponder Cal/Val, for Cycles 267–303. The mean value does not include Cycles 285–290. During March–May 2016, there had been a malfunction in the meteorological sensors and no reliable atmospheric delays had been determined. Delays were based solely on models for that period. Results are in cm. (Bottom) The boxplot of the Jason-2 range bias. Values are symmetrical around the central location value (mean, red horizontal line). The higher and lower horizontal box lines represent the 75th and 25th percentiles, respectively. The outer limits of the boxplot represent maximum and minimum values.
Remotesensing 10 01557 g027
Figure 28. Jason-2 SSH biases derived using the Gavdos Cal/Val for Cycles 265–303 with GDR-D data products. Results are shown in cm.
Remotesensing 10 01557 g028
Figure 29. (Top) Range bias results with the transponder at the CDN1 Cal/Val site in West Crete for Jason-3 and for the descending orbit No. 18 with SGDR-D products. (Bottom) The boxplot of the Jason-3 range bias. It appears that the values are symmetrical around the central location value (mean = +0.76 cm, red horizontal line). The higher and lower horizontal box lines represent 75th and 25th percentiles, respectively. The outer limits of the boxplot represent maximum and minimum values.
Remotesensing 10 01557 g029
Figure 30. Range bias results for Jason-3 with respect to Jason-2 over their tandem mission with the transponder at the CDN1 Cal/Val site in western Crete. The SGDR-D and Level-2 data products have been used for the descending orbit No. 18.
Remotesensing 10 01557 g030
Figure 31. Bias results with sea-surface techniques at the Gavdos Cal/Val site for Jason-3 with respect to Jason-2 over their tandem mission (28 March 2016, to 23 September 2016). Jason-2 seems to observe heights for the sea surface higher than those of Jason-3 by +2.66 cm. Results were based on very few data points (only 16 data values for their difference). The GDR-D products have been used for this for descending orbit No. 18 only.
Remotesensing 10 01557 g031
Figure 32. Bias results with sea-surface techniques at the Gavdos Cal/Val site for Jason-3 with respect to Jason-2 over the ascending orbit No. 109 (18 February 2016, to 18 August 2016) (16 data values).
Remotesensing 10 01557 g032
Figure 33. Bias profiles of Jason-3 and Jason-2 with values determined from a 300 m running median window with respect to distance from the point of closest approach. Altimeters’ profiles are along the descending Pass No. 18 and south of Gavdos Cal/Val.
Remotesensing 10 01557 g033
Figure 34. The almost simultaneous pass of Sentinel-3A (ascending) and Jason-3 (descending) over the transponder CDN1 Cal/Val site on 11 November 2016. Sentinel-3A passed at 20:00:12 UTC, while Jason-3 followed at 20:00:36 UTC over the CDN1 Cal/Val site, separated by only 24 s. The same conditions and observation site settings existed for both satellites.
Remotesensing 10 01557 g034
Figure 35. (Upper) The ground tracks of SARAL/AltiKa Pass No. 571 (yellow) and Jason-2 Pass No. 109 (red) (both ascending) converge at a point of about 4 km south of the Gavdos Island, Greece coast (left). The sea-surface heights as measured by these two altimetric missions within a time window of less than 3 days (right). Results indicate that SARAL/AltiKa always measures sea surface heights smaller than Jason-2. (Middle) Analysis of the sea-surface heights as estimated by HY-2A and Jason-2 at a crossover point north of Crete. Left image shows the cross over location at Northwest of Crete and the right image portrays the results for each Jason-2 and HY-2A satellite for the sea surface heights. (Lower) Analysis of the sea-surface heights as estimated by the Sentinel-3A and Jason-3 altimeters at the crossover location south of Gavdos. Left lower image shows the cross over location south of Gavdos and the right image portrays differences of Sentinel-3A with respect to Jason03.The results are given with respect to the Jason-3 reference mission. The numbers in the textbox indicate the value of the SWH, and the following number shows time separation of both passes. Black circles mean a crossover on almost the same day, and red star means a crossover time difference more than 2 days. The standard deviation for the produced mean (i.e., S3A-JA3) is ±8 cm.
Remotesensing 10 01557 g035
Figure 36. A synoptic presentation of all derived biases and their distribution for Jason-1, Jason-2, Jason-3, and Sentinel-3A with box plot diagrams. These two satellites have been calibrated and compared with sea-surface and transponder calibrations at different locations, instrumentation and procedures.
Remotesensing 10 01557 g036
Table 1. The expected root mean square (RMS) of sea surface height (SSH) and altimeter noise measurements obtained by satellite altimetry.
Altimetric MissionSpecifications for Sea-Surface Height Actual SSHSpecifications for Altimeter Actual Altimeter Noise
Jason-2 and Jason-3±3.4 cm±2.5 cm±1.7 cm±1.5 cm
SARAL/AltiKa±3.2 cm±3.2 cm ±1.5 cm ±1.0 cm
HY-2A±10 cm±5.0 cm±4 cm±2 cm
Sentinel-3A±2.94 cm±3.0–5.0 cm±1.3 cm±3.0 cm
Table 2. Coordinates and uncertainties (weighted root mean square error) for 11 GNSS stations in western Crete from the established monitoring network in support of the Permanent Altimeter Calibration Facility (ITRF 2008).
SiteLatitude
(Deg)
Longitude
(Deg)
Ell.Height
(m)
σ(lat) (mm)σ(lon) (mm)σ(h)
(mm)
Time Span
(Years)
CDN0N 35 20 16.024403E 23 46 46.8546491049.51831.92.57.62014.49–2018.44
CDN2N 35 20 16.291142E 23 46 46.8291871050.40801.71.98.02016.40–2018.44
CRS1N 35 18 12.649002E 23 31 17.26395521.20752.01.85.42008.18–2018.44
GVD0N 34 50 18.578282E 24 6 31.908077123.87192.21.65.62003.04–2017.35
GVD7N 34 50 52.744567E 24 7 11.20565520.16851.51.85.82009.37–2018.44
GVD8N 34 50 52.612206E 24 7 11.39922322.27571.61.96.22010.50–2018.44
IMS1N 35 22 12.547506E 24 28 20.98268135.91381.81.65.02010.19–2015.19
MEN2N 35 40 12.897887E 23 44 26.308798265.70642.93.15.92013.26–2018.25
RDK1N 35 11 15.375737E 24 19 6.53969925.53373.71.99.02009.18–2017.44
SELIN 35 21 14.334437E 23 50 22.3054071038.06931.92.14.72009.52–2013.80
TUC2N 35 31 59.482697E 24 4 14.015013160.88942.01.94.62004.47–2018.44
Table 3. Velocities and uncertainties (weighted root mean square error) for 14 GNSS stations in western Crete from the established monitoring network in support of the Permanent Altimeter Calibration Facility. (ITRF 2008).
SitevN
(m/Year)
vE
(m/Year)
vUP
(m/Year)
σvN
(m)
σvE
(m)
σvUP
(m)
Time Span
(Years)
CDN0−0.01290.00920.00090.00030.00050.00152014.49–2018.44
CDN2−0.01290.00630.00020.00070.00060.00362016.40–2018.44
CRS1−0.01240.0068−0.00110.00020.00010.00032008.18–2018.44
GVD0−0.01280.00810.00000.00020.00010.00042003.04–2017.35
GVD7−0.01380.0086−0.00040.00010.00020.00052009.37–2018.44
GVD8−0.01430.0082−0.00070.00020.00020.00072010.50–2018.44
IMS1−0.01310.0078−0.00040.00020.00020.00062010.19–2015.19
MEN2−0.01460.0058−0.00010.00050.00050.00072013.26–2018.25
RDK1−0.01280.00810.00100.00040.00020.00092009.18–2017.44
SELI−0.01120.0077−0.00100.00040.00050.00092009.52–2013.80
TUC2−0.01240.0075−0.00060.00010.00010.00022004.47–2018.44
Table 4. Absolute calibration results for Jason satellites based on sea-surface observations along the ascending pass No. 109 and the descending pass No. 18 at the Gavdos Cal/Val facility.
SatelliteJason-1Jason-2Jason-3
ProductGDR-EGDR-DGDR-D
Cycles70–1002–3031–80
SSH biasPass No. 18, Descending+4.70 cm (±1.3 cm)+ 0.63 cm (±0.3 cm)−0.74 cm (±0.4 cm)
Pass No. 109 Ascending+3.50 cm (±1.3 cm)+0.33 cm (±0.2 cm)−0.50 cm (±0.4 cm)
Average+4.10 cm+0.48 cm−0.62 cm
Table 5. A concise presentation of absolute calibration results for Jason-1, Jason-2, Jason-3, Sentinel-3A, and HY-2A satellites based on sea-surface and transponder measurements at Gavdos and western Crete Cal/Val facilities.
SSH Bias (cm)SatelliteJason-1Jason-2Jason-3JA3 − JA2 Offset
ProductGDR-EGDR-DGDR-D
Cycles70–1002–3031–80
No. 18 (descending)+4.7 cm ± 1.3 cm+0.63 cm ± 0.3 cm−0.74 cm ± 0.4 cm−1.37 cm
No. 109 (ascending) +3.5 cm ± 1.3 cm+0.33 cm ± 0.2 cm−0.50 cm ± 0.4 cm−0.83 cm
Average Bias+4.10 cm +0.48 cm−0.62 cm
Tandem Bias (cm)SatelliteJason-2Jason-3JA3 − JA2 Offset
ProductGDR-D/SGDR-DGDR-D/SGDR-D
Cycles285–3035–23
Sea-Surface HeightNo.18 (descending)+2.70 cm ± 0.9 cm+0.27 cm ± 0.9 cm−2.43 cm
No. 109 (ascending)+1.62 cm ± 0.9 cm−0.98 cm ± 0.9 cm−2.60 cm
TransponderNo. 18 (descending)−0.40 cm ± 0.6 cm+1.30 cm ± 0.5 cm+1.70 cm
Range BiasSatelliteJason-2Jason-3JA3 − JA2 Offset
ProductSGDR-D GDR-D
Cycles267–303 1–80
TransponderDescending −1.20 cm ± 0.6 cm+0.76 cm ± 0.4 cm+1.96 cm
Table 6. Uncertainty budget analysis for the sea-surface calibration methodology.
Standard UncertaintyUncertainty EstimatesDivisorStandardized UncertaintySensitivity CoefficientUncertainty ComponentDegrees of Freedom
GPS Height Processing0.14 mm10.14 mm10.14 mm1759
GPS Receiver Manufacturer 6.0 mm 3 3.5 mm13.5 mm50
GPS Antenna Reference Point, Lab Calibration2.0 mm 12.0 mm12.0 mm
Water Level Observations1.3 mm 11.3 mm1 1.3 mm19
Tide Gauge Zero Offset5.0 mm 3 2.9 mm1 2.9 mm2
Tide Gauge Vertical Misalignment2.4 mm 3 1.4 mm11.4 mm50
Tide Gauge Calibration Certificate5.5 mm15.5 mm15.5 mm
Spirit Levelling0.13 mm10.13 mm10.13 mm15
GNSS and Tide Gauge Thermal Expansion1.1 mm 3 0.6 mm10.6 mm50
Spirit Levelling Target Misalignment1.0 mm 3 0.6 mm10.6 mm50
Observer’s Experience1.0 mm 3 0.6 mm10.6 mm50
Spirit Levelling Instrument1.0 mm 3 0.6 mm10.6 mm
Water Level at Tide Pole1.0 mm 3 0.6 mm10.6 mm
MSS/Geoid Models5.8 mm15.8 mm15.8 mm8
Cal/Val Processing and Transformations0.5 mm 3 0.3 mm10.3 mm50
Geoid Slope10.0 mm 3 5.8 mm15.8 mm50
Unaccounted Uncertainty50.00 mm 3 28 mm128 mm50
Root Sum Square52 mm 31.0 mm131 mm50

