Article

Vegetation Phenology Driving Error Variation in Digital Aerial Photogrammetrically Derived Terrain Models

by
Tristan R.H. Goodbody
1,*,
Nicholas C. Coops
1,
Txomin Hermosilla
1,
Piotr Tompalski
1 and
Gaetan Pelletier
2
1
Faculty of Forestry, University of British Columbia, 2424 Main Mall, Vancouver, BC V6T 1Z4, Canada
2
Northern Hardwoods Research Institute Inc. 165, Boulevard Hébert, Edmundston, NB E3V 2S8, Canada
*
Author to whom correspondence should be addressed.
Remote Sens. 2018, 10(10), 1554; https://doi.org/10.3390/rs10101554
Submission received: 22 August 2018 / Revised: 19 September 2018 / Accepted: 21 September 2018 / Published: 27 September 2018
(This article belongs to the Special Issue Aerial and Near-Field Remote Sensing Developments in Forestry)

Abstract

:
Digital aerial photogrammetry (DAP) and unmanned aerial systems (UAS) have emerged as synergistic technologies capable of enhancing forest inventory information. A known limitation of DAP technology is its ability to derive terrain surfaces in areas with moderate to high vegetation coverage. In this study, we sought to investigate the influence of flight acquisition timing on the accuracy and coverage of digital terrain models (DTM) in a low cover forest area in New Brunswick, Canada. To do so, a multi-temporal UAS-acquired DAP data set was used. Acquired imagery was photogrammetrically processed to produce high quality DAP point clouds, from which DTMs were derived. Individual DTMs were evaluated for error using an airborne laser scanning (ALS)-derived DTM as a reference. Unobstructed road areas were used to validate DAP DTM error. Generalized additive mixed models (GAMM) were generated to assess the significance of acquisition timing on mean vegetation cover, DTM error, and proportional DAP coverage. GAMM models for mean vegetation cover and DTM error were found to be significantly influenced by acquisition date. A best available terrain pixel (BATP) compositing exercise was conducted to generate a best possible UAS DAP-derived DTM and outline the importance of flight acquisition timing. The BATP DTM yielded a mean error of −0.01 m. This study helps to show that the timing of DAP acquisitions can influence the accuracy and coverage of DTMs in low cover vegetation areas. These findings provide insight to improve future data set quality and provide a means for managers to cost-effectively derive high accuracy terrain models post-management activity.

1. Introduction

Enhancing forest inventories through the inclusion of structural data derived from three dimensional remote sensing technologies has shifted the paradigm of how forest mensuration and inventory management can be undertaken. Standardized methods of deriving directly comparable forest metrics, such as height and density, as well as extracting data with the ability to detail forest structure, have provided a means of establishing enhanced forest inventory (EFI) baselines [1,2], updating previously generated inventories through time [3], and extrapolating structural attributes using multi-data approaches [4,5,6,7]. The integration of these technologies into inventory systems has facilitated a technological and data-driven revolution in forest inventory management and ecology, providing data with the ability to support multi-scale planning and decision making. The adoption and implementation of these data into future inventories facilitates the need for research efforts to derive meaningful structural descriptors, as well as improve the ecological, economic, and social factors driving forest resources stewardship.
One actively researched technology capable of deriving structural attributes is digital aerial photogrammetry (DAP) [8,9]. With the ability to construct image-derived point clouds and ortho-imagery products for forestry and agricultural related inventory analyses, DAP technology has seen dramatic expansion in recent years [3,10,11]. The integration of photogrammetry in forest management is long standing, having been used for photo-interpretation of forest stands, land-cover delineation, and forest attribute estimations [12,13]. Relatively recent advancements in computer hardware and software have resulted in the wide-scale interdisciplinary adoption of digital photogrammetry for three-dimensional solutions. The use of digital stereo-imagery in combination with commercially available software packages has allowed researchers and managers to address forestry-related challenges, including how the technology can be used to characterize forest structure, and consequently provide reliable forest inventory data sets.
The use of DAP as an alternative to airborne laser scanning (ALS) data has facilitated cost-effective and accurate methods of enhancing forest inventory information at a variety of spatial scales [14,15,16]. DAP point cloud generation has proven effective for creating commonly used mapping products, such as digital surface models (DSMs) and digital terrain models (DTMs) under open stand conditions, and are capable of accurately estimating forest inventory attributes [17].
Technologies that are facilitating cost-effective and efficient DAP data acquisitions include unmanned aerial systems (UAS), otherwise known as unmanned aerial vehicles (UAV), or drones [11,18,19,20]. With rapid technological innovation and an equally rapid adoption into commercial markets, UAS and the wide range of compatible sensors have become a viable tool for the acquisition of high quality imagery and forest inventory data [21]. Major factors promoting their adoption, as well as DAP point cloud use in operational forest management, have been ease of use, propensity for high spatial and temporal resolution data sets, and low long-term capital costs [22,23,24]. Global challenges currently surrounding the further adoption and implementation of UAS in resource management settings include propulsion longevity, limiting their ability to efficiently cover extensive areas, as well as line-of-sight legislation [25]. The implementation of UAS is, however, well suited to improving managerial knowledge at a local operational scale, where they can be successful at updating previously acquired inventory data and establishing new inventory baselines [11,19,26,27].
The use of multi-temporal DAP data acquired from UAS capitalizes on their potential for high spatial and temporal resolution data. The use and incorporation of UAS to provide these benefits holds great promise for inventory updates and data fusion. The inherent potential of multi-temporal remote sensing data sets is well known [28,29,30,31] and innovations associated with free open access big-data libraries have facilitated more frequent time series analyses [32,33,34]. Trend analyses resulting from these data sets have been successful in outlining opportunities on how to improve upon traditional management strategies using results-based scientific foundations. Satellite-based remote sensing programs such as Landsat, Sentinel, or Moderate Resolution Imaging Spectroradiometer (MODIS) have shown that repeated acquisitions and increasing temporal resolution of acquisition programs are invaluable for detailing economic and social development, and are critical for effective, evidence-based environmental management and monitoring initiatives [35,36].
While UAS-derived imagery and DAP datasets have proven cost-effective and accurate for a variety of forest inventory information from single date acquisitions, limited research has been conducted relating DAP-derived forest structure descriptors and the timing or seasonality of their acquisitions. A fundamental requirement for using DAP in an inventory setting is an accurate DTM. The ability to derive high resolution DTMs from ALS data sets is well known [37,38], and has been integrated to normalize co-occurring DAP data [17,27]. This, however, requires previous ALS coverages, which are often not available, increasing overall inventory production costs. Studies analyzing the ability of conventionally and UAS-acquired DAP to provide accurate DTMs have found that their derivation are highly dependent on canopy cover [39,40], limiting the ability for DAP to characterize sub-canopy features. Recent inquiries into the potential to utilize multiple DAP acquisitions [41,42,43,44,45,46], as well as variations in sensor orientations [47,48], have also been conducted, indicating that flight repetition and sensor orientation variability can provide improved results compared with single acquisitions. Mirijovskỳ et al. [46] utilized UAS-acquired DAP-derived DTMs to analyze variations in the fluvial dynamics of a mid-mountain stream, and found that they were accurate and consistent at detailing stream bank shifts, as well as calculating changes and volumetric extent of bank erosion. These studies demonstrate the potential of incorporating multi-temporal DAP data sets for DTM generation and multi-temporal forest inventory analyses at an ultra-fine scale.
In this study, we conduct a multi-temporal UAS imagery analysis where DAP-derived DTMs in a low canopy cover forest area are compared to a reference ALS-derived DTM to examine how the timing of imagery acquisitions and seasonal changes in vegetation cover impact DAP-derived DTM error.

2. Materials and Methods
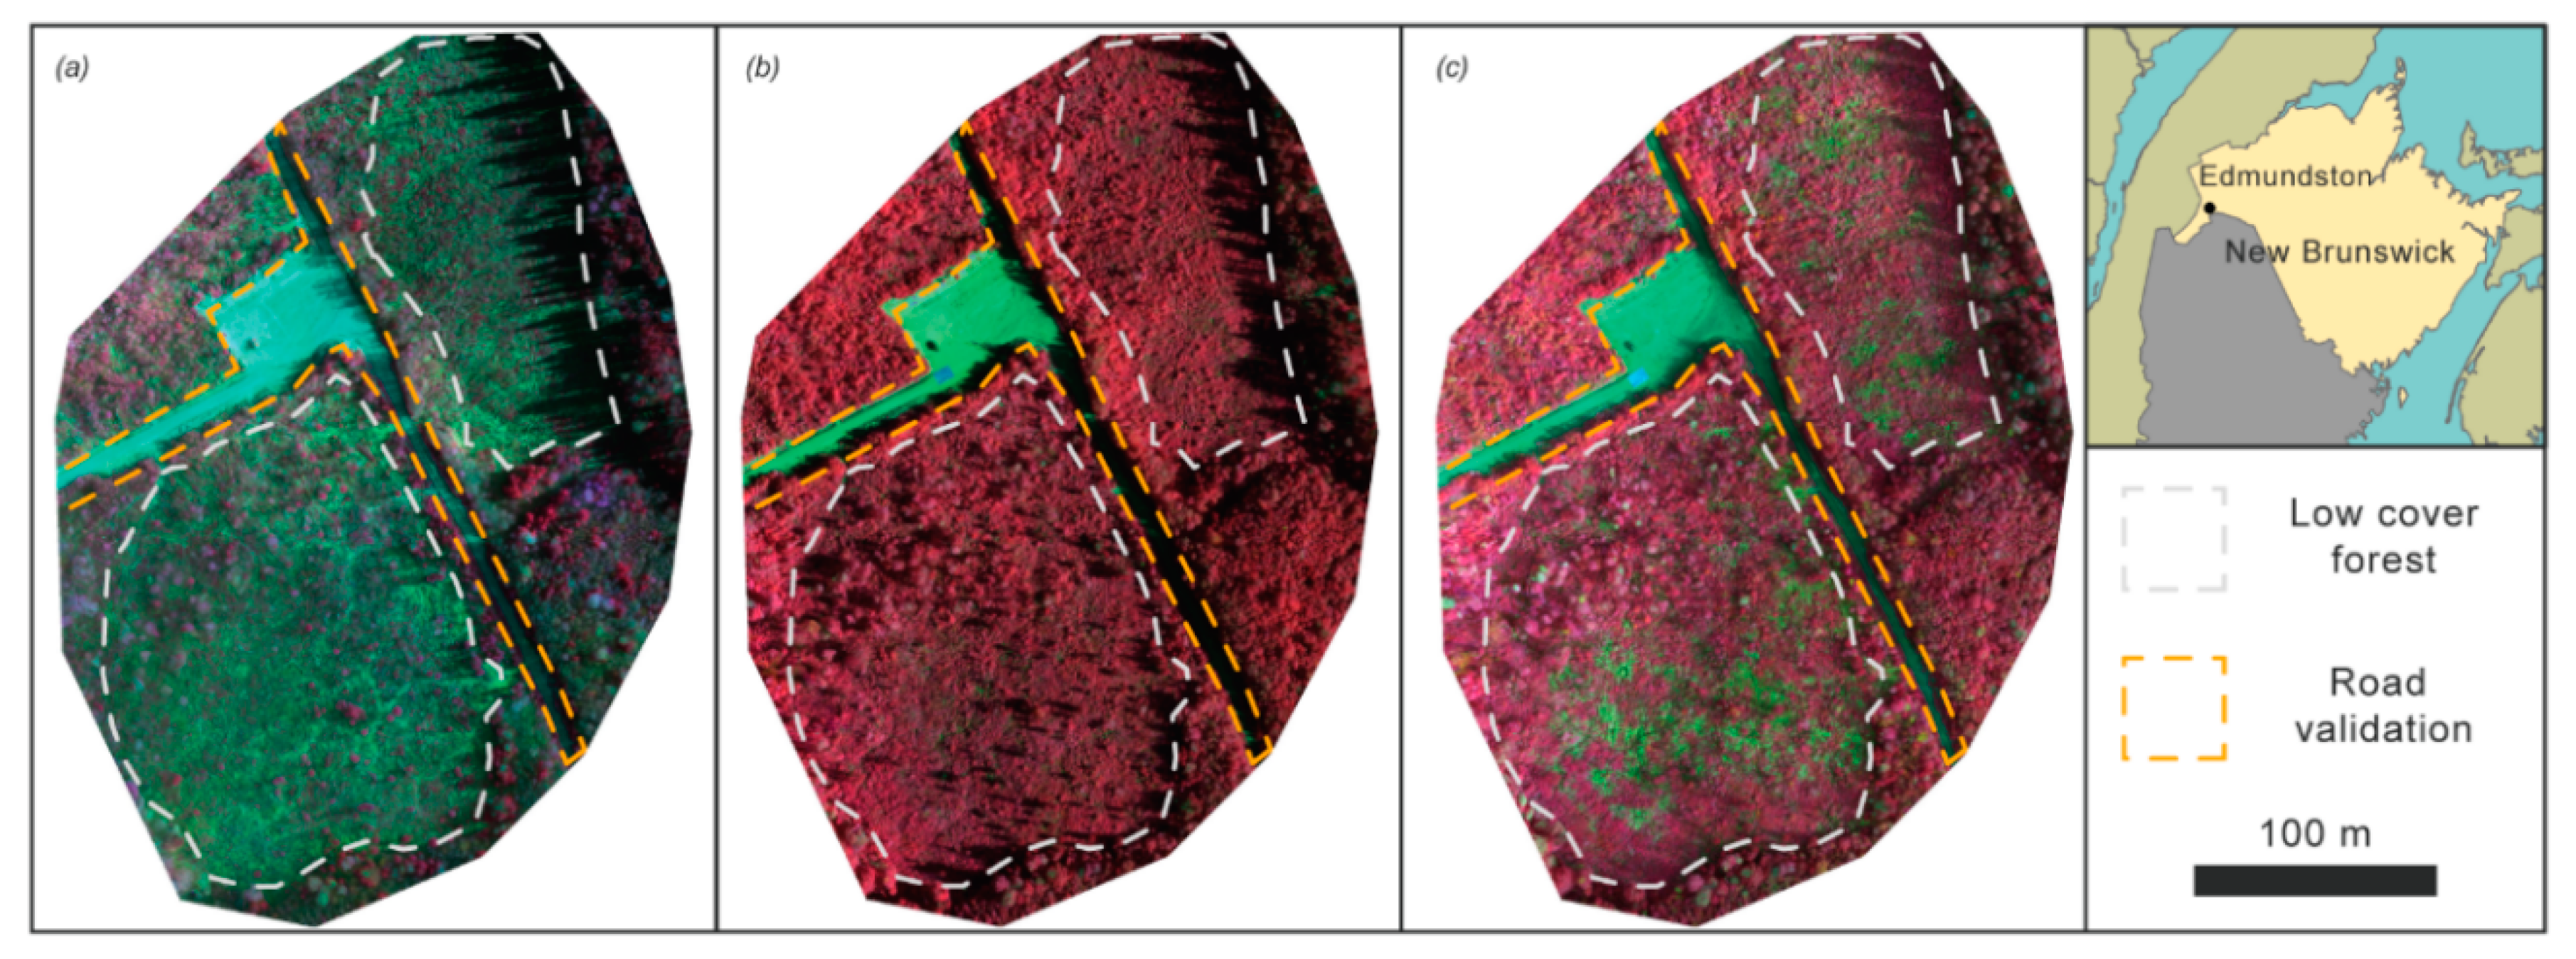
This study comprised three steps: photogrammetry processing, point cloud processing, and time series analysis. Figure 1 displays a conceptual workflow of the followed methodology. First, UAS imagery from 20 acquisitions were processed to generate photogrammetric point clouds. DAP point cloud outputs were then processed to generate DTM layers for each flight acquisition. Finally, a time series DTM analysis was conducted to determine error variability and its relationship with timing of imagery acquisitions. Summary error statistics were derived to outline error variability and illustrate the power of multi-temporal DAP data acquisitions, while a best available terrain pixel (BATP) compositing analysis, which helped to outline the importance of flight acquisition dates was conducted to produce a best possible multi-temporal DTM.

2.1. Study Area

The study area is located on a 25 ha forest stand north of Edmundston, New Brunswick, Canada (Figure 2). The site is located in the central uplands ecoregion, specifically the Madawaska eco-district (47°27′04.29′′ N 68°06′09.65′′ W). This region is over 90% forested and is characterized by gently rolling terrain with a largely southern aspect. Mean elevation is 323 m above sea level, receiving on average 475–525 mm of rain from May to September [49]. Forest cover in the region is predominantly hardwood dominated, comprised of sugar maple (Acer saccharum), yellow birch (Betula alleghaniensis), and beech (Fagus spp.). Scattered and pure softwood stands also exist, comprised of balsam-fir (Abies balsamea), as well as red (Picea rubens) and white spruce (Picea glauca) [49]. This area has a longstanding history of forest management from a variety of private, public, and research-based institutions [50]. The site itself is comprised of multi-age cohorts of balsam fir, red and white spruce, yellow birch, and sugar maple. Stem density was spatially variable with a mean of approximately 50 stems per hectare.

2.2. Data

Twenty imagery acquisitions using a senseFly eBee UAS with a Sequoia multi-spectral camera [51] with average along- and across-track overlaps of 85% and 80%, respectively. Imagery was acquired between September 2016 and December 2017 (Table 1). The Sequoia is comprised of four monochrome sensors (green: 530–570 nm, red: 640–680 nm, red edge: 730–740 nm, and near-infrared: 770–810 nm), a true colour composite sensor, and an external sunlight sensor placed on top of the UAS to capture sun angle and irradiance for each image during flights [52]. Acquisitions followed a standardized procedure, where images of radiometric targets were taken prior to aerial imaging missions, and a systematic gridded flight pattern was used for efficient imagery capture. Table 1 provides details related to individual flights, as well as DAP point density following image post-processing. Kruskall–Wallis rank sum tests were performed on mean flight elevation and mean ground sample distance to determine whether there were significant differences amongst imagery acquisition parameters. Flight acquisitions took place when no snow coverage was present, except for 4 December 2017 (day of year: 338), where snow coverage was negligible.
A reference ALS data set with an average density of 18.5 points m-2 was used. The ALS data were acquired by the Government of New Brunswick as a part of their province-wide 2017 ALS acquisition campaign. Acquisition of ALS data over the study area was conducted between 12 June 2017 and 13 June 2017.

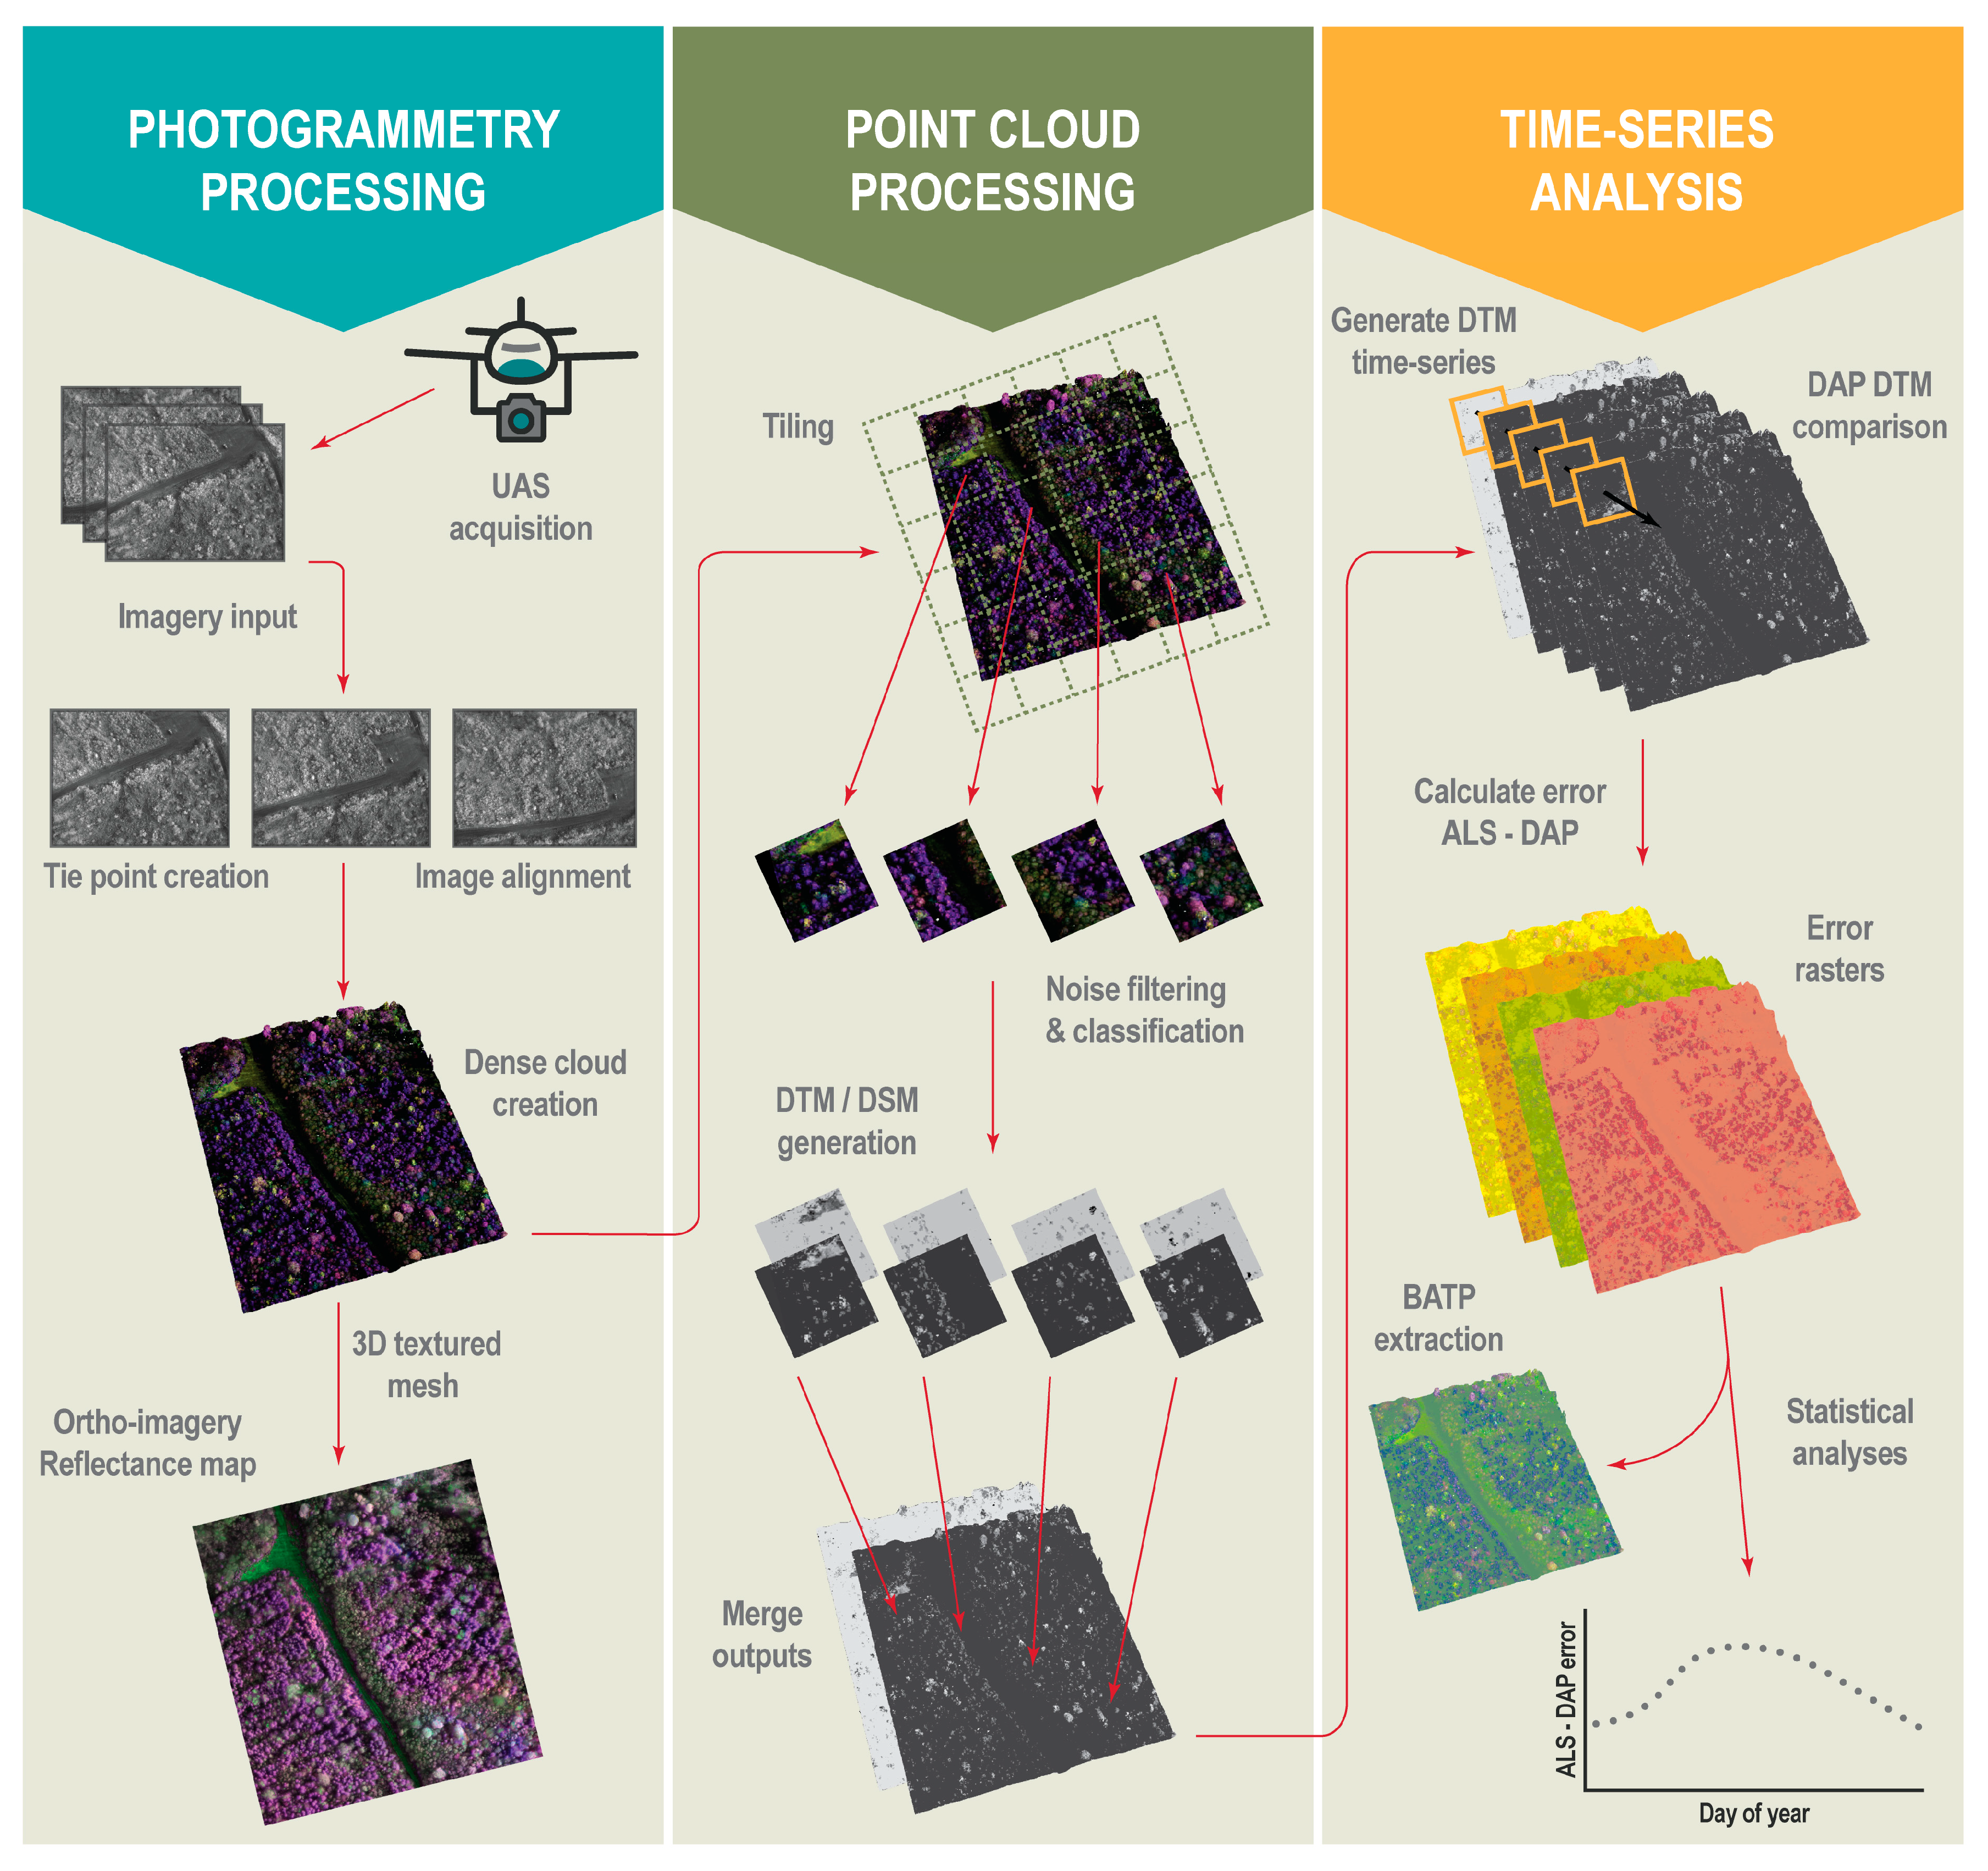
2.3. Photogrammetric Processing

UAS-acquired multi-spectral imagery was photogrammetrically processed to produce dense point cloud products using Agisoft Photoscan [53]. Images were aligned, radiometrically calibrated using pre-flight target images, and optimized using inertial measurement unit and GNSS/GPS measurements. Following imagery alignment, conjugate tie-points between image pixels were then generated for locations with two or more overlapping images. Dense point cloud processing was then conducted at the original image scale to produce high quality and density point cloud outputs. Point cloud products were exported following densification for point cloud processing. Ortho-imagery for each flight acquisition were generated and exported as auxiliary datasets.

2.4. Point Cloud Processing

In order to derive accurate DTM information from each point cloud, multi-temporal DAP and the reference point clouds were processed using LAStools [11,54]. Raw point clouds were first tiled using “lastile” (parameters: tile_size = 50, buffer = 25) and filtered to remove noise using “lasnoise” (parameters: step_z = 1, isolated = 10). Points were then classified into ground or non-ground classes using the progressive triangulated irregular network (TIN) densification algorithm implemented in “lasground” (parameters: step = 10 m, bulge = 0.05), which gradually removes non-ground points based on elevation differences and angles to the nearest TIN section to iteratively estimate ground surface [40,54,55]. The ALS point cloud was used to co-register DAP point clouds using the iterative closest point (ICP) algorithm [56]. ICP alignment was used rather than ground control targets because of a lack of target data for each flight acquisition. Classified and co-registered point clouds were then used to generate 0.5 m DTM layers using the “las2dem” (parameters: step = 0.5, kill = 2) [54] algorithm. A 2 m interpolation distance was used for DAP-derived DTMs to limit potential interpolation error. Errors between the reference DTM and DAP-derived DTMs for each flight acquisition were computed at the pixel level and then aggregated for the area of analysis.
A 15 cm height threshold was used to compute vegetation cover (proportion of points above threshold) at 2 m resolution for each DAP point cloud to capture seasonal variability and enable potential linkages between DTM error and above ground vegetation cover. The road within the study area (Figure 2) was used to validate the accuracy of the DAP-derived DTMs without the influence of vegetation or obstruction. Statistical error summaries for the mean, standard deviation, and range of error were computed for each acquisition. Proportional coverages of the DAP-derived DTMs compared with the ALS ground truth were calculated to outline whether image acquisition timing had an influence on overall DAP-derived DTM coverage and error.

2.5. Time Series Analysis

2.5.1. Generalized Additive Mixed Models

Mean vegetation cover, mean error, and proportional DAP-derived DTM coverage were summarized and related to the acquisition day of year using generalized additive mixed models (GAMM) built in the ‘MGCV’ package [57,58]. The GAMM was chosen because of its proven ability to detect and describe whether a trend exists between two variables, and if so, its linear or non-linear shape [58,59]. These models are well suited for analyzing the functional relationship between variables within a single-case design such as the DTM error in a single location over time [58]. Single case designs, such as the study area used in this analysis, serve as their own control, allowing for the effective evaluation of changes over time. The key advantage of these models over other conventionally applied parametric regression methods is that the researcher does not need to know the models functional form a priori, which is performed by the model internally. Given that the form is rarely known a priori with confidence, GAMMs provide a means to solve this problem in a statistically sound manner by utilizing cubic regression splines to estimate nonlinear associations between dependent and independent variables [59,60]. For further inquiry, Shadish et al. [58] provide an in-depth overview of the application of GAMMs. To account for potential variation, the year of imagery acquisition was incorporated as a random factor. Individual models (Equation 1) were constructed with a smoothing term between the day of year of imagery acquisition and the mean error, mean vegetation cover, and proportional DAP-derived DTM coverage. Models were assessed by the significance of the smoothing term (p > 0.05), which were internally chosen using restricted maximum likelihood [57,58].
  x i = α + f 1 ( D a y   o f   y e a r ) i ×   f 2 ( x ) i + ε i  
where x is either mean vegetation cover, mean error, or proportional DAP-derived DTM coverage; α is the intercept; f 1 and f 2 are spline functions; and ε represents the model error term.

2.5.2. Best Available Terrain Pixel Compositing

A best available terrain pixel (BATP) composite was generated using DTM error rasters. To do so, an iterative algorithm was created, which incorporated all available DTM error rasters to select minimum error pixels. These pixels, with reference to the day of year of imagery acquisition, were labelled as the BATPs. This process produced the best possible DAP-derived DTM, error map, and acquisition donor composites.

3. Results

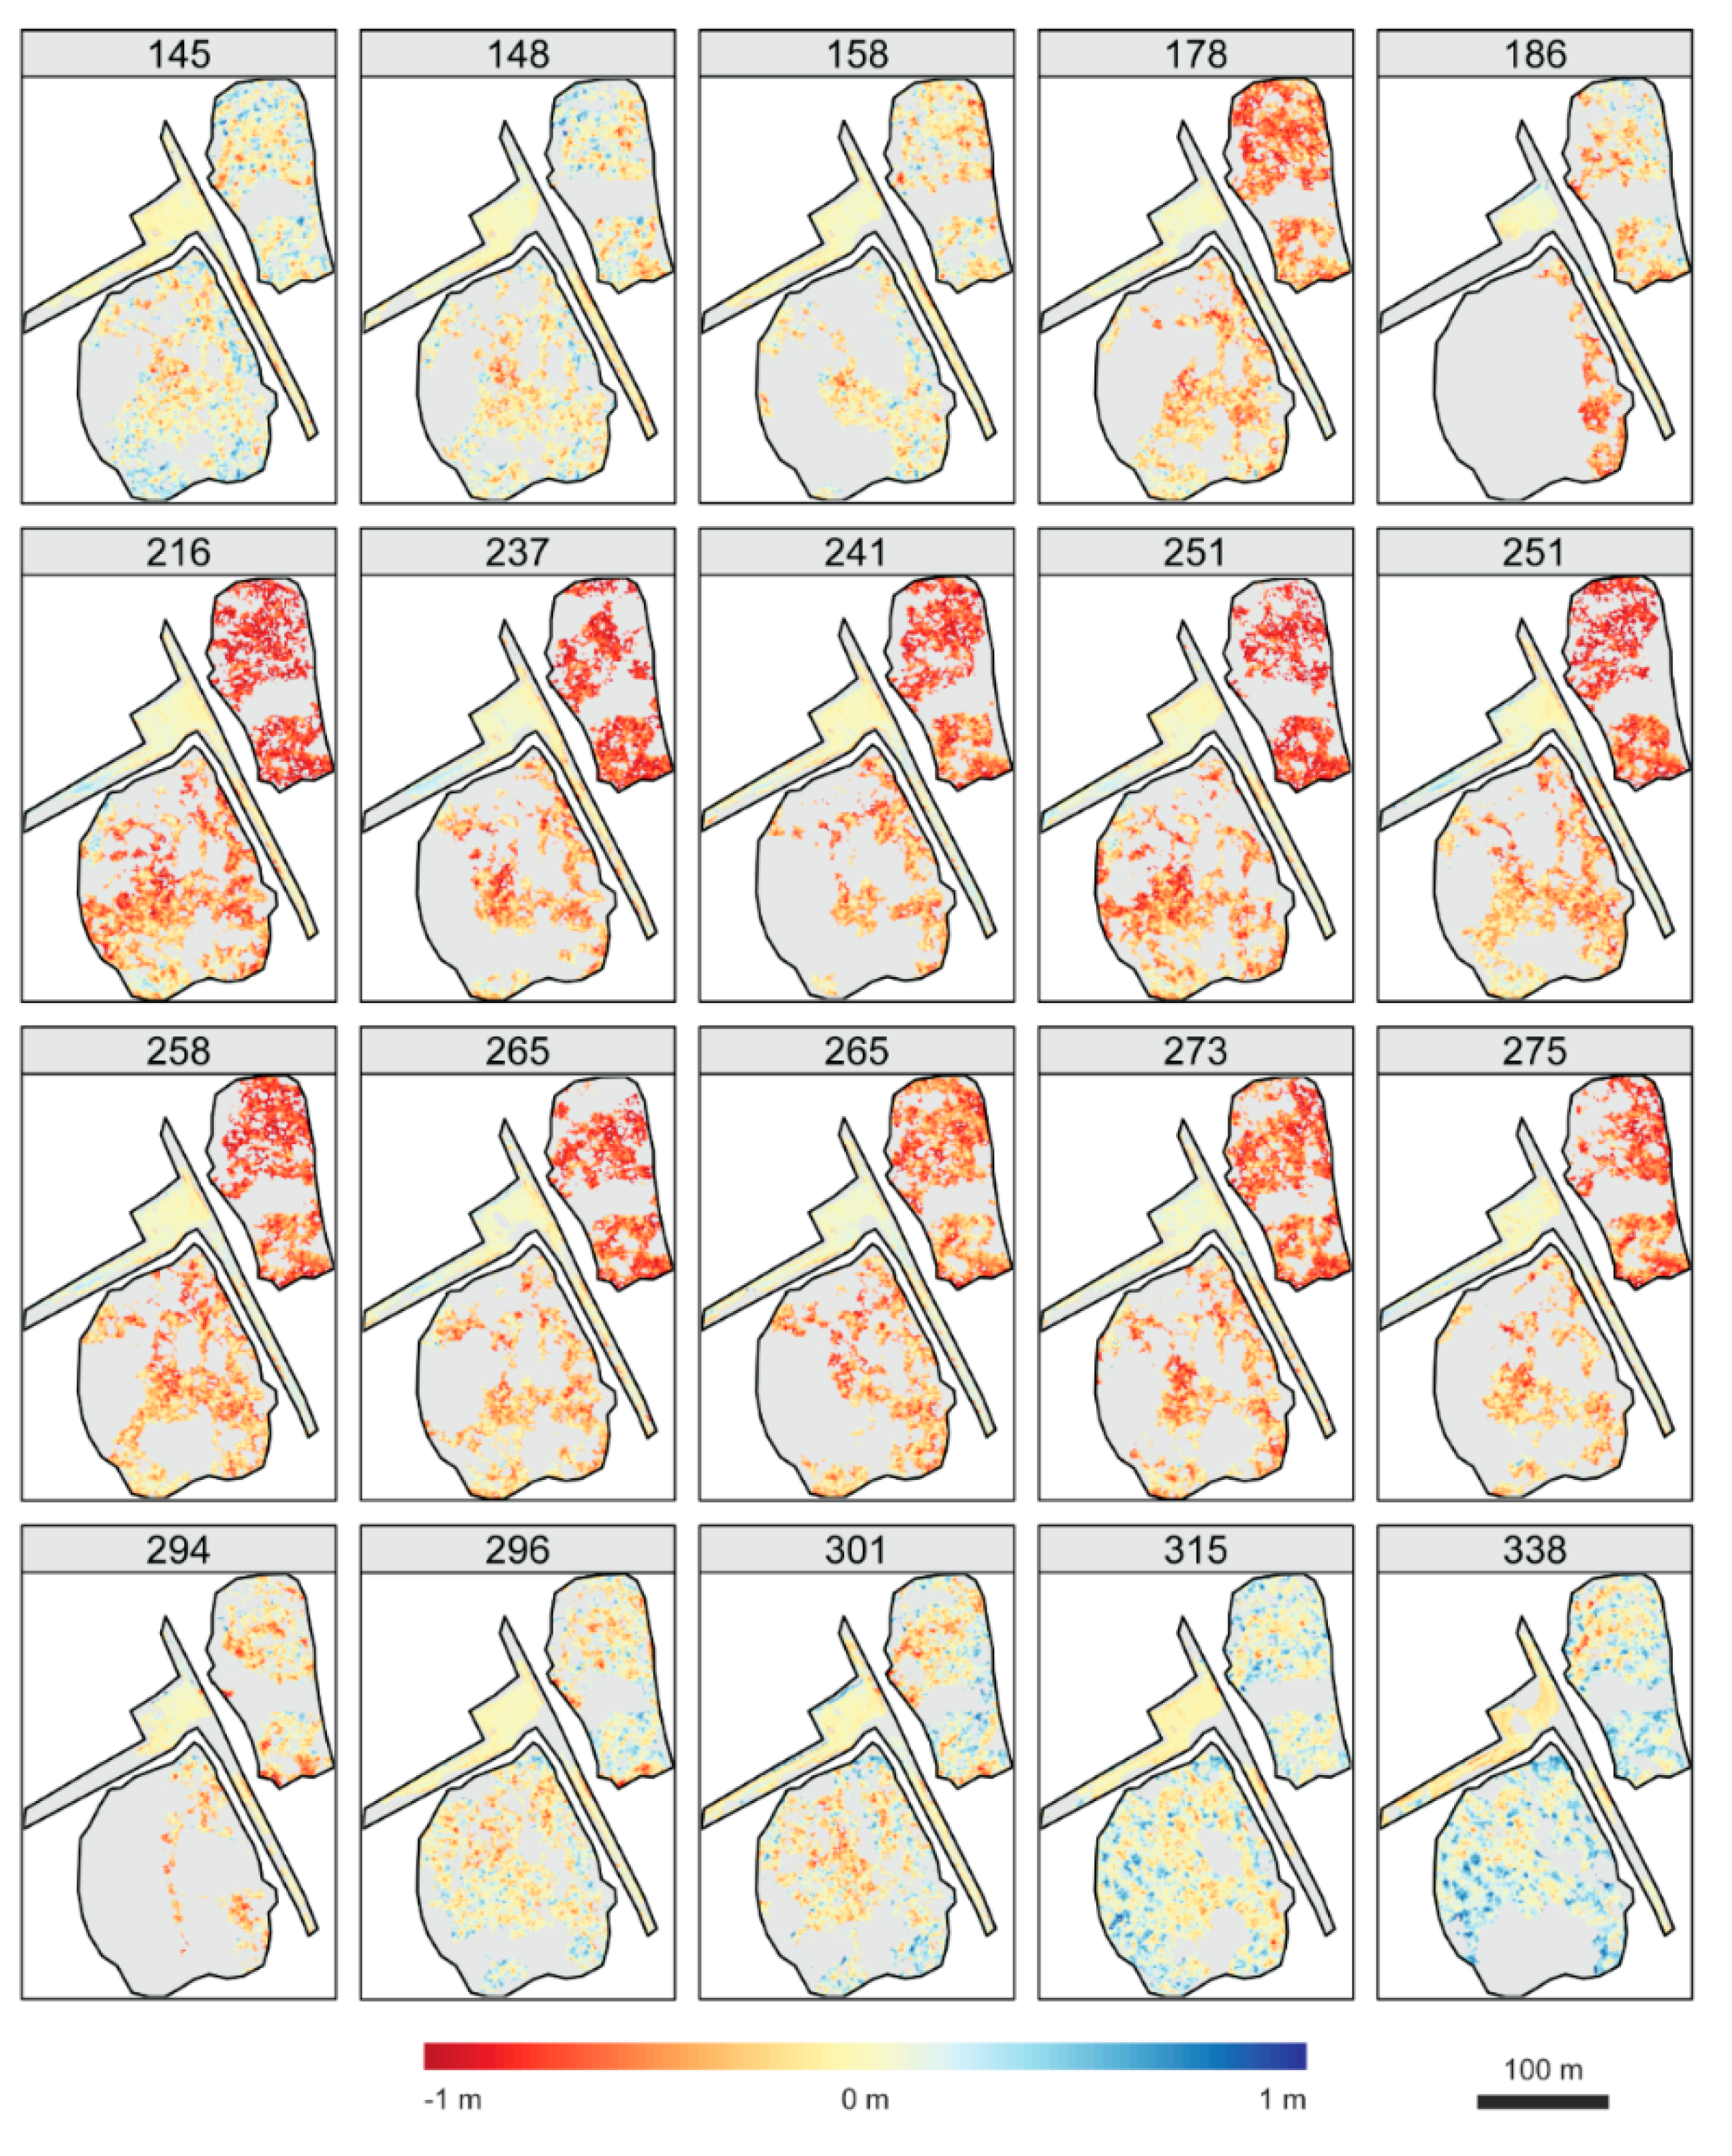
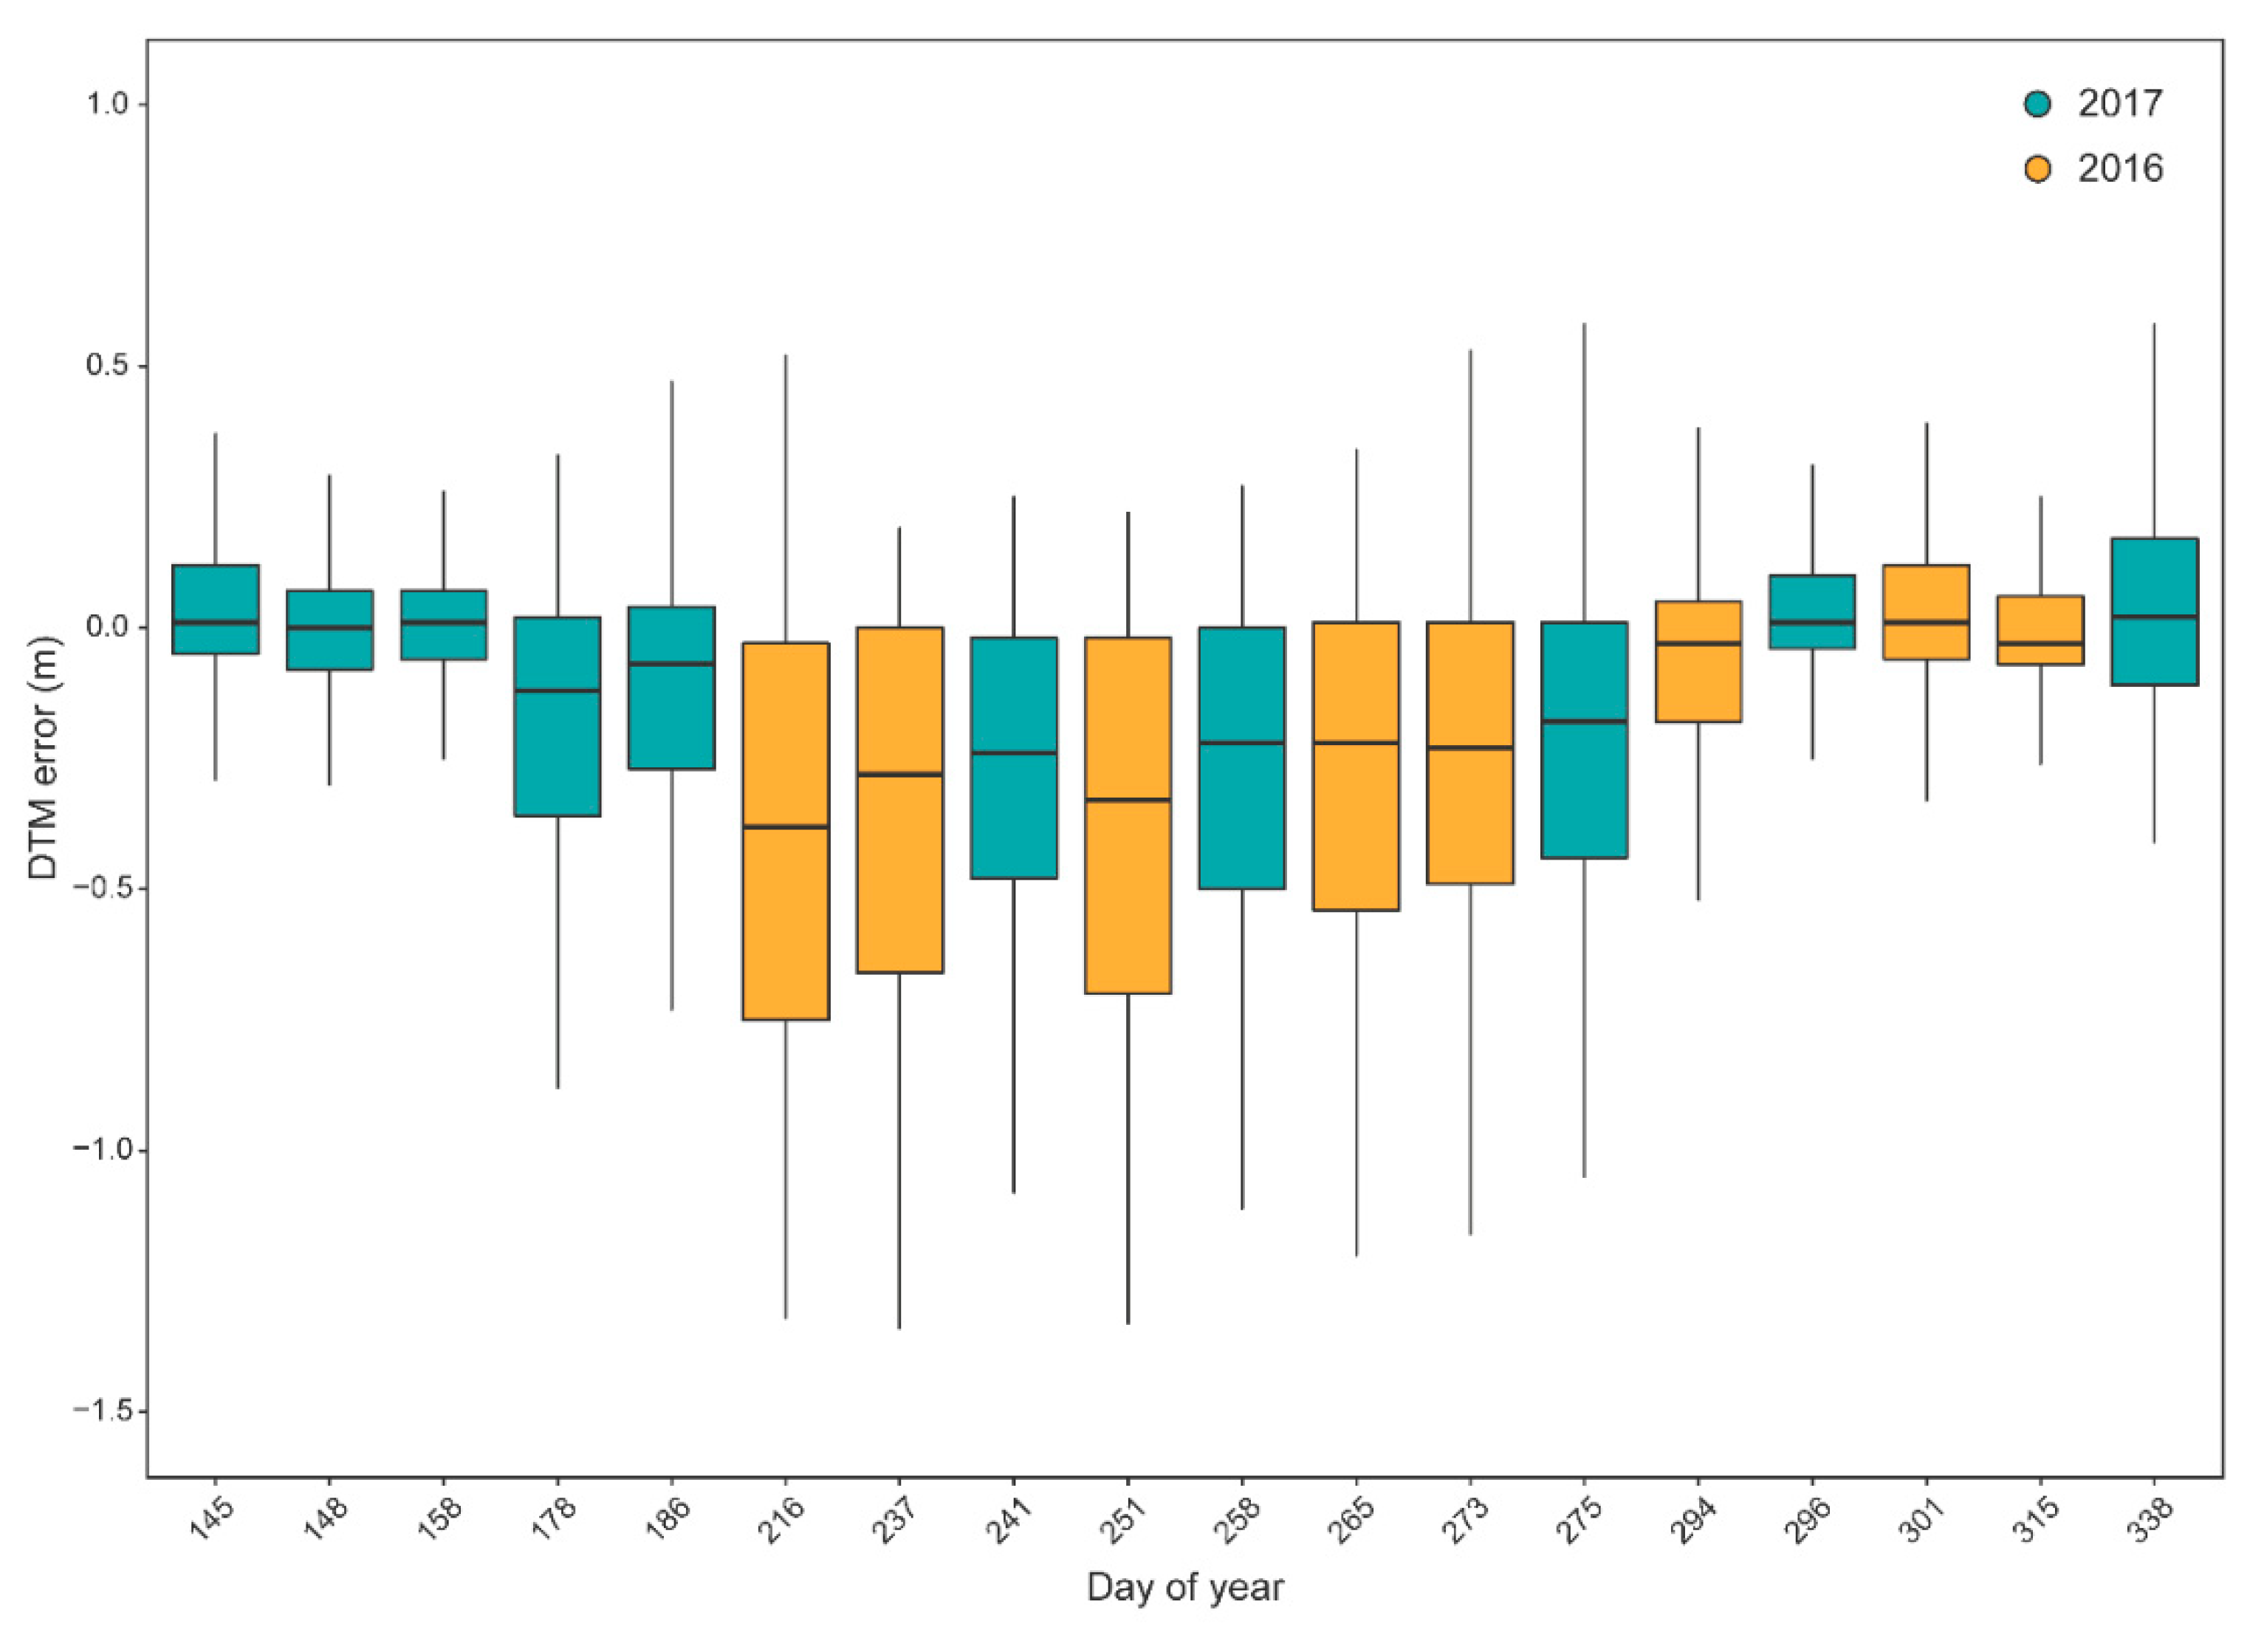
3.1. DTM Summary and Validation

Kruskal–Wallis rank sum tests on mean flight altitude and ground sample distance (Table 1) indicated that means were not significantly different from one another (p > 0.05). Road DTM validation analysis indicated that DAP-derived imagery acquisitions were capable of producing highly accurate DTMs in open areas regardless of acquisition timing (Table 2). Mean, standard deviation, and range of DTM error were found to fluctuate with acquisition timing (Figure 3, Figure 4, Table 2). Day of year 338, the only acquisition with snow cover, was found to have a high range of DTM error compared with other acquisitions.

3.2. Generalized Additive Mixed Models

GAMMs with statistically significant smoothing terms were generated for mean vegetation cover (Figure 5a; edf = 3.074, F = 6.604, p = 0.003) and mean error (Figure 5b; edf = 5.483, F = 38.3, p = 0.001). The maximum mean vegetation cover was predicted as 54% on day 216, while a minimum of 30% was predicted on day 340. The maximum mean error was predicted as −0.35 m on day 227, while the minimum was predicted as 0.00 m on day 148. Acquisitions between days 178 to 281 were predicted to have mean DTM errors greater than 15 cm, which corresponded to mean vegetation cover greater than 47%. Mean vegetation cover (Figure 5a) was found to mimic the temporal trend of mean DTM error (Figure 5b). A significant (p > 0.05) positive relationship between vegetation cover and DTM error found that DTM error increased by approximately 0.03 m for every 10% increase in vegetation cover. The GAMM for proportional DAP coverage (Figure 5c; edf = 2.463, F = 3.105, p = 0.059) was not significant, however, it did indicate a potential relationship with mean vegetation cover. Two outliers (Figure 5c), days 186 and 294, were found to strongly influence the significance of this model.

3.3. Best Available Terrain Pixel Compositing

A DAP-derived BATP DTM (Figure 6a) had a mean error of 0.01 m, a standard deviation of 0.14 m (Figure 6b), and a relative coverage of 86.3% compared with the reference DTM. Locations with no data were found to have 100% vegetation cover for all acquisitions. Figure 6c, d indicate that all flight acquisitions provided pixels to the BATP DTM. Data acquired in early spring, late-fall, and early-winter (days of year: 145, 148, 158, 178, 296, 301, 315, and 338) were the most represented donors for compositing. The day 315 acquisition provided the highest proportion (19.3%) of donor pixels to the BATP analysis, while that of day 241 provided the least (0.80%).

4. Discussion

This study utilized a multi-temporal UAS imagery dataset to create DAP point clouds and assess their accuracy for generating DTMs in a low cover forested site. Timing of acquisition was found to significantly influence mean DTM error. Error was shown to increase in summer months following a concurrent increase in mean vegetation cover. Although the GAMM model for proportional DAP-derived DTM coverage was not significant, linkages between increases in mean vegetation cover and consequent decreases in DTM coverage are logical, and should be investigated further. Acquisitions in early-spring, prior to leaf-on and seasonal shrub layer growth, or in late-fall and early-winter following senescence, were found to have lower DTM error, and increased coverages of DTMs. This finding provides insight into the influence of phenological cycles on the ability for DAP to characterize the ground surface in open forested settings. This could provide managers with information about optimal times to acquire imagery for the purposes of minimizing DAP-derived DTM error.
Within our study site, an average increase of 10% in mean vegetation cover was found to increase DTM error by approximately 0.03 m. Increasing levels of vegetation coverage therefore correspond to increases in DAP-derived DTM error. These results detail that the acquisition of DAP-derived DTMs should be planned for early-spring, late-fall, and early-winter periods. The results indicate that the use of UAS-acquired DAP-derived DTMs in low cover areas is entirely possible, but that as vegetation coverage increases, it is expected that DTM error will also increase. This could help to guide future managerial decisions regarding the use of DAP technology for DTM generation. Portions of the BATP composite with missing data outline that DAP can be limited in characterizing terrain even in leaf-off conditions. This finding challenges the managerial assumption that the characterization of terrain occluded by deciduous vegetation using DAP can be improved when acquired in leaf-off conditions. Coniferous coverage continues to pose challenges to deriving DTMs using DAP. For this reason, it may be advisable for managers to target stands during early stages of succession to reduce ground occlusion from coniferous vegetation [11].
The results from this study confirm that UAS-based DAP has potential to produce accurate DTMs in low vegetation cover forests that are comparable to conventional ALS acquisitions. As opposed to traditional methods of acquiring imagery from manned aircraft, a forest manager using UAS has precision control of where and when imagery is acquired on their land base, as well as the ability to tune acquisition parameters, such as spatial resolution, to best meet management needs [18,61,62]. Until the relatively recent emergence of commercially available high-performance UAS, the ability to acquire user defined datasets at ultra-fine scales was economically and logistically challenging, limiting multi-date acquisitions. The results from this study provide evidence that multi-date acquisitions offer managerial information, including how DAP point clouds are able to characterize terrain at different times of year, and how that multi-temporal data can be utilized to produce a more comprehensive terrain data set.
The use of DAP points clouds for operational scale forest inventories has several advantages over conventional ALS approaches. Firstly, DAP is able to provide both spectral and structural information from a single imagery acquisition that enhance forest inventory data sets [14]. Secondly, despite a rapid growth in the adoption of ALS technology, ALS data is not broadly available for all forested lands globally, often because of cost restrictions. While jurisdictions such as the Province of New Brunswick aim for full coverage by the year 2019, re-acquisition cycles are not yet determined and will likely not occur for at least 10 years following completion. While these landscape-level data sets are an invaluable interdisciplinary resource, single acquisitions do not provide temporal depth needed for short-term change detection and inventory updating. In contrast, DAP acquisition campaigns, especially when acquired using UAS, can be quickly planned and deployed for small areas, providing means to spatially, spectrally, and structurally update inventories following natural forest dynamics such as growth over time [11,21,63], wind-throw [64], fire events [65], or anthropogenic treatments such as harvesting [27]. A synergistic framework where landscape-level ALS data (where available) is used as a baseline, followed by incremental updates using UAS-DAP acquisitions, could provide the best-possible, near real-time enhanced forest inventory data available for operational forest management. The continual acquisition of these data at user defined scales will facilitate opportunities for ecosystem-based management approaches where policy and decision making can be systematically evaluated and improved alongside data acquisition.
Research into the potential to utilize methodologies from this study for the purposes of creating DTMs in recently harvested areas could provide a means to establish frameworks for baseline structural inventories in areas without ALS coverages. The creation of DAP inventory baselines would help to promote the utility of acquiring multi-temporal UAS imagery of forests through succession, providing useful information related to: regeneration success [11]; improved knowledge of tree growth rates in under-represented age and structural classes; and improved structural, spectral, and spatial knowledge of forest development through time at a wall-to-wall level. This would be especially useful in fast growing highly productive regions or in plantations, where accurate quantitative inventory data related to growth and structural changes are desired.
An assumption in this analysis was that the reference ALS-derived DTM was static in time. This assumption meant that incremental changes to the road surface and vegetation, which are expected to occur over the duration of the analysis, were not factored into the analytical process. This was largely because of the cost of acquiring repeat reference ALS datasets, and to provide analytical consistency. A single reference DTM also facilitated the use of the ICP algorithm for point cloud alignment, rather than relying on ground control targets, which were not consistently available during data acquisition. Future analyses should attempt to include consistent ground control targets, and potentially introduce multiple reference DTMs to account for incremental changes to features such as road surfaces.

5. Conclusions

The results from this study indicated that DAP point clouds were capable and accurate at creating DTMs that were comparable with a reference ALS-derived DTM. These results were validated by comparing DTMs over an unobstructed road within the study area. GAMM modeling indicated that imagery acquisition timing significantly influenced mean DAP-derived DTM error, and that acquisitions in spring, late-fall, and early-winter were most accurate. A BATP analysis, which utilized all available DTMs to generate a best-possible DAP-derived DTM, reinforced this finding, indicating that BATP donations were proportionally highest within these seasonal periods. The BATP analysis confirmed that seasonal vegetation differences affected the performance of DAP for producing DTMs, providing managerial insight into the applicability of acquiring structural data for the purposes of producing DTMs in open areas.

Author Contributions

Conceptualization, T.G. and T.H.; Formal analysis, T.G.; Funding acquisition, N.C.C.; Investigation, T.G.; Methodology, T.G.; Resources, G.P.; Supervision, N.C.C., T.H. and P.T.; Validation, T.G.; Visualization, T.G.; Writing—original draft, T.G.; Writing—review & editing, T.G., N.C.C., T.H., P.T. and G.P.

Funding

This research was funded by AWARE (the Assessment of Wood Attributes from Remote Sensing NSERC CRDPJ462973-14; grantee Prof Nicholas Coops, UBC).

Acknowledgments

We thank Pamela Hurley Poitras for her dedication to UAS imagery acquisition and correspondence for this project. This research was funded by the AWARE (Assessment of Wood Attributes using Remote sEnsing) Natural Sciences and Engineering Research Council of Canada Collaborative Research and Development grant to a team led by Nicholas Coops. We thank all anonymous reviewers and journal editorial staff for their efforts in improving the quality of this manuscript.

Conflicts of Interest

The authors declare no conflict of interest.

References

  1. Reutebuch, S.E.; Andersen, H.; Mcgaughey, R.J.; Forest, L. Light detection and ranging (lidar): An emerging tool for multiple resource inventory. J. For. 2005, 103, 286–292. [Google Scholar] [CrossRef]
  2. Mulverhill, C.; Coops, N.C.; White, J.C.; Tompalski, P.; Marshall, P.L.; Bailey, T. Enhancing the estimation of stem-size distributions for unimodal and bimodal stands in a boreal mixedwood forest with airborne laser scanning data. Forests 2018, 9. [Google Scholar] [CrossRef]
  3. Tompalski, P.; Coops, N.C.; Wulder, M.A.; Bailey, T. Combining multi-date airborne laser scanning and digital aerial photogrammetric data for forest growth and yield modelling. Remote Sens. 2018, 10, 347. [Google Scholar] [CrossRef]
  4. Hilker, T.; Wulder, M.A.; Coops, N.C. Update of forest inventory data with lidar and high spatial resolution satellite imagery. Can. J. Remote Sens. 2008, 34, 5–12. [Google Scholar] [CrossRef]
  5. Matasci, G.; Hermosilla, T.; Wulder, M.A.; White, J.C.; Coops, N.C.; Hobart, G.W.; Zald, H.S.J. Large-area mapping of Canadian boreal forest cover, height, biomass and other structural attributes using Landsat composites and lidar plots. Remote Sens. Environ. 2018, 209, 90–106. [Google Scholar] [CrossRef]
  6. Matasci, G.; Hermosilla, T.; Wulder, M.A.; White, J.C.; Coops, N.C.; Hobart, G.W.; Bolton, D.K.; Tompalski, P.; Bater, C.W. Three decades of forest structural dynamics over Canada’s forested ecosystems using Landsat time-series and lidar plots. Remote Sens. Environ. 2018, 216, 697–714. [Google Scholar] [CrossRef]
  7. Dash, J.; Pearse, G.; Watt, M. UAV Multispectral Imagery Can Complement Satellite Data for Monitoring Forest Health. Remote Sens. 2018, 10, 1216. [Google Scholar] [CrossRef]
  8. White, J.; Wulder, M.A.; Vastaranta, M.; Coops, N.C.; Pitt, D.; Woods, M. The utility of Image-Based Point Clouds for forest inventory: A comparison with airborne laser scanning. Forests 2013, 4, 518–536. [Google Scholar] [CrossRef]
  9. Leberl, F.; Irschara, A.; Pock, T.; Meixner, P.; Gruber, M.; Scholz, S.; Wiechert, A. point clouds: Lidar versus 3D Vision. Photogramm. Eng. Remote Sens. 2010, 76, 1123–1134. [Google Scholar] [CrossRef]
  10. Saarinen, N.; Vastaranta, M.; Näsi, R.; Rosnell, T.; Hakala, T.; Honkavaara, E.; Wulder, M.; Luoma, V.; Tommaselli, A.; Imai, N.; et al. Assessing biodiversity in boreal forests with UAV-based photogrammetric point clouds and hyperspectral imaging. Remote Sens. 2018, 10, 338. [Google Scholar] [CrossRef]
  11. Goodbody, T.R.H.; Coops, N.C.; Hermosilla, T.; Tompalski, P.; Crawford, P. Assessing the status of forest regeneration using digital aerial photogrammetry and unmanned aerial systems. Int. J. Remote Sens. 2018, 39, 5246–5264. [Google Scholar] [CrossRef]
  12. McGlone, J.; Mikhail, E.; Bethel, J.; Mullen, R. Manual of Photogrammetry, 5th ed.; American Society of Photogrammetry and Remote Sensing: Bethesda, MD, USA, 2004; ISBN 1-57083-071-1. [Google Scholar]
  13. White, J.C.; Coops, N.C.; Wulder, M.A.; Vastaranta, M.; Hilker, T.; Tompalski, P. Remote sensing technologies for enhancing forest inventories: A review. Can. J. Remote Sens. 2016, 42, 619–641. [Google Scholar] [CrossRef]
  14. Goodbody, T.R.H.; Coops, N.C.; Hermosilla, T.; Tompalski, P.; McCartney, G.; MacLean, D.A. Digital aerial photogrammetry for assessing cumulative spruce budworm defoliation and enhancing forest inventories at a landscape-level. ISPRS J. Photogramm. Remote Sens. 2018, 142, 1–11. [Google Scholar] [CrossRef]
  15. Tziavou, O.; Pytharouli, S.; Souter, J. Unmanned Aerial Vehicle (UAV) based mapping in engineering geological surveys: Considerations for optimum results. Eng. Geol. 2018, 232, 12–21. [Google Scholar] [CrossRef]
  16. Stepper, C.; Straub, C.; Immitzer, M.; Pretzsch, H. Using canopy heights from digital aerial photogrammetry to enable spatial transfer of forest attribute models: A case study in central Europe. Scand. J. For. Res. 2017, 32, 748–761. [Google Scholar] [CrossRef]
  17. White, J.C.; Stepper, C.; Tompalski, P.; Coops, N.C.; Wulder, M.A. Comparing ALS and image-based point cloud metrics and modelled forest inventory attributes in a complex coastal forest environment. Forests 2015, 6, 3704–3732. [Google Scholar] [CrossRef]
  18. Šedina, J.; Pavelka, K.; Raeva, P. UAV remote sensing capability for precision agriculture, forestry and small natural reservation monitoring. In Proceedings of the SPIE 10213, Anaheim, CA, USA, 9 April 2017. [Google Scholar]
  19. Puliti, S.; Saarela, S.; Gobakken, T.; Ståhl, G.; Næsset, E. Combining UAV and Sentinel-2 auxiliary data for forest growing stock volume estimation through hierarchical model-based inference. Remote Sens. Environ. 2018, 204, 485–497. [Google Scholar] [CrossRef]
  20. Huang, Y.; Reddy, K.N.; Fletcher, R.S.; Pennington, D. UAV low-altitude remote sensing for precision weed management. Weed Technol. 2018, 32, 2–6. [Google Scholar] [CrossRef]
  21. Goodbody, T.R.H.; Coops, N.C.; Marshall, P.; Tompalski, P.; Crawford, P. Unmanned aerial systems for precision forest inventory purposes a review and case study. For. Chron. 2017, 93, 71–81. [Google Scholar] [CrossRef]
  22. Zhang, J.; Hu, J.; Lian, J.; Fan, Z.; Ouyang, X.; Ye, W. Seeing the forest from drones: Testing the potential of lightweight drones as a tool for long-term forest monitoring. Biol. Conserv. 2016, 198, 60–69. [Google Scholar] [CrossRef]
  23. Patias, P.; Giagkas, F.; Georgiadis, C.; Mallinis, G.; Kaimaris, D.; Tsioukas, V. Evaluating horizontal positional accuracy of low-cost UAV orthomosaics over forest terrain using ground control points extracted from different sources. Proc. SPIE 2017, 10444. [Google Scholar] [CrossRef]
  24. Wallace, L.; Lucieer, A.; Watson, C.; Turner, D. Development of a UAV-LiDAR system with application to forest inventory. Remote Sens. 2012, 4, 1519–1543. [Google Scholar] [CrossRef]
  25. Clarke, R. The regulation of civilian drones’ impacts on behavioural privacy. Comput. Law Secur. Rev. 2014, 30, 286–305. [Google Scholar] [CrossRef]
  26. Puliti, S.; Talbot, B.; Astrup, R. Tree-Stump Detection, Segmentation, Classification, and Measurement Using Unmanned Aerial Vehicle (UAV) Imagery. Forests 2018, 9, 102. [Google Scholar] [CrossRef]
  27. Goodbody, T.R.H.; Coops, N.C.; Tompalski, P.; Crawford, P.; Day, K.J.K. Updating residual stem volume estimates using ALS- and UAV-acquired stereo-photogrammetric point clouds. Int. J. Remote Sens. 2016, 1161. [Google Scholar] [CrossRef]
  28. Pickell, P.D.; Hermosilla, T.; Frazier, R.J.; Coops, N.C.; Wulder, M.A. Forest recovery trends derived from Landsat time series for North American boreal forests Forest recovery trends derived from Landsat time series for North American boreal forests. Int. J. Remote Sens. 2016, 1161, 138–149. [Google Scholar] [CrossRef]
  29. Hermosilla, T.; Wulder, M.A.; White, J.C.; Coops, N.C.; Hobart, G.W. An integrated Landsat time series protocol for change detection and generation of annual gap-free surface reflectance composites. Remote Sens. Environ. 2015, 158, 220–234. [Google Scholar] [CrossRef]
  30. Hermosilla, T.; Wulder, M.A.; White, J.C.; Coops, N.C.; Hobart, G.W. Regional detection, characterization, and attribution of annual forest change from 1984 to 2012 using Landsat-derived time-series metrics. Remote Sens. Environ. 2015, 170, 121–132. [Google Scholar] [CrossRef]
  31. Pasquarella, V.J.; Bradley, B.A.; Woodcock, C.E. Near-real-time monitoring of insect defoliation using Landsat time series. Forests 2017, 8, 275. [Google Scholar] [CrossRef]
  32. Wulder, M.A.; White, J.C.; Loveland, T.R.; Woodcock, C.E.; Belward, A.S.; Cohen, W.B.; Fosnight, E.A.; Shaw, J.; Masek, J.G.; Roy, D.P. The global Landsat archive: Status, consolidation, and direction. Remote Sens. Environ. 2016, 185, 271–283. [Google Scholar] [CrossRef]
  33. Löw, F.; Prishchepov, A.V.; Waldner, F.; Dubovyk, O.; Akramkhanov, A.; Biradar, C.; Lamers, J.P.A. Mapping Cropland abandonment in the Aral Sea Basin with MODIS time series. Remote Sens. 2018, 10, 159. [Google Scholar] [CrossRef]
  34. Jin, S.; Sader, S.A. MODIS time-series imagery for forest disturbance detection and quantification of patch size effects. Remote Sens. Environ. 2005, 99, 462–470. [Google Scholar] [CrossRef]
  35. Lu, Y.; Coops, N.C.; Hermosilla, T. Regional assessment of pan-Pacific urban environments over 25 years using annual gap free Landsat data. Int. J. Appl. Earth Obs. Geoinf. 2016, 50, 198–210. [Google Scholar] [CrossRef]
  36. Lu, Y.; Coops, N.C.; Hermosilla, T. Chronicling urbanization and vegetation changes using annual gap free Landsat composites from 1984 to 2012. JURSE 2017. [Google Scholar] [CrossRef]
  37. Liu, X. Airborne LiDAR for DEM generation: Some critical issues. Prog. Phys. Geogr. 2008, 32, 31–49. [Google Scholar] [CrossRef]
  38. Furze, S.; Ogilvie, J.; Arp, P.A. Fusing digital elevation models to improve hydrological interpretations. J. Geogr. Inf. Syst. 2017, 09, 558–575. [Google Scholar] [CrossRef]
  39. Tomaštík, J.; Mokroš, M.; Saloš, S.; Chudỳ, F.; Tunák, D. Accuracy of photogrammetric UAV-based point clouds under conditions of partially-open forest canopy. Forests 2017, 8, 151. [Google Scholar] [CrossRef]
  40. Mohan, M.; Silva, C.A.; Klauberg, C.; Jat, P.; Catts, G.; Cardil, A.; Hudak, A.T.; Dia, M. Individual tree detection from unmanned aerial vehicle (UAV) derived canopy height model in an open canopy mixed conifer forest. Forests 2017, 8, 340. [Google Scholar] [CrossRef]
  41. Pádua, L.; Hruška, J.; Bessa, J.; Adão, T.; Martins, L.M.; Gonçalves, J.A.; Peres, E.; Sousa, A.M.R.; Castro, J.P.; Sousa, J.J. Multi-temporal analysis of forestry and coastal environments using UASs. Remote Sens. 2018, 10, 24. [Google Scholar] [CrossRef]
  42. Eltner, A.; Baumgart, P.; Maas, H.G.; Faust, D. Multi-temporal UAV data for automatic measurement of rill and interrill erosion on loess soil. Earth Surf. Process. Landf. 2015, 40, 741–755. [Google Scholar] [CrossRef]
  43. Vega, F.A.; Ramírez, F.C.; Saiz, M.P.; Rosúa, F.O. Multi-temporal imaging using an unmanned aerial vehicle for monitoring a sunflower crop. Biosyst. Eng. 2015, 132, 19–27. [Google Scholar] [CrossRef] [Green Version]
  44. Rossini, M.; Di Mauro, B.; Garzonio, R.; Baccolo, G.; Cavallini, G.; Mattavelli, M.; De Amicis, M.; Colombo, R. Rapid melting dynamics of an alpine glacier with repeated UAV photogrammetry. Geomorphology 2018, 304, 159–172. [Google Scholar] [CrossRef]
  45. Xiang, J.; Chen, J.; Sofia, G.; Tian, Y.; Tarolli, P. Open-pit mine geomorphic changes analysis using multi-temporal UAV survey. Environ. Earth Sci. 2018, 77, 1–18. [Google Scholar] [CrossRef]
  46. Mirijovskỳ, J.; Langhammer, J. Multitemporal monitoring of the morphodynamics of a mid-mountain stream using UAS photogrammetry. Remote Sens. 2015, 7, 8586–8609. [Google Scholar] [CrossRef]
  47. Lin, Y.; Jiang, M.; Yao, Y.; Zhang, L.; Lin, J. Use of UAV oblique imaging for detection of individual trees in residential environments. Urban For. Urban Green. 2015, 14, 404–412. [Google Scholar] [CrossRef]
  48. Rusnák, M.; Sládek, J.; Kidová, A.; Lehotský, M. Template for high-resolution river landscape mapping using UAV technology. Meas. J. Int. Meas. Confed. 2018, 115, 139–151. [Google Scholar] [CrossRef]
  49. Hébert, F. Best Management Practices for Tolerant Hardwoods in New Brunswick. Volume I: Distribution, Silvics and Stand Attributes of Key Species Associated with Northern Hardwoods in New Brunswick; Northern Hardwoods Research Institute: Edmunston, NB, Canada, 2016. [Google Scholar]
  50. Central Uplands Ecoregion. In Our Landscape Heritage: The Story of Ecological Land Classification in New Brunswick; Government of New Brunswick: Fredericton, NB, Canada, 2007; pp. 145–150. ISBN 978-1-55396-203-8.
  51. Pix4D Pix4D—Sequoia. Available online: https://pix4d.com/sequoia-faq/ (accessed on 3 August 2018).
  52. Stroppiana, D.; Villa, P.; Sona, G.; Ronchetti, G.; Candiani, G.; Pepe, M.; Busetto, L.; Migliazzi, M.; Boschetti, M. Early season weed mapping in rice crops using multi-spectral UAV data. Int. J. Remote Sens. 2018, 39, 5432–5452. [Google Scholar] [CrossRef]
  53. Agisoft LLC. Agisoft PhotoScan Professional Edition 2018; Agisoft LLC: Petersburg, Russia, 2018. [Google Scholar]
  54. Isenburg, M. LAStools. Available online: http://lastools.org 2018 (accessed on 24 July 2018).
  55. Meng, X.; Currit, N.; Zhao, K. Ground filtering algorithms for airborne LiDAR data: A review of critical issues. Remote Sens. 2010, 2, 833–860. [Google Scholar] [CrossRef]
  56. Besl, P.; McKay, N. A Method for Registration of 3-D Shapes. IEEE Trans. Pattern Anal. Mach. Intell. 1992, 14, 239–256. [Google Scholar] [CrossRef]
  57. Wood, S.N. Fast stable restricted maximum likelihood and marginal likelihood estimation of semiparametric generalized linear models. J. R. Stat. Soc. Ser. B Stat. Methodol. 2011, 73, 3–36. [Google Scholar] [CrossRef] [Green Version]
  58. Shadish, W.R.; Zuur, A.F.; Sullivan, K.J. Using generalized additive (mixed) models to analyze single case designs. J. Sch. Psychol. 2014, 52, 149–178. [Google Scholar] [CrossRef] [PubMed]
  59. Zuur, A.; Ieno, E.N.; Meesters, E. A Beginner’s Guide to R; Springer Science & Business Media: New York, NY, USA, 2009; ISBN 978-0-387-93837-0. [Google Scholar]
  60. Rickbeil, G.J.M.; Hermosilla, T.; Coops, N.C.; White, J.C.; Wulder, M.A. Barren-ground caribou (Rangifer tarandus groenlandicus) behaviour after recent fire events; integrating caribou telemetry data with Landsat fire detection techniques. Glob. Chang. Biol. 2017, 23, 1036–1047. [Google Scholar] [CrossRef] [PubMed]
  61. Colomina, I.; Molina, P. Unmanned aerial systems for photogrammetry and remote sensing: A review. ISPRS J. Photogramm. Remote Sens. 2014, 92, 79–97. [Google Scholar] [CrossRef]
  62. Singh, K.K.; Frazier, A.E. A meta-analysis and review of unmanned aircraft system (UAS) imagery for terrestrial applications. Int. J. Remote Sens. 2018, 39, 5078–5098. [Google Scholar] [CrossRef]
  63. Guerra-Hernández, J.; González-Ferreiro, E.; Monleón, V.J.; Faias, S.P.; Tomé, M.; Díaz-Varela, R.A. Use of multi-temporal UAV-derived imagery for estimating individual tree growth in Pinus pinea stands. Forests 2017, 8, 1–19. [Google Scholar] [CrossRef]
  64. Mokroš, M.; Výbošt’ok, J.; Merganič, J.; Hollaus, M.; Barton, I.; Koreň, M.; Tomaštík, J.; Čerňava, J. Early stage forest windthrow estimation based on unmanned aircraft system imagery. Forests 2017, 8, 1–17. [Google Scholar] [CrossRef]
  65. McKenna, P.; Erskine, P.D.; Lechner, A.M.; Phinn, S. Measuring fire severity using UAV imagery in semi-arid central Queensland, Australia. Int. J. Remote Sens. 2017, 38, 4244–4264. [Google Scholar] [CrossRef]
Figure 1. Methodological flow chart of photogrammetric processing, point cloud post processing, and time series digital terrain models (DTM) analysis. UAS—unmanned aerial systems; DAP—digital aerial photogrammetry; DSM—digital surface model; BATP—best available terrain pixel; ALS—airborne laser scanning.
Remotesensing 10 01554 g001
Figure 2. Study area on (a) 25 May 2017 (day of year: 145), (b) 27 June 2017 (day of year: 178), and (c) 15 September 2017 (day of year: 258), displaying the low cover forest area used for DTM analysis and road validation area. The smaller, upper-most portion of the low cover forest area is comprised of short understory regeneration, while the larger section is sparsely forested with approximately 50 stems per hectare. Imagery used was acquired using a Sequoia multi-spectral camera and is displayed in a false colour composite of near infra-red, red, and green.
Remotesensing 10 01554 g002
Figure 3. Visualized error (m) for each DAP-derived DTM listed by day of year relative to the reference ALS-derived DTM. Grey colour indicates the full extent of the reference DTM.
Remotesensing 10 01554 g003
Figure 4. Boxplots of DTM error by day of year, coloured by acquisition year.
Remotesensing 10 01554 g004
Figure 5. Generalized additive mixed models for (a) vegetation cover, (b) mean error, and (c) proportional DAP coverage. Solid curved line indicates the fitted generalized additive mixed model (GAMM) and dashed lines indicated standard error bounds. Green backdrop from day 178 to 281 indicate locations where mean DTM error exceeded 15 cm.
Remotesensing 10 01554 g005
Figure 6. Results of the best available terrain pixel (BATP) analysis including (a) the BATP DTM (b), composite error map, (c) donor pixel map, and (d) cumulative donor pixel frequency chart indicating the days of year with the least to highest frequency of donated pixels for the BATP DTM. Light grey colour indicates the full extent of the reference DTM.
Remotesensing 10 01554 g006
Table 1. Imagery acquisition dates and corresponding mean flight altitude (above ground), mean ground sample distance (GSD), mean sun angle, and mean digital aerial photogrammetry (DAP) point density.
Acquisition DateDay of YearMean Flight Altitude (m)Mean GSD (cm)Mean Sun
Angle (°)
Mean DAP
Density (pts/m2)
2017-05-25145116.213.571.225.4
2017-05-28148102.212.168.331.0
2017-06-07158116.113.245.723.0
2017-06-27178114.713.454.026.6
2017-07-05186113.413.358.439.8
2016-08-03216102.512.268.723.8
2016-08-24237101.612.472.424.6
2017-08-2924199.912.167.033.4
2016-09-07251104.012.671.822.9
2017-09-08251102.112.264.933.3
2017-09-15258101.112.073.835.0
2016-09-21265110.012.968.925.8
2017-09-22265102.712.267.432.5
2016-09-29273116.513.975.820.8
2017-10-02275101.011.974.429.0
2016-10-20294102.612.682.722.7
2017-10-23296102.612.358.330.6
2016-10-27301105.813.172.926.0
2016-11-10315102.612.673.327.4
2017-12-04338100.312.474.527.4
Table 2. Summary statistics of the differential error per flight for the entire study site, as well as only the road validation section of the analysis. DTM—digital terrain model.
DateDay of YearStudy Area OnlyRoad Validation Only
Mean Error (m)Standard Deviation of Error (m)Range of Error (m)Mean Vegetation Cover (%)DAP DTM Coverage (%)Mean Validation Error (m)Standard Deviation of Validation Error (m)
2017-05-251450.040.151.4133.5060.20−0.020.06
2017-05-281480.000.161.5843.2250.940.000.06
2017-06-071580.010.152.2848.2641.750.010.06
2017-06-27178−0.170.231.2847.8545.290.030.07
2017-07-05186−0.120.222.5566.6723.470.020.11
2016-08-03216−0.410.381.9645.2952.54−0.010.08
2016-08-24237−0.350.361.5554.7338.070.000.08
2017-08-29241−0.270.281.3755.0635.840.000.07
2016-09-07251−0.370.361.5553.6144.16−0.010.08
2017-09-08251−0.330.321.5952.0644.190.000.08
2017-09-15258−0.270.291.3949.2944.430.010.07
2016-09-21265−0.280.311.5452.0340.910.010.08
2017-09-22265−0.180.231.3748.5942.030.040.07
2016-09-29273−0.250.291.8748.3344.200.030.09
2017-10-02275−0.240.281.6355.8537.070.000.09
2016-10-20294−0.080.211.6555.4824.920.010.08
2017-10-232960.020.161.4737.6256.35−0.010.05
2016-10-273010.020.181.5037.0855.91−0.020.07
2016-11-103150.010.131.2828.5670.19−0.060.05
2017-12-043380.040.192.0132.8660.68−0.110.10

