Article

Evaluation of Satellite-Based Precipitation Products from IMERG V04A and V03D, CMORPH and TMPA with Gauged Rainfall in Three Climatologic Zones in China

1
State Key Laboratory of Hydrology-Water Resources and Hydraulic Engineering, National Cooperative Innovation Center for Water Safety & Hydro-Science, College of Hydrology and Water Resources, Hohai University, Nanjing 210098, China
2
Department of Basic Courses, Jinling Institute of Technology, Nanjing 211169, China
3
USDA-ARS Hydrology and Remote Sensing Laboratory, Beltsville, MD 20705-2350, USA
*
Authors to whom correspondence should be addressed.
Remote Sens. 2018, 10(1), 30; https://doi.org/10.3390/rs10010030
Submission received: 9 August 2017 / Revised: 17 December 2017 / Accepted: 22 December 2017 / Published: 25 December 2017

Abstract

:
A critical evaluation of the newly released precipitation data set is very important for both the end users and data developers. Meanwhile, the evaluation may provide a benchmark for the product’s continued development and future improvement. To these ends, the four precipitation estimates including IMERG (the Integrated Multi-satellitE Retrievals for the Global Precipitation Measurement) V04A, IMERG V03D, CMORPH (the Climate Prediction Center Morphing technique)-CRT and TRMM (the Tropical Rainfall Measuring Mission) 3B42 are systematically evaluated against the gauge precipitation estimates at multiple spatiotemporal scales from 1 June 2014 to 30 November 2015 over three different topographic and climatic watersheds in China. Meanwhile, the statistical methods are utilized to quantize the performance of the four satellite-based precipitation estimates. The results show that: (1) over the Tibetan Plateau cold region, among all products, IMERG V04A underestimates precipitation with the largest RB (−46.98%) during the study period and the similar results are seen at the seasonal scale. However, IMERG V03D demonstrates the best performance according to RB (7.46%), RMSE (0.44 mm/day) and RRMSE (28.37%). Except for in summer, TRMM 3B42 perform better than CMORPH according to RMSEs, RRMSEs and Rs; (2) within the semi-humid Huaihe River Basin, IMERG V04A has a slight advantage over the other three satellite-based precipitation products with the lowest RMSE (0.32 mm/day) during the evaluation period and followed by IMERG V03D, TRMM 3B42 and CMORPH orderly; (3) over the arid/semi-arid Weihe River Basin, in comparison with the other three products, TRMM 3B42 demonstrates the best performance with the lowest RMSE (0.1 mm/day), RRMSE (8.44%) and highest R (0.92) during the study period. Meanwhile, IMERG V03D perform better than IMERG V04A according all the statistical indicators; (4) in winter, IMERG V04A and IMERG V03D tend to underestimate the total precipitation with RBs (−70.62% vs. −6.47% over the Tibetan Plateau, −46.92% vs. −0.66% over the Weihe River Basin, respectively); and (5) overall, except for IMERG V04A in Tibetan Plateau, all satellite-based precipitation captured the gauge-based precipitation well over the three regions according to RRMSEs, Rs and Rbs during the study period. IMERG V03D performs better than its predecessors-TRMM 3B42 and CMORPH over the Tibetan Plateau region and the Huaihe River Basin, while IMERG V04A only does so over the latter. Between the two IMERG products, IMERG V04A does not show an advantage over IMERG V03D over the Tibetan Plateau region and the Weihe River Basin. In particular, over the former, IMERG V04A performs far worse than IMERG V03D. These findings provide valuable feedback for both IMERG algorithm developers and data users.

1. Introduction

Accurate precipitation estimates and measurements are essential for a range of applications, including water resource management, hazard and disaster monitoring, and numerical weather prediction [1,2,3,4]. However, obtaining reliable and accurate precipitation estimates with higher spatiotemporal remains a key challenge. Recently, precipitation measurement at a global scale has become feasible through the application of satellite remote sensing, and a range of different satellite remote sensing-based precipitation products have been developed. These include CMORPH [5], TRMM Multi-satellite Precipitation Analysis (TMPA) [6,7], and IMERG [8,9] products.
The CMORPH technique combines the passive microwave (PMW) observations derived from low-Earth orbiters and infrared (IR) observations from geostationary satellite platforms to provide half-hourly and 3-hourly global precipitation estimates from 60°N to 60°S. These estimates are produced through three consecutive data processing stages. First, PMW data is used to generate relatively high-quality precipitation estimates. Second, a morphing algorithm is applied to propagate these estimates, using motion vectors obtained from IR imagery. Finally, the shape and intensity of the precipitation systems are modified using time-weighted linear interpolation [5]. CMORPH has been reported to outperform other satellite-based precipitation estimates over the Central United States [10], Europe [11], and Australia [5,12]. However, CMORPH tends to overestimate the precipitation during wet seasons due to the fact that CMORPH does not rely on rainfall gauge data [10].
The TMPA products have been widely applied [13,14,15,16,17,18] since the launch of the TRMM satellite on 27 November 1997, and have undergone a series of major revisions and reanalysis—including the release of TRMM Version 7 in late 2012. The TMPA method retrieves TRMM 3B42 through four consecutive stages. First, the microwave (MW) precipitation estimates are calibrated and combined. Second, IR precipitation estimates are generated by using the calibrated MW precipitation. Third, MW and IR estimates are combined to create a real-time, satellite-only precipitation product. Finally, bias in the precipitation estimates adjustment is removed by incorporating monthly rain gauge data [6,19]. While TRMM excels at estimating of moderate and heavy tropical and sub-tropical precipitation, it is less successful at estimating light rainfall and precipitation [20,21].
Following on from the success of TRMM, the Global Precipitation Measurement (GPM) Core Observatory satellite was launched on 27 February 2014. The GPM mission consists of an international constellation of microwave satellite sensors that provide the next generation of global observations for rain and snow retrieval [1]. Relative to TRMM, the GPM orbital inclination has been increased from 35° to 65°. The GPM Core Observatory is equipped with a multi-channel GPM Microwave Imager (GMI) and a Ku/Ka-band (Ku-band at 13.6 GHz and Ka-band at 35.5 GHz, respectively) Dual-frequency Precipitation Radar (DPR). The DPR is more sensitive to light rainfall and snowfall than the TRMM precipitation radar [8,22]. IMERG products are produced through three main procedures. First, the rainfall estimates based on PMW observations from the GPM Constellation are inter-calibrated with the GCI (GPM Combined Instrument, using GMI and DPR) product. Second, the PMW precipitation datasets are propagated by the motion vectors derived from the infrared brightness temperatures. Finally, the precipitation estimates obtained in the second step are calibrated by comparisons with the GPCC (Global Precipitation Climatology Centre) precipitation dataset [8,22,23].
As a global successor to TMPA, the newly released IMERG [8,9,24] products provided further improvements in the areas of temporal-spatial resolution and snowfall estimation. A preliminary comparison between the TMPA product and IMERG “Final Run” products was described by Huffman [24]. Their results found that the two products are very similar over land. Liu [25] describes a comparable comparison between IMERG V03D and TMPA on a global scale and shows that IMERG V03D provides better performance over high precipitation land regions; however, systematic differences over land are much smaller than over oceans. Over India, the most recent preliminary comparisons were made by Prakash et al. [26] between IMERG V03D and TMPA rainfall products. The study indicated a notable advantage of IMERG V03D over TMPA in terms of heavy monsoon rainfall detection. The work was continued by Prakash et al. [27] who provide a comprehensive assessment of IMERG V03D over India at a daily scale for the southwest monsoon season (June to September 2014). Results showed that the IMERG V03D precipitation estimates accurately depict the mean monsoon variability and associated rainfall more realistically than the Global Satellite Mapping of Precipitation (GSMaP) [28] version 6 and gauge-adjusted TMPA rainfall products. However, IMERG V03D performed relatively poorly in regions where precipitation is dominated by orographic effects. Recently, several studies have evaluated the performance of IMERG V03D over China [29,30,31]. These studies found that IMERG V03D can capture the precipitation spatial patterns and perform better than TRMM-based products at mid- and high-latitudes, but exhibits poor performance in winter.
The algorithm for IMERG was upgraded to Version 04 on 21 March 2017. Here, this new IMERG version is hereinafter referred to as “IMERG V04A”. An updated evaluation of IMERG V04A precipitation data is therefore required. The Tibetan Plateau, the Huaihe River Basin and the Weihe River Basin all represent significantly different altitudes, climates and topography. The accuracy of precipitation estimation using satellites is highly influenced both by topography and the structure of convective systems, especially for the estimation of extreme precipitation events. In this paper, these three highly variable regions of China are selected to evaluate the accuracy of IMERG V04A precipitation estimates under different conditions. Our goal is therefore to derive greater insight into IMERG’s error characteristics and provide useful evaluation information for both IMERG algorithms developers and data users.

2. Study Areas, Datasets and Methodology
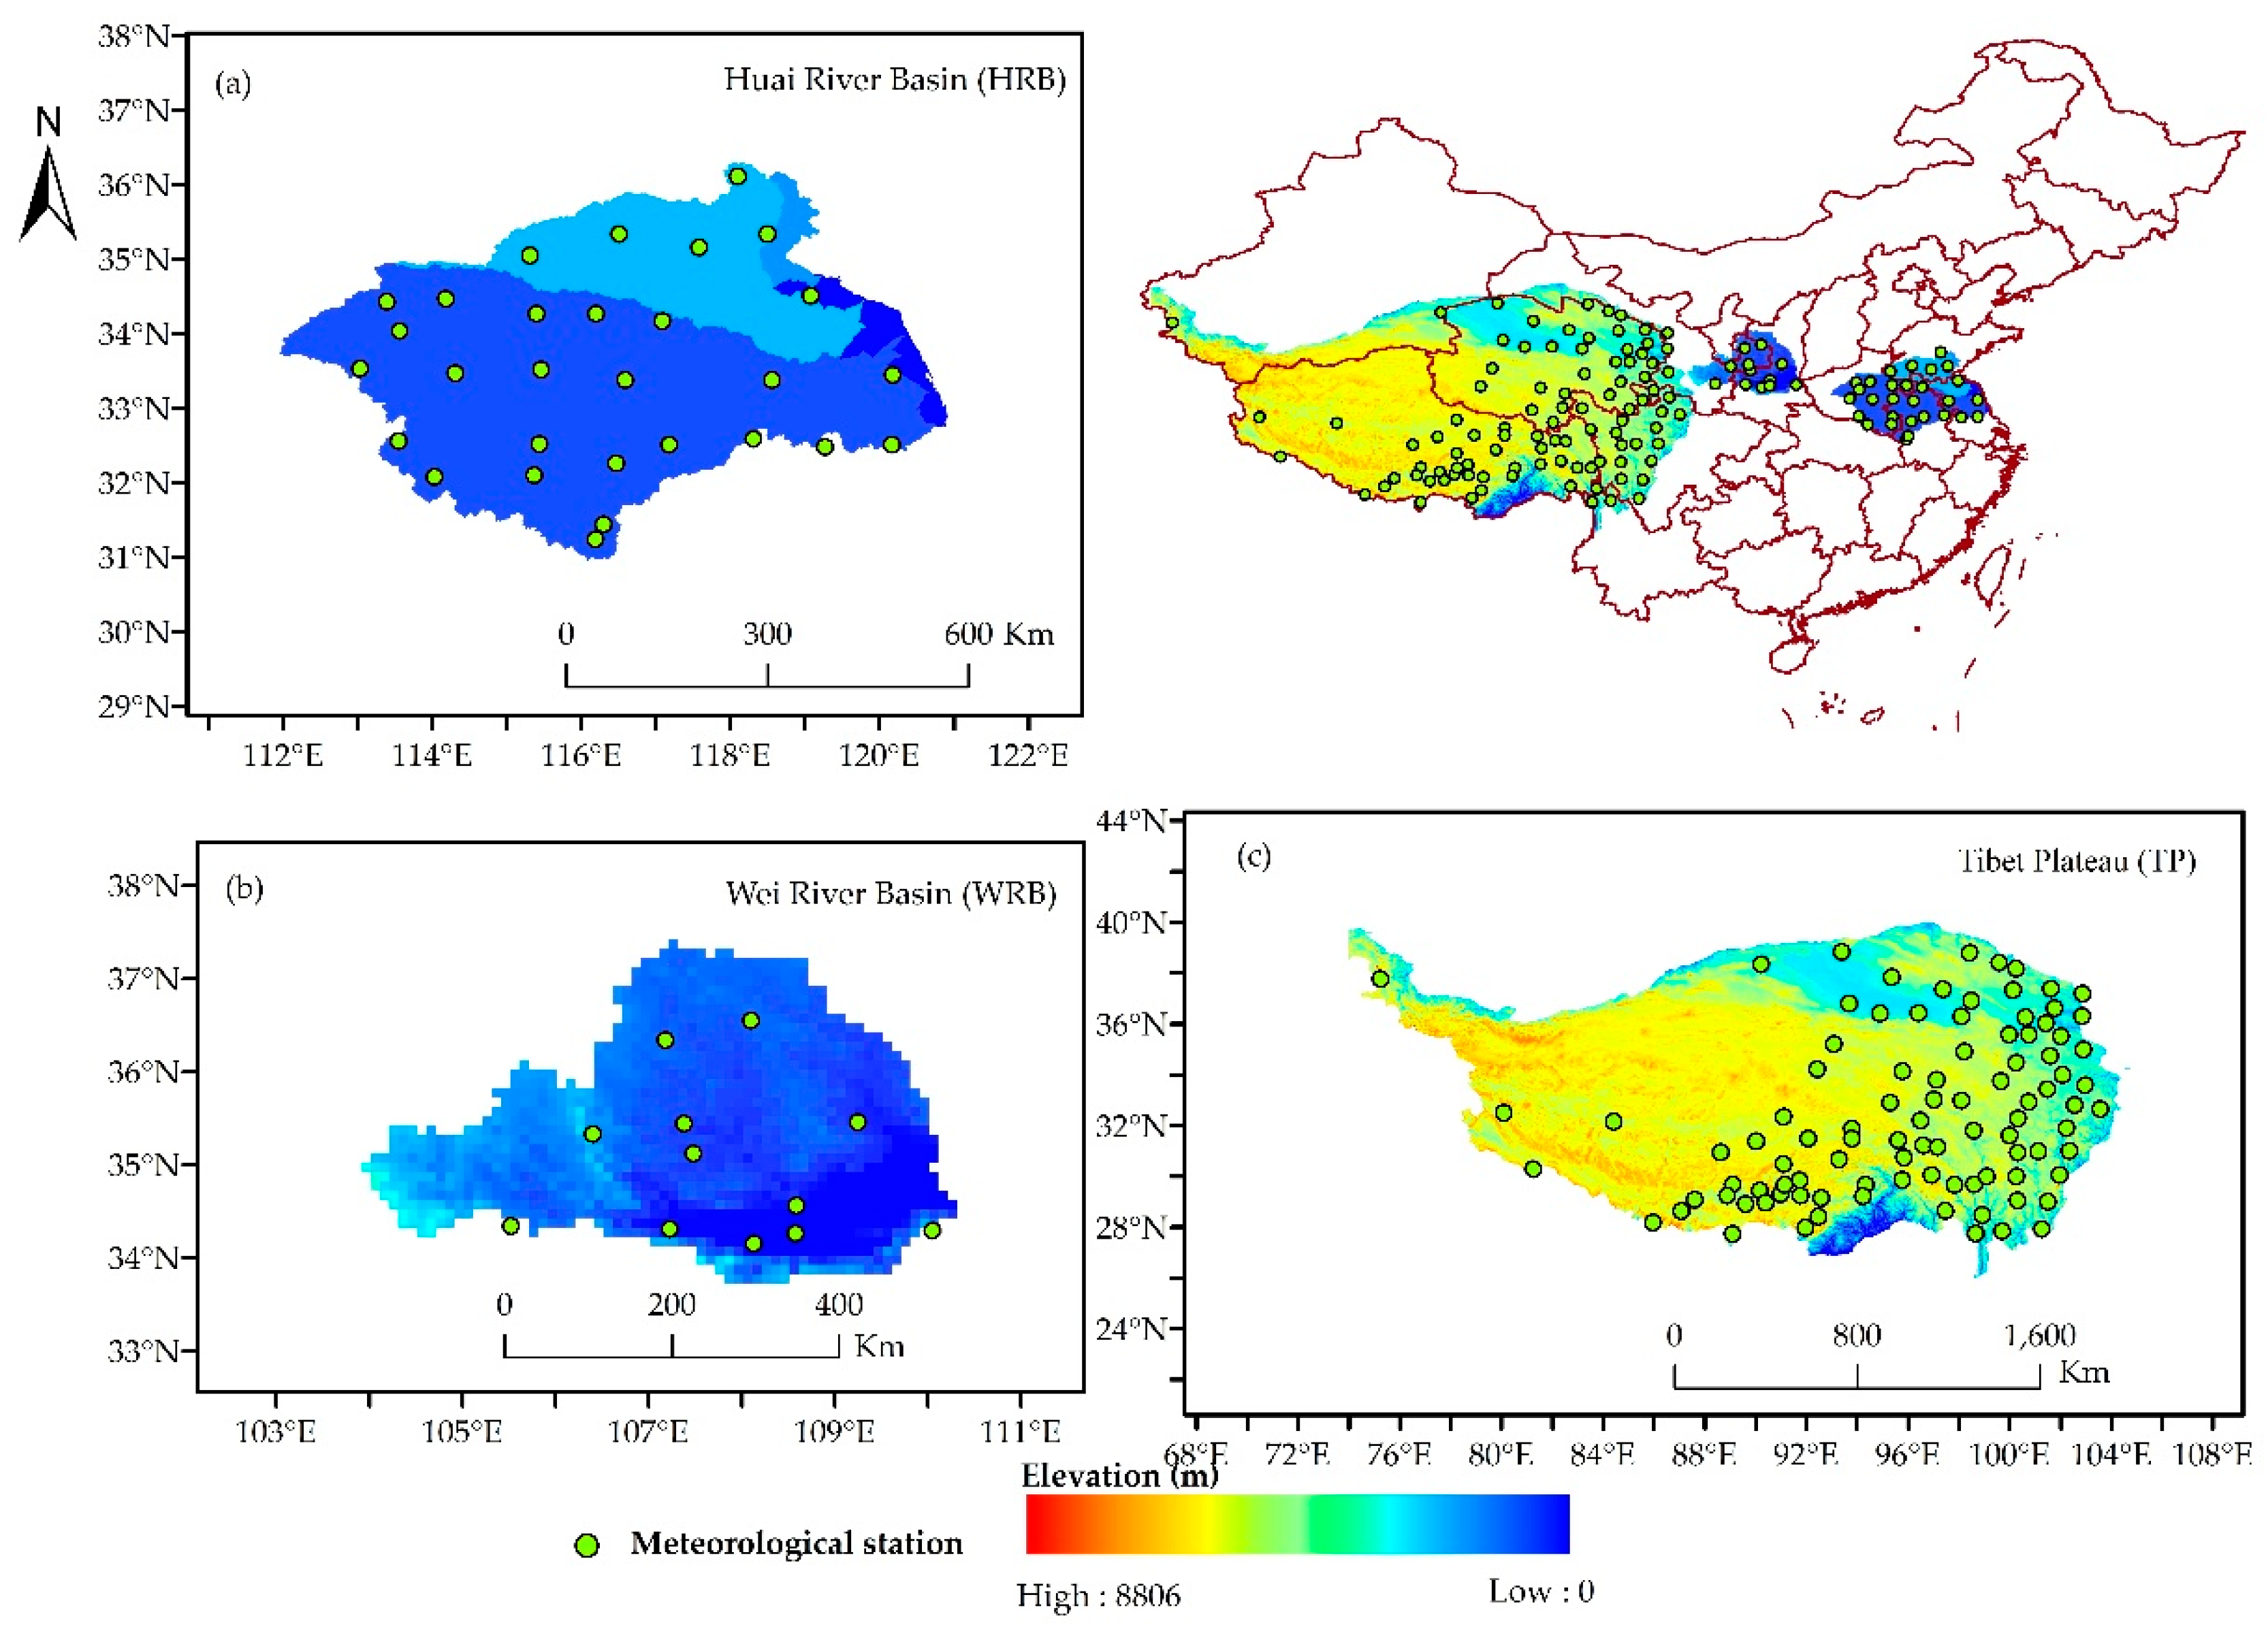
2.1. Study Areas

As described above, our analysis is centered on precipitation comparisons within three large-scale regions in China: the Tibetan Plateau, the Huaihe River Basin and the Weihe River Basin. Figure 1 shows a map of these regions, while Table 1 presents an overview of each basin’s basic characteristics. These basins are described in greater detail below.

2.1.1. Tibetan Plateau

The 2,500,000 km2 Tibetan Plateau (25°–40°N, 74°–105°E; Figure 1) is located in southwestern China. It is characterized by complex topography and high elevation. The average elevation is about 4292 m. Surface elevation changes rapidly at the boundaries of the plateau (especially along its southern boundary) and sharp contrasts exist between the western and eastern parts of the region in terms of land cover, vegetation, and meteorological characteristics. The annual average precipitation is 482.8 mm and the annual average temperature is between 2 °C and 5 °C. General climate conditions on the Plateau are characterized by strong solar radiation, low air temperatures, high daily temperature differences, and low seasonal temperature variability. However, due to the influence of the Asian monsoon, the Tibetan Plateau exhibits large seasonal precipitation variability. In particular, about 90% of the precipitation falls in the rainy season (from May to September) and the mean daily temperature ranges from 7 °C to 15 °C in the warmest month (July) to −1 °C to −7 °C in the coldest month (January). A negative trend in both temperature and precipitation is found when moving from the southeast to northwest within the plateau.

2.1.2. Huaihe River Basin

The 270,000 km2 Huaihe River Basin (31°–36°N, 111.9°–120.8°E; Figure 1) is located in the eastern part of China. About two-thirds of the basin is a vast expanse of plain lying between the Yellow River and the Yangtze River Basins. The basin exhibits a diverse topography, land surface cover, and soil texture characteristics. The southwestern, northeastern and western parts of the Huaihe River Basin are characterized by hills, mountains and the remainder which consists of wide plains. The average elevation is 84 m. The annual average temperature of the basin is between 11 °C and 16 °C, and the average annual precipitation is about 1100 mm/yr. The Huaihe River Basin is located along the transition between China’s northern dry climate and its humid and semi-humid southern climates. Therefore, the spatial distribution of precipitation is quite uneven—ranging from 1400 mm/yr in the southern mountainous region to less than 700 mm/yr in the northern region of the basin near the Yellow River.

2.1.3. Weihe River Basin

The 134,800 km2 Weihe River Basin (33°30′–37°30′N, 103°30′–110°30′E; Figure 1) is located in the northwestern part of China. Within this basin, the highest elevation is 3905 m, the lowest elevation is 505 m, and the mean elevation is about 2173 m. The basin is characterized by relatively sparse precipitation and low air temperatures in winter and abundant precipitation and high temperatures in summer. The annual average temperature is between 10 °C and 13 °C, and the annual precipitation is approximately 559 mm/yr. Moreover, precipitation varies substantially both monthly and annually, with the rainy season (from June to September) accounting for approximately 60% of the total annual precipitation. Annual precipitation amounts vary greatly due to the unstable characteristics of the intensity, duration and influenced area of the subtropical high pressure belt over the northern Pacific Ocean. As a result, annual precipitation exceeds 800 mm/yr in wet years while falling below 370 mm/yr in drought years. This tendency towards high inter-annual variability results in frequent flood and drought periods in the basin. Within the basin, altitude generally decreases from mountainous areas in the northwestern part of the basin to the low-lying Guanzhong Plain in the southeastern and southern parts of the basin.

2.2. Gauge Precipitation Observations

Historical records of daily datasets were collected from 137 separate automatic meteorological stations (96 stations in the Tibetan Plateau, 29 stations in the Huaihe River Basin and 12 stations in the Weihe River Basin) operated by the China Meteorological Administration (CMA). Hourly measurements of accumulated precipitation were made 24 times every day, using gauges sensitive to both liquid and solid precipitation. Internal consistency checks, extreme values masking, and the removal of questionable data were included in the quality control performed by the Chinese National Meteorological Information Center to ensure data reliability [32,33]. The spatial distribution of these meteorological stations is shown in Figure 1.

2.3. Satellite-Based Precipitation Datasets

2.3.1. CMORPH-CRT

The CMORPH products stand for the precipitation products estimated by the National Oceanic and Atmospheric Administration (NOAA) Climate Prediction Center MORPHing technique. Three separate CMORPH products are actually produced. The first product has a 0.25°/daily space/time resolution and is available with a latency of about 18 h. The other two products are available at a finer combination of temporal and spatial resolutions. In particular, one provides estimates at temporal and spatial resolutions of 3 h and 0.25°, respectively, while the other provides estimates at higher temporal and spatial resolutions of 30 min and 8 km, respectively.
Recently, CMORPH was reprocessed by the NOAA Climate Prediction Center (CPC). The reprocessed CMORPH is called Version 1.0 and the original CMORPH is called Version 0.x. There are three major differences between Version 1.0 and Version 0.x. Firstly, Version 1.0 started from January 1998 to the present, while Version 0.x started from December 2002. Secondly, in Version 1.0, using a fixed algorithm and inputs of fixed versions may ensure best possible homogeneity, while in the Version 0.x, using an evolving algorithm and inputs of changing versions may present substantial inhomogeneity. Finally, Version 1.0 includes both the raw (CMORPH-RAW) as well as a bias-corrected (CMORPH-CRT) and gauge-satellite blended precipitation (CMORPH-BLD) product, while Version 0.x only has the raw satellite-only product [34]. Here, the 0.25°/daily CMORPH-CRT was used. For a full description of the CMORPH algorithm and its applications, the reader is referred to Joyce et al. [35] and Habib et al. [36].

2.3.2. TRMM 3B42

The TMPA algorithm was developed by the National Aeronautics and Space Administration (NASA) Goddard Space Flight Center (GSFC). Version 7 of the TMPA algorithm includes two different products: a (low latency) real-time version which covers the global latitude belt from 60°N to 60°S (TRMM 3B42RT), and a (high latency) gauge-adjusted, post-real time research product (hereinafter referred to as TRMM 3B42) between 50°N and 50°S. Here, 3-hourly TRMM 3B42 accumulation estimates on a 0.25° × 0.25° spatial grid are utilized. The TRMM Combined Instrument (TCI) estimate (TRMM 2B31 product) uses data from the precipitation radar (PR) and the TRMM Microwave Imager (TMI) sensors onboard the TRMM satellite to derive optimal precipitation estimates for TRMM. The TRMM 2B31 product was used as a satellite calibrator for the production of 3B42 and 3B43 products until October 2014 when the routine production of TRMM TCI precipitation estimates was terminated due to the gradual orbital descent of the TRMM spacecraft. As a result, after October 2014, climatological satellite calibrations were instead adopted for real-time TMPA products. It should be noted that this transition in calibration method can result in a temporal inconsistency in these products. The TMI data was still employed as an input to the production of TRMM 3B42 until the full decommissioning of TRMM on 8 April 2015.

2.3.3. IMERG V03D and IMERG V04A

The GPM mission may advance the understanding (and forecasting) of weather systems and extreme weather events. IMERG provides three types of product: an early run, a late run, and a final run. Both the early and late run products are provided in near-real time, with a latency of 4 h and 12 h, respectively. The final run product is a post-real-time research product available from 12 March 2014 with a latency of about 4 months. Both the half-hourly and monthly IMERG final run products have been released on a 0.1° × 0.1° spatial grid. As noted above, the algorithm for the Integrated Multi-satellitE Retrievals for GPM was recently upgraded to Version 04. IMERG V03D and IMERG V04A post-real-time research products were released in January 2015 and in March 2017, respectively.
Changes from Version 03 to 04 are these: (1) shift from static to dynamic calibration of PERSIANN-CCS (Cloud Classification System) by microwave precipitation; (2) calibrate 2BCMB (Level-2 Combined DPR and GMI) to GPCP V2.3 over ocean (at middle and high latitudes) and land (globally) to compensate for low (high) 2BCMB bias over non-tropical oceans (land); (3) increase high quality (HQ) precipitation field spatial coverage from 60° N-S to 90° N-S; (4) average the four 1° grid box adjustment coefficients to calibrate GPROF (GPM Profiling Algorithm)-GMI to 2BCMB in each IMERG 0.1° grid box to eliminate blockiness in regions of high gradient differences; and (5) threshold HQ at 50 mm/h to accommodate a legacy precipitation encoding limitation. Detailed information on this conversion can be found in the V04 IMERG Final Run Release Notes [37].
Here, the half-hourly IMERG V03D and IMERG V04A products were examined between 1 June 2014 and 30 November 2015. In order to stay consistent with the TRMM 3B42 and CMORPH-CRT datasets, both IMERG V03D and IMERG V04A with native 0.1°/hourly spatiotemporal resolution were re-sampled into a 0.25° spatial grid and with daily temporal resolutions using the inverse distance weighting (IDW) interpolation method [38]. These two products are hereinafter referred to as R-IMERG V03D and R-IMERG V04A, respectively. Interpolated values were estimated as a weighted average of the finer-resolution estimates and relative weights assigned in proportion to the inverse square of distance to the center of each 0.25°-grid. The IDW interpolation method has been applied to obtain the spatial precipitation distribution in previous regional studies [15,39]. Nevertheless, it should be acknowledged that its application may result in additional uncertainties. For more detailed information regarding IMERG, the reader is referred to the IMERG Algorithm Theoretical Basis Document [24,37].
TRMM 3B42 and CMORPH-CRT are all bias corrected with a satellite gauge analysis. It should be noted that the algorithm for the TRMM 3B42 product does not remain static over our study period. It instead switches over to the GPM satellite retrievals after the TRMM satellite was decommissioned in March 2015. The GPM satellite provides the input into the IMERG product production system. In addition, the time period overlaps with TRMM and GPM input for the TRMM 3B42 dataset. Therefore, for the time after March 2015, this study compares different algorithms rather than different data sets. Overall, four different satellite-based precipitation estimates (CMORPH-CRT, R-IMERG V03D, R-IMERG V04A and TRMM 3B42) were considered in this paper. Prior to any comparisons, all precipitation estimates were aggregated to a 0.25° spatial and daily temporal resolution.
IMERG V03D can be obtained only until January 2016 from NASA’s official website. The study period used in this paper is from 1 June 2014 to 30 November 2015. While this period is short to evaluate the performance of satellite data in capturing the observed gauged rainfall for the small sample size limits the representative of the weather. Also, the short period may increase the risk of uncertainty in precipitation assessment. However, with IMERG equipped with dual-frequency precipitation radar, comparison in performance of IMERG and its predecessors-TMPA and CMORPH is necessary over the variable regions in China. Furthermore, the precipitation assessment of the two IMERG products is vital for development of the IMERG product algorithm. Meanwhile, we should mention that the future works are needed to evaluate IMERG relying on larger samples.

2.4. Methodology

Many previous studies have used gauge measurements to validate the accuracy of GPM products [22,25,27,29,30,31]. The study focuses on the performance assessment of the four satellite-based precipitation products relative to the nominally more accurate ground-based rainfall estimates. The satellite-based precipitation estimates at the boxes where the stations are located are compared with gauge-based precipitation observations. In cases where the satellite grid point was close to the station, the comparison was carried out directly between them. However, in cases where the ground station was surrounded by four grid cells but not particularly close to any, an average of the four satellite grid points around the station was used as the basis for comparison. The evaluation was conducted over three watersheds for the period June 2014–November 2015 at multiple spatiotemporal scales. First, one-and-a-half-year precipitation analysis was performed. Second, in order to study the seasonal effect, the analysis has been performed for the four seasons spring (March to May), summer (June to August), autumn (September to November) and winter (December to February).
To qualitatively verify satellite precipitation products using gauged precipitation observations, a series of traditional error indexes including the Pearson linear correlation coefficient (R), Root Mean Square Error (RMSE), Relative Root Mean Square Error (RRMSE), and Relative Bias (RB) were utilized. These metrics were calculated as follows:
R = i = 1 n ( G i G ¯ ) ( S i S ¯ ) i = 1 n ( G i G ¯ ) 2 i = 1 n ( S i S ¯ ) 2
R M S E = 1 n i = 1 n ( S i G i ) 2
R R M S E = 1 n i = 1 n ( S i G i ) 2 G ¯ × 100 %
R B = 1 n i = 1 n ( S i G i ) G ¯ × 100 %
where S i and G i are the values of the satellite precipitation data and rain gauge observations for the i th rain station, respectively; S ¯ and G ¯ are the mean values of the satellite precipitation data and rain gauge observations, respectively, and n is the total numbers of rain gauges.
R measures the linear agreement between rain gauge observations and satellite precipitation. RMSE measures the absolute average error magnitude and assigns a greater weight to larger errors. RRMSE [40,41,42,43] normalizes RMSE in daily precipitation estimates by the mean daily precipitation observed on the ground. When RRMSE is more than 50%, such precipitation estimates are considered unreliable. This particular threshold has been used in previous studies [29]. RB denotes the degree of overall overestimation or underestimation. For more detailed information about these statistical indices, the reader can refer to Anjum [44], Chen and Li [29] and Moriasi et al. [45].

3. Results and Analysis

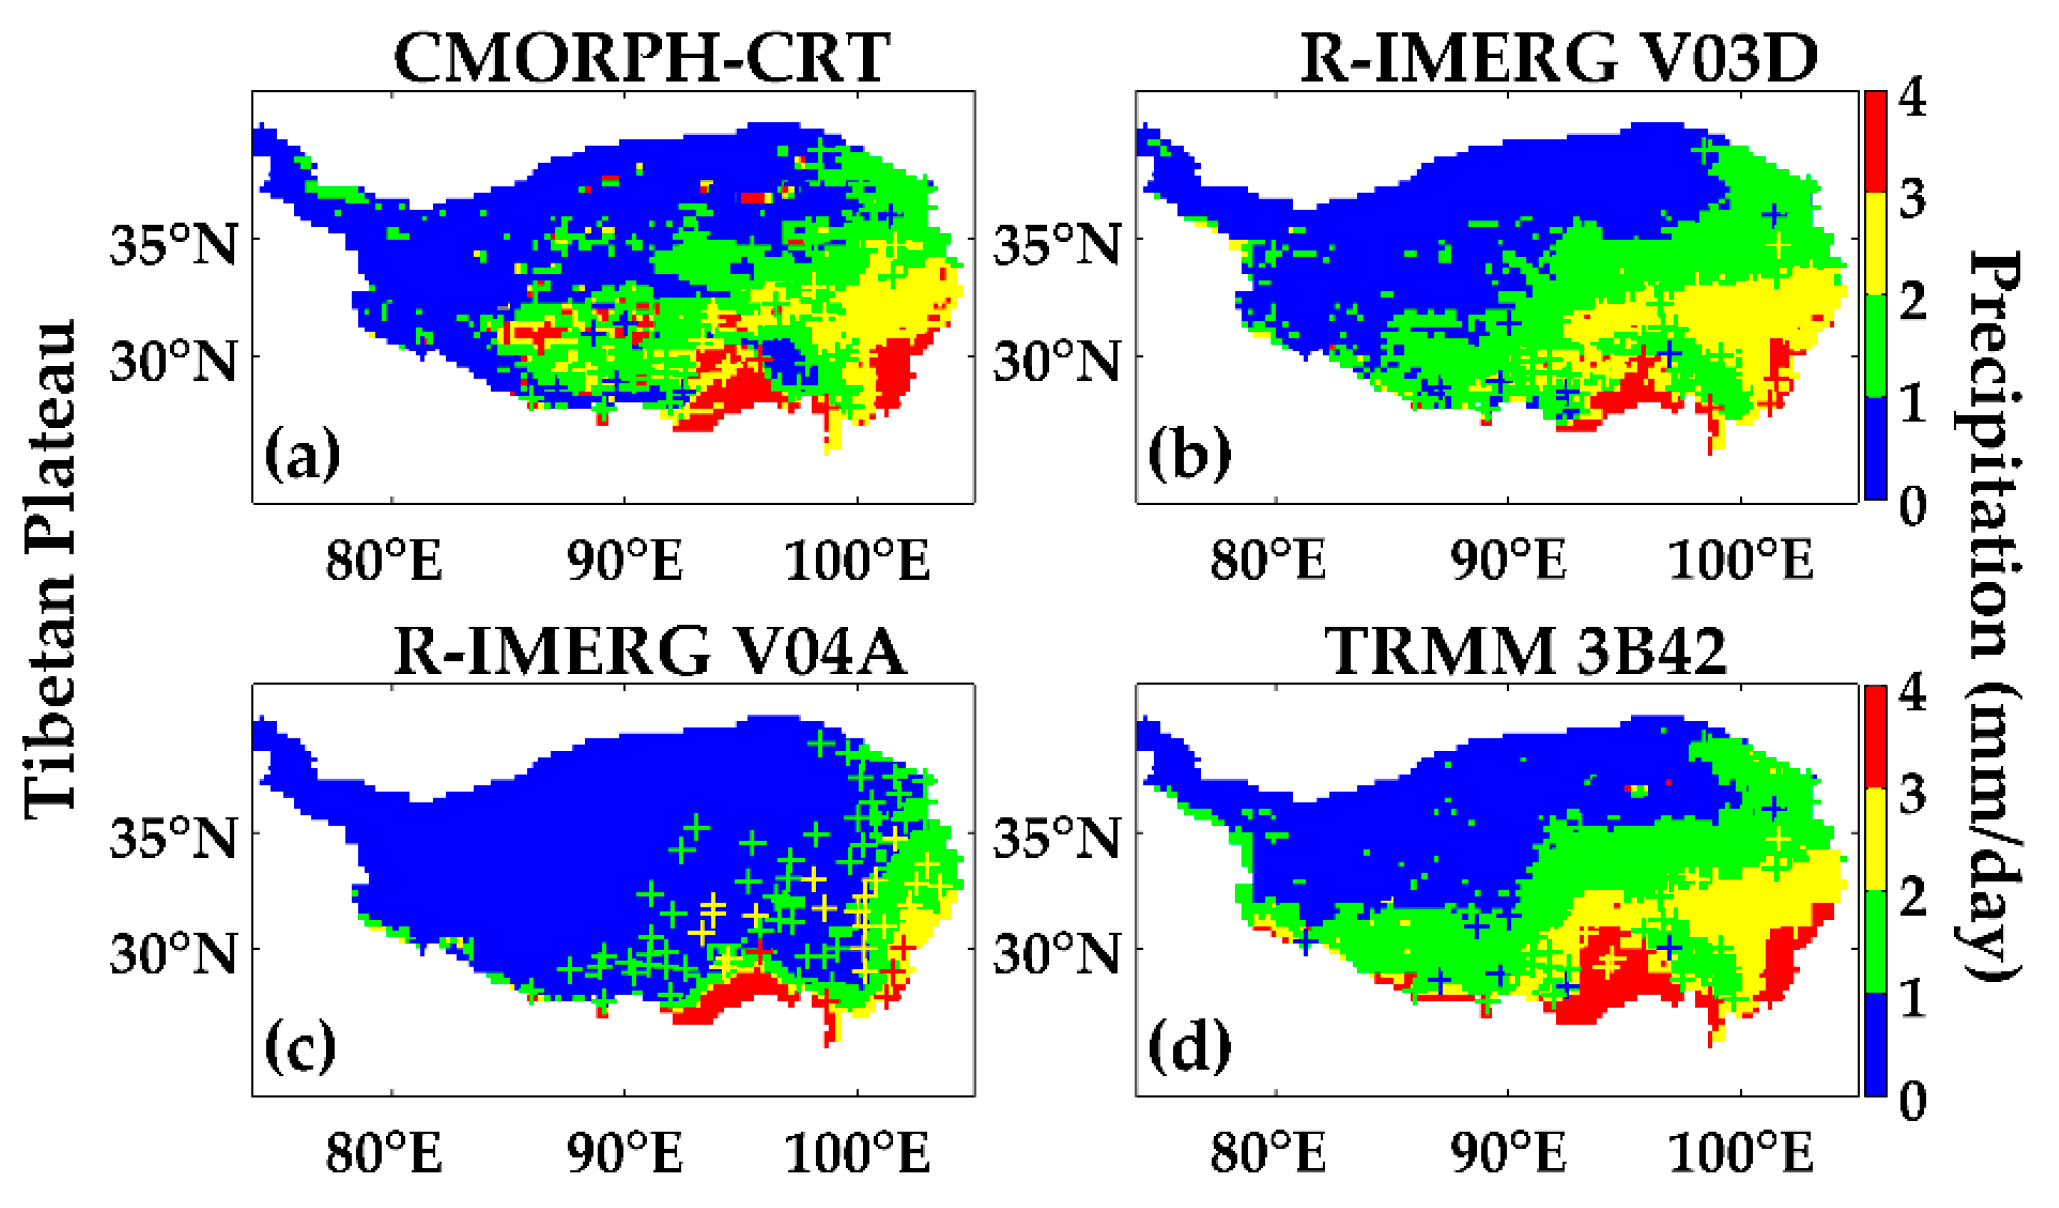
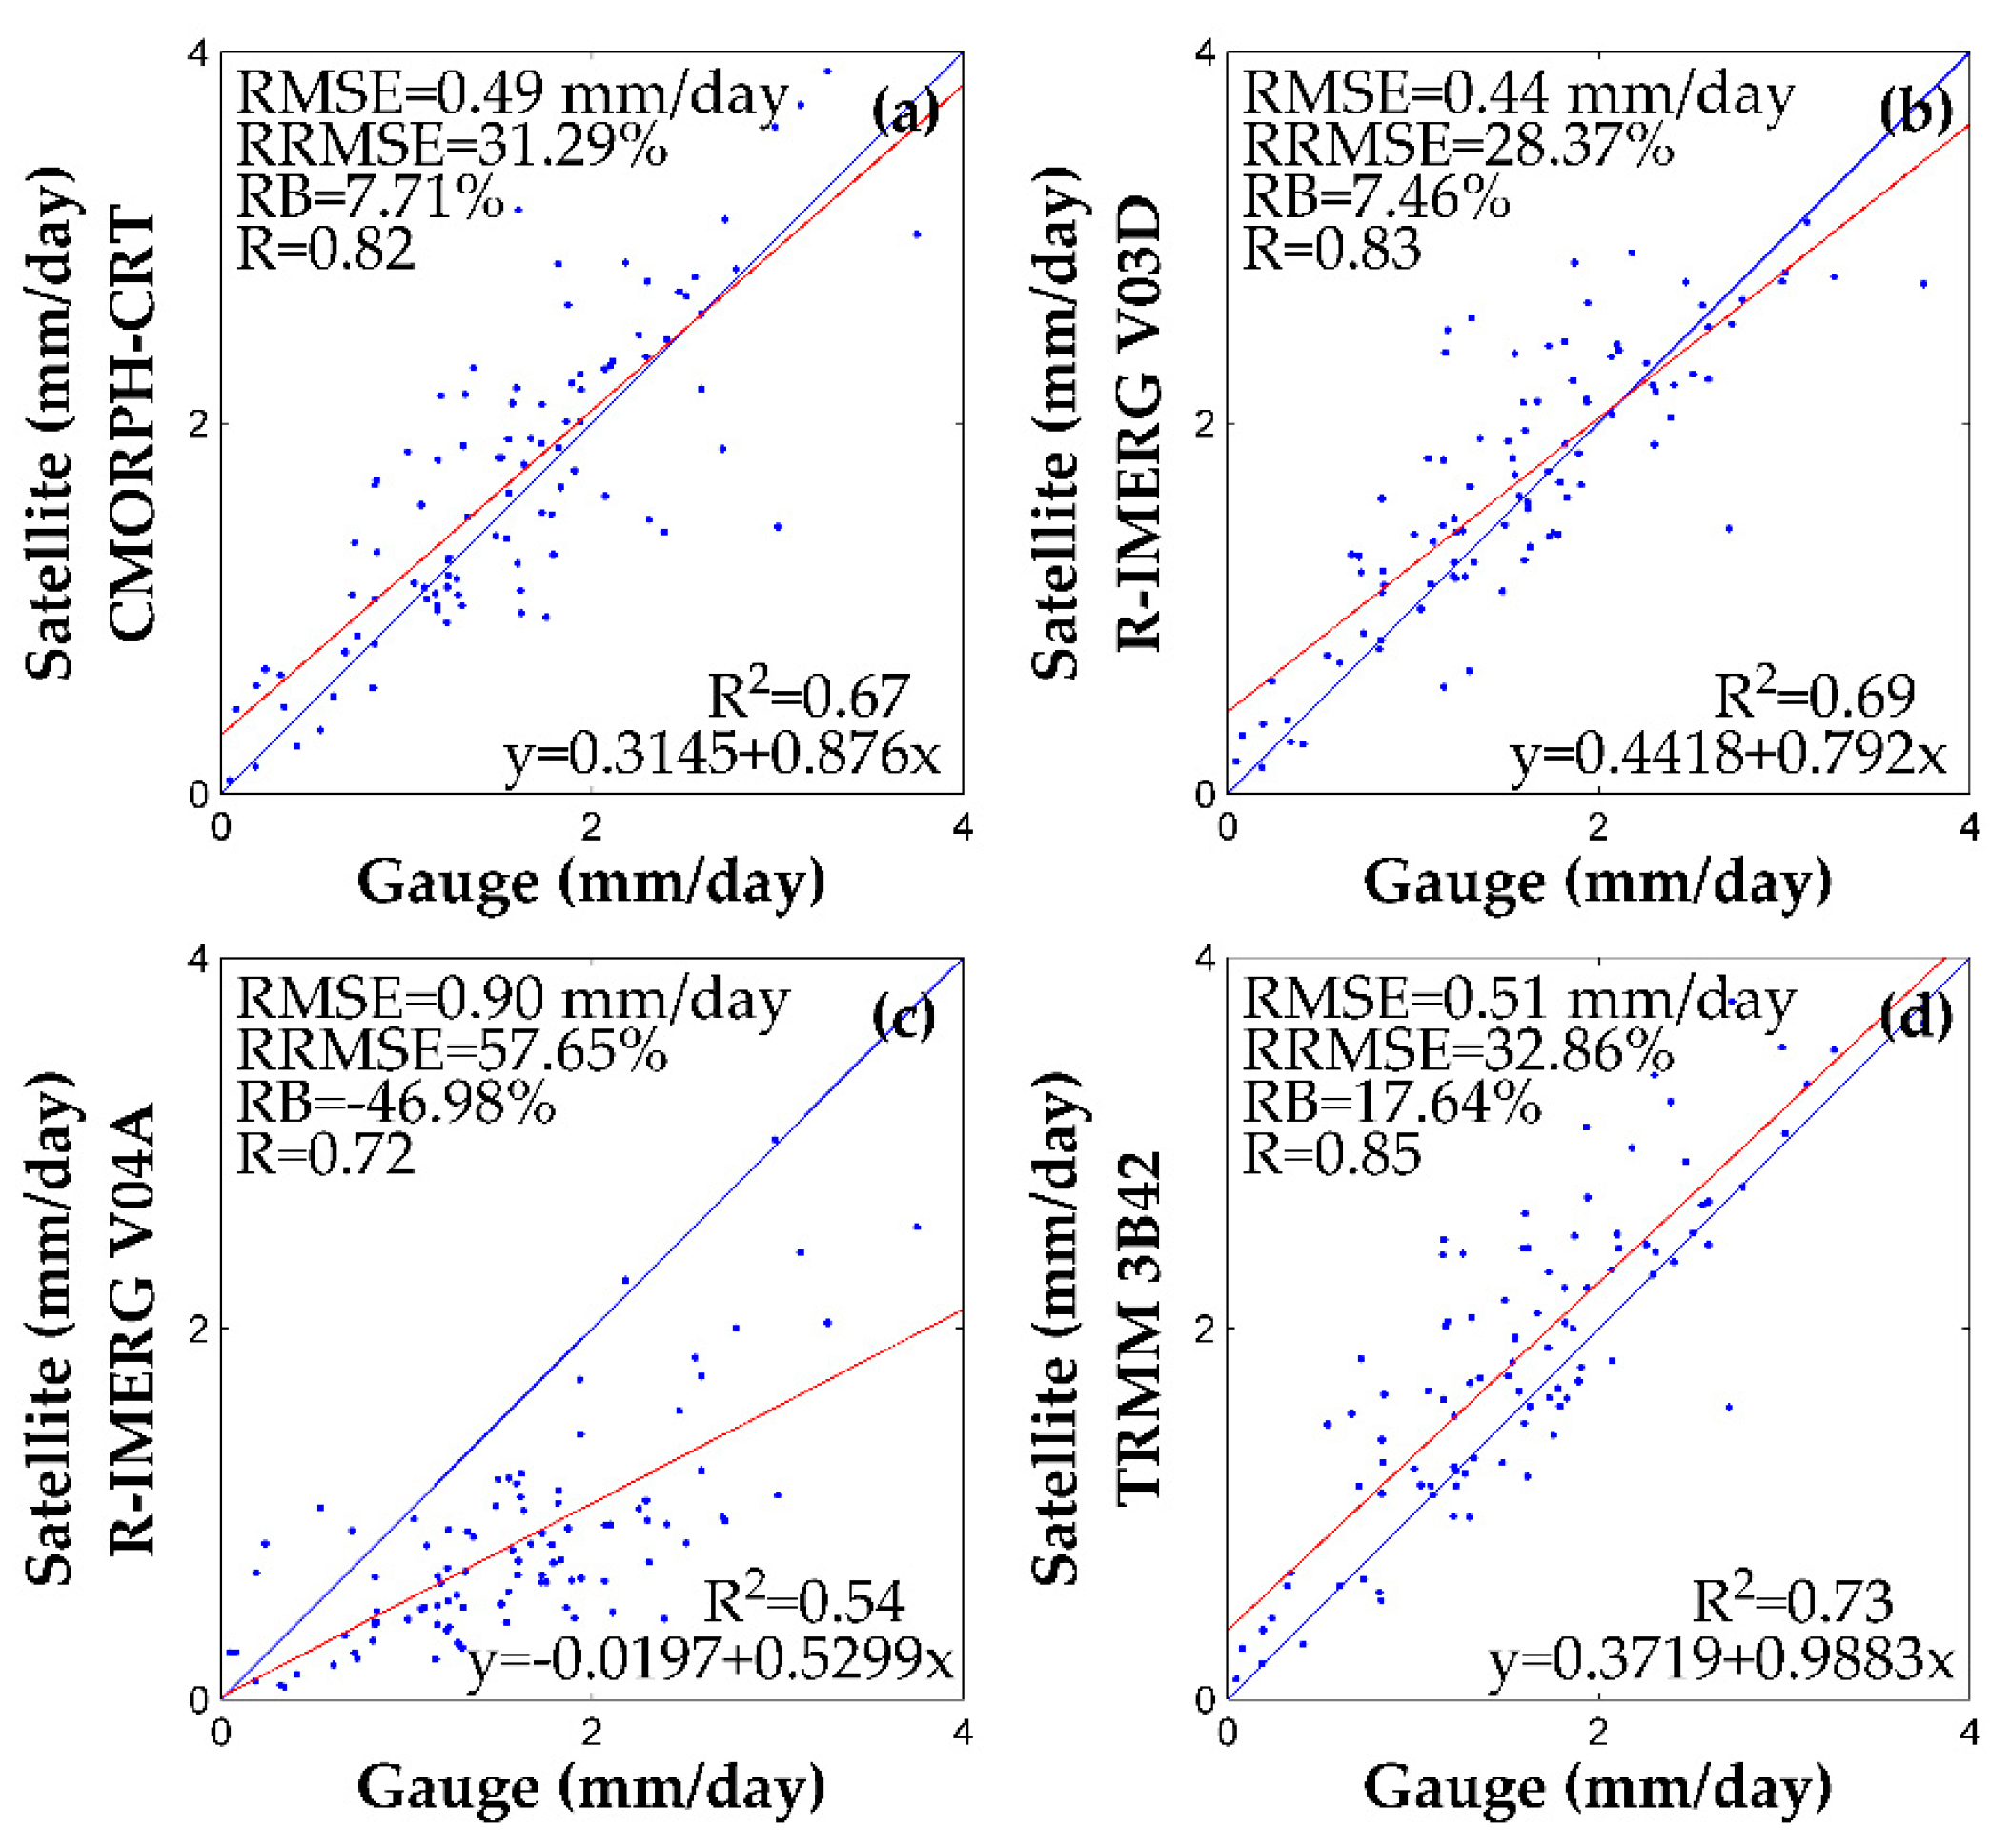
3.1. Tibetan Plateau

3.1.1. One and a Half Year Precipitation Analysis

According to Figure 2 and the average surface precipitation (0.6557 mm/day for R-IMERG V04A, 1.3748 mm/day for CMORPH-CRT, 1.2738 mm/day for R-IMERG V03D, 1.4725 mm/day for TRMM 3B42, respectively), with the exception of R-IMERG V04A, the other three satellite-based products show similar spatial patterns: precipitation generally increases from the northwest (daily average precipitation < 1 mm/day) to the southeast (daily average precipitation > 1.5 mm/day). CMORPH-CRT, R-IMERG V03D, and TRMM 3B42 have an advantage over R-IMERG V04A in capturing the gauged rainfall station distributed across the watershed. However, finer-scale differences can be observed between the products.
Over the Tibetan Plateau (Figure 2), the CMORPH-CRT (Figure 2a) and TRMM 3B42 (Figure 2d) precipitation estimates show very high accumulated maxima at sporadic individual pixels. These isolated grid points of anomalous high precipitation are more pronounced for CMORPH-CRT than for TRMM 3B42. Over the southern part of the Tibetan Plateau, TRMM 3B42 estimates show significantly more precipitation than the other three products. Compared with TRMM 3B42 and CMORPH-CRT, both R-IMERG V04A and R-IMERG V03D show lower precipitation totals over the southeastern part of the Tibetan Plateau. It is worth noting that, in comparison with the other three products, R-IMERG V04A shows the lowest precipitation estimates over the majority of the Tibetan Plateau. A comparison between R-IMERG V04A and TRMM 3B42 shows a significant difference in average surface precipitation between the two products (0.7 mm/day vs. 1.5 mm/day).
For the precipitation class range >2 mm/day, R-IMERG V04A and TRMM 3B42 show a remarkable difference in the frequency of daily average rainfall occurrence (5.9% vs. 24.9%) over the entire plateau. Likewise, for the precipitation class range <1 mm/day, R-IMERG V04A and TRMM 3B42 also demonstrate a notable difference in frequency of rainfall occurrence (83.4% vs. 42.4%). Therefore, at all intensities, frequency of precipitation occurrence values for R-IMERG V04A are significantly lower than TRMM 3B42 over the Tibetan Plateau.
Figure 3 shows scatterplots and fit metrics for the CMORPH-CRT, R-IMERG V03D, R-IMERG V04A and TRMM 3B42 products versus ground-based rain gauge observations for the quantitative comparison of mean daily precipitation over the Tibetan Plateau throughout the entire study period. The performance of CMORPH-CRT, R-IMERG V03D, and TRMM 3B42 are comparable. In particular, CMORPH-CRT, R-IMERG V03D and TRMM 3B42 all have relatively high Rs (0.82, 0.83 and 0.85, respectively), and relatively low RBs (7.71%, 7.46% and 17.64%, respectively), RMSEs (0.49, 0.44 and 0.51 mm/day, respectively) and RRMSEs (31.29%, 28.37% and 32.86%, respectively).
Unexpectedly, R-IMERG V04A tends to severely underestimate precipitation with the largest RB (−46.98%), RMSE (0.9 mm/day), and the lowest R (0.72) among all four products. There are 96 rain gauge stations in total on the Tibetan Plateau. At 88 of these stations, the R-IMERG V04A average daily precipitation values are lower than the average daily precipitation measured at the station. In addition, at 53 stations, the average daily precipitation of R-IMERG V04A is less than half that of the station. In the 24 stations with daily average precipitation data greater than 2 mm/day, 22 stations have higher precipitation than that of R-IMERG V04A. Therefore, over the Tibetan Plateau, R-IMERG V04A is significantly underestimating precipitation.

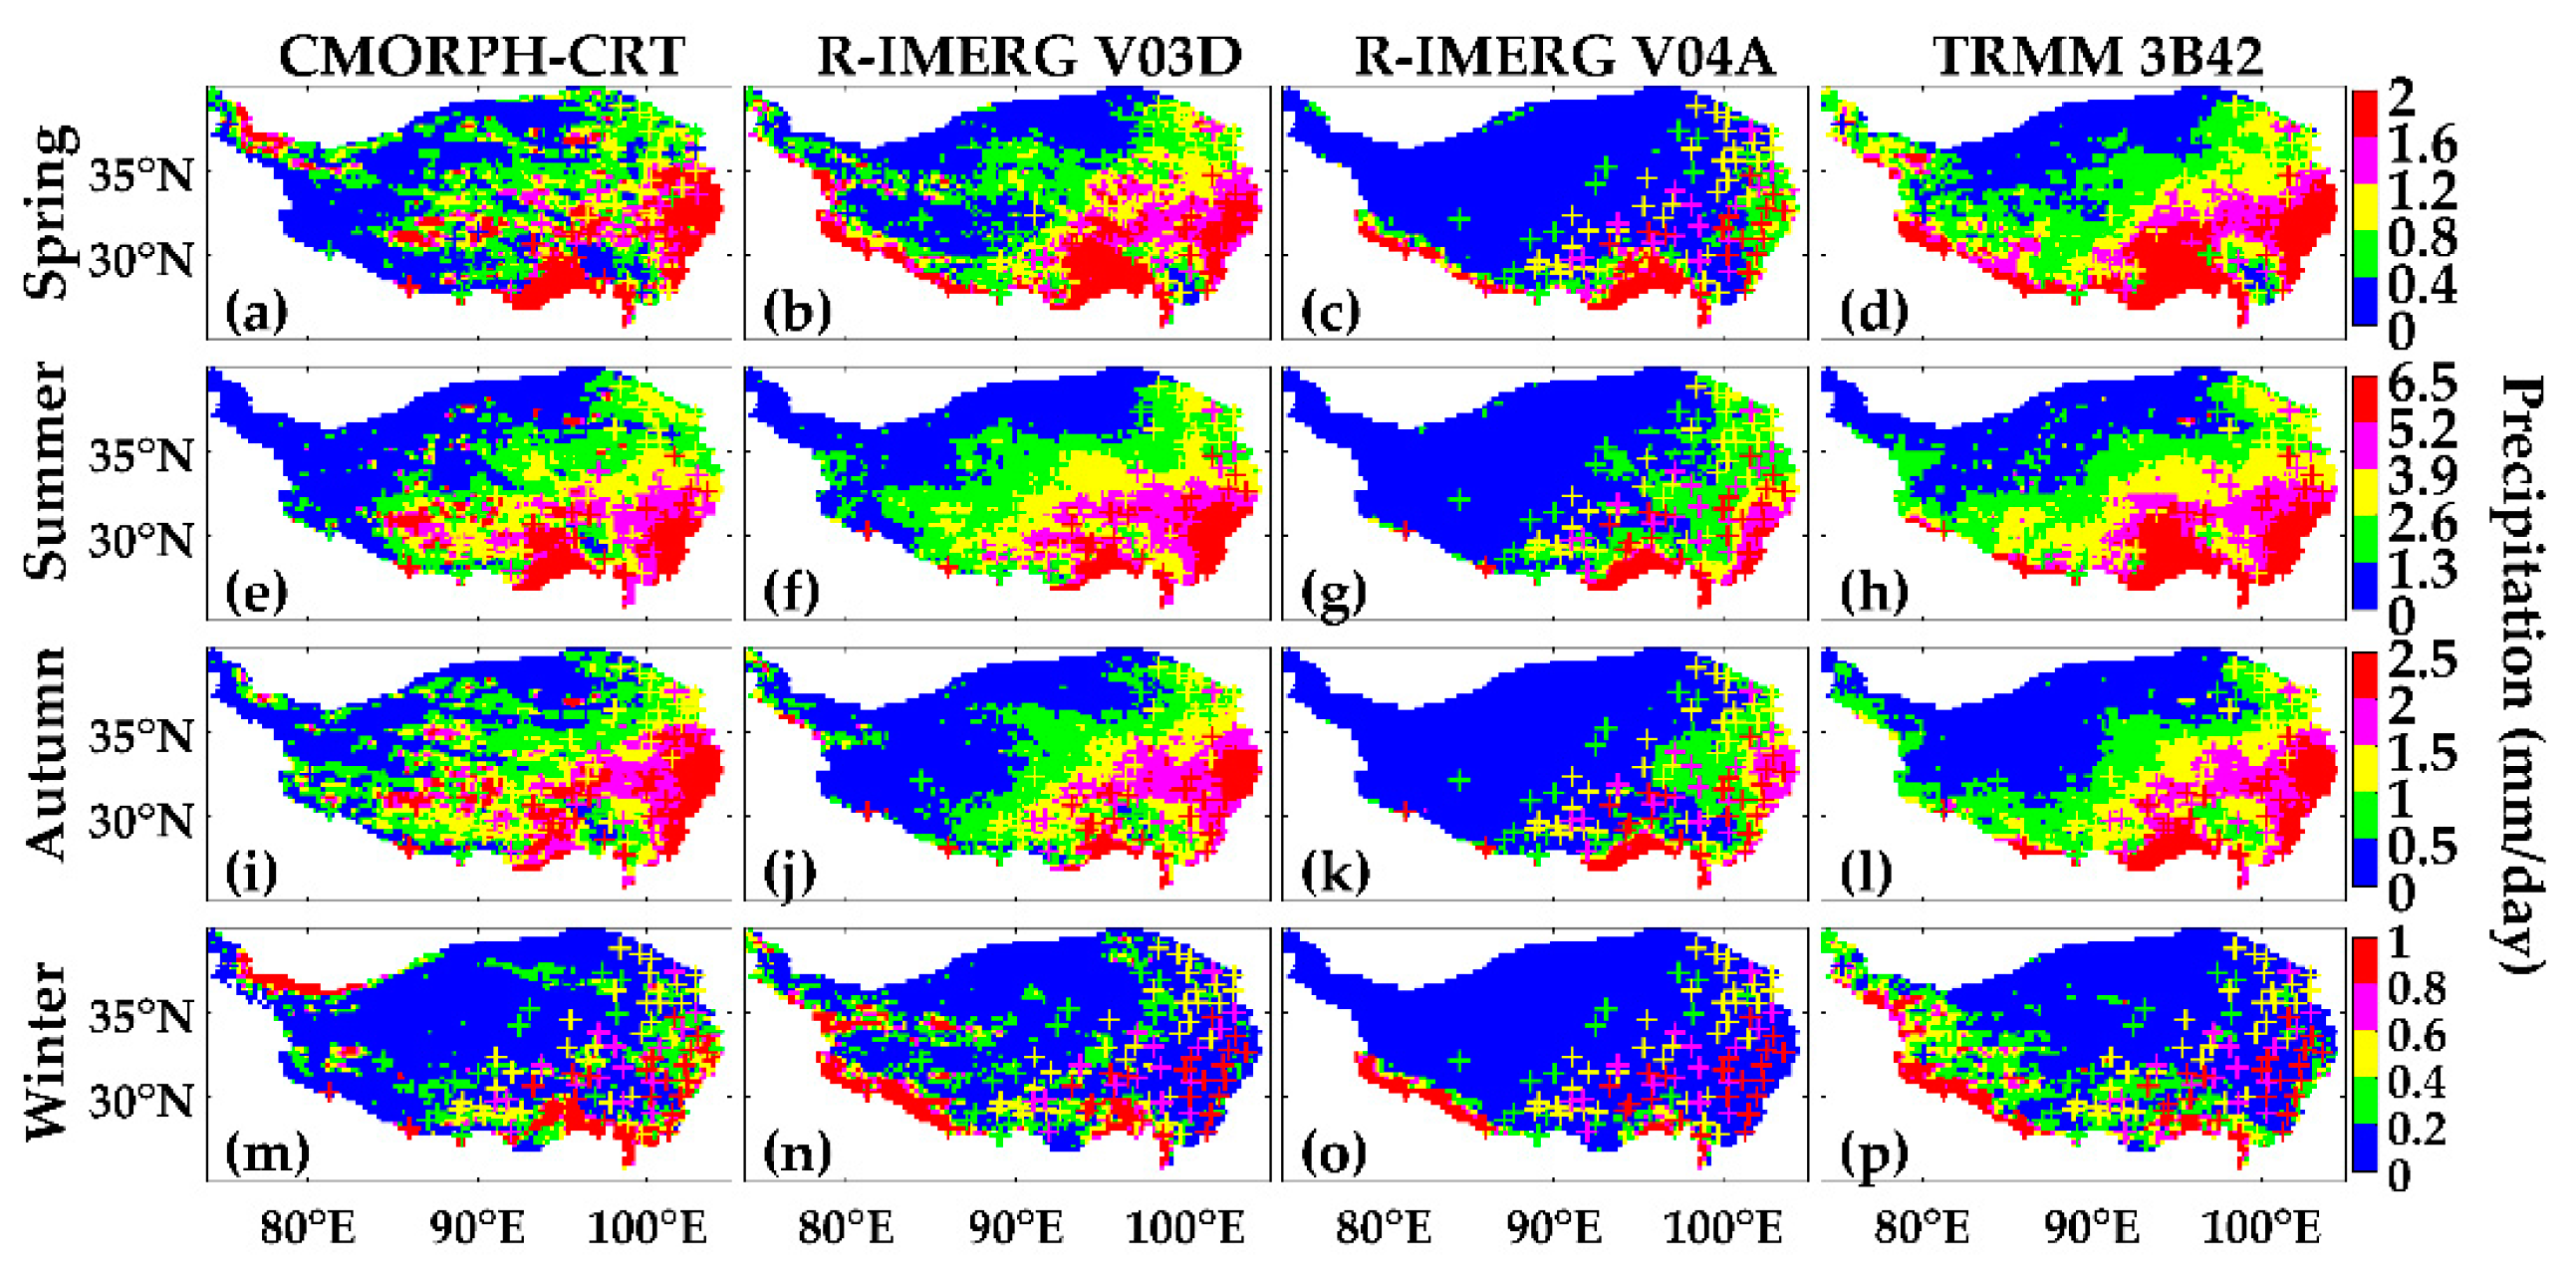
3.1.2. Seasonal Scale Precipitation Analysis

Over the Tibetan Plateau, seasonal spatial patterns of daily average CMORPH-CRT, R-IMERG V03D, R-IMERG V04A and TRMM 3B42 precipitation estimates for each season (during the period June 2014–November 2015) are shown in Figure 4. The pluses represent seasonal daily average precipitation (mm/day) of gauge precipitation estimates. The difference in spatial seasonal patterns of R-IMERG V03D (Figure 4b,f,j) and TRMM 3B42 (Figure 4d,h,l) gridded daily average precipitation is small for all three seasons according to Figure 4, the average surface precipitation (0.9043 mm/day vs. 1.0518 mm/day for spring, 2.4295 mm/day vs. 2.8434 mm/day for summer, 0.8034 mm/day vs. 0.899 mm/day for autumn, respectively), and the close seasonal daily average precipitation frequency of occurrence at different precipitation thresholds in Figure 5. In contrast, CMORPH-CRT (Figure 4a,m) shows more precipitation and less precipitation over the northwestern and southwestern parts of the Tibetan Plateau, respectively, during the dry season (spring and winter). Furthermore, as seen earlier during the one and a half year precipitation analysis, CMORPH-CRT (Figure 4a,e,i,m) and TRMM 3B42 (Figure 4d,h,l,p) contain isolated grid points of anomalously more precipitation in each season. Only during the dry season, the daily average precipitation depicted by R-IMERG V04A agrees well with R-IMERG V03D and TRMM 3B42 over the southwestern part of the Tibetan Plateau. On the other hand, in comparison with each of the other three satellite-based products, R-IMERG V04A consistently predicts the lowest daily average precipitation estimate in each season.
The important insight from Figure 4 is that the seasonal spatial patterns for R-IMERG V03D and TRMM 3B42 show an increase from the northwestern to southeastern geographic extremes of the Tibetan Plateau in all seasons, except for winter, where the precipitation in the northeastern part is less than that in the southwestern corner. Although R-IMERG V04A shows the same seasonal trends, this spatial relationship is not as evident.
To further examine the underestimation of precipitation by R-IMERG V04A in comparison with R-IMERG V03D, TRMM 3B42 and rain gauge observations, seasonal variations in the frequency of precipitation occurrence (i.e., daily rain/no-rain percentage) are discussed here. Seasonal daily average precipitation frequency of occurrence at different precipitation thresholds for R-IMERG V04A, R-IMERG V03D, TRMM 3B42 and rain gauge observations during the period June 2014–November 2015 are shown in Figure 5. From Figure 5, it is clear that, regardless of the season, R-IMERG V03D, TRMM 3B42 and rain gauge observations predict similar frequencies, except in winter, while there are clear differences between R-IMERG V04A and TRMM 3B42 across a range of precipitation intensity classes. Except in summer, the frequency of occurrence for R-IMERG V04A daily average precipitation is more than 62.5% (in winter, reaching a maximum of about 88.5%) for the smallest precipitation event class. For TRMM 3B42, the largest precipitation occurrence is found in the medium precipitation class, except in the summer, and the occurrence of daily average precipitation is more than 57.3% (in winter, reaching a maximum of 93.8%). For each season, in the lowest precipitation class, the frequency of occurrence for R-IMERG V04A daily average precipitation is more than twice that of TRMM 3B42, especially in winter where it is greater by a factor of nearly 42. The opposite situation occurs in the largest precipitation class regardless of the season, where the TRMM 3B42 daily average rainfall frequency is more than twice the frequency of occurrence for R-IMERG V04A. Overall, when compared with TRMM 3B42, R-IMERG V04A predicts less frequent precipitation across all seasons.
It is well known that the TRMM 3B42 product underestimates both low rain rates and cold season precipitation, due to its inability to detect non-liquid precipitation [20,21,22,30]. Therefore, the TRMM 3B42 underestimation of low rain rates may be partially due to the fact that the TRMM precipitation radar could not detect light rainfall and snowfall. This, in turn, may intensify differences in the frequency of precipitation occurrence between R-IMERG V04A and TRMM 3B42 across a range of precipitation intensity classes. Finally, Figure 5 also captures a remarkable difference between the two IMERG products. In general, the frequency of precipitation occurrence in IMERG V04A is significantly lower than that of IMERG V03D. At the same time, from Figure 5, it is clear that the R-IMERG V04A severely underestimates precipitation.
Seasonal differences in precipitation estimates derived from the CMORPH-CRT, R-IMERG V03D, R-IMERG V04A and TRMM 3B42 products against rain gauge observations over the Tibetan Plateau have been summarized in Figure 6. In the one-and-a-half-year precipitation analysis shown earlier in Figure 3c, R-IMERG V04A was shown to provide unreliable precipitation estimates within the plateau. Likewise, at the seasonal scale compared with R-IMERG V03D and TRMM 3B42, R-IMERG V04A exhibits the poorest performance versus rain gauge observations with the largest RMSEs (ranging from 0.25 mm/day in winter to 1.67 mm/day in summer), RBs (ranging from −42.86% in summer to −70.62% in winter), RRMSEs (ranging from 54.33% in summer to 167.74% in winter) and lowest Rs (ranging 0.58 in spring to 0.78 in autumn). Overall, R-IMERG V04A severely underestimates precipitation in all seasons, but especially in winter (with −70.62% RB). At the same time, precipitation estimates from TRMM 3B42 are higher than the gauge observations and exhibit positive RBs (from 14.24% in autumn to 26.9% in spring). The other three seasonal CMORPH-CRT precipitation estimates are also higher than gauge observations. During the spring and autumn, CMORPH-CRT precipitation estimates are relatively closer to the gauge observations. In the one-and-a-half-year precipitation analysis (which did not differentiate by season), R-IMERG V03D showed the best performance according to the RMSEs, RRMSEs and RBs metrics plotted in Figure 3a–d. In addition, based on Figure 6, it is clear that R-IMERG V03D has the lowest RMSEs, RBs and RRMSEs among R-IMERG V03D, R-IMERG V04A and TRMM 3B42 across all seasons.
During the wet season (summer and autumn), the RRMSEs for R-IMERG V03D and TRMM 3B42 are less than 34%. Generally, except for summer, the R-IMERG V03D product is the most reliable product across all seasons. Except for the winter, R-IMERG V03D can effectively capture seasonal patterns in precipitation. The absolute RRMSEs of R-IMERG V04A are over 54.33% for all seasons. Hence, generally speaking, R-IMERG V04A is unreliable in every season.
It is clear that RRMSEs during the wet season vary more between the various satellite products than during the dry season. However, note that differences between precipitation estimates from satellite and gauged datasets become larger during the winter. It is also noted that all the satellite-based precipitation products demonstrate their poorest performance in winter. In particular, R-IMERG V04A and CMORPH-CRT significantly underestimate or overestimate precipitation with RBs ranging between −70.62% and 71.52%, respectively. Although this situation is improved in TRMM 3B42, its RB is still about 22.9%—while the R-IMERG V03D product demonstrates relatively small RB (−6.47%). This underestimation by the two IMERG products may be influenced by the presence of snow and ice-covered surfaces in winter, which degrades the performance of PMW-based retrieval algorithms.

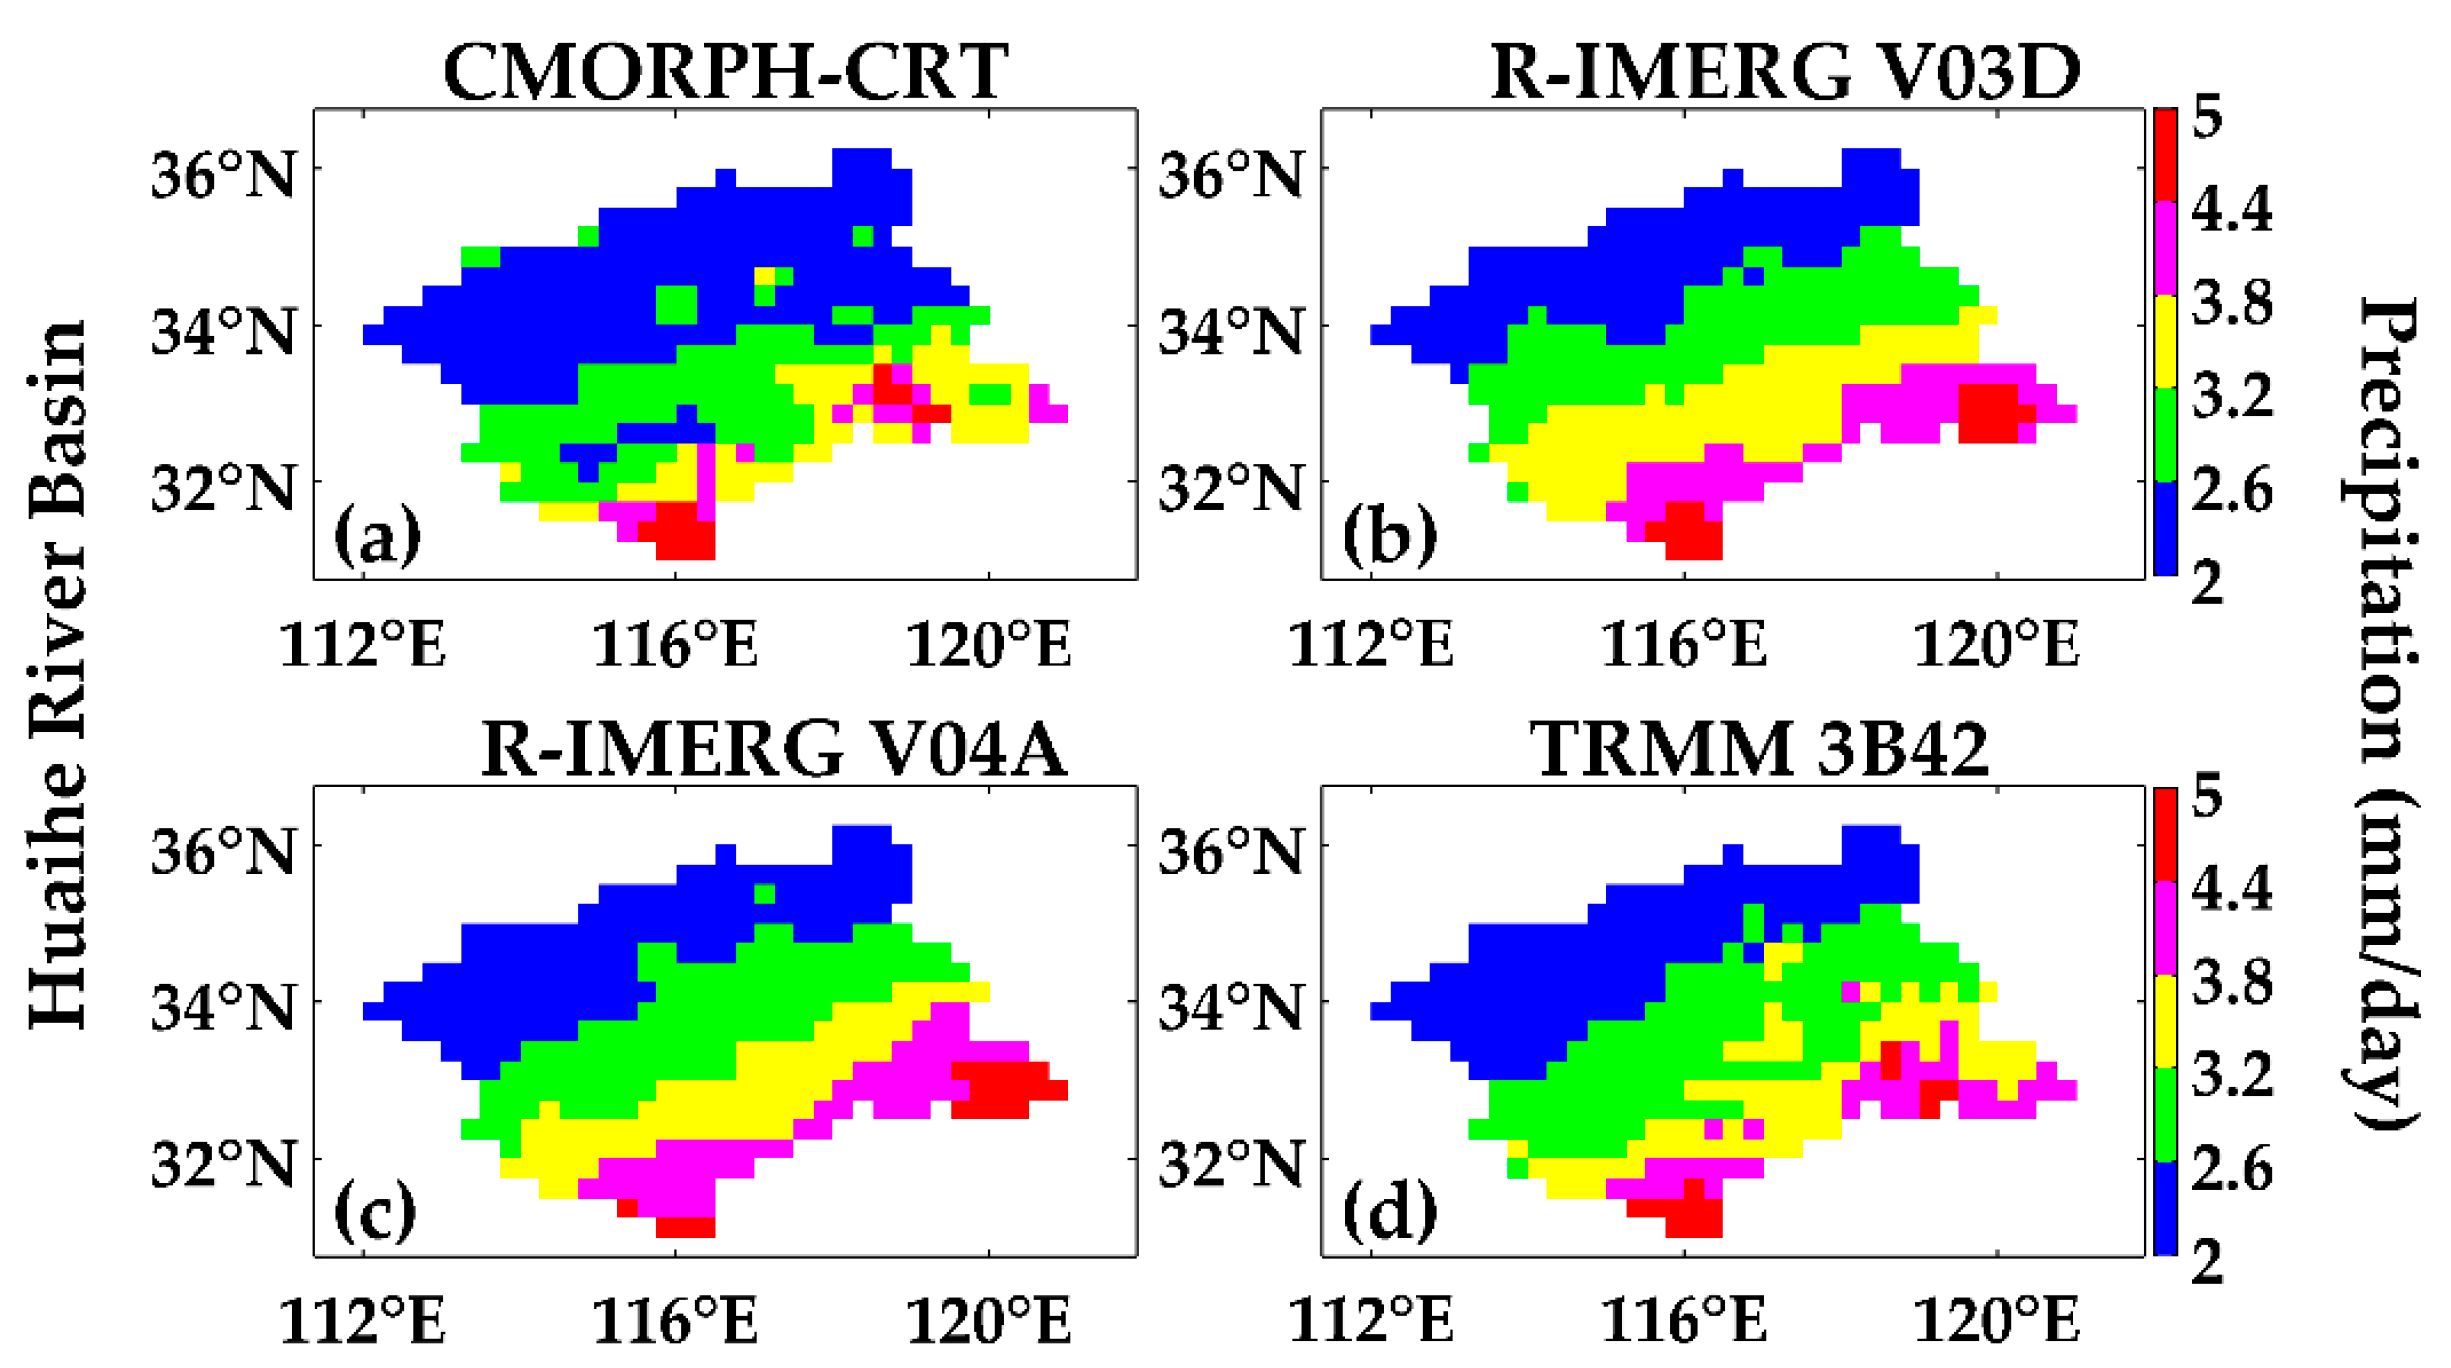
3.2. Huaihe River Basin

3.2.1. One and a Half Year Precipitation Analysis

Figure 7 shows the daily average precipitation estimates derived from the four satellite-based products over the Huaihe River Basin. As shown in Figure 7, compared with the other three products, the CMORPH-CRT product shows less precipitation over the central Huaihe River Basin (Figure 7a). However, R-IMERG V04A agrees well with TRMM 3B42 since, over the entire basin, the two products exhibit only very small average precipitation differences (3.1 mm/day vs. 3 mm/day). For the precipitation class range >3.5 mm/day, R-IMERG V04A and TRMM 3B42 demonstrate only small differences in the frequency of daily average precipitation occurrence (27.3% vs. 21.3%). In addition, for the precipitation class range <2.5 mm/day, R-IMERG V04A and TRMM 3B42 demonstrate only a slight difference in the frequency of occurrence (26.1% vs. 28.8%). Based on this and Figure 7b–d, it is clear that R-IMERG V04A, R-IMERG V03D and TRMM 3B42 show very similar spatial patterns in long-term, daily-average precipitation estimates.
Figure 8 shows scatterplots of the four satellite-based products against ground-based gauge observations for the quantitative comparison of mean daily precipitation over the Huaihe River Basin for the study period. Compared to their performance over the Tibetan Plateau, all four satellite-based products perform relatively well over the Huaihe River Basin and agree well with the rain gauge observations. In particular, both R-IMERG V03D and R-IMERG V04A have a high R (0.97 and 0.96, respectively) and low RMSE (0.34 and 0.32 mm/day, respectively), RRMSE (11.81% and 11.24%, respectively). However, both retain relatively high RB (9.61% and 8.63%, respectively). Among all four products, R-IMERG V04A demonstrates the best performance in terms of both RMSE and RRMSE.

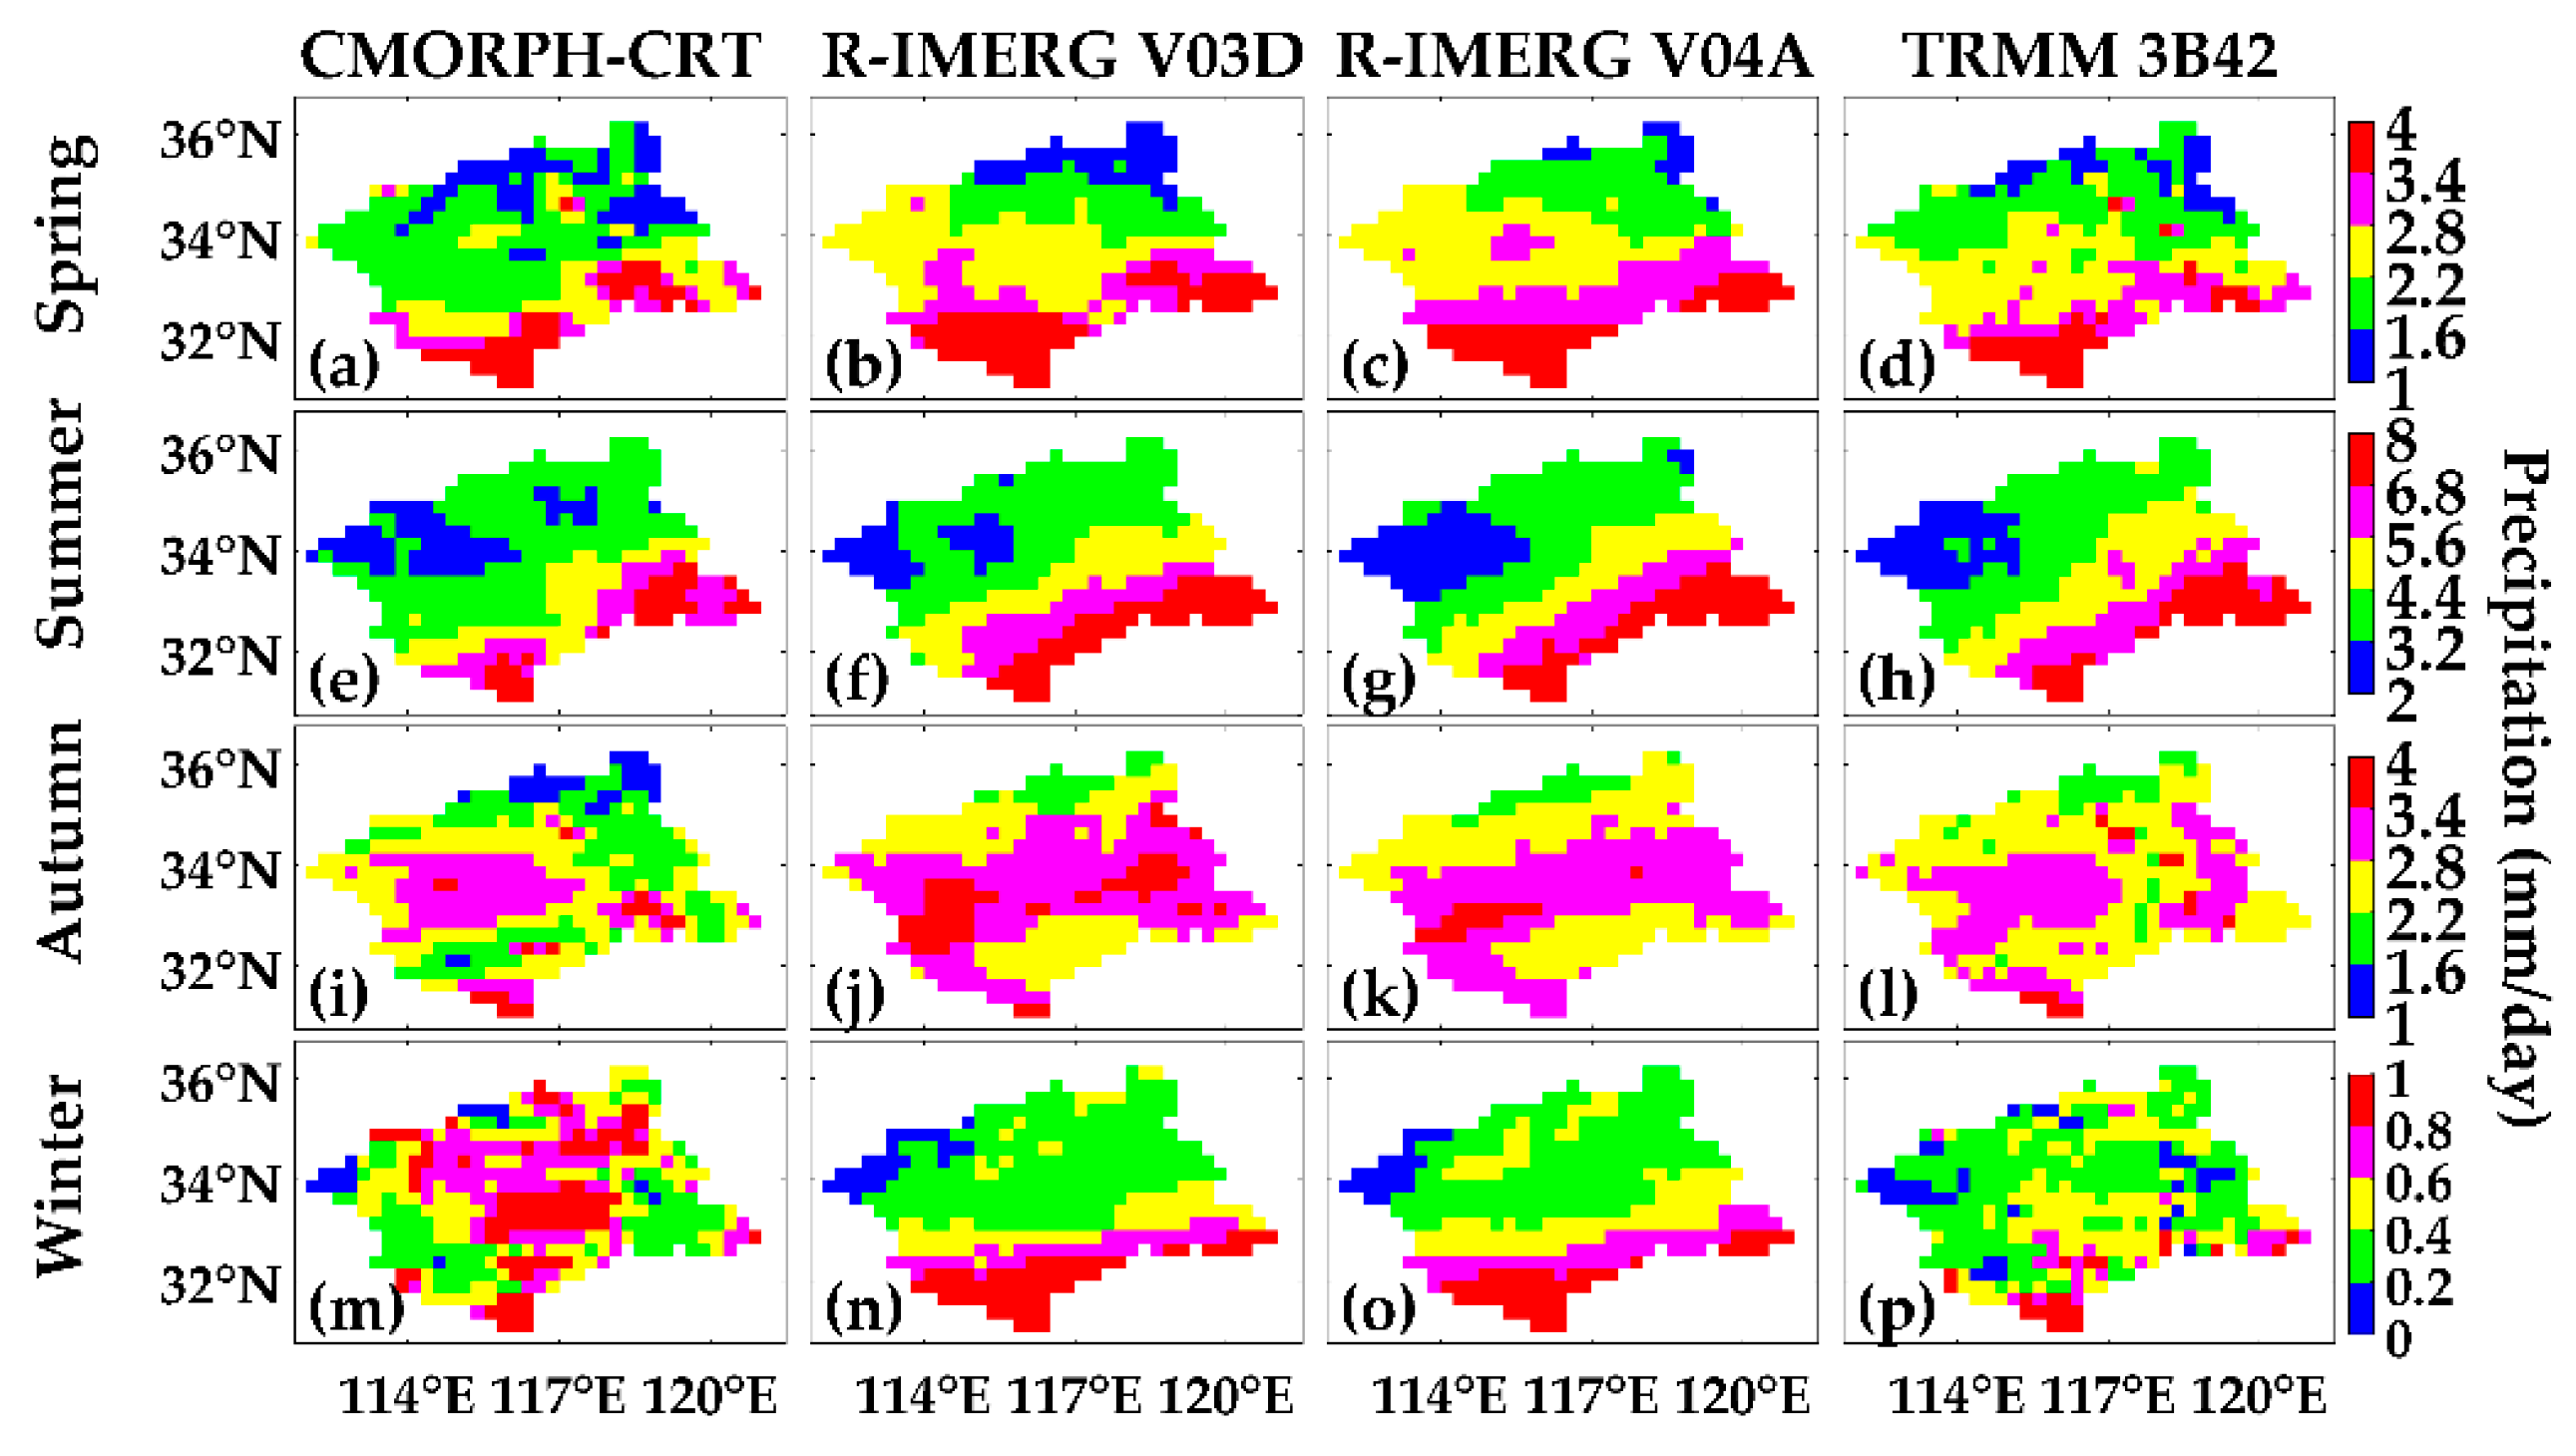
3.2.2. Seasonal Scale Precipitation Analysis

Within the Huaihe River Basin, seasonal spatial patterns of daily average CMORPH-CRT, R-IMERG V03D, R-IMERG V04A and TRMM 3B42 precipitation estimates for each season (during the period June 2014–November 2015) are shown in Figure 9. Precipitation rates peak in summer with slightly lower amounts falling during autumn.
During spring, compared with R-IMERG V03D (Figure 9b) over the northern part of the Huaihe River Basin, R-IMERG V04A (Figure 9c) predicts slightly more precipitation. R-IMERG V03D (Figure 9b,f,j), R-IMERG V04A (Figure 9c,g,k,) and TRMM 3B42 (Figure 9d,h,l) show very small season daily average surface precipitation differences (2.6293 mm/day, 2.6968 m/day, 2.4524 mm/day for spring, 4.7992 mm/day, 4.8096 mm/day, 4.8 mm/day for summer, 2.9253 mm/day, 2.8098 mm/day, 2.6953 mm/day for autumn, respectively). During winter, R-IMERG V03D (Figure 9n) and R-IMERG V04A’s (Figure 9o) daily average surface precipitation are 0.4978 mm/day, 0.4967 mm/day, respectively. Specifically, both of them show more rainfall in the southern portion of the basin relative to CMORPH-CRT (Figure 9m) and TRMM 3B42 (Figure 9p). It can be seen that R-IMERG V03D (Figure 9j) estimates slightly more precipitation estimate than both CMORPH-CRT (Figure 9i) and TRMM 3B42 (Figure 9l) during autumn. Compared with the other three products, CMORPH-CRT precipitation is at a lower level in all seasons, except for winter. In addition, CMORPH-CRT (Figure 9m) shows more precipitation than other three satellite-based products within the central to the northern part of the basin in winter. It should be pointed out that CMORPH-CRT (Figure 9a,i,m) and TRMM 3B42 (Figure 9d,l,p) predict a large number of isolated grid points with anomalously high precipitation values.
Seasonal differences in precipitation estimates derived from the four satellite-based products against rain gauge observations over the Huaihe River Basin are shown in Figure 10. Based on calculated RBs for each product, it is clear that all four satellite-based precipitation estimates are higher than the rain gauge observations for all seasons, except CMORPH-CRT, which underestimates precipitation during autumn relative to the gauge observations.
Based on calculated RMSEs, RRMSEs, and RBs in Figure 8b,c, R-IMERG V04A shows a slight advantage over R-IMERG V03D during the one and a half year analysis. At the seasonal scale, the performance of R-IMERG V04A is close to R-IMERG V03D in terms of Rs in spring (0.93 vs. 0.91), summer (0.96 vs. 0.95), autumn (0.81 vs. 0.85) and winter (0.92 vs. 0.95), while R-IMERG V04A is slightly superior to R-IMERG V03D based on RMSEs sampled during the spring (0.5509 mm/day vs. 0.5515 mm/day), summer (0.6 mm/day vs. 0.66 mm/day) and winter (0.1723 mm/day vs. 0.21 mm/day). However, R-IMERG V04A is slightly inferior to R-IMERG V03D during autumn (0.44 mm/day vs. 0.4 mm/day). It can be seen that both IMERG precipitation products are superior to TRMM 3B42 in terms of RMSEs, RRMSEs and Rs during the one-and-a-half-year precipitation analysis. At the seasonal scale, in comparison with R-IMERG V03D and R-IMERG V04A, TRMM 3B42 exhibits a worse performance in terms of Rs and RMSEs during the wet season, while TRMM 3B42 performs better—in an RMSE sense—during the dry season.
Except for winter, when the RRMSEs of CMORPH-CRT (Figure 10m) and R-IMERG V03D (Figure 10n) are greater than 50%, the RRMSE values of all other satellite-based products are less than 44.08% for all seasons, especially during spring, summer and autumn, when RRMSE values for all satellite-based products are below 25%. These findings indicate that satellite-based precipitation estimates are generally reliable, except for the specific instances noted above. The results for the Huaihe River Basin are also consistent with the earlier results for the Tibetan Plateau (see Section 3.1) in that summer precipitation estimates are the most reliable, while winter estimates are the least.

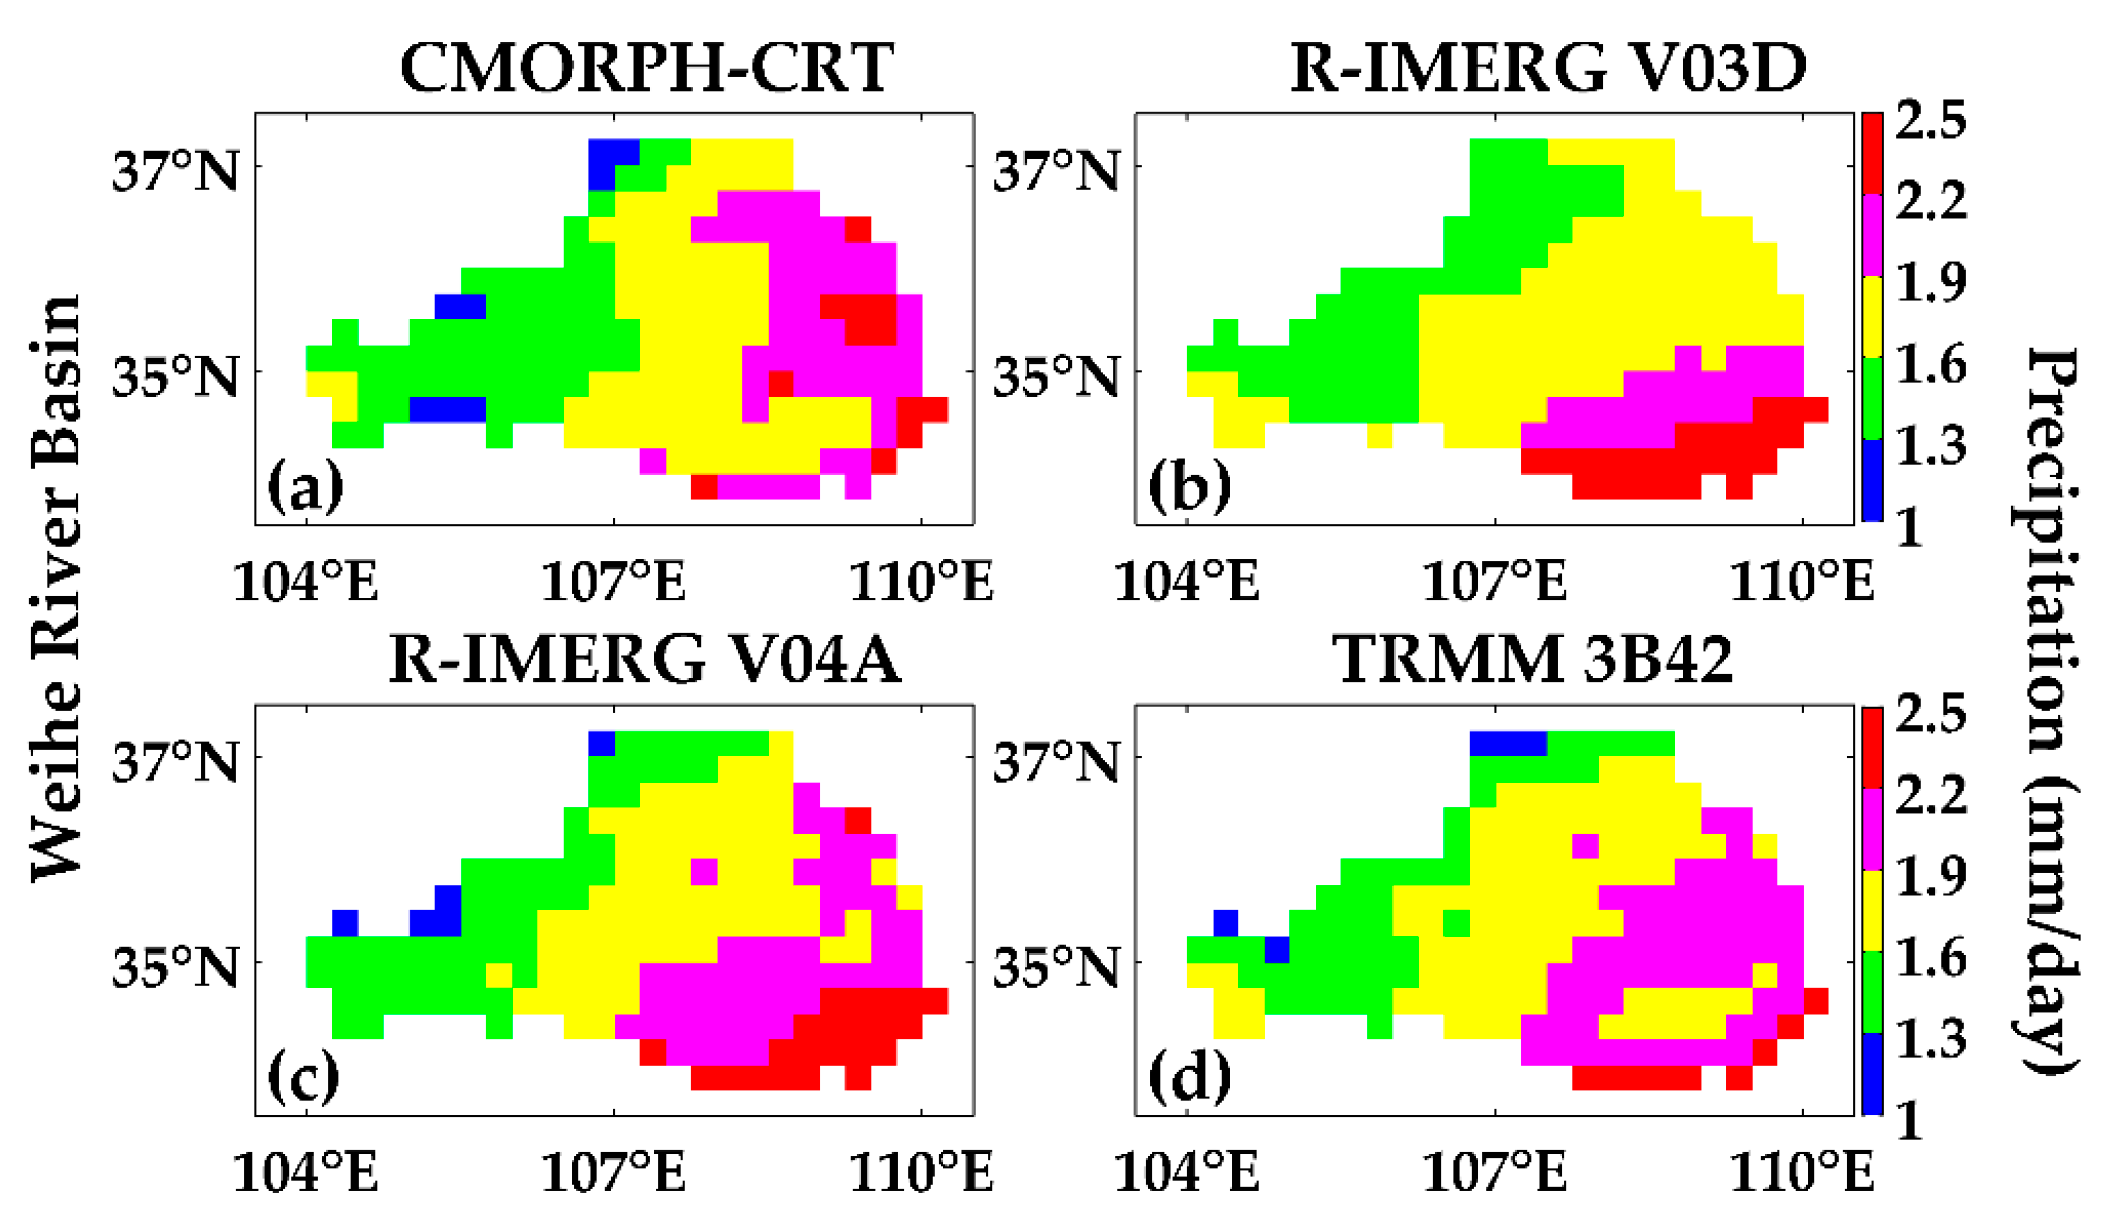
3.3. Weihe River Basin

3.3.1. One and a Half Year Precipitation Analysis

Figure 11 shows the mean daily precipitation estimates derived from the four satellite-based products over the Weihe River Basin. As shown in Figure 11, over the southern part of the Weihe River Basin (Figure 11a–d), both R-IMERG V03D and R-IMERG V04A show a slightly higher daily average precipitation estimate relative to CMORPH-CRT and TRMM 3B42. Among the remote sensing-based products, CMORPH-CRT predicts slightly more precipitation over the eastern Weihe River Basin. R-IMERG V04A and TRMM 3B42 exhibit a rather small difference in the average daily precipitation (1.81 mm/day vs. 1.78 mm/day) over the entire basin. For the precipitation class range >2 mm/day, R-IMERG V04A and TRMM 3B42 show only small differences in the frequency of daily average precipitation occurrence (23.6% vs. 17.5%). In addition, for the precipitation class range <1.5 mm/day, R-IMERG V04A and TRMM 3B42 demonstrate only a small difference in the frequency of daily average precipitation occurrence (18.9% vs. 15.6%). Generally, R-IMERG V04A tends to exhibit a slightly higher daily average precipitation estimate relative to TRMM 3B42 over the Weihe River Basin.
Figure 12 shows scatter plots of the four satellite-based products against ground-based gauge observations for the quantitative comparison of mean daily precipitation over the Weihe River Basin throughout the full study period. For all products within the Weihe River Basin, RMSEs are less than 0.14 mm/day, RBs are lower than 4.96%, RRMSEs are lower than 11.98%, and Rs are greater than 0.77. TRMM 3B42 demonstrates the best performance among the four satellite-based precipitation estimates according to all statistical metrics, except for RB.

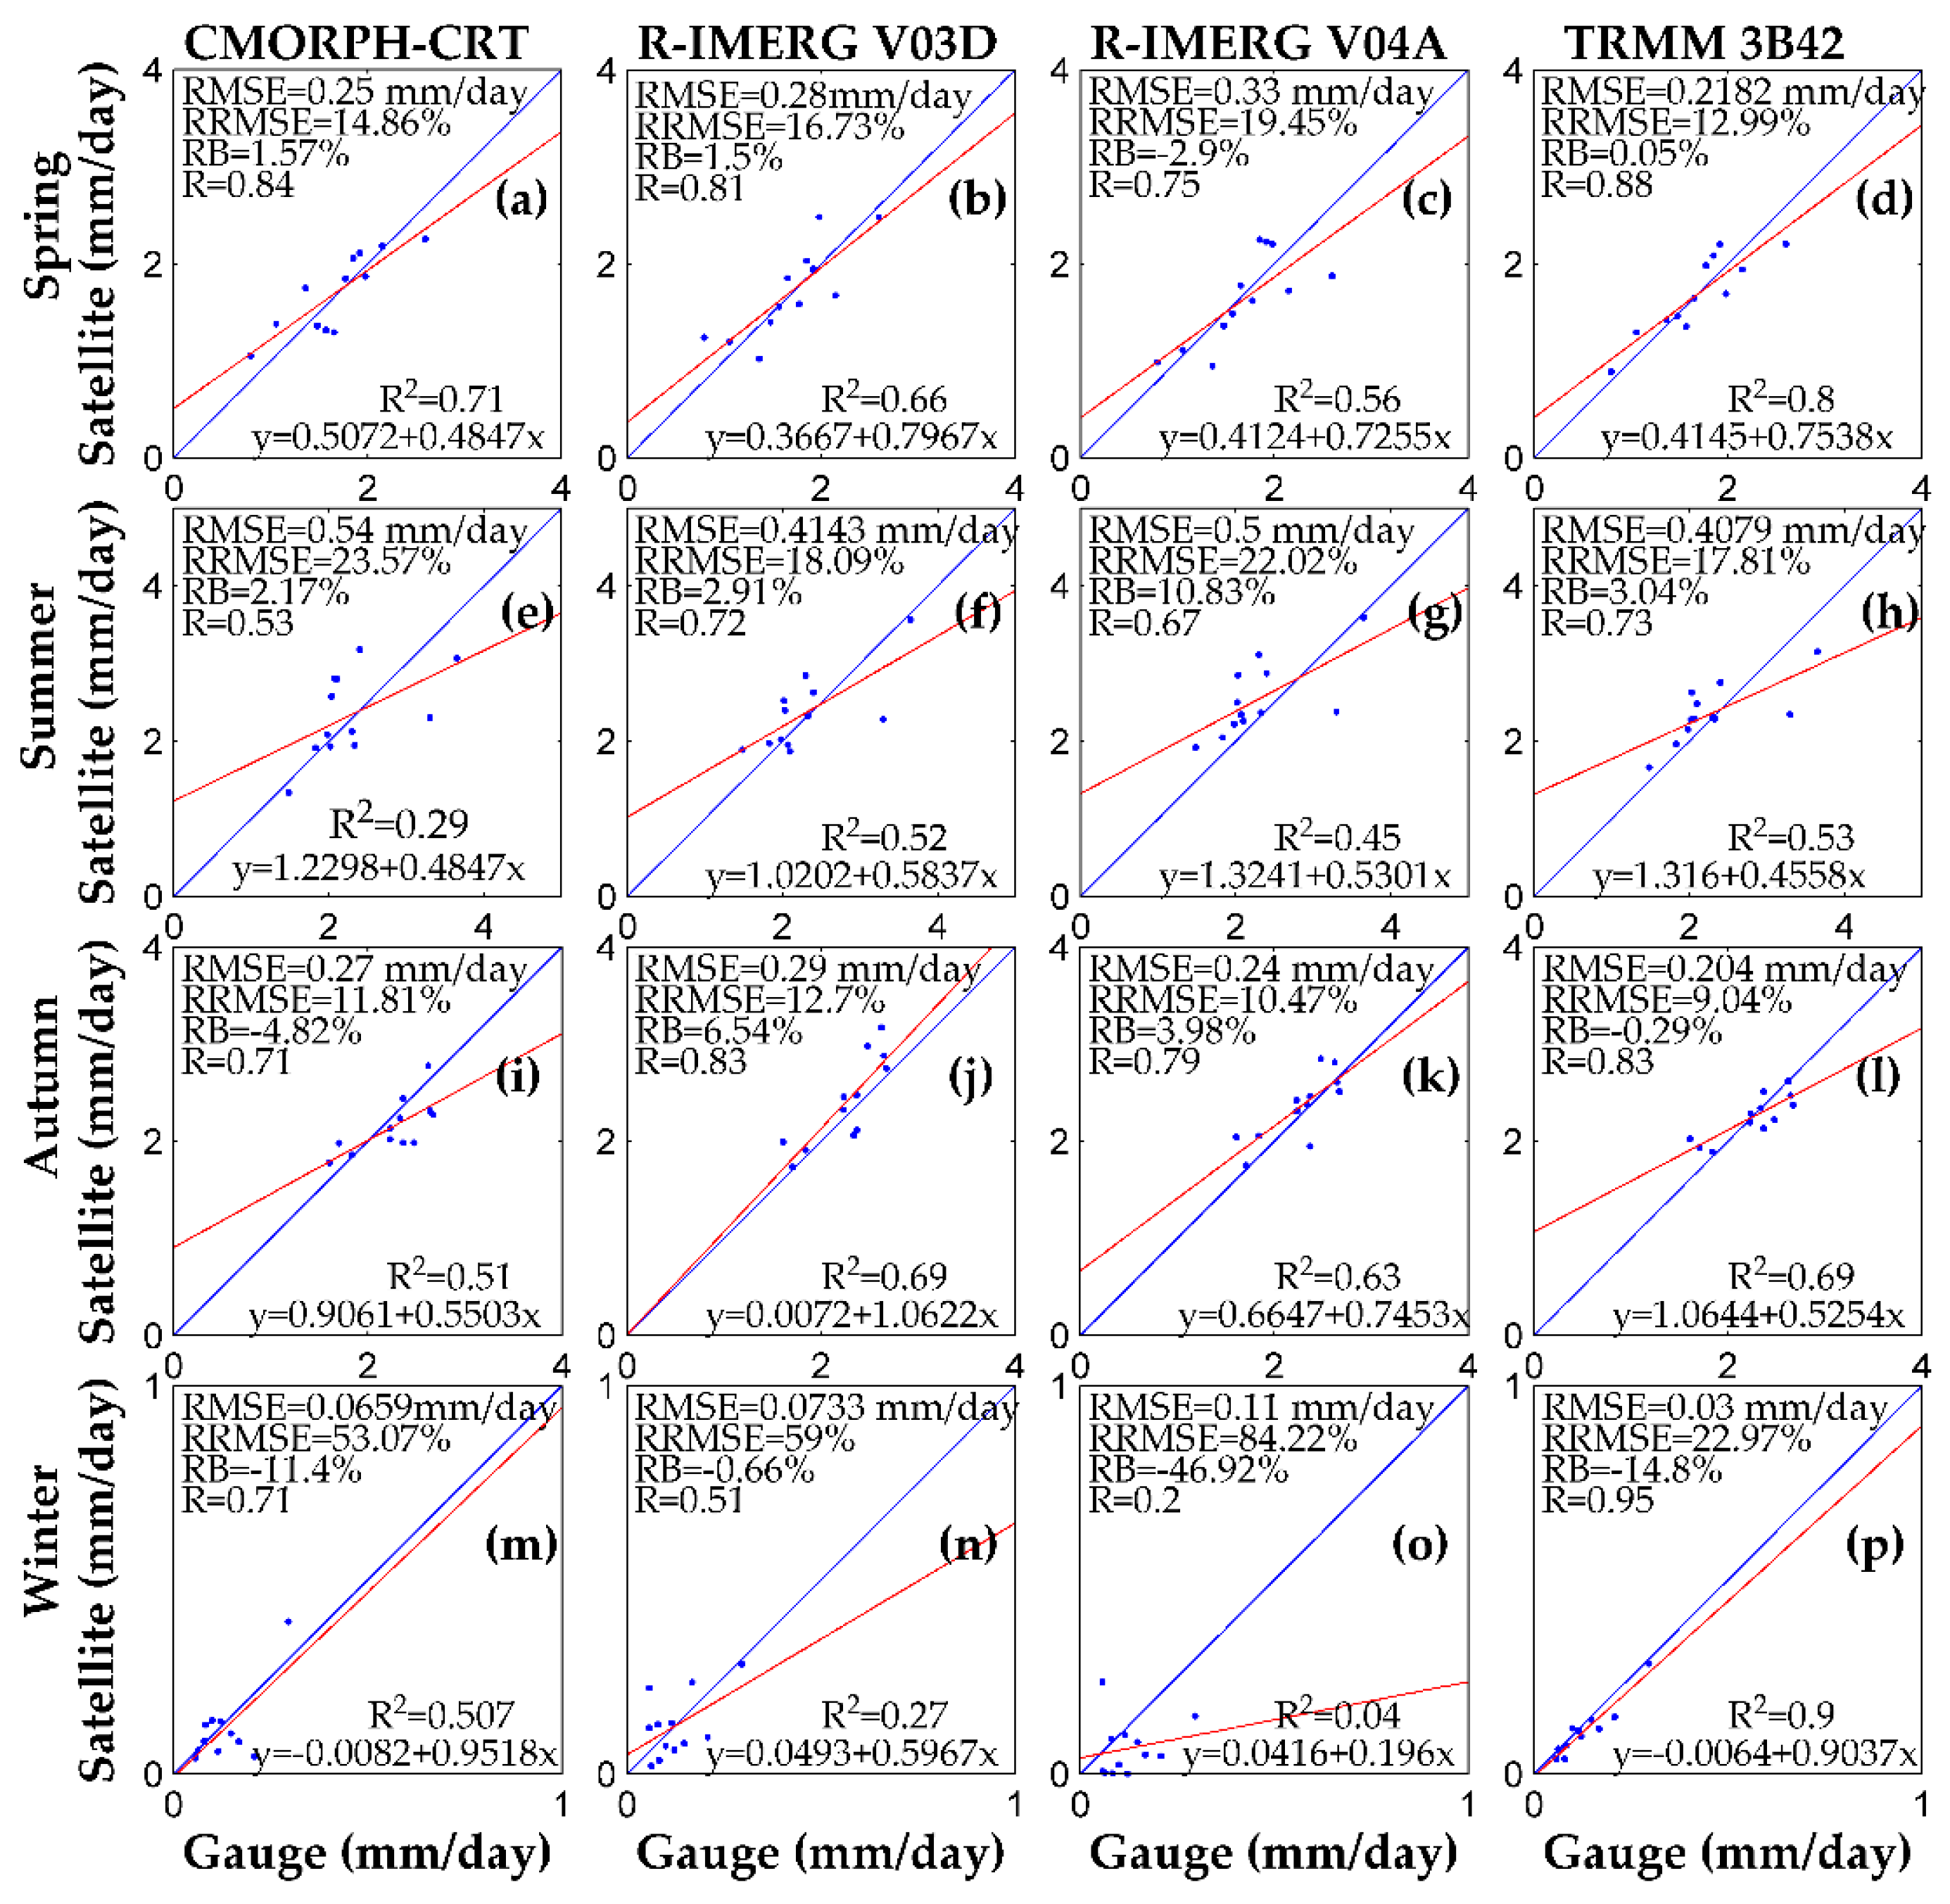
3.3.2. Seasonal Scale Precipitation Analysis

Within the Weihe River Basin, seasonal spatial patterns of the daily average CMORPH-CRT, R-IMERG V03D, R-IMERG V04A and TRMM 3B42 precipitation estimates are plotted in Figure 13 for each of the four seasons during the period June 2014–November 2015.
Compared with the two IMERG products, TRMM 3B42 (Figure 13d), CMORPH-CRT (Figure 13a) daily average precipitation estimates in spring are relatively higher over the southeastern part of the basin. During summer, in comparison with R-IMERG V03D (Figure 13f), R-IMERG V04A (Figure 13g) shows more precipitation in the eastern part of the basin. While TRMM 3B42 (Figure 13h) precipitation estimates are slightly higher in the southern part of the basin, CMORPH-CRT (Figure 13e) exhibits less precipitation across the southern part of the basin, but more precipitation in the northeastern part of the basin. During autumn, in comparison with R-IMERG V04A (Figure 13k), R-IMERG V03D (Figure 13j) shows less precipitation in the northeastern portion of the basin, while TRMM 3B42 (Figure 13l) and CMORPH-CRT (Figure 13i) exhibit less precipitation in the southeastern part. During winter, compared with TRMM 3B42 (Figure 13p), R-IMERG V03D (Figure 13n) precipitation is higher in the southeastern and northeastern parts of the basin. Overall, R-IMERG V04A (Figure 13o) precipitation estimate is relatively low throughout the entire basin during the winter.
Seasonal differences in the precipitation estimates derived from the four satellite-based products against rain gauge observations acquired within the Weihe River Basin are shown in Figure 14.
In terms of RMSE, RRMSE and R values shown in Figure 12a–d, TRMM 3B42 provides the best performance during the one-and-a-half-year precipitation analysis over the Weihe River Basin. At the same time, it is clearly seen that TRMM 3B42 (Figure 14d,h,l,p) daily precipitation estimates provide the best fit to the gauge observations (with lowest RMSEs, RRMSEs and the highest Rs) in comparison with the other three satellite-based products (regardless of season). All statistical indicators given in Figure 12b,c support the overall conclusion that R-IMERG V03D offers an advantage during the one and a half year precipitation analysis over R-IMERG V04A. A comparison between the two IMERG satellite-based precipitation estimates indicates that R-IMERG V03D exhibits an advantage over R-IMERG V04A, with lower RMSEs and higher Rs in spring (0.28 mm/day vs. 0.33 mm/day, 0.81 vs. 0.75, respectively), summer (0.4143 mm/day vs. 0.5 mm/day, 0.72 vs. 0.67, respectively) and winter (0.0733 mm/day vs. 0.11 mm/day, 0.51 vs. 0.2, respectively), but a slightly poorer performance than R-IMERG V04A with higher RMSEs (0.29 mm/day vs. 0.24 mm/day) during autumn. Based on RMSE, RRMSE and R values presented in Figure 12a,b, R-IMERG V03D exhibits better performance than CMORPH-CRT during the one and a half year precipitation analysis. While at a seasonal scale, in comparison with R-IMERG V03D, CMORPH-CRT demonstrates superior performance with lower RMSEs in spring (0.25 mm/day vs. 0.28 mm/day), autumn (0.27 mm/day vs. 0.29 mm/day), winter (0.0659 mm/day vs. 0.0733 mm/day), and relatively poorer performance with higher RMSE in summer (0.54 mm/day vs. 0.4143 mm/day).
Seasonal variations in RRMSE for all four sets of seasonal precipitation estimates over the Weihe River Basin can be seen in Figure 14a–p. In addition to the RRMSEs of CMORPH-CRT (Figure 14m), R-IMERG V03D (Figure 14n) and R-IMERG V04A (Figure 14o) in winter are always greater than 53% (with a maximal of about 84.22%). All other values are less than 23.57%. Values in autumn are particularly low (i.e., always less than 12.7%). These findings suggest that satellite-based precipitation estimates are reliable except in the individual circumstances noted above. Finally, over the Weihe River Basin, autumn precipitation estimates appear to be the most reliable while winter precipitation estimates are the least reliable.

4. Discussion

The precipitation depicted by R-IMERG V04A agrees well with TRMM 34B2 results within both the Huaihe River Basin (Figure 7c,d) and the Weihe River Basin (Figure 11c,d). However, relatively greater differences between the two products are found over the Tibetan Plateau (Figure 2c,d). To further illustrate this point, the TRMM 3B42 is used as the reference for the following RRMSE calculations. RRMSE dramatically decreases from 71.13% (over the Tibetan Plateau) to 8.83% (over the Huaihe River Basin) and to 8.14% (over the Weihe Basin). Therefore, the difference in precipitation amounts between R-IMERG V04A and TRMM 3B42 is more notable over the Tibetan Plateau than within the Huaihe and Weihe River Basins. Compared with the TRMM 3B42 results, R-IMERG V04A precipitation is at a significantly lower level over the Tibetan Plateau cold region. However, TRMM 3B42 and R-IMERG V04A precipitation estimates demonstrate similar performance over arid/semi-arid and sub-humid regions (i.e., the Weihe and Huaihe River Basins).
As shown in Figure 3, Figure 8 and Figure 12, over the Tibetan Plateau, the RRMSE of R-IMERG V04A is 57.65%, while those of the other three satellite-based products are less than 32.86%. Over the Huaihe and Weihe River Basins, RRMSEs for all four products are less than 13%. Overall, these results indicate R-IMERG V04A provides reliable precipitation estimates over the Huaihe and Weihe River Basins, but not within the Tibetan Plateau. In contrast, the other three satellite-based products provide reliable precipitation estimates over all three study regions.
According to Figure 3, Figure 8 and Figure 12, over the Tibetan Plateau and the Huaihe River Basin, R-IMERG V03D demonstrates better performance than TRMM 3B42, but the situation is reversed over the Weihe River Basin in terms of gauge-based R, RB, RMSE and RRMSE. R-IMERG V04A shows the best performance over the Huaihe River Basin, while, R-IMERG V04A notably underestimates precipitation over the Tibetan Plateau. This underestimation is as large as −46.98%. However, RBs are much lower over the Huaihe and Weihe River Basins with positive RBs (8.63% and 4.96%). The RMSEs decrease from 0.9 mm/day (over the Tibetan Plateau) to 0.32 mm/day (over the Huaihe River Basin) and to 0.14 mm/day (over the Weihe River Basin). Meanwhile, the RRMSEs decrease from 57.65% (over the Tibetan Plateau) to 11.24% (over the Huaihe River Basin) and to 11.94% (over the Weihe River Basin). On the other hand, the Rs range from 0.72 (over the Tibetan Plateau) to 0.96 (over the Huaihe River Basin) and to 0.8 (over the Weihe River Basin). This illustrates the superior performance of the R-IMERG V04A product in arid and semi-arid and sub-humid areas.

5. Summary and Conclusions

The IMERG algorithm incorporates a variety of precipitation observations from relevant satellite sensors and ground-based gauge networks (i.e., the GPCC gauge analysis) to produce gridded precipitation estimates at a half-hourly temporal and 0.1° × 0.1° spatial resolution. Here, we evaluate the quality of the latest IMERG V04A over the three type regions with contrasting climates: the cold Tibetan Plateau, the arid and semi-arid Weihe River Basin, and the semi-humid Huaihe River Basin. For comparison, IMERG V03D, TRMM 3B42 and CMORPH-CRT precipitation products are also evaluated in parallel with the IMERG V04A product. The quantitative analysis is based on comparisons with ground-based rain gauge measurements.
The main findings of this study are as follows:
(1)
The R-IMERG V04A product captures the spatial patterns of precipitation as well as CMORPH-CRT, R-IMERG V03D and TRMM 3B42 over the Huaihe and Weihe River Basins during the one-and-a-half-year precipitation analysis and at seasonal scales. However, the performance of R-IMERG V04A varies greatly spatially and temporally.
(2)
Over the Tibetan Plateau, R-IMERG V04A demonstrates the worst performance among the four satellite-based products considered here. In particular, R-IMERG V04A severely underestimates precipitation with the lowest RBs (−46.98%) during the one-and-a-half-year precipitation analysis. In addition, R-IMERG V04A seriously underestimates precipitation at the seasonal scale with the RBs ranging from −42.86% in summer to −70.62% in winter. R-IMERG V04A is not reliable with a large RRMSE (57.65% during the one-and-a-half-year precipitation analysis, ranging from 54.33% in summer to 167.74% in winter at the seasonal scale). As a result, R-IMERG V04A is not recommended for hydrological studies and monitoring of the Tibetan Plateau. Future research is needed to discover the source of this error and improve the accuracy of R-IMERG V04A precipitation estimates over the Tibetan Plateau. In contrast, R-IMERG V03D demonstrates the best performance within the Tibetan Plateau with the lowest RMSE (0.44 mm/day), RRMSE (28.37%), RB (7.46%), and the highest R (0.83) across all four products.
(3)
Within the Huaihe River Basin, R-IMERG V04A offers a slight advantage over the other three satellite products with the lowest RMSE (0.32 mm/day), RRMSE (11.24%) and highest R (0.96) during the one-and-a-half-year precipitation analysis. For seasonal-scale precipitation estimates, a comparison between TRMM 3B42 and R-IMERG V04A demonstrates that R-IMERG V04A estimates have higher Rs (0.93 in spring, 0.96 in summer, 0.81 in autumn, 0.92 in winter, respectively) and lower RMSEs (0.6 mm/day in summer, 0.44 mm/day in autumn).
(4)
Over the Weihe River Basin, in comparison with TRMM 3B42, R-IMERG V04A shows a poorer performance with higher RMSE (0.14 mm/day), RBs (4.96%) and lower R (0.8) during the one-and-a-half-year precipitation analysis. For seasonal precipitation, R-IMERG V04A is worse than TRMM 3B42 regardless of season.
(5)
During winter, both IMERG products tend to underestimate precipitation over the Tibetan Plateau and the Weihe River Basin. A comparison among the four satellite-based precipitation estimates shows that R-IMERG V04A and CMORPH-CRT perform worse than TRMM 3B42 in terms of RB (−70.62%, 71.52% vs. 22.9%), and R-IMERG V03D has an advantage over TRMM 3B42 with lower RB (−6.47%) at the seasonal scale over the Tibetan Plateau. Over the Weihe River Basin, both R-IMERG V03D and CMORPH-CRT are superior to TRMM 3B42 according to RBs (−11.4%, −0.66% vs. −14.8%) while R-IMERG V04A performs worse than TRMM 3B42 with higher negative RB (−46.92%).
This analysis provides important insight regarding the spatiotemporal error characteristics of the IMERG V04A, IMERG V03D, TRMM 3B42 and CMORPH-CRT precipitation products for three distinct climatic regions within China. As such, the results will provide satellite precipitation users with an enhanced understanding of the applicability of the latest V04 IMERG, V03 IMERG, TRMM 3B42 and CMORPH-CRT precipitation estimates for water resource management, hydro-meteorological disaster prediction and hydrologic simulation in similar Chinese regions. In addition, the results are potentially relevant for future refinement of the IMERG production algorithm.

Acknowledgments

The authors wish to acknowledge the reviewers of the manuscript for their constructive comments and helpful suggestions. This research is supported by National Key Research and Development Program (grant number: 2016YFC0400909, 2016YFA0601504); NNSF (grant numbers: 41371049, 41571015, 41323001, and 51539003); and the Project of the State Key Laboratory of Hydrology-Water Resources and Hydraulic Engineering, China (grant number: 20165042612).

Author Contributions

All authors contributed extensively to the work presented in this paper. Haishen Lu, Wade T. Crow, and Yonghua Zhu designed the framework of this study. Guanghua Wei performed the experiment. The manuscript was prepared by Guanghua Wei and revised by Haishen Lu, Wade T. Crow, and Yonghua Zhu. The data was provided by Guanghua Wei and Jianbin Su. Jianqun Wang provided some useful suggestions.

Conflicts of Interest

The authors declare no conflict of interest.

References

  1. Hou, A.Y.; Kakar, R.K.; Neeck, S.; Azarbarzin, A.A.; Kummerow, C.D.; Kojima, M.; Oki, R.; Nakamura, K.; Iguchi, T. The global precipitation measurement mission. Bull. Am. Meteorol. Soc. 2014, 95, 701–722. [Google Scholar] [CrossRef]
  2. Lü, H.; Crow, W.; Zhu, Y.; Ouyang, F.; Su, J. Improving streamflow prediction using remotely-sensed soil moisture and snow depth. Remote Sens. 2016, 8, 503. [Google Scholar] [CrossRef]
  3. Lü, H.; Crow, W.T.; Zhu, Y.; Yu, Z.; Sun, J. The impact of assumed error variances on surface soil moisture and snow depth hydrologic data assimilation. IEEE J. Sel. Top. Appl. Earth Obs. Remote Sens. 2016, 8, 5116–5129. [Google Scholar] [CrossRef]
  4. Lü, H.; Hou, T.; Horton, R.; Zhu, Y.; Chen, X.; Jia, Y.; Wang, W.; Fu, X. The streamflow estimation using the Xinanjiang rainfall runoff model and dual state-parameter estimation method. J. Hydrol. 2013, 480, 102–114. [Google Scholar] [CrossRef]
  5. Joyce, R.J.; Janowiak, J.E.; Arkin, P.A.; Xie, P. CMORPH: A method that produces global precipitation estimates from passive microwave and infrared data at high spatial and temporal resolution. J. Hydrometeorol. 2004, 5, 287–296. [Google Scholar] [CrossRef]
  6. Huffman, G.J.; Bolvin, D.T.; Nelkin, E.J.; Wolff, D.B.; Adler, R.F.; Gu, G.; Hong, Y.; Bowman, K.P.; Stocker, E.F. The TRMM multisatellite precipitation analysis (TMPA): Quasi-global, multiyear, combined-sensor precipitation estimates at fine scales. J. Hydrometeorol. 2007, 8, 237–247. [Google Scholar] [CrossRef]
  7. The TRMM Webpage. Available online: https://pmm.nasa.gov/data-access/downloads/trmm (accessed on 5 September 2017).
  8. Huffman, G.J.; Bolvin, D.T.; Braithwaite, D.; Hsu, K.; Joyce, R.; Kidd, C.; Nelkin, E.J.; Xie, P. Algorithm Theoretical Basis Document (ATBD) Version 4.5: NASA Global Precipitation Measurement (GPM) Integrated Multi-Satellite Retrievals for GPM (IMERG); NASA/GSFC: Greenbelt, MD, USA, 2015. [Google Scholar]
  9. Huffman, G.J.; Bolvin, D.T.; Nelkin, E.J. Integrated Multi-Satellite Retrievals for GPM (IMERG) Technical Documentation; NASA/GSFC: Greenbelt, MD, USA, 2014. [Google Scholar]
  10. Behrangi, A.; Khakbaz, B.; Jaw, T.C.; Aghakouchak, A.; Hsu, K.; Sorooshian, S. Hydrologic evaluation of satellite precipitation products over a mid-size basin. J. Hydrol. 2011, 397, 225–237. [Google Scholar] [CrossRef]
  11. Kidd, C.; Bauer, P.; Turk, J.; Huffman, G.J.; Joyce, R.; Hsu, K.L.; Braithwaite, D. Intercomparison of high-resolution precipitation products over northwest Europe. J. Hydrometeorol. 2012, 13, 67–83. [Google Scholar] [CrossRef]
  12. Ebert, E.E.; Janowiak, J.E.; Kidd, C. Comparison of near-real-time precipitation estimates from satellite observations and numerical models. Bull. Am. Meteorpl. Soc. 2007, 88, 47. [Google Scholar] [CrossRef]
  13. Tan, M.; Ibrahim, A.; Duan, Z.; Cracknell, A.; Chaplot, V. Evaluation of six high-resolution satellite and ground-based precipitation products over Malaysia. Remote Sens. 2015, 7, 1504–1528. [Google Scholar] [CrossRef]
  14. Tian, Y.; Peters-Lidard, C.D. A global map of uncertainties in satellite-based precipitation measurements. Geophys. Res. Lett. 2010, 37, 701–719. [Google Scholar] [CrossRef]
  15. Yong, B.; Ren, L.L.; Hong, Y.; Wang, J.H.; Gourley, J.J.; Jiang, S.H.; Chen, X.; Wang, W. Hydrologic evaluation of multisatellite precipitation analysis standard precipitation products in basins beyond its inclined latitude band: A case study in Laohahe basin, China. Water Resour. Res. 2010, 46, 759–768. [Google Scholar] [CrossRef]
  16. Anagnostou, E.N.; Maggioni, V.; Nikolopoulos, E.I.; Meskele, T.; Hossain, F.; Papadopoulos, A. Benchmarking high-resolution global satellite rainfall products to radar and rain-gauge rainfall estimates. IEEE Trans. Geosci. Remote Sens. 2010, 48, 1667–1683. [Google Scholar] [CrossRef]
  17. Jiang, S.; Ren, L.; Yong, B.; Yang, H.; Yang, X.; Yuan, F. Evaluation of latest TMPA and CMORPH precipitation products with independent rain gauge observation networks over high-latitude and low-latitude basins in China. Chin. Geogr. Sci. 2016, 26, 439–455. [Google Scholar] [CrossRef]
  18. Alazzy, A.A.; Lü, H.; Chen, R.; Ali, A.B.; Zhu, Y.; Su, J. Evaluation of satellite precipitation products and their potential influence on hydrological modeling over the Ganzi river basin of the Tibetan Plateau. Adv. Meteorol. 2017, 2017, 3695285. [Google Scholar] [CrossRef]
  19. Huffman, G.J.; Bolvin, D.T. TRMM and Other Data Precipitation Data Set Documentation; NASA/GSFC: Greenbelt, MD, USA, 2013. [Google Scholar]
  20. Tesfagiorgis, K.; Mahani, S.E.; Krakauer, N.Y.; Khanbilvardi, R. Bias correction of satellite rainfall estimates using a Radar-gauge product—A case study in Oklahoma (USA). Hydrol. Earth Syst. Sci. 2011, 15, 2631–2647. [Google Scholar] [CrossRef]
  21. Tian, Y.; Peters-Lidard, C.D.; Choudhury, B.J.; Garcia, M. Multitemporal analysis of TRMM-based satellite precipitation products for land data assimilation applications. J. Hydrometeorol. 2007, 8, 1165–1183. [Google Scholar] [CrossRef]
  22. Sharifi, E.; Steinacker, R.; Saghafian, B. Assessment of GPM-IMERG and other precipitation products against gauge data under different topographic and climatic conditions in Iran: Preliminary results. Remote Sens. 2016, 8, 135. [Google Scholar] [CrossRef]
  23. Huffman, G.J.B.; Bolvin, D.T.; Braithwaite, D.; Hsu, K.; Joyce, R.; Xie, P.; Yoo, S.H. Algorithm Theoretical Basisdocument, Version 4.1: NASA Global Precipitation Measurement (GPM) Integrated Multi-Satellite Retrievals for GPM (Imerg); NASA/GSFC: Greenbelt, MD, USA, 2013. [Google Scholar]
  24. Huffman, G.J.; Bolvin, D.T.; Nelkin, E.J. Day 1 IMERG Final Run Release Notes; NASA/GSFC: Greenbelt, MD, USA, 2015. [Google Scholar]
  25. Liu, Z. Comparison of integrated multisatellite retrievals for GPM (IMERG) and TRMM multisatellite precipitation analysis (TMPA) monthly precipitation products: Initial results. J. Hydrometeorol. 2015, 17, 777–790. [Google Scholar] [CrossRef]
  26. Prakash, S.; Mitra, A.K.; Pai, D.S.; Aghakouchak, A. From TRMM to GPM: How well can heavy rainfall be detected from space? Adv. Water Resour. 2015, 88, 1–7. [Google Scholar] [CrossRef]
  27. Prakash, S.; Mitra, A.K.; Aghakouchak, A.; Liu, Z.; Norouzi, H.; Pai, D.S. A preliminary assessment of GPM-based multi-satellite precipitation estimates over a monsoon dominated region. J. Hydrol. 2016. [Google Scholar] [CrossRef]
  28. Kubota, T.; Shige, S.; Hashizume, H.; Aonashi, K.; Takahashi, N.; Seto, S.; Takayabu, Y.N.; Ushio, T.; Nakagawa, K.; Iwanami, K. Global precipitation map using satellite-borne microwave radiometers by the GSMAP project: Production and validation. IEEE Trans. Geosci. Remote Sens. 2007, 45, 2259–2275. [Google Scholar] [CrossRef]
  29. Chen, F.; Li, X. Evaluation of IMERG and TRMM 3b43 monthly precipitation products over mainland china. Remote Sens. 2016, 8, 472. [Google Scholar] [CrossRef]
  30. Guo, H.; Chen, S.; Bao, A.; Behrangi, A.; Hong, Y.; Ndayisaba, F.; Hu, J.; Stepanian, P.M. Early assessment of integrated multi-satellite retrievals for global precipitation measurement over china. Atmos. Res. 2016, 176–177, 121–133. [Google Scholar] [CrossRef]
  31. Tang, G.; Ma, Y.; Long, D.; Zhong, L.; Hong, Y. Evaluation of GPM day-1 IMERG and TMPA version-7 legacy products over Mainland China at multiple spatiotemporal scales. J. Hydrol. 2016, 533, 152–167. [Google Scholar] [CrossRef]
  32. Shen, Y.; Xiong, A.; Wang, Y.; Xie, P. Performance of high-resolution satellite precipitation products over china. J. Geophys. Res. Atmos. 2010, 115, 355–365. [Google Scholar] [CrossRef]
  33. Yu, R.; Zhou, T.; Xiong, A.; Zhu, Y.; Li, J. Diurnal variations of summer precipitation over contiguous China. Geophys. Res. Lett. 2007, 34, 223–234. [Google Scholar] [CrossRef]
  34. The CMORPH Webpage. Available online: ftp://ftp.cpc.ncep.noaa.gov/precip/CMORPH_V1.0/ (accessed on 5 September 2017).
  35. Joyce, R.J.; Xie, P.; Yarosh, Y.; Janowiak, J.E.; Arkin, P.A. CMORPH: A “morphing” approach for high resolution precipitation product generation. In Satellite Rainfall Applications for Surface Hydrology; Gebremichael, M., Hossain, F., Eds.; Springer: Houten, The Netherlands, 2010; pp. 23–37. [Google Scholar]
  36. Habib, E.; Haile, A.T.; Tian, Y.; Joyce, R.J. Evaluation of the high-resolution cmorph satellite rainfall product using dense rain gauge observations and Radar-based estimates. J. Hydrometeorol. 2012, 13, 1784–1798. [Google Scholar] [CrossRef]
  37. Huffman, G.J.; Bolvin, D.T.; Nelkin, E.J.; Stocker, E.F. V04 IMERG Final Run Release Notes; NASA/GSFC: Greenbelt, MD, USA, 2017. [Google Scholar]
  38. Ahrens, B. Distance in spatial interpolation of daily rain gauge data. Hydrol. Earth Syst. Sci. 2006, 10, 197–208. [Google Scholar] [CrossRef]
  39. Tong, K.; Su, F.; Yang, D.; Zhang, L.; Hao, Z. Tibetan plateau precipitation as depicted by gauge observations, reanalyses and satellite retrievals. Int. J. Climatol. 2014, 34, 265–285. [Google Scholar] [CrossRef]
  40. Rompaey, A.J.J.V.; Govers, G.; Baudet, M. A strategy for controlling error of distributed environmental models by aggregation. Int. J. Geogr. Inf. Sci. 1999, 13, 577–590. [Google Scholar] [CrossRef]
  41. Daniell, J.J. Development of a bathymetric grid for the Gulf of Papua and adjacent areas: A note describing its development. J. Geophys. Res. 2008, 113, 222–256. [Google Scholar] [CrossRef]
  42. Claverie, M.; Demarez, V.; Duchemin, B.; Hagolle, O.; Ducrot, D.; Marais-Sicre, C.; Dejoux, J.F.; Huc, M.; Keravec, P.; Béziat, P. Maize and sunflower biomass estimation in southwest France using high spatial and temporal resolution remote sensing data. Remote Sens. Environ. 2012, 124, 844–857. [Google Scholar] [CrossRef] [Green Version]
  43. Kienzle, S. The effect of DEM raster resolution on first order, second order and compound terrain derivatives. Trans. GIS 2004, 8, 83–111. [Google Scholar] [CrossRef]
  44. Anjum, M.N.D.; Shangguan, Y. J.; Ijaz, D.H.; Zhang, M.W. Evaluation of high-resolution satellite-based real-time and post-real-time precipitation estimates during 2010 extreme flood event in Swat river basin, Hindukush region. Adv. Meteorol. 2016, 2016, 2604980. [Google Scholar] [CrossRef]
  45. Moriasi, D.N.; Arnold, J.G.; Van Liew, M.W.; Bingner, R.L.; Harmel, R.D.; Veith, T.L. Model evaluation guidelines for systematic quantification of accuracy in watershed simulations. Trans. ASABE 2007, 50, 885–900. [Google Scholar] [CrossRef]
Figure 1. Locations of the Huaihe River Basin (a); Weihe River Basin (b) and Tibetan Plateau (c) in China, and the spatial distribution of meterological stations within each region.
Remotesensing 10 00030 g001
Figure 2. Spatial distribution of mean daily precipitation (mm/day) (sampled between 1 June 2014 and 30 November 2015) at a spatial 0.25° resolution for CMORPH-CRT (a); R-IMERG V03D (b); R-IMERG V04A (c); and TRMM 3B42 (d) over the Tibetan Plateau. The pluses represent mean daily precipitation (mm/day) of gauge precipitation estimates (sampled between 1 June 2014 and 30 November 2015).
Remotesensing 10 00030 g002
Figure 3. Scatterplots of satellite-based daily average rainfall estimates versus ground-based rain gauge daily average observations for CMORPH-CRT (a); R-IMERG V03D (b); R-IMERG V04A (c); and TRMM 3B42 (d) over the Tibetan Plateau during the period June 2014–November 2015. The blue and red oblique solid lines denote a 1:1 line and a least-squares regression line, respectively.
Remotesensing 10 00030 g003
Figure 4. Maps of seasonal daily average precipitation (mm/day) at a 0.25° spatial resolution derived from CMORPH-CRT (a,e,i,m); R-IMERG V03D (b,f,j,n); R-IMERG V04A (c,g,k,o) and TRMM 3B42 (d,h,l,p) estimates for spring, summer, autumn and winter over the Tibetan Plateau between June 2014 and November 2015. The pluses represent seasonal daily average precipitation (mm/day) of gauge precipitation estimates (sampled between 1 June 2014 and 30 November 2015).
Remotesensing 10 00030 g004
Figure 5. The precipitation intensity distribution for each season’s daily average precipitation for different precipitation intensity classes over the Tibetan Plateau between June 2014 and November 2015.
Remotesensing 10 00030 g005
Figure 6. Scatterplots of satellite-based versus ground-based average daily rainfall estimates for the four seasons over the Tibetan Plateau for CMORPH-CRT (a,e,i,m); R-IMERG V03D (b,f,j,n); R-IMERG V04A (c,g,k,o) and TRMM 3B42 (d,h,l,p).
Remotesensing 10 00030 g006
Figure 7. Spatial distribution of daily average precipitation (mm/day) at 0.25° resolution between 1 June 2014 and 30 November 2015 derived from CMORPH-CRT (a); R-IMERG V03D (b); R-IMERG V04A (c); and TRMM 3B42 (d) over the Huaihe River Basin.
Remotesensing 10 00030 g007
Figure 8. Scatterplots of the four satellite-based estimates versus ground-based rain gauge observations of average daily rainfall for CMORPH-CRT (a); R-IMERG V03D (b); R-IMERG V04A (c); and TRMM 3B42 (d) over the Huaihe River Basin between June 2014 and November 2015. The blue and red solid lines denote a 1:1 line and a least-squares regression line, respectively.
Remotesensing 10 00030 g008
Figure 9. Maps of seasonal daily average precipitation (mm/day) at 0.25° resolution derived from CMORPH-CRT (a,e,i,m); R-IMERG V03D (b,f,j,n); R-IMERG V04A (c,g,k,o); and TRMM 3B42 (d,h,l,p) estimates for spring, summer, autumn and winter (from top to bottom) over the Huaihe River Basin between June 2014 and November 2015.
Remotesensing 10 00030 g009
Figure 10. Scatterplots of satellite-based estimates versus gauge observations of average daily rainfall for different seasons over the Huaihe River Basin for CMORPH-CRT (a,e,i,m); R-IMERG V03D (b,f,j,n); R-IMERG V04A (c,g,k,o); and TRMM 3B42 (d,h,l,p).
Remotesensing 10 00030 g010
Figure 11. Spatial distribution of mean daily precipitation (mm/day) at 0.25° resolution between 1 June 2014 and 30 November 2015 derived from CMORPH-CRT (a); R-IMERG V03D (b); R-IMERG V04A (c); and TRMM 3B42 (d) over the Weihe River Basin.
Remotesensing 10 00030 g011
Figure 12. Scatterplots of the four satellite-based estimates versus rain gauge observations of average daily rainfall for CMORPH-CRT (a); R-IMERG V03D (b); R-IMERG V04A (c); and TRMM 3B42 (d) over the Weihe River Basin between June 2014 and November 2015. The blue and red oblique solid lines denote a 1:1 line and a least-squares regression line, respectively.
Remotesensing 10 00030 g012
Figure 13. Maps of seasonal daily average precipitation (mm/day) at 0.25° resolution derived from CMORPH-CRT (a,e,i,m); R-IMERG V03D (b,f,j,n); R-IMERG V04A (c,g,k,o); and TRMM 3B42 (d,h,l,p) estimates for spring, summer, autumn and winter (from top to bottom) over the Weihe River Basin between June 2014 and November 2015.
Remotesensing 10 00030 g013
Figure 14. Scatterplots of satellite-based estimates versus rain gauge observations of average daily rainfall for different seasons over the Weihe River Basin for CMORPH-CRT (a,e,i,m); R-IMERG V03D (b,f,j,n); R-IMERG V04A (c,g,k,o); and TRMM 3B42 (d,h,l,p).
Remotesensing 10 00030 g014
Table 1. Main features of the three studied watersheds.
WatershedsTibetan PlateauHuaihe River BasinWeihe River Basin
Average elevation4292 m84 m2173 m
Annual average temperature2–5 °C11–16 °C10–13 °C
Annual average rainfall482.8 m1100 m559 m
Glaciers and permafrostYesNoNo
ClimateCold regionSemi-humidArid/semi-arid
Number of stations962912

