China’s Industrial Total-Factor Energy Productivity Growth at Sub-Industry Level: A Two-Step Stochastic Metafrontier Malmquist Index Approach

Abstract
:1. Introduction
2. Methodology
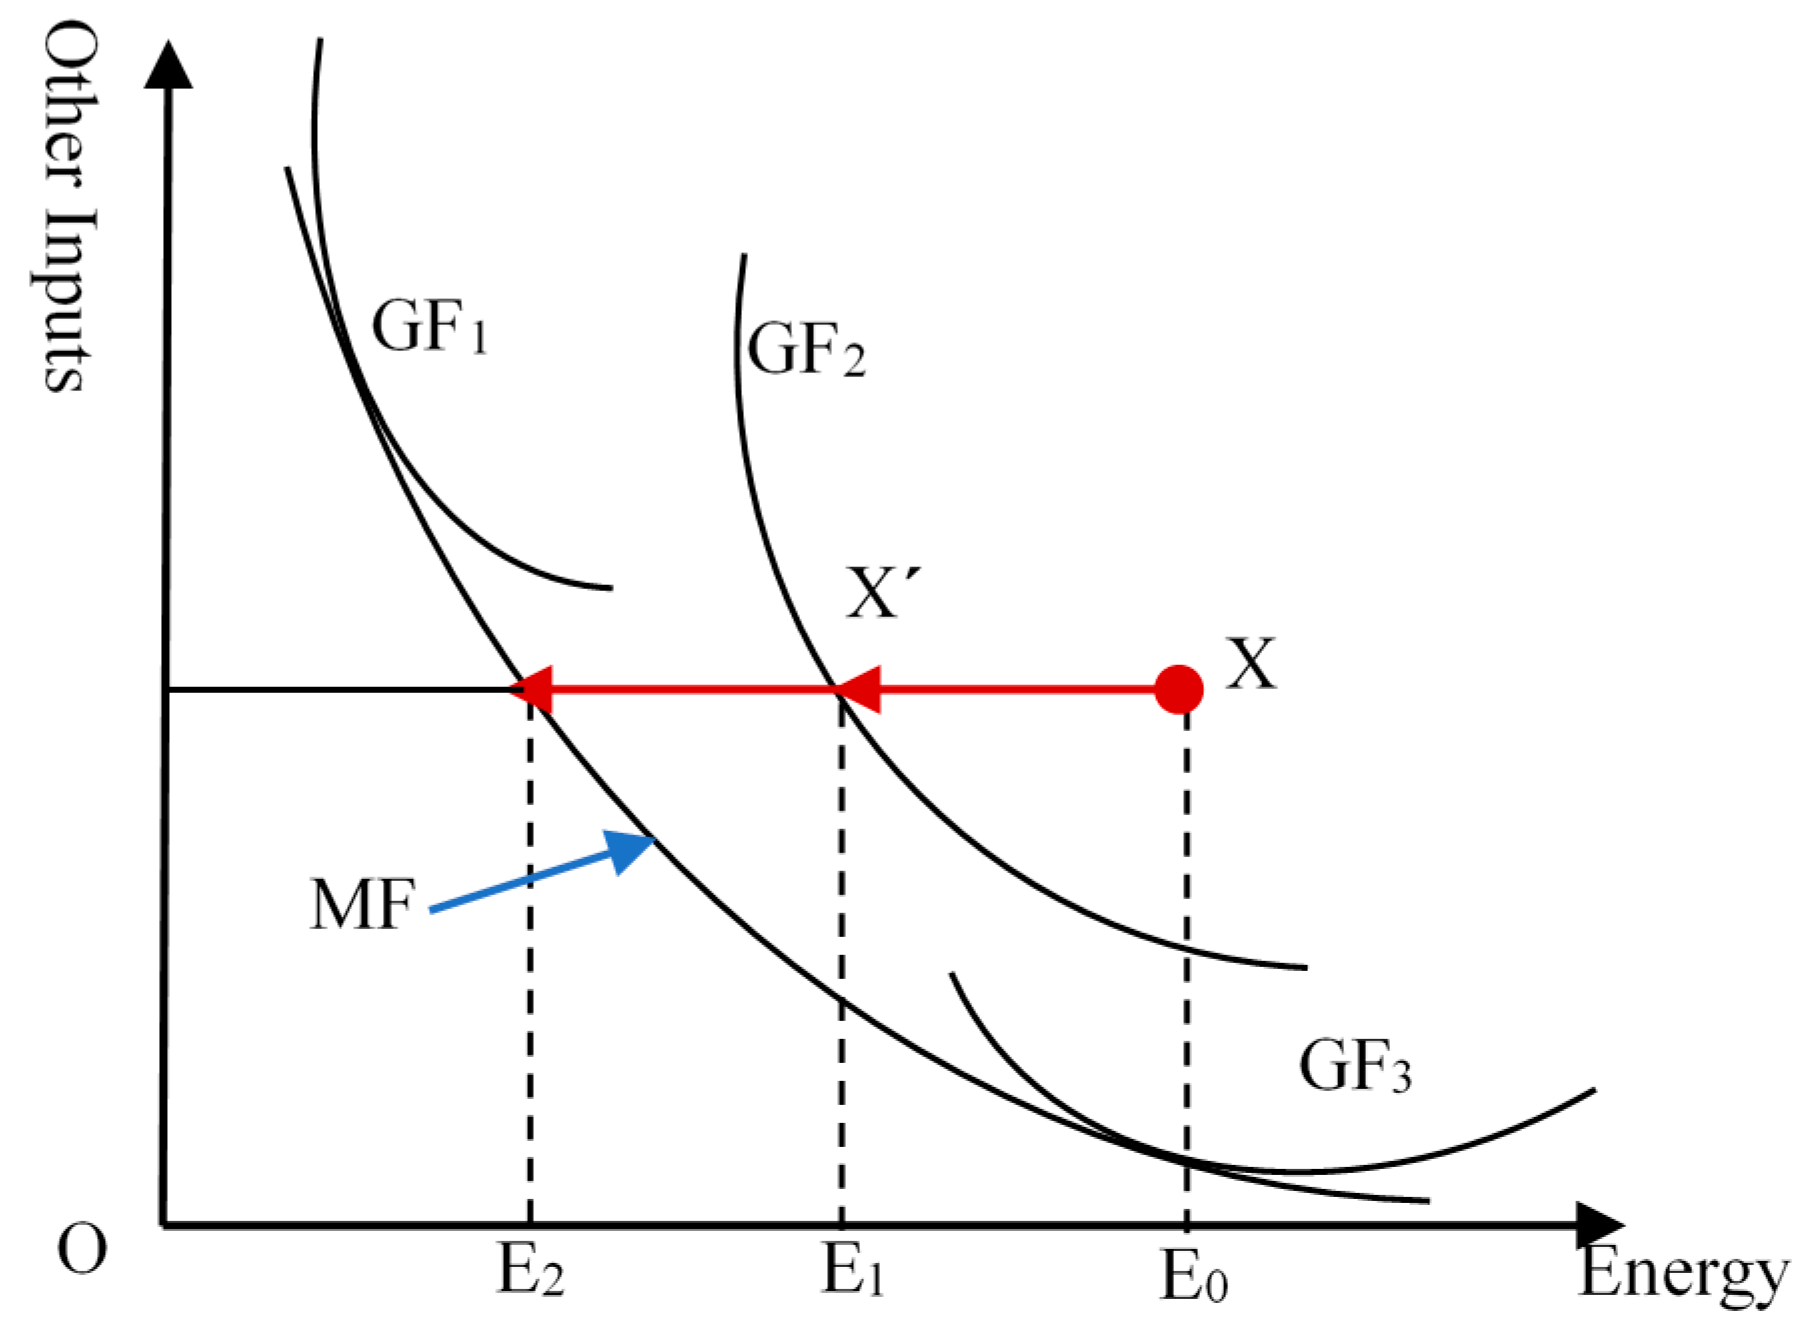
2.1. Total-Factor Energy Efficiency under the Metafrontier Framework
2.2. Metafrontier Malmquist Energy Productivity Index
2.3. Model Specification and Estimation
3. Empirical Analysis
3.1. Data and Industrial Heterogeneity
3.2. Estimation Results
3.3. Decomposition Results
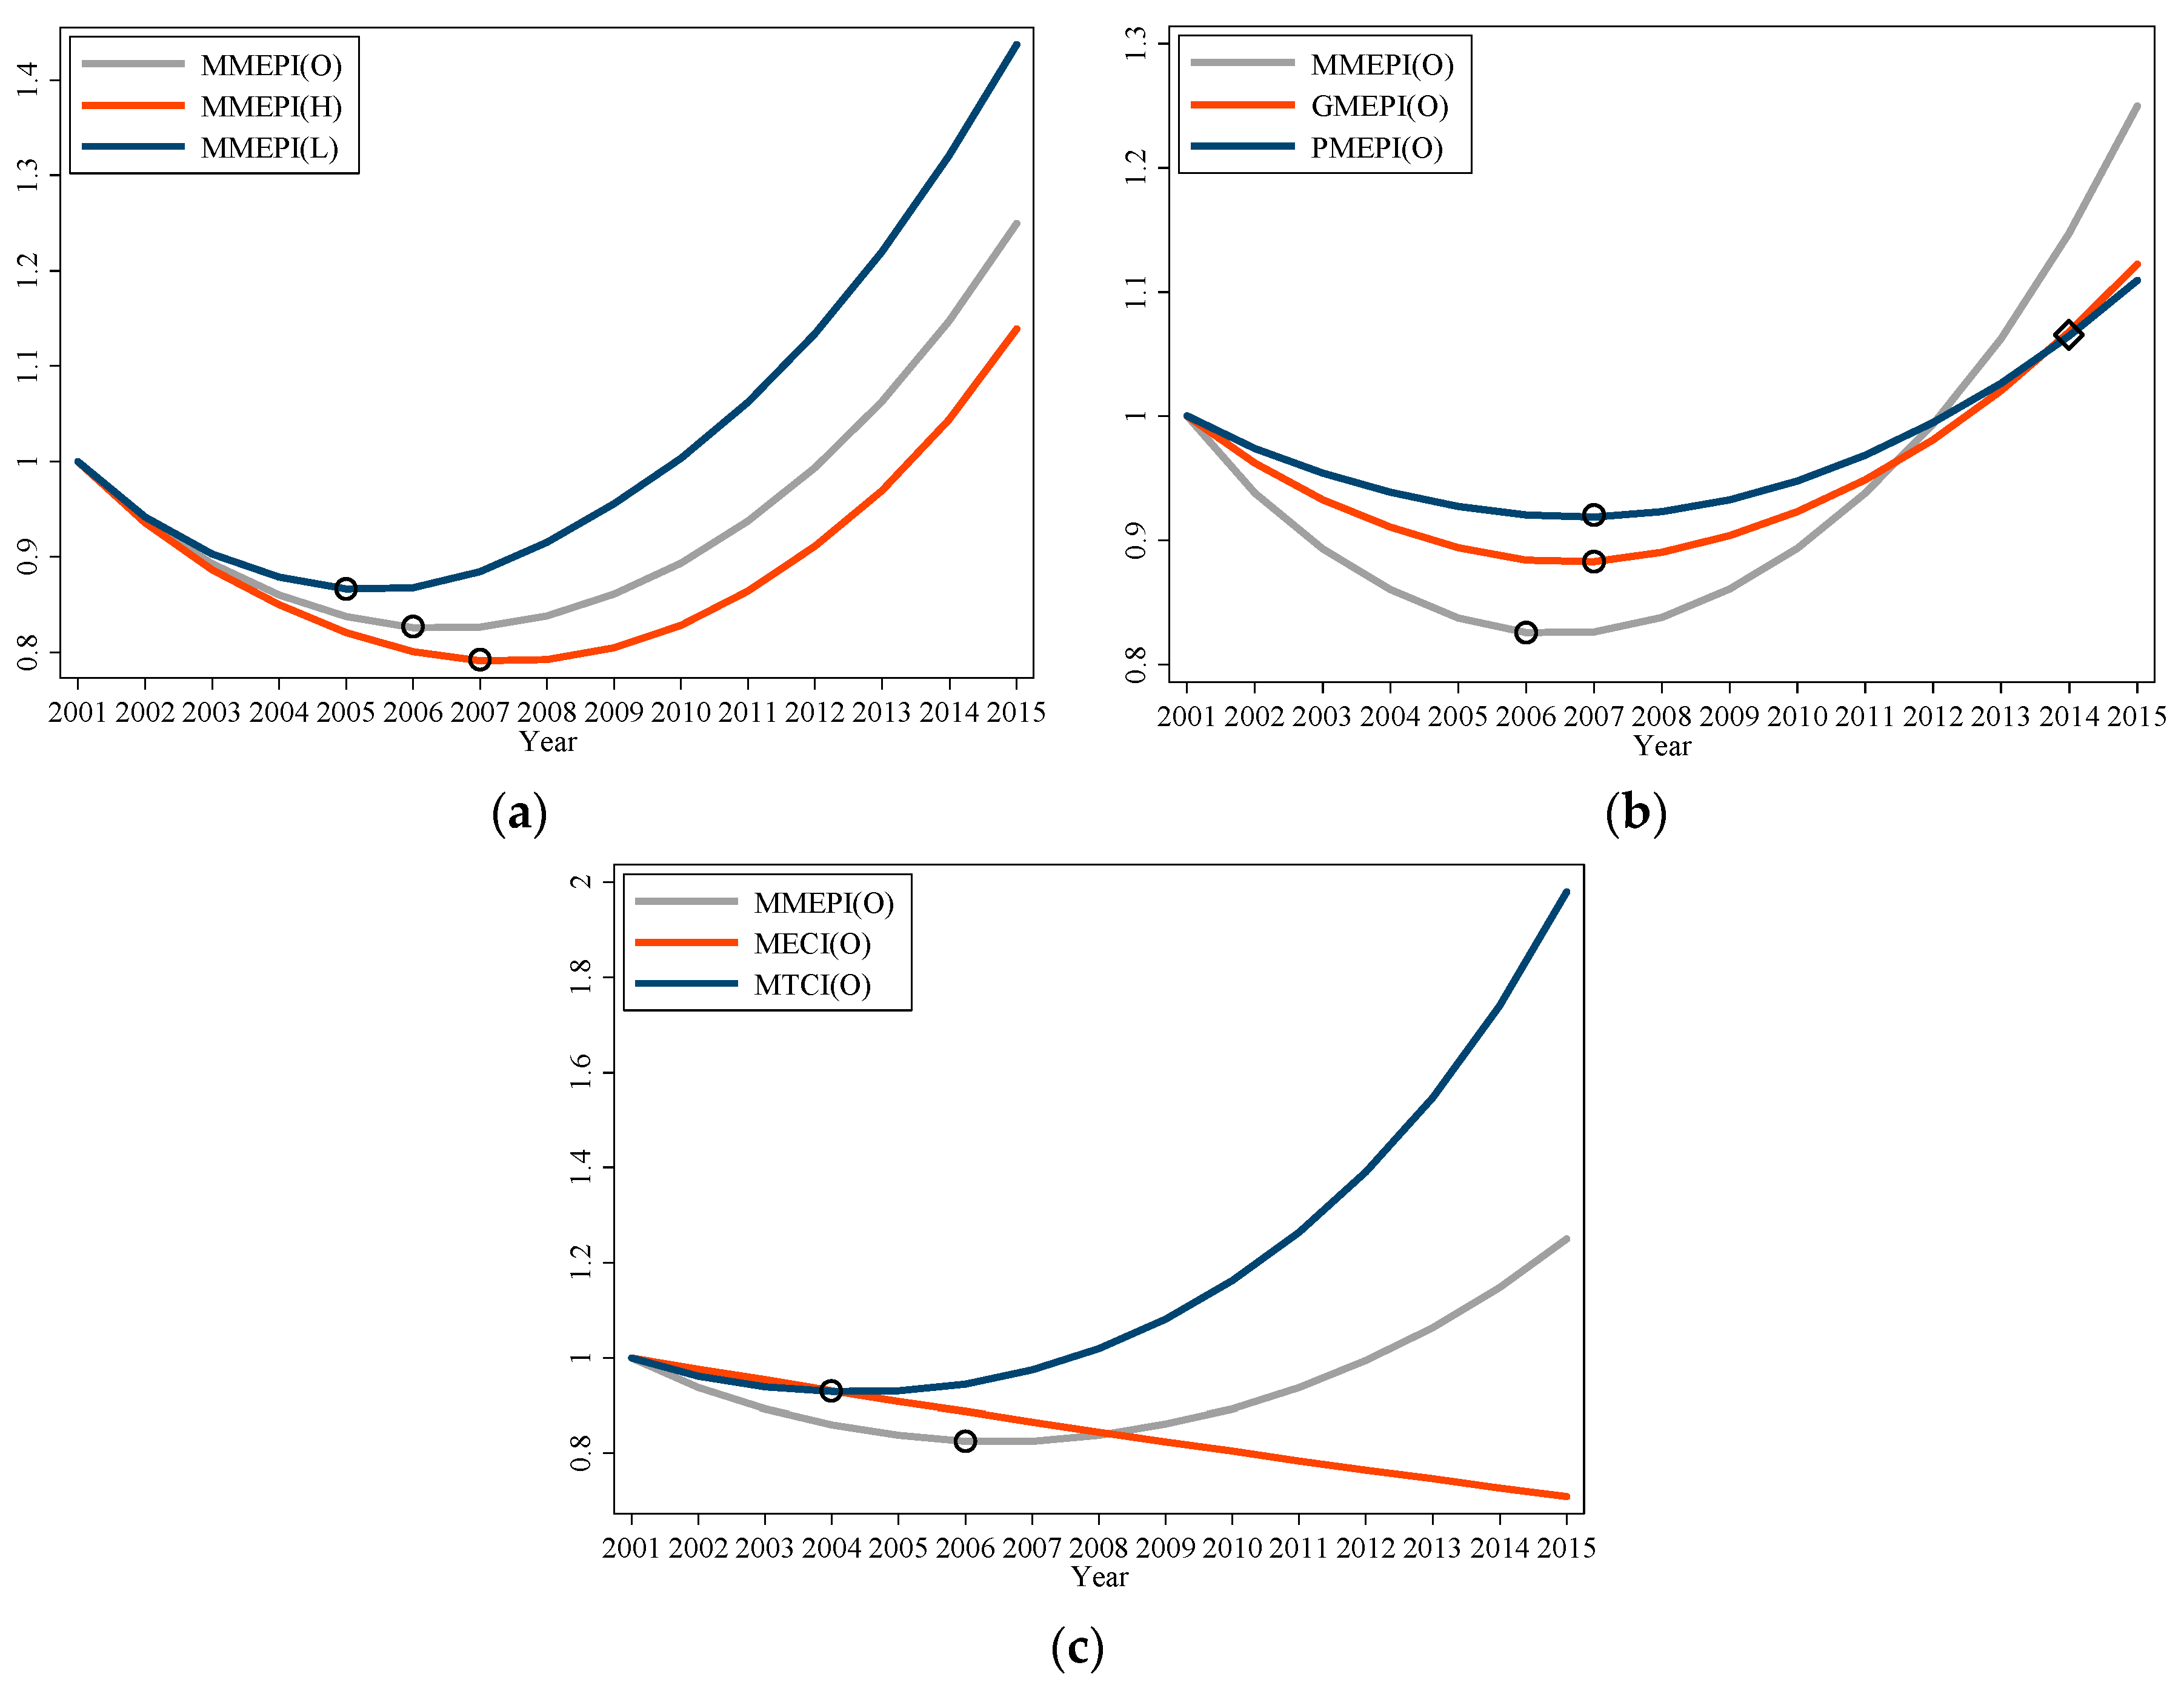
3.3.1. Macro-Analysis
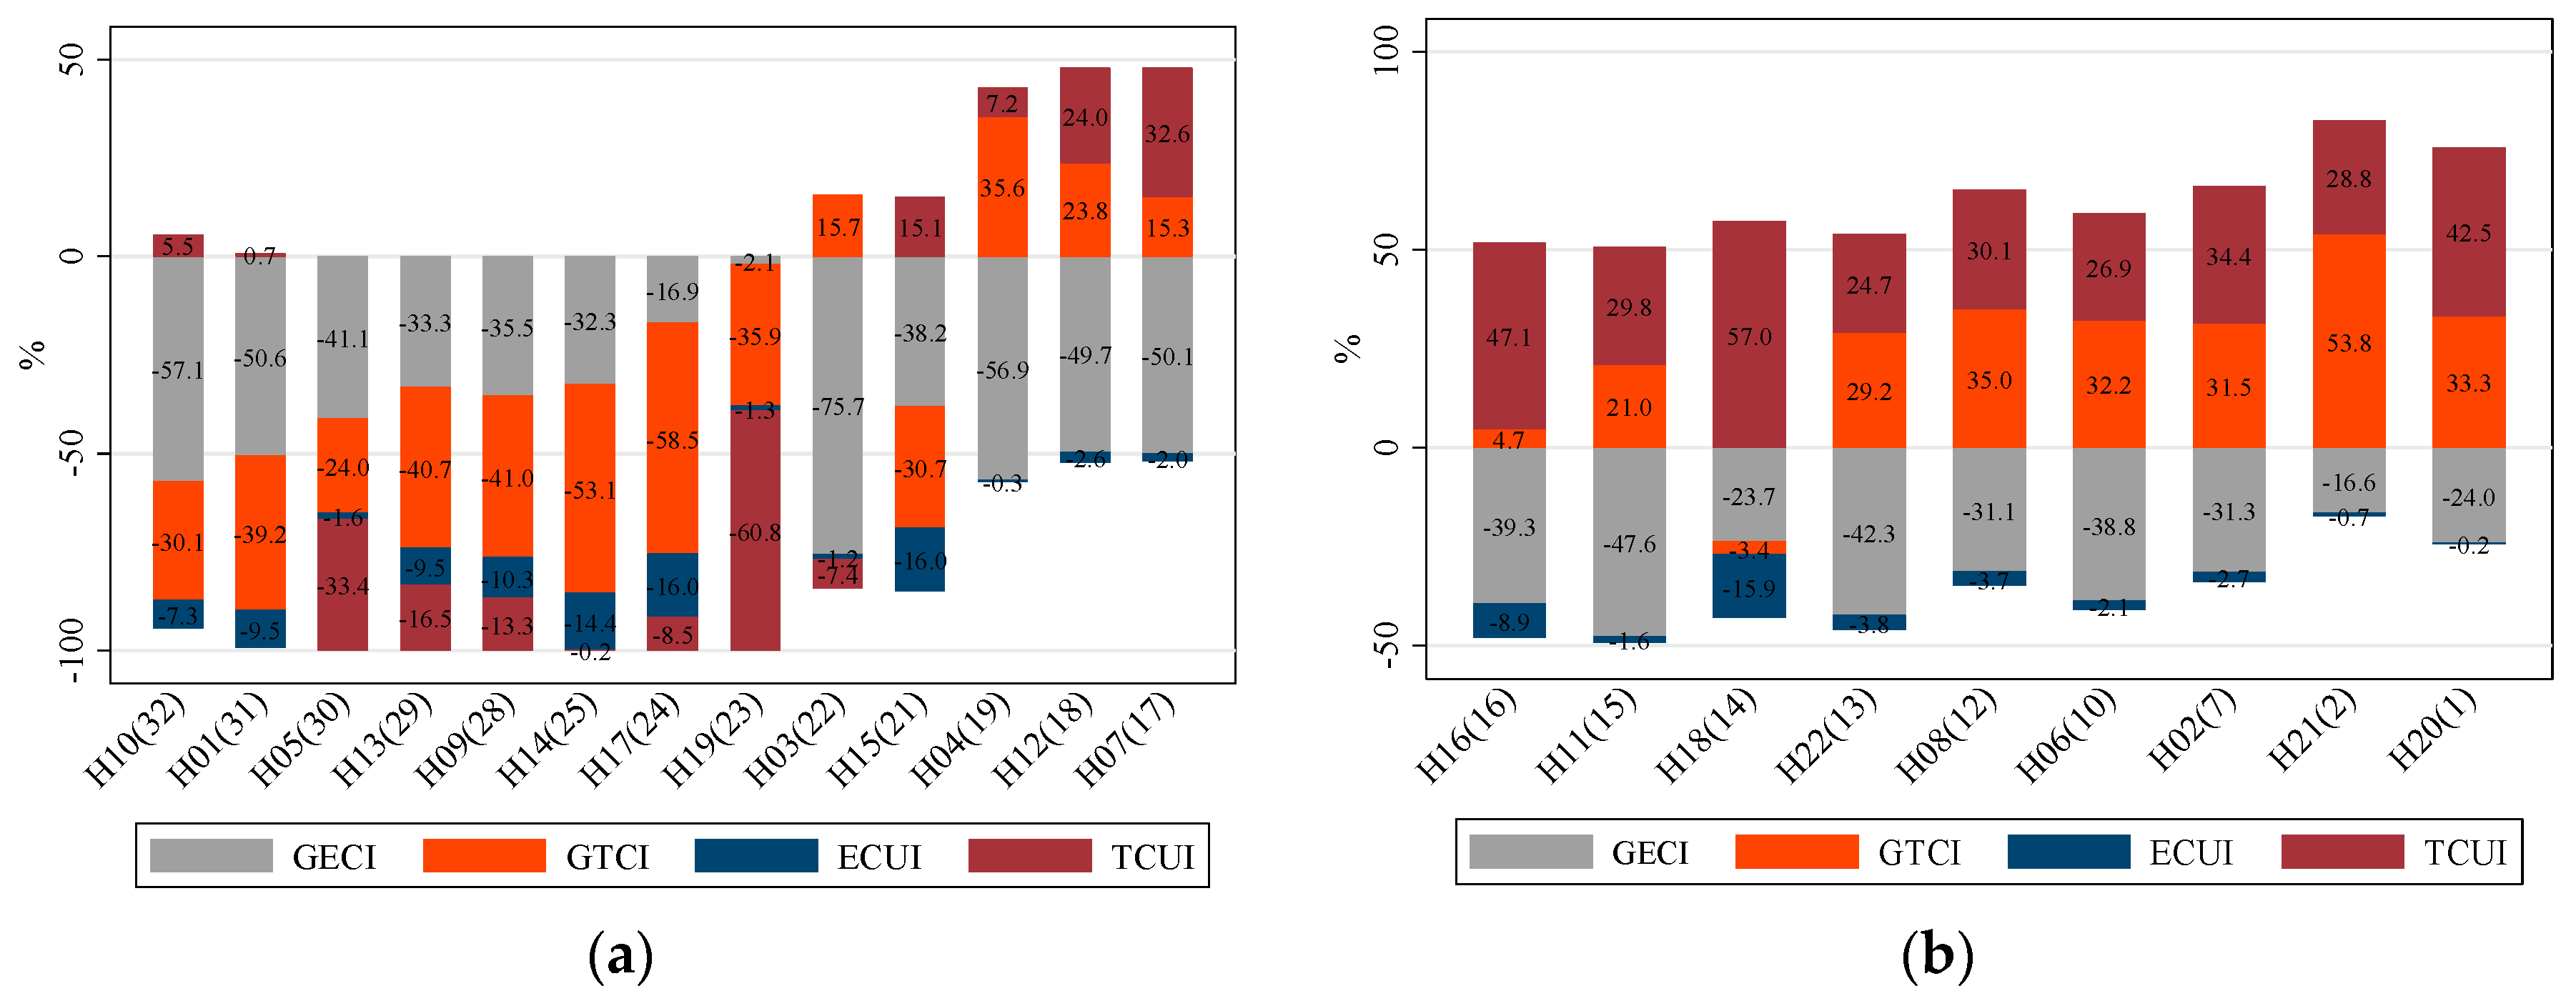
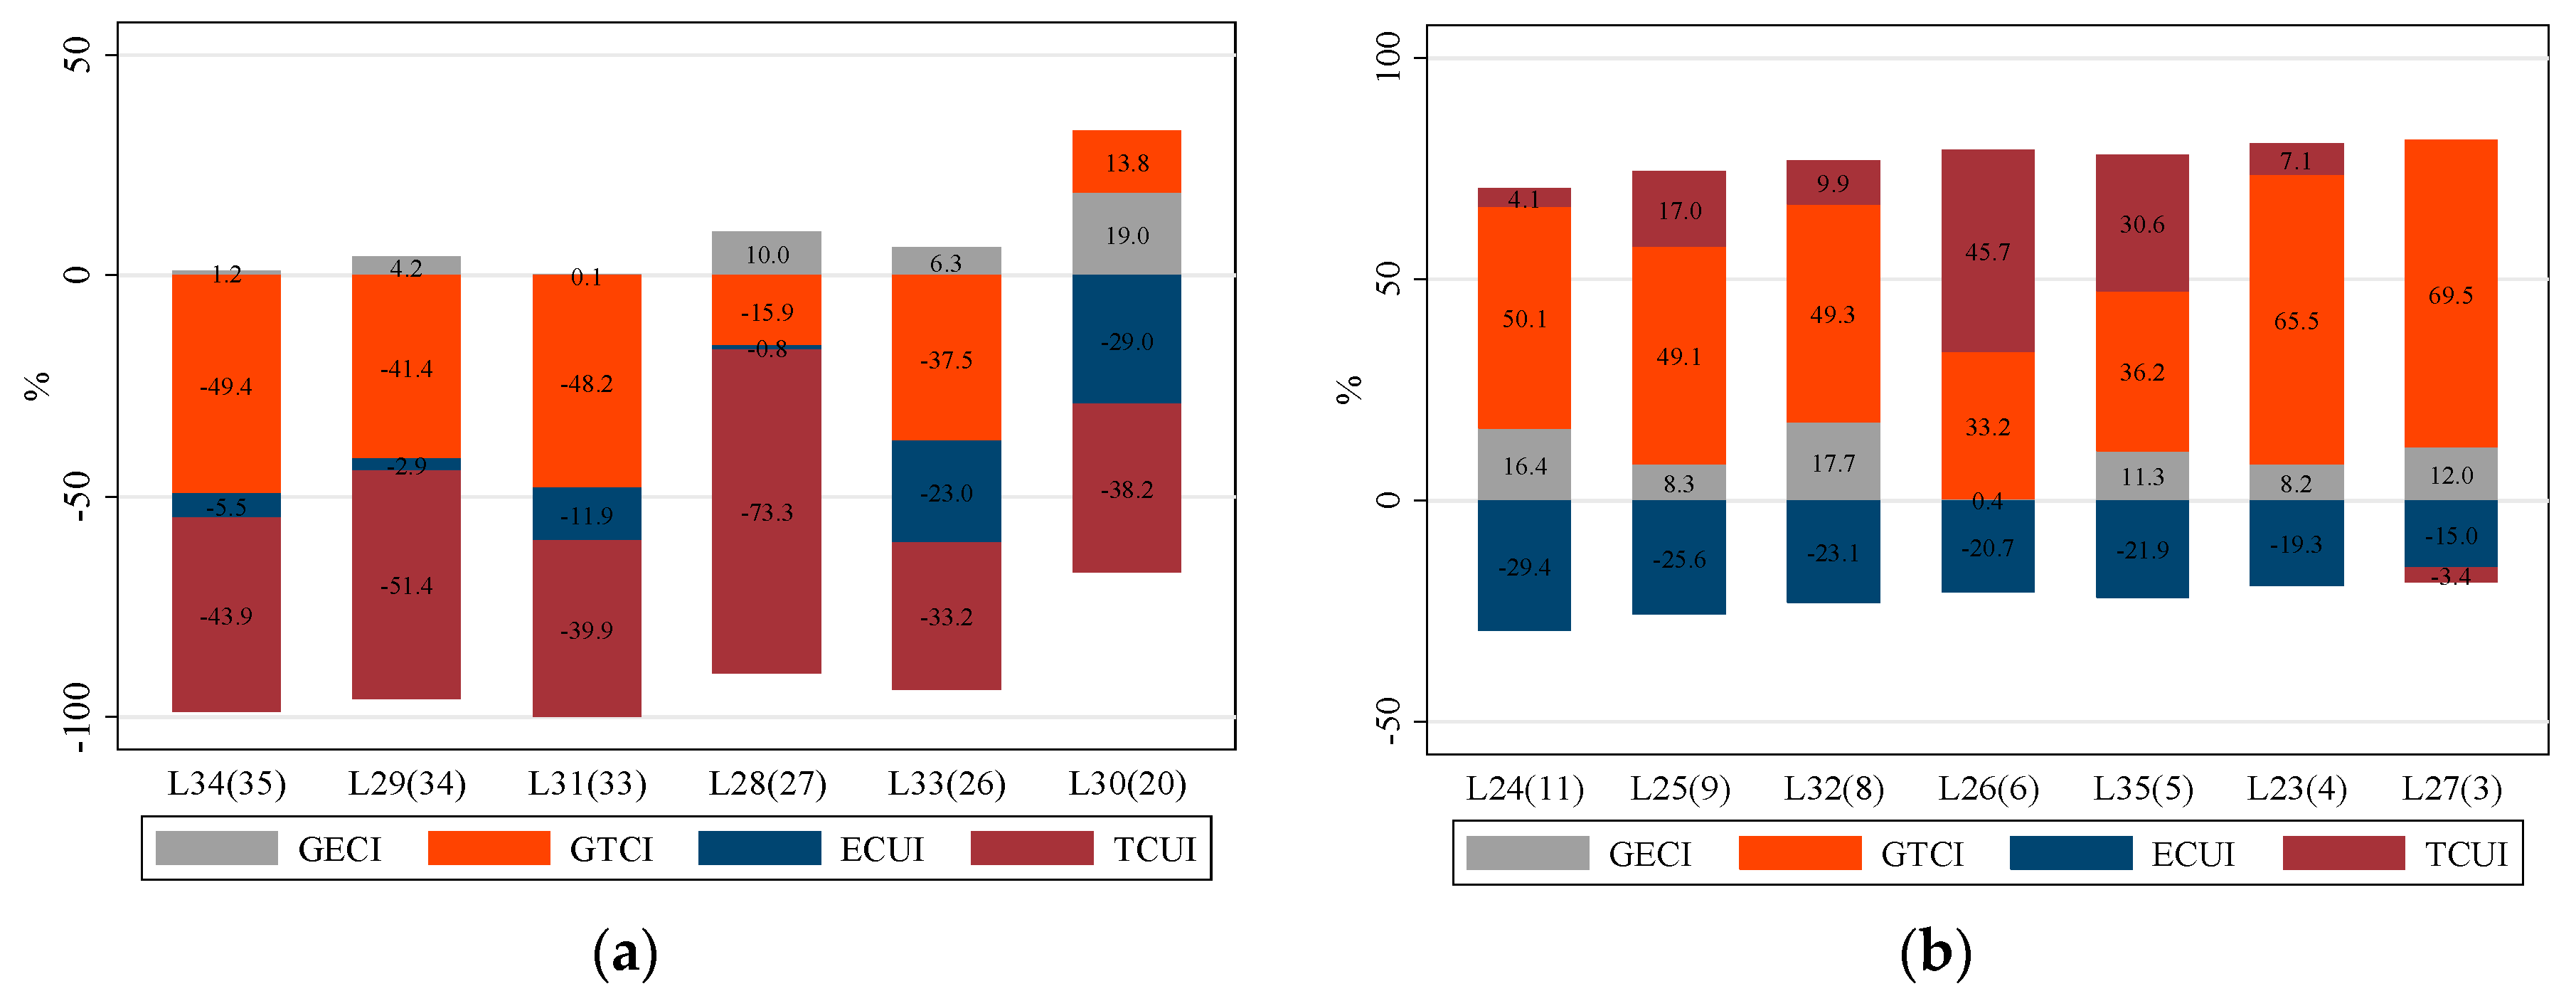
3.3.2. Sectoral-Analysis
4. Conclusions
- (1)
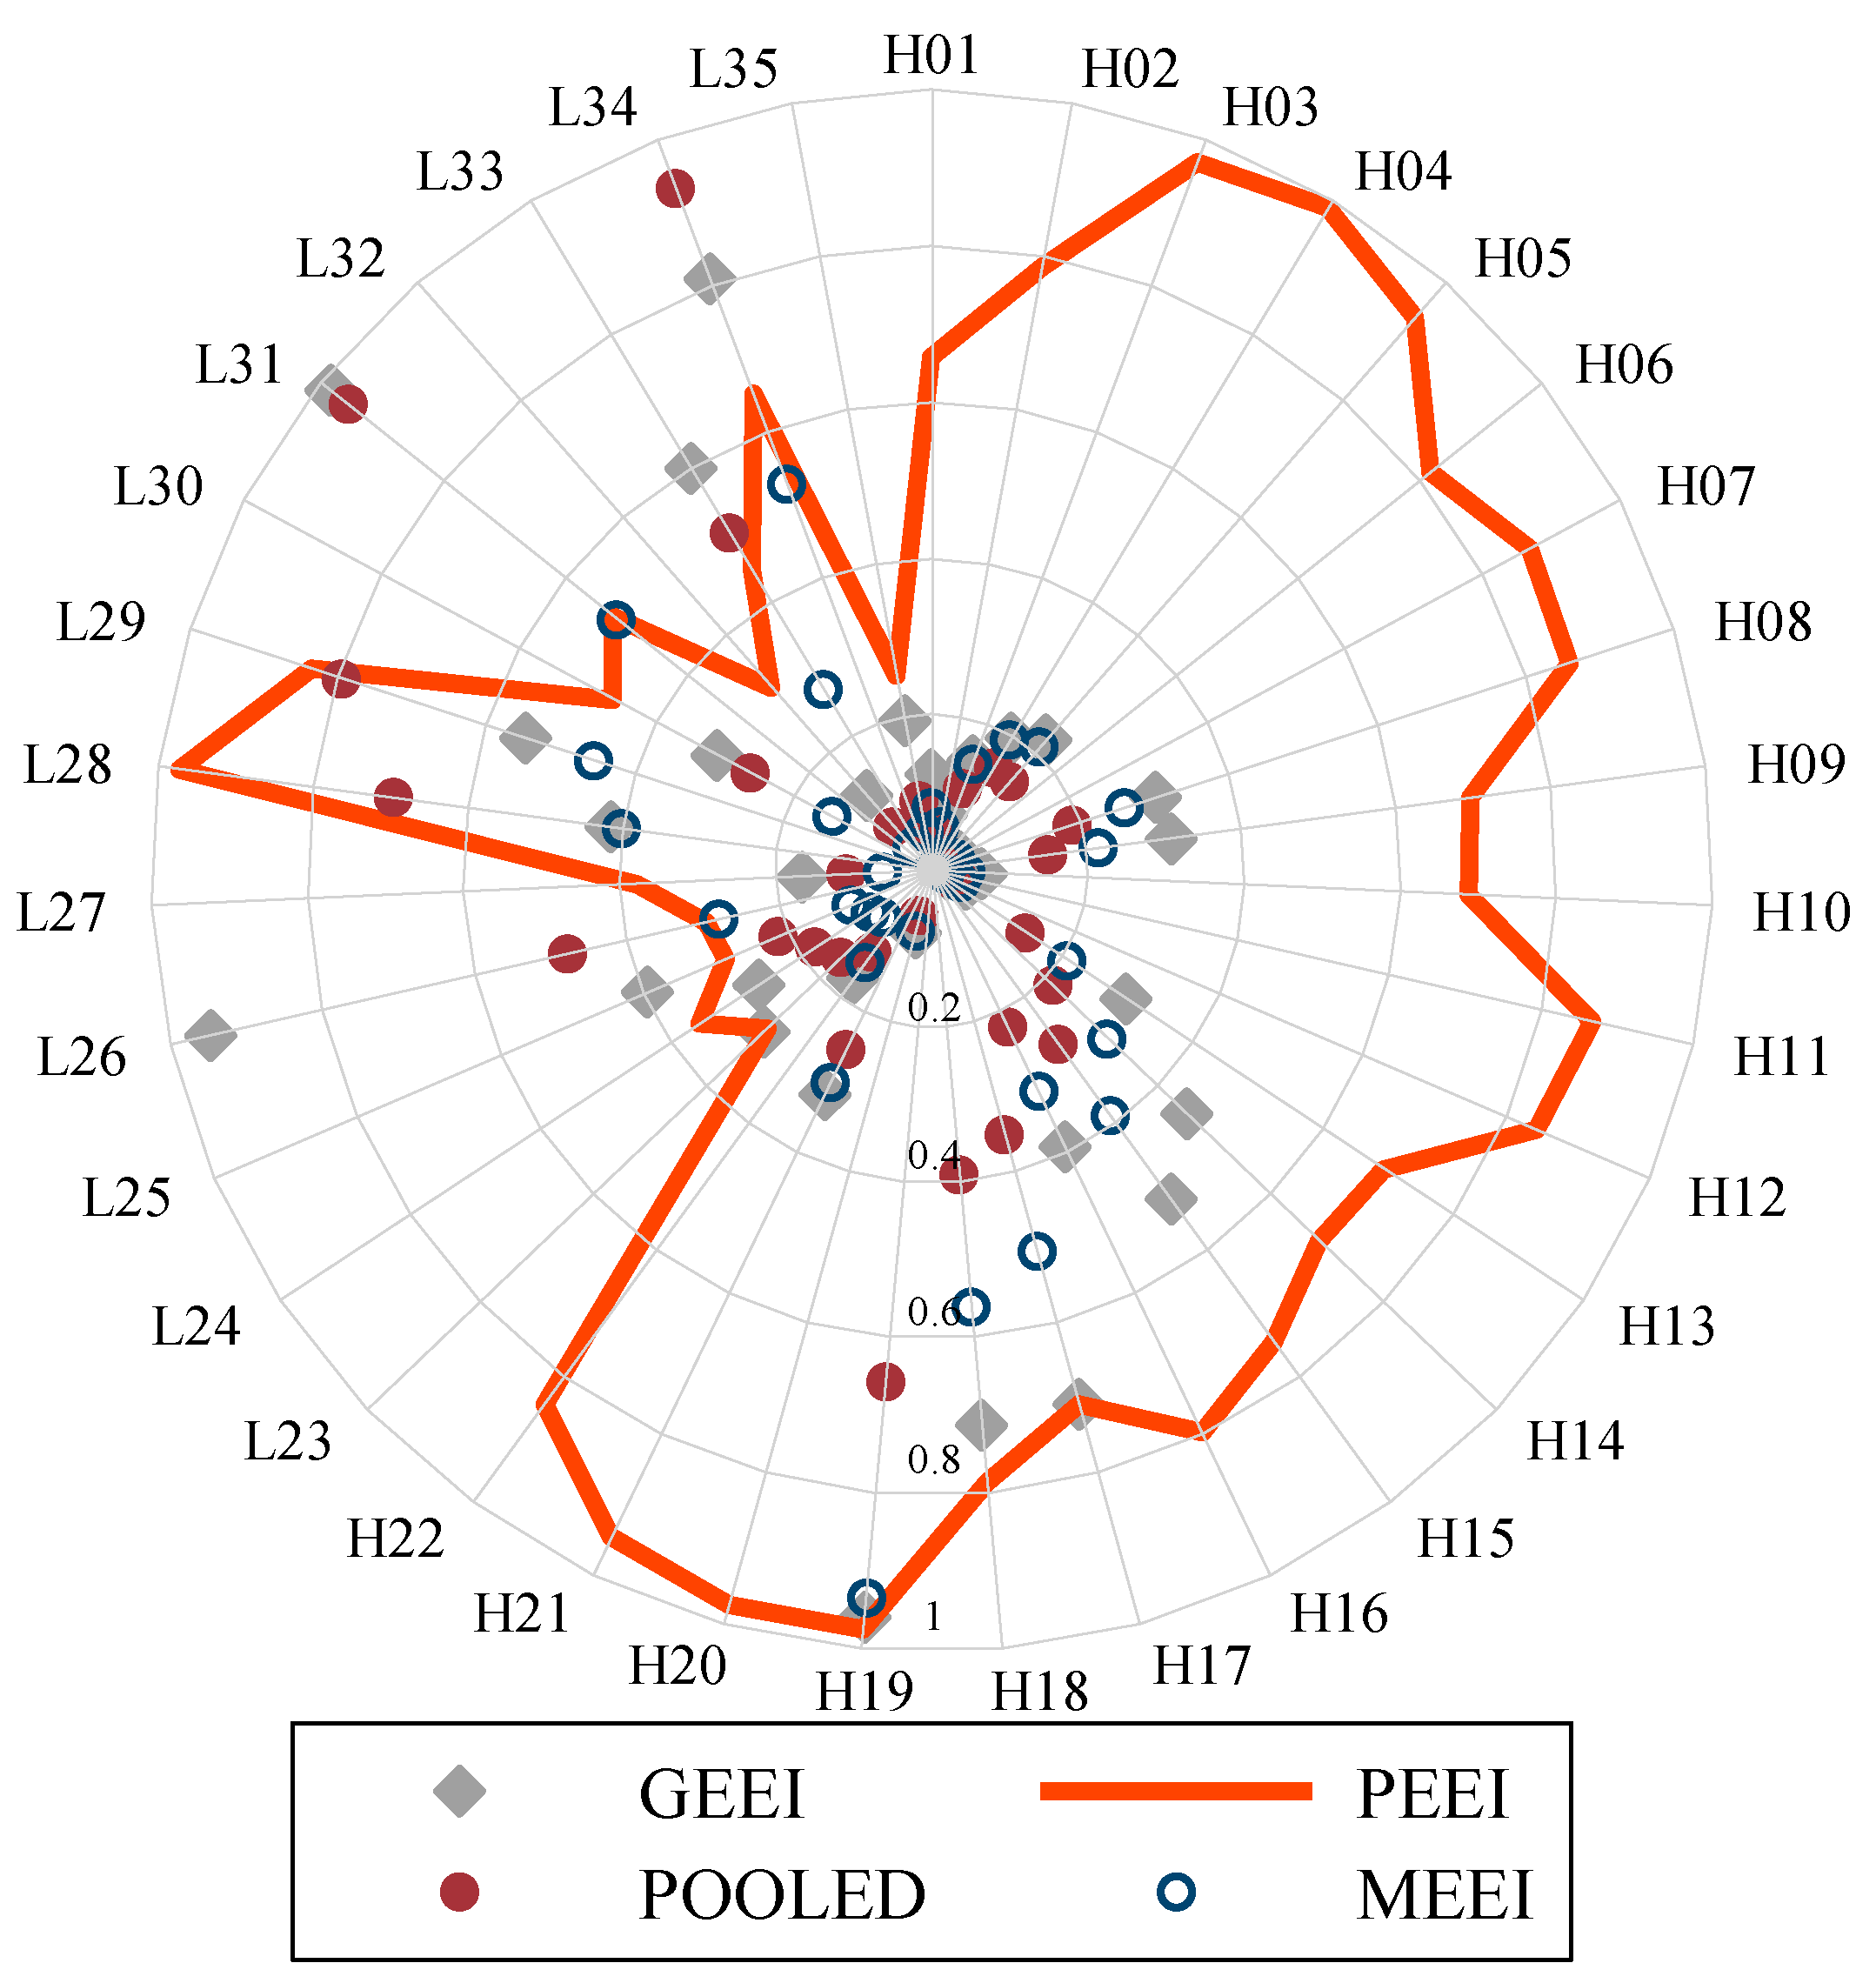
- In view of metafrontier Malmquist energy productivity, overall industry has witnessed a 25% cumulative growth and a U-shaped trend bottoming out in 2006, which may indicate that the ECER programs are effective in the periods of 11th and 12th FYPs. Meanwhile, 19 sub-industries have suffered an energy productivity loss, and the remaining 16 sub-industries have experienced an energy productivity gain.
- (2)
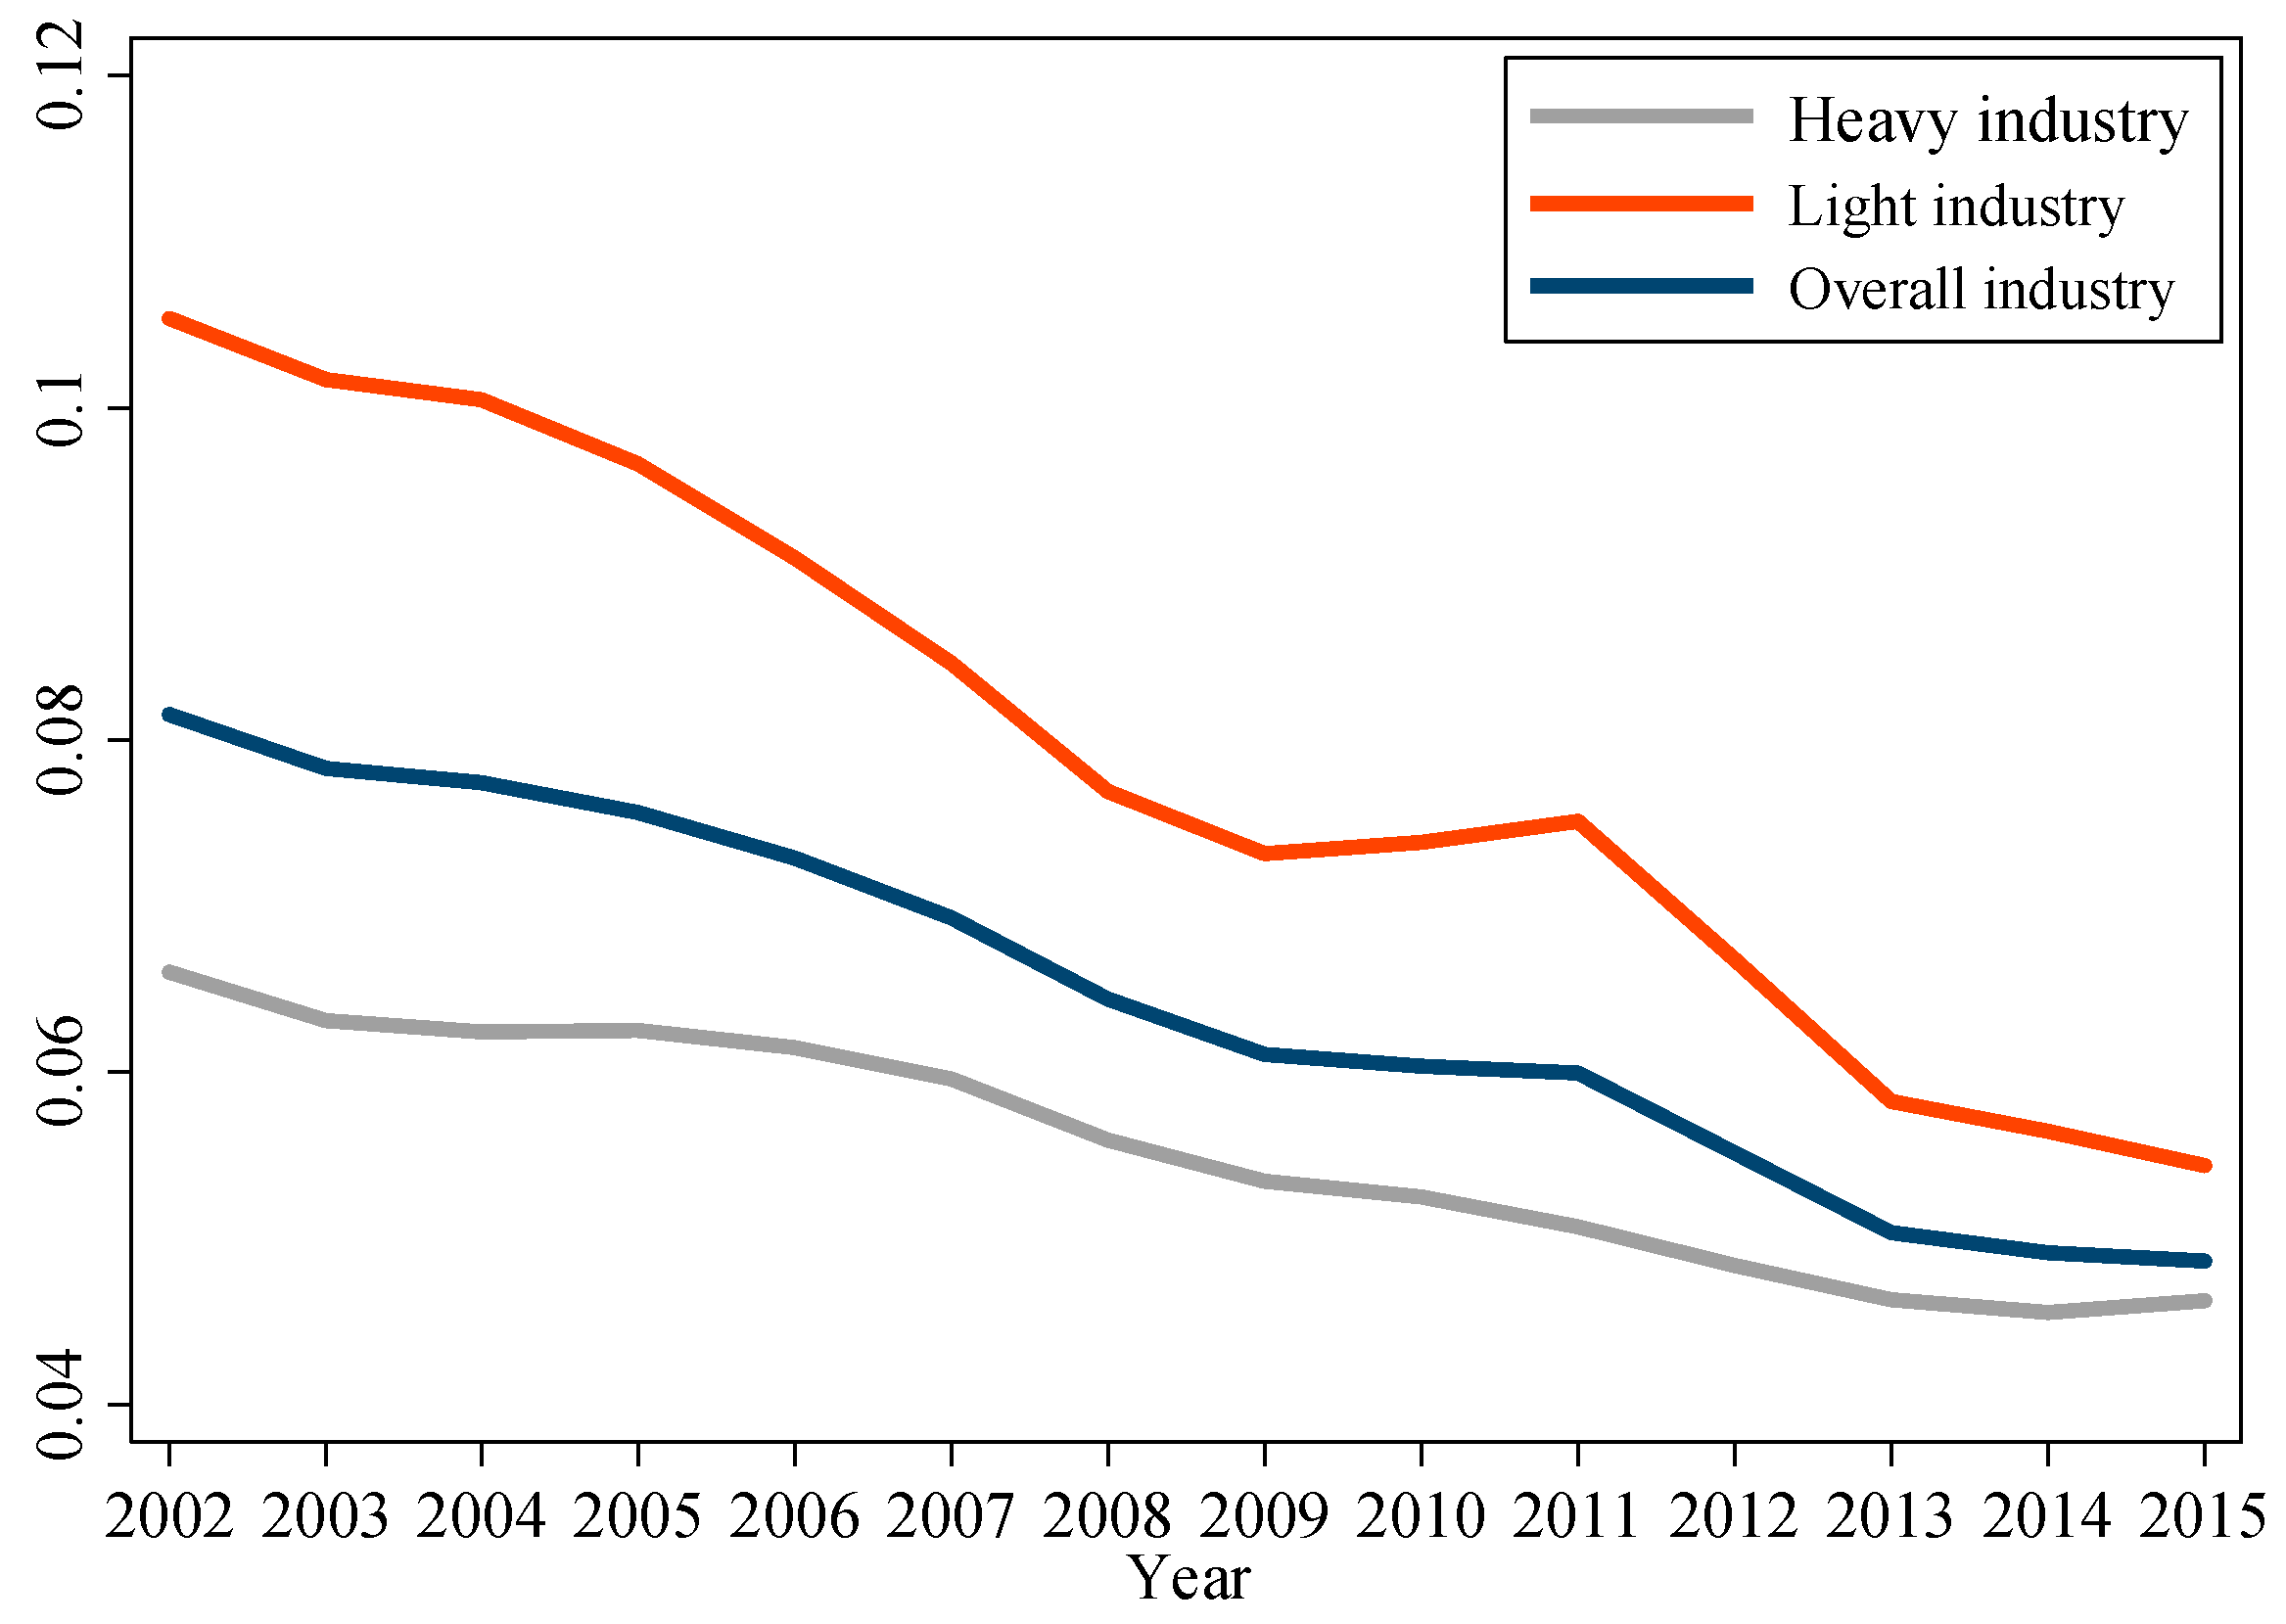
- From the technology heterogeneity perspective, light industry outperforms heavy industry in metafrontier Malmquist energy productivity growth, while groupfrontier Malmquist energy productivity growth is on average a little higher than potential Malmquist energy productivity growth, indicating that the intra-group and inter-group energy productivity develops roughly in balance as a whole.
- (3)
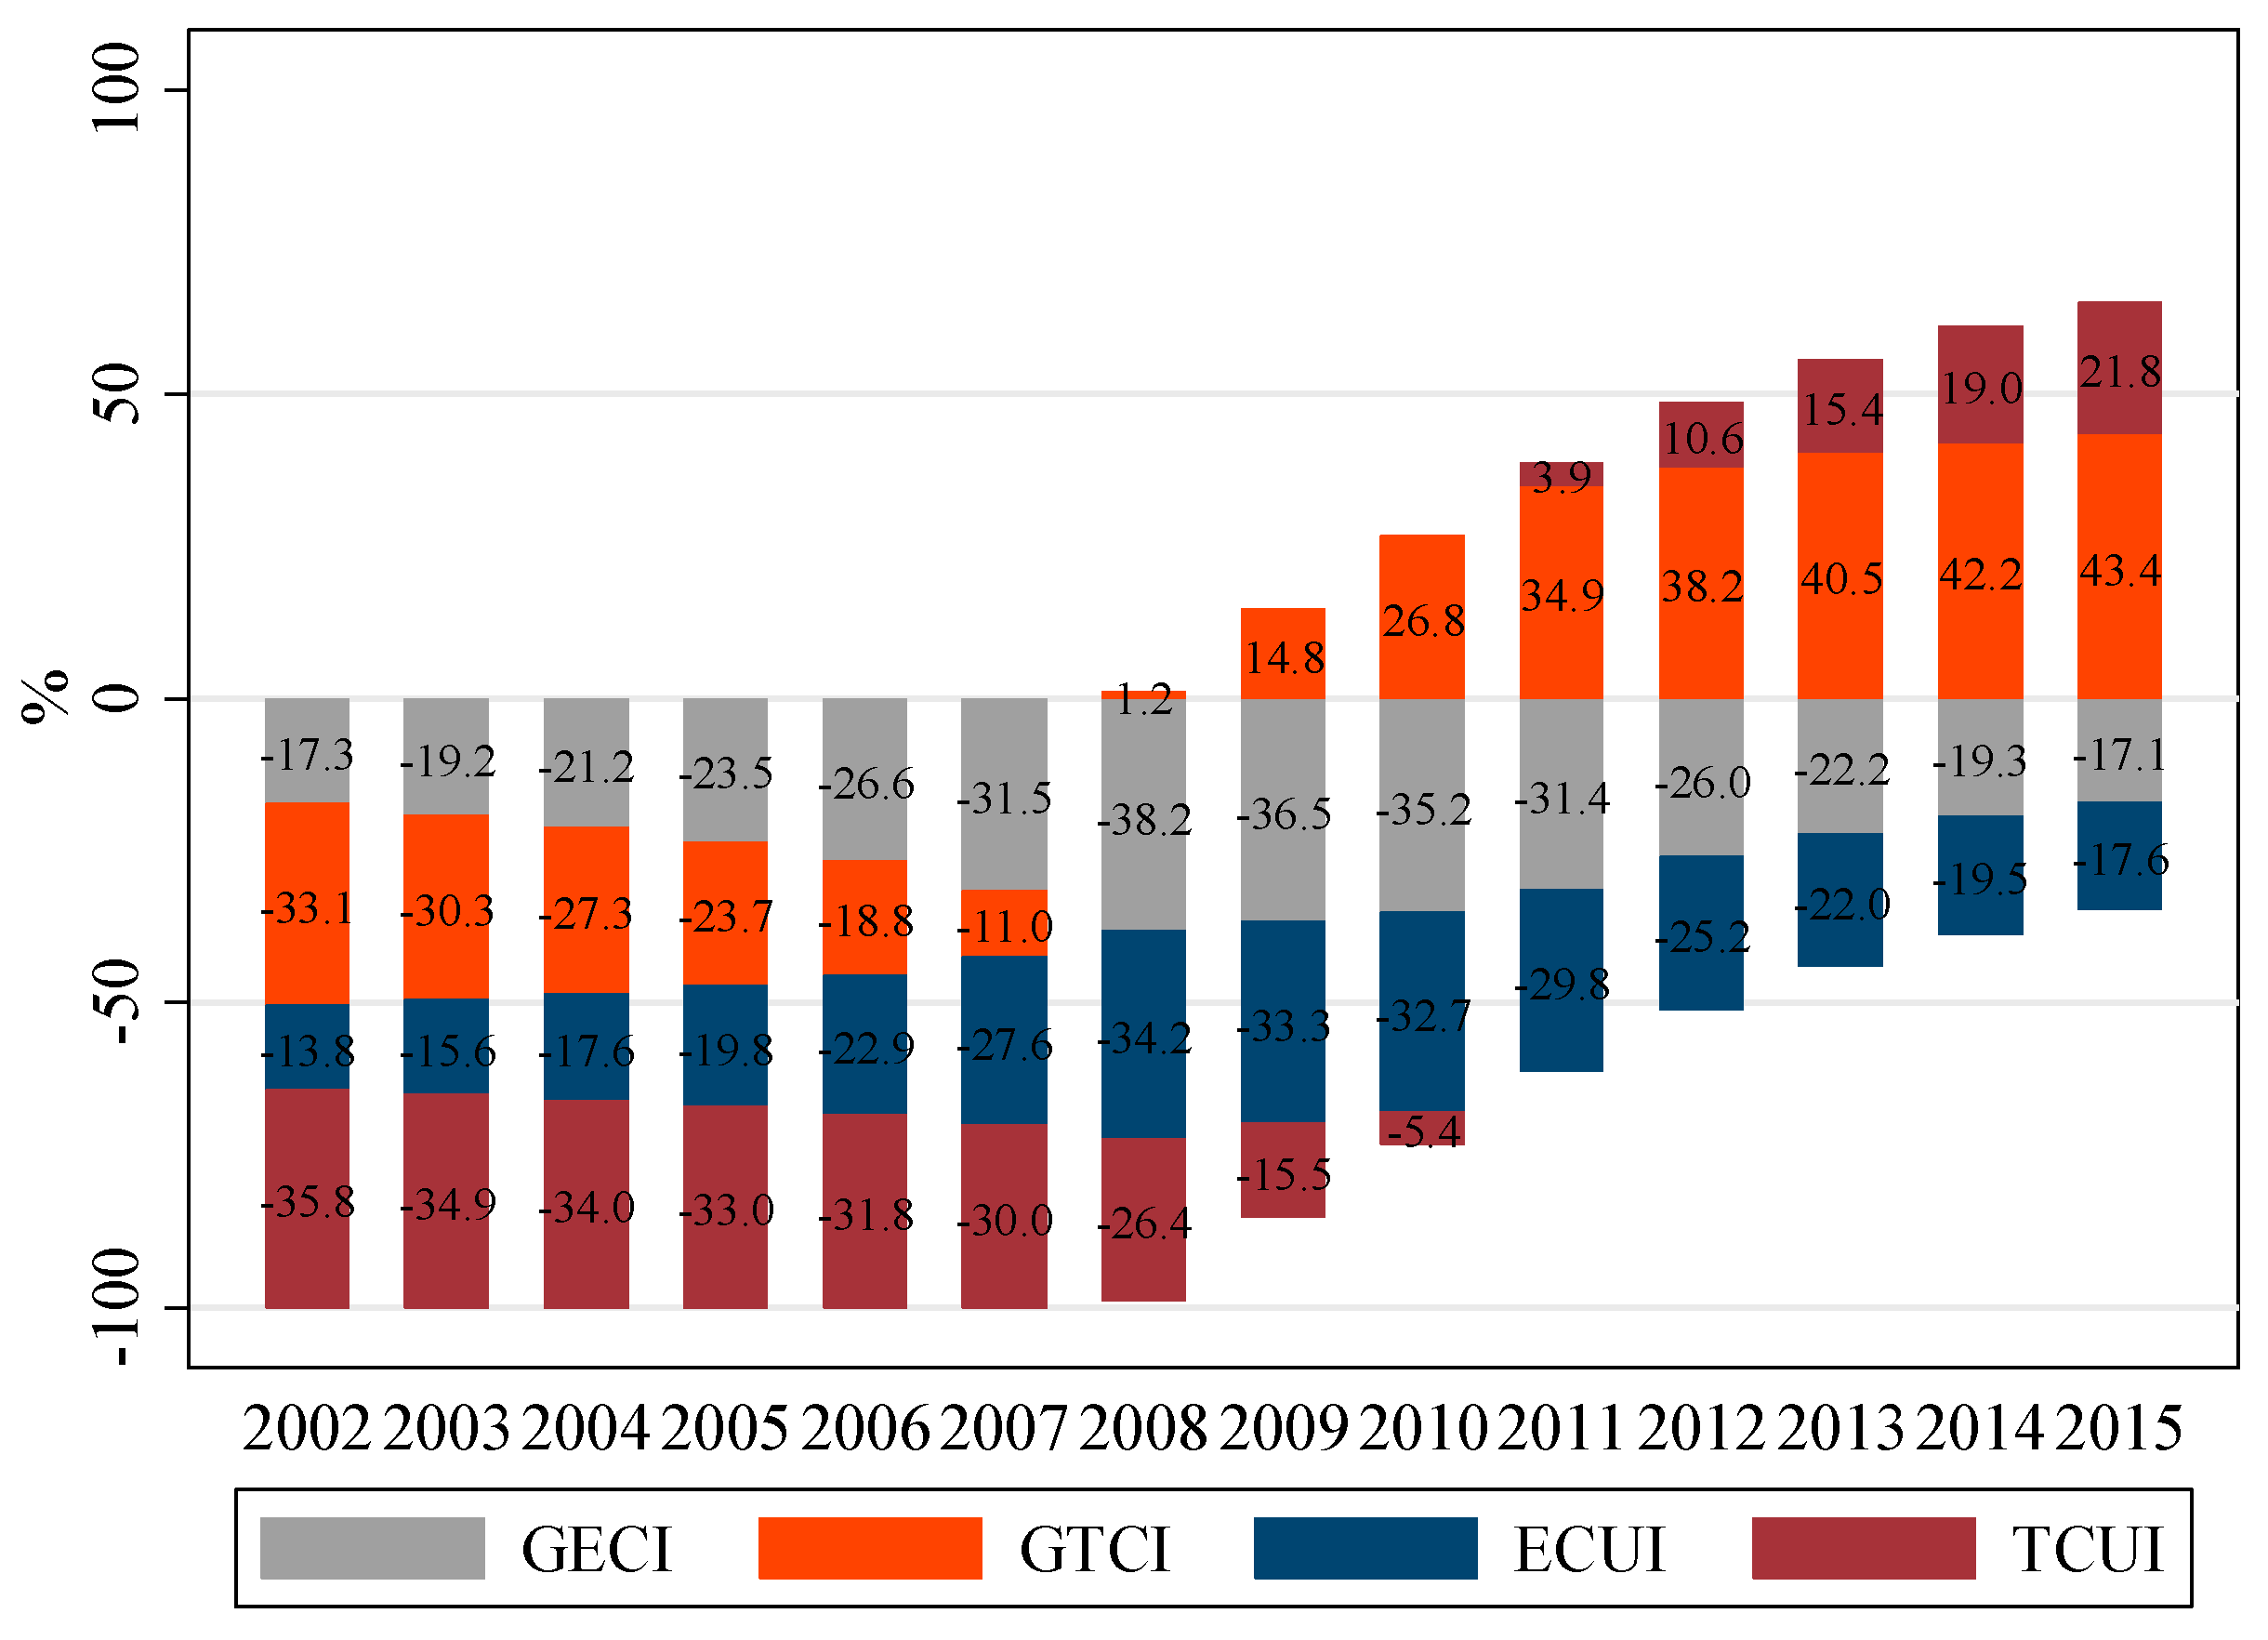
- As for individual components, groupfrontier technological change makes the biggest contribution to energy productivity growth (43.4%), followed by technological catch-up (21.8%), efficiency catch-up (−17.4%) and groupfrontier efficiency change (−17.1%). That is, it is technological change that dominates the energy productivity growth, implying that the existing technologies are not utilized sufficiently and the management efficiency needs to improve. Furthermore, groupfrontier technological change makes positive (mainly negative) contributions in productivity gain (loss) sub-industries; technological catch-up works like groupfrontier technological change, both of which dominate the growth of energy productivity in 28 out of 35 sub-industries; efficiency catch-up contributes negatively to all the sub-industries; groupfrontier efficiency change plays a negative (positive) role in energy productivity growth for heavy (light) industry.
- (4)
- There exists σ-convergence of metafrontier Malmquist energy productivity growth in heavy industry and light industry as well as overall industry, implying that the energy efficiency laggards can catch up the energy efficiency leaders in the future, which is line with the concept of metafrontier.
Acknowledgments
Author Contributions
Conflicts of Interest
References
- Petroleum, B. Statistical Review of World Energy. Available online: http://www.bp.com/content/dam/bp/en/corporate/pdf/energy-economics/statistical-review-2017/bp-statistical-review-of-world-energy-2017-full-report.pdf (accessed on 19 June 2017).
- National Bureau of Statistics of China. Available online: http://data.stats.gov.cn/easyquery.htm?cn=C01 (accessed on 15 May 2017).
- National Development and Reform Commission. Available online: http://www.sdpc.gov.cn/zcfb/zcfbtz/201701/t20170117_835278.html (accessed on 15 May 2017).
- Hu, J.L.; Wang, S.C. Total-factor energy efficiency of regions in China. Energy Policy 2006, 17, 3206–3217. [Google Scholar] [CrossRef]
- Zhou, P.; Ang, B.W. Linear programming models for measuring economy-wide energy efficiency performance. Energy Policy 2008, 8, 2911–2916. [Google Scholar] [CrossRef]
- Li, L.B.; Hu, J.L. Ecological total-factor energy efficiency of regions in China. Energy Policy 2012, 46, 216–224. [Google Scholar] [CrossRef]
- Zhou, P.; Wu, F.; Zhou, D.Q. Total-factor energy efficiency with congestion. Annu. Oper. Res. 2015, 255, 1–16. [Google Scholar] [CrossRef]
- Zhou, D.Q.; Wu, F.; Zhou, X.; Zhou, P. Output-specific energy efficiency assessment: A data envelopment analysis approach. Appl. Energy 2016, 177, 117–126. [Google Scholar] [CrossRef]
- Zhao, L.; Zha, Y.; Liang, N.; Liang, L. Data envelopment analysis for unified efficiency evaluation: An assessment of regional industries in China. J. Clean. Prod. 2016, 113, 695–704. [Google Scholar] [CrossRef]
- Oliveira, R.; Camanho, A.S.; Zanella, A. Expanded eco-efficiency assessment of large mining firms. J. Clean. Prod. 2017, 142, 2364–2373. [Google Scholar] [CrossRef]
- Wu, F.; Fan, L.W.; Zhou, P.; Zhou, D.Q. Industrial energy efficiency with CO2 emissions in China: A nonparametric analysis. Energy Policy 2012, 49, 164–172. [Google Scholar] [CrossRef]
- Du, K.; Lin, B. International comparison of total-factor energy productivity growth: A parametric Malmquist index approach. Energy 2017, 118, 481–488. [Google Scholar] [CrossRef]
- Chang, T.P.; Hu, J.L. Total-factor energy productivity growth, technical progress, and efficiency change: An empirical study of China. Appl. Energy 2010, 10, 3262–3270. [Google Scholar] [CrossRef]
- Wang, H.; Zhou, P.; Zhou, D.Q. Scenario-based energy efficiency and productivity in China: A non-radial directional distance function analysis. Energy Econ. 2013, 40, 795–803. [Google Scholar] [CrossRef]
- Zhou, D.Q.; Wang, Q.; Su, B.; Zhou, P.; Yao, L.X. Industrial energy conservation and emission reduction performance in China: A city-level nonparametric analysis. Appl. Energy 2016, 166, 201–209. [Google Scholar] [CrossRef]
- Li, K.; Lin, B. Impact of energy conservation policies on the green productivity in China’s manufacturing sector: Evidence from a three-stage DEA model. Appl. Energy 2016, 168, 351–363. [Google Scholar] [CrossRef]
- Wang, H.; Ang, B.W.; Wang, Q.W.; Zhou, P. Measuring energy performance with sectoral heterogeneity: A non-parametric frontier approach. Energy Econ. 2017, 62, 70–78. [Google Scholar] [CrossRef]
- Wang, K.; Wei, Y.M. Sources of energy productivity change in China during 1997–2012: A decomposition analysis based on the Luenberger productivity indicator. Energy Econ. 2016, 54, 50–59. [Google Scholar] [CrossRef]
- Shen, X.; Lin, B. Total Factor Energy Efficiency of China’s Industrial Sector: A Stochastic Frontier Analysis. Sustainability 2017, 4, 646. [Google Scholar] [CrossRef]
- Balk, B.M. Scale efficiency and productivity change. J. Prod. Anal. 2001, 3, 159–183. [Google Scholar] [CrossRef]
- Pantzios, C.J.; Karagiannis, G.; Tzouvelekas, V. Parametric decomposition of the input-oriented Malmquist productivity index: With an application to Greek aquaculture. J. Prod. Anal. 2011, 1, 21–31. [Google Scholar] [CrossRef]
- Hayami, Y. Sources of Agricultural Productivity Gap among Selected Countries. Am. J. Agric. Econ. 1969, 3, 564–575. [Google Scholar] [CrossRef]
- Hayami, Y.; Ruttan, V.W. Agricultural productivity differences among countries. Am. Econ. Rev. 1970, 5, 895–911. [Google Scholar]
- Battese, G.E.; Rao, D.S.P. Technology Gap, Efficiency, and a Stochastic Metafrontier Function. Int. J. Bus. Econ. 2002, 2, 87–93. [Google Scholar]
- Battese, G.E.; Rao, D.S.P.; O’Donnell, C.J. A Metafrontier Production Function for Estimation of Technical Efficiencies and Technology Gaps for Firms Operating Under Different Technologies. J. Prod. Anal. 2004, 1, 91–103. [Google Scholar] [CrossRef]
- O’Donnell, C.J.; Rao, D.S.P.; Battese, G.E. Metafrontier frameworks for the study of firm-level efficiencies and technology ratios. Empir. Econ. 2008, 2, 231–255. [Google Scholar] [CrossRef]
- Oh, D.H. A metafrontier approach for measuring an environmentally sensitive productivity growth index. Energy Econ. 2010, 1, 146–157. [Google Scholar] [CrossRef]
- Pastor, J.T.; Lovell, C.A.K. A global Malmquist productivity index. Econ. Lett. 2005, 2, 266–271. [Google Scholar] [CrossRef]
- Chung, Y.; Heshmati, A. Measurement of environmentally sensitive productivity growth in Korean industries. J. Clean. Prod. 2014, 104, 380–391. [Google Scholar] [CrossRef]
- Munisamy, S.; Arabi, B. Eco-efficiency change in power plants: Using a slacks-based measure for the meta-frontier Malmquist–Luenberger productivity index. J. Clean. Prod. 2015, 105, 218–232. [Google Scholar] [CrossRef]
- Wang, H.; Zhou, P.; Wang, Q. Constructing slacks-based composite indicator of sustainable energy development for China: A meta-frontier nonparametric approach. Energy 2016, 101, 218–228. [Google Scholar] [CrossRef]
- Li, K.; Song, M. Green Development Performance in China: A Metafrontier Non-Radial Approach. Sustainability 2016, 3, 219. [Google Scholar] [CrossRef]
- Fei, R.; Lin, B. Energy efficiency and production technology heterogeneity in China’s agricultural sector: A meta-frontier approach. Technol. Forecast. Soc. Chang. 2016, 109, 25–34. [Google Scholar] [CrossRef]
- Li, K.; Lin, B. Metafroniter energy efficiency with CO2 emissions and its convergence analysis for China. Energy Econ. 2015, 48, 230–241. [Google Scholar] [CrossRef]
- Chen, K.H.; Yang, H.Y. Extensions of the metafrontier Malmquist productivity index: An empirical study with cross-country macro-data. Taiwan Econ. Rev. 2008, 4, 551–588. [Google Scholar]
- Chen, Y.Y.; Schmidt, P.; Wang, H.J. Consistent estimation of the fixed effects stochastic frontier model. J. Econom. 2014, 2, 65–76. [Google Scholar] [CrossRef]
- Zhang, Z.; Ye, J. Decomposition of environmental total factor productivity growth using hyperbolic distance functions: A panel data analysis for China. Energy Econ. 2015, 47, 87–97. [Google Scholar] [CrossRef]
- Cuesta, R.A.; Lovell, C.A.K.; Zofío, J.L. Environmental efficiency measurement with translog distance functions: A parametric approach. Ecol. Econ. 2009, 8, 2232–2242. [Google Scholar] [CrossRef]
- Lin, E.Y.Y.; Chen, P.Y.; Chen, C.C. Measuring green productivity of country: A generlized metafrontier Malmquist productivity index approach. Energy 2013, 55, 340–353. [Google Scholar]
- Orea, L. Parametric decomposition of a generalized Malmquist productivity index. J. Prod. Anal. 2002, 1, 5–22. [Google Scholar] [CrossRef]
- Zhang, N.; Wang, B. A deterministic parametric metafrontier Luenberger indicator for measuring environmentally-sensitive productivity growth: A Korean fossil-fuel power case. Energy Econ. 2015, 51, 88–98. [Google Scholar] [CrossRef]
- Chen, K.H.; Yang, H.Y. A cross-country comparison of productivity growth using the generalised metafrontier Malmquist productivity index: With application to banking industries in Taiwan and China. J. Prod. Anal. 2011, 3, 197–212. [Google Scholar] [CrossRef]
- Zhou, P.; Ang, B.W.; Zhou, D.Q. Measuring economy-wide energy efficiency performance: A parametric frontier approach. Appl. Energy 2012, 1, 196–200. [Google Scholar] [CrossRef]
- Huang, C.J.; Huang, T.H.; Liu, N.H. A new approach to estimating the metafrontier production function based on a stochastic frontier framework. J. Prod. Anal. 2014, 3, 241–254. [Google Scholar] [CrossRef]
- Chen, S.; Golley, J. ‘Green’ productivity growth in China’s industrial economy. Energy Econ. 2014, 44, 89–98. [Google Scholar] [CrossRef]
- Fan, M.; Shao, S.; Yang, L. Combining global Malmquist-Luenberger index and generalized method of moments to investigate industrial total factor CO2 emission performance: A case of Shanghai (China). Energy Policy 2015, 79, 189–201. [Google Scholar] [CrossRef]
- Li, K.; Lin, B. Measuring green productivity growth of Chinese industrial sectors during 1998–2011. China Econ. Rev. 2015, 36, 279–295. [Google Scholar] [CrossRef]
- Emrouznejad, A.; Yang, G. A framework for measuring global Malmquist–Luenberger productivity index with CO2 emissions on Chinese manufacturing industries. Energy 2016, 115, 840–856. [Google Scholar] [CrossRef]
- Yang, M.; Yang, F. Energy-Efficiency Policies and Energy Productivity Improvements: Evidence from China’s Manufacturing Industry. Emerg. Mark. Financ. Trade 2016, 6, 1395–1404. [Google Scholar] [CrossRef]
- Lin, B.; Du, K. Technology gap and China’s regional energy efficiency: A parametric metafrontier approach. Energy Econ. 2013, 40, 529–536. [Google Scholar] [CrossRef]
- Malmquist, S. Index numbers and indifference surfaces. Traba. Estad. 1953, 2, 209–242. [Google Scholar] [CrossRef]
- Caves, D.W.; Christensen, L.R.; Diewert, W.E. Multilateral comparisons of output, input, and productivity using superlative index numbers. Econ. J. 1982, 365, 73–86. [Google Scholar] [CrossRef]
- Fare, R.; Grosskopf, S.; Norris, M.E. Productivity Growth, Technical Progress, and Efficiency Change in Industrialized Countries. Am. Econ. Rev. 1994, 1, 66–83. [Google Scholar]
- Filippini, M.; Hunt, L.C. Measurement of energy efficiency based on economic foundations. Energy Econ. 2015, 52, S5–S16. [Google Scholar] [CrossRef]
- Battese, G.E.; Coelli, T.J. Frontier production functions, technical efficiency and panel data: With application to paddy farmers in India. J. Prod. Anal. 1992, 3, 153–169. [Google Scholar] [CrossRef]
- Chang, B.G.; Huang, T.H.; Kuo, C.Y. A comparison of the technical efficiency of accounting firms among the US, China, and Taiwan under the framework of a stochastic metafrontier production function. J. Prod. Anal. 2015, 3, 337–349. [Google Scholar] [CrossRef]
- White, H. Maximum likelihood estimation of misspecified models. Econom. J. Econom. Soc. 1982, 50, 1–25. [Google Scholar] [CrossRef]
- Fuentes, H.J.; Grifell-Tatjé, E.; Perelman, S. A Parametric Distance Function Approach for Malmquist Productivity Index Estimation. J. Prod. Anal. 2001, 2, 79–94. [Google Scholar] [CrossRef]
- Chen, S. Reconstruction of sub-industrial statistical data in China (1980–2008). China Econ. Quart. 2011, 3, 735–776. [Google Scholar]
- Li, J.; Lin, B. Ecological total-factor energy efficiency of China’s heavy and light industries: Which performs better? Renew. Sustain. Energy Rev. 2017, 72, 83–94. [Google Scholar] [CrossRef]
- Greene, W. Fixed and random effects in stochastic frontier models. J. Prod. Anal. 2005, 1, 7–32. [Google Scholar] [CrossRef]


| Variables | Units | Heavy industry | Light industry | ||||||||
|---|---|---|---|---|---|---|---|---|---|---|---|
| Obs. | Mean | Std. dev. | Min | Max | Obs. | Mean | Std. dev. | Min | Max | ||
| Y | 109 RMB | 330 | 1.254 | 2.078 | 0.009 | 15.413 | 195 | 0.541 | 0.456 | 0.056 | 2.433 |
| K | 109 RMB | 330 | 0.372 | 0.476 | 0.016 | 3.628 | 195 | 0.118 | 0.109 | 0.005 | 0.599 |
| L | 109 Persons | 330 | 0.036 | 0.028 | 0.002 | 0.108 | 195 | 0.027 | 0.022 | 0.002 | 0.095 |
| E | 109 TCE | 330 | 0.769 | 1.296 | 0.015 | 8.034 | 195 | 0.143 | 0.162 | 0.009 | 0.730 |
| K/L | RMB/Person | 330 | 15.019 | 18.309 | 1.130 | 110.882 | 195 | 6.698 | 6.887 | 0.373 | 30.250 |
| E/Y | TCE/RMB | 330 | 1.885 | 2.624 | 0.020 | 13.608 | 195 | 0.266 | 0.227 | 0.038 | 1.229 |
| First Step | Second Step | |||||||
|---|---|---|---|---|---|---|---|---|
| I Pooled a | II Heavy a | III Light a | IV Metafrontier b | |||||
| lnk | 0.221 ** | 0.110 | 0.868 *** | 0.138 | −0.669 ** | 0.308 | 0.124 | 0.142 |
| lnl | −0.720 *** | 0.235 | −1.673 *** | 0.238 | 0.832 ** | 0.377 | −0.969 ** | 0.392 |
| lny | −0.531 *** | 0.136 | −0.221 * | 0.137 | −1.337 *** | 0.361 | −0.399 ** | 0.181 |
| t | −0.057 *** | 0.021 | −0.168 *** | 0.026 | 0.114 *** | 0.042 | −0.056 ** | 0.023 |
| (lnk)2 | −0.071 *** | 0.015 | −0.058 ** | 0.025 | −0.124 *** | 0.050 | −0.075 *** | 0.009 |
| (lnl)2 | −0.140 *** | 0.039 | −0.311 *** | 0.042 | −0.026 | 0.045 | −0.171 *** | 0.055 |
| (lny)2 | 0.024 | 0.022 | 0.017 | 0.020 | −0.145 | 0.134 | 0.021 | 0.018 |
| t2 | 0.001 | 0.001 | 0.001** | 0.001 | −0.003** | 0.001 | 0.000 | 0.000 |
| lnklnl | 0.257 *** | 0.033 | 0.414 *** | 0.051 | 0.279 *** | 0.052 | 0.238 *** | 0.044 |
| lnklny | −0.089 *** | 0.025 | −0.115 *** | 0.025 | −0.221 * | 0.134 | −0.084 *** | 0.024 |
| tlnk | 0.029 *** | 0.003 | 0.032 *** | 0.005 | 0.048 *** | 0.013 | 0.036 *** | 0.002 |
| lnllny | −0.043 | 0.046 | 0.055 | 0.046 | 0.026 | 0.113 | −0.005 | 0.049 |
| tlnl | −0.030 *** | 0.005 | −0.059 *** | 0.007 | −0.026 *** | 0.010 | −0.036 *** | 0.005 |
| tlny | 0.010 *** | 0.004 | 0.015 *** | 0.004 | 0.040* | 0.022 | 0.010 *** | 0.002 |
| dum115 | 0.053 ** | 0.023 | 0.081 *** | 0.024 | 0.087** | 0.038 | 0.055 *** | 0.008 |
| dum125 | 0.048 | 0.036 | 0.049 | 0.037 | 0.149 *** | 0.056 | 0.048 *** | 0.010 |
| cons | 1.546 *** | 0.452 | −0.074 | 0.486 | 2.537 *** | 0.562 | 0.946 | 0.130 |
| μ | 1.678 *** | 0.447 | 1.552 ** | 0.669 | 1.045 *** | 0.180 | −4.287 *** | 1.692 |
| η | −0.013 *** | 0.002 | −0.020 *** | 0.002 | 0.008 | 0.006 | −0.019 *** | 0.004 |
| lnσ2 | 0.827 ** | 0.406 | 0.922 * | 0.544 | −1.925 *** | 0.291 | 1.014 *** | 0.266 |
| ln[γ/(1 − γ)] | 5.260 *** | 0.414 | 5.734 *** | 0.552 | 2.677 *** | 0.385 | 6.846 *** | 0.400 |
| log-likelihood | 293.397 | 243.325 | 81.528 | 678.769 | ||||
| LR test | Chi-squared = 62.91 (p-value = 0.000) | |||||||
| obs. | 525 | 330 | 195 | 525 | ||||
| Groups | Periods | Cumulative Growth Index | Log Cumulative Growth | ||||||||
|---|---|---|---|---|---|---|---|---|---|---|---|
| MMEPI | GECI | GTCI | ECUI | TCUI | MMEPI | GECI | GTCI | ECUI | TCUI | ||
| Heavy | 2001–2005 | 0.821 | 0.882 | 0.938 | 0.986 | 0.998 | −0.198 | −0.125 | −0.064 | −0.014 | −0.002 |
| Light | 2001–2005 | 0.866 | 1.034 | 0.977 | 0.943 | 0.885 | −0.144 | 0.033 | −0.023 | −0.059 | −0.122 |
| Overall | 2001–2005 | 0.837 | 0.938 | 0.952 | 0.970 | 0.956 | −0.177 | −0.064 | −0.049 | −0.030 | −0.045 |
| Heavy | 2006–2010 | 0.966 | 0.871 | 1.044 | 0.985 | 1.075 | −0.034 | −0.138 | 0.044 | −0.015 | 0.072 |
| Light | 2006–2010 | 1.041 | 1.032 | 1.094 | 0.937 | 0.971 | 0.040 | 0.032 | 0.090 | −0.065 | −0.030 |
| Overall | 2006–2010 | 0.994 | 0.931 | 1.063 | 0.967 | 1.036 | −0.006 | −0.072 | 0.061 | −0.033 | 0.036 |
| Heavy | 2011–2015 | 1.174 | 0.858 | 1.184 | 0.983 | 1.177 | 0.160 | −0.153 | 0.169 | −0.017 | 0.163 |
| Light | 2011–2015 | 1.195 | 1.031 | 1.171 | 0.931 | 1.057 | 0.179 | 0.031 | 0.158 | −0.071 | 0.055 |
| Overall | 2011–2015 | 1.182 | 0.922 | 1.179 | 0.964 | 1.132 | 0.167 | −0.081 | 0.165 | −0.037 | 0.124 |
| Heavy | 2001–2015 | 1.139 | 0.635 | 1.290 | 0.948 | 1.394 | 0.130 | −0.454 | 0.255 | −0.053 | 0.332 |
| Light | 2001–2015 | 1.437 | 1.120 | 1.496 | 0.800 | 0.969 | 0.363 | 0.114 | 0.403 | −0.223 | −0.032 |
| Overall | 2001–2015 | 1.250 | 0.815 | 1.366 | 0.893 | 1.236 | 0.223 | −0.204 | 0.312 | −0.113 | 0.212 |
| Indus. | 01/02 | 02/03 | 03/04 | 04/05 | 05/06 | 06/07 | 07/08 | 08/09 | 09/10 | 10/11 | 11/12 | 12/13 | 13/14 | 14/15 | Geom. |
|---|---|---|---|---|---|---|---|---|---|---|---|---|---|---|---|
| H01 | 0.875 | 0.882 | 0.886 | 0.883 | 0.881 | 0.887 | 0.902 | 0.920 | 0.934 | 0.948 | 0.957 | 0.964 | 0.977 | 0.989 | 0.920 |
| H02 | 1.044 | 1.040 | 1.029 | 1.025 | 1.020 | 1.023 | 1.033 | 1.049 | 1.058 | 1.064 | 1.075 | 1.093 | 1.114 | 1.128 | 1.056 |
| H03 | 0.915 | 0.919 | 0.916 | 0.907 | 0.906 | 0.920 | 0.943 | 0.969 | 0.988 | 1.005 | 1.018 | 1.028 | 1.043 | 1.062 | 0.966 |
| H04 | 0.936 | 0.948 | 0.959 | 0.966 | 0.972 | 0.974 | 0.981 | 0.997 | 1.008 | 1.015 | 1.020 | 1.025 | 1.037 | 1.051 | 0.992 |
| H05 | 0.858 | 0.875 | 0.887 | 0.900 | 0.914 | 0.929 | 0.932 | 0.931 | 0.939 | 0.950 | 0.959 | 0.968 | 0.977 | 0.984 | 0.928 |
| H06 | 1.002 | 1.006 | 1.009 | 1.006 | 1.003 | 1.005 | 1.014 | 1.033 | 1.050 | 1.056 | 1.061 | 1.071 | 1.080 | 1.089 | 1.034 |
| H07 | 0.949 | 0.956 | 0.960 | 0.963 | 0.968 | 0.974 | 0.982 | 0.993 | 1.003 | 1.014 | 1.026 | 1.036 | 1.047 | 1.058 | 0.994 |
| H08 | 0.964 | 0.978 | 0.990 | 1.001 | 1.012 | 1.022 | 1.028 | 1.032 | 1.037 | 1.043 | 1.047 | 1.053 | 1.064 | 1.072 | 1.024 |
| H09 | 0.875 | 0.884 | 0.891 | 0.892 | 0.896 | 0.909 | 0.927 | 0.942 | 0.950 | 0.961 | 0.974 | 0.987 | 1.000 | 1.008 | 0.935 |
| H10 | 0.837 | 0.848 | 0.861 | 0.874 | 0.887 | 0.901 | 0.913 | 0.924 | 0.935 | 0.949 | 0.963 | 0.974 | 0.984 | 0.995 | 0.916 |
| H11 | 0.945 | 0.956 | 0.967 | 0.973 | 0.981 | 0.990 | 0.999 | 1.010 | 1.022 | 1.030 | 1.037 | 1.039 | 1.044 | 1.052 | 1.003 |
| H12 | 0.936 | 0.949 | 0.958 | 0.960 | 0.966 | 0.972 | 0.978 | 0.992 | 1.009 | 1.022 | 1.031 | 1.042 | 1.053 | 1.064 | 0.994 |
| H13 | 0.845 | 0.860 | 0.873 | 0.882 | 0.896 | 0.915 | 0.932 | 0.943 | 0.950 | 0.961 | 0.977 | 0.986 | 0.997 | 1.003 | 0.929 |
| H14 | 0.895 | 0.903 | 0.906 | 0.908 | 0.916 | 0.929 | 0.946 | 0.961 | 0.971 | 0.982 | 0.989 | 0.998 | 1.009 | 1.017 | 0.951 |
| H15 | 0.921 | 0.929 | 0.933 | 0.941 | 0.951 | 0.962 | 0.973 | 0.982 | 0.989 | 0.999 | 1.010 | 1.019 | 1.028 | 1.036 | 0.976 |
| H16 | 0.945 | 0.954 | 0.961 | 0.966 | 0.974 | 0.985 | 0.994 | 1.006 | 1.016 | 1.028 | 1.037 | 1.046 | 1.057 | 1.067 | 1.002 |
| H17 | 0.904 | 0.906 | 0.910 | 0.910 | 0.915 | 0.925 | 0.944 | 0.966 | 0.980 | 0.997 | 1.011 | 1.019 | 1.029 | 1.037 | 0.960 |
| H18 | 0.989 | 0.992 | 0.992 | 0.984 | 0.981 | 0.984 | 0.979 | 0.983 | 1.004 | 1.016 | 1.022 | 1.035 | 1.047 | 1.054 | 1.004 |
| H19 | 0.898 | 0.910 | 0.919 | 0.929 | 0.937 | 0.947 | 0.956 | 0.966 | 0.978 | 0.989 | 0.993 | 1.003 | 1.019 | 1.029 | 0.962 |
| H20 | 1.056 | 1.062 | 1.076 | 1.088 | 1.093 | 1.103 | 1.114 | 1.122 | 1.132 | 1.148 | 1.155 | 1.155 | 1.162 | 1.174 | 1.117 |
| H21 | 1.028 | 1.042 | 1.061 | 1.072 | 1.086 | 1.100 | 1.102 | 1.108 | 1.117 | 1.122 | 1.122 | 1.121 | 1.130 | 1.144 | 1.096 |
| H22 | 0.965 | 0.968 | 0.976 | 0.984 | 0.992 | 1.005 | 1.010 | 1.007 | 1.012 | 1.024 | 1.033 | 1.036 | 1.042 | 1.044 | 1.007 |
| L23 | 1.017 | 1.025 | 1.031 | 1.036 | 1.050 | 1.070 | 1.082 | 1.088 | 1.095 | 1.104 | 1.115 | 1.126 | 1.134 | 1.138 | 1.079 |
| L24 | 0.976 | 0.986 | 0.989 | 0.993 | 1.005 | 1.024 | 1.039 | 1.044 | 1.046 | 1.049 | 1.054 | 1.059 | 1.065 | 1.071 | 1.028 |
| L25 | 1.009 | 1.012 | 1.022 | 1.028 | 1.037 | 1.045 | 1.049 | 1.052 | 1.057 | 1.062 | 1.065 | 1.068 | 1.074 | 1.077 | 1.047 |
| L26 | 1.061 | 1.064 | 1.068 | 1.067 | 1.065 | 1.065 | 1.065 | 1.065 | 1.068 | 1.073 | 1.076 | 1.074 | 1.074 | 1.075 | 1.069 |
| L27 | 1.046 | 1.046 | 1.048 | 1.050 | 1.056 | 1.069 | 1.084 | 1.092 | 1.094 | 1.097 | 1.104 | 1.114 | 1.122 | 1.126 | 1.082 |
| L28 | 0.848 | 0.861 | 0.876 | 0.894 | 0.917 | 0.939 | 0.958 | 0.966 | 0.969 | 0.976 | 0.990 | 1.004 | 1.011 | 1.017 | 0.943 |
| L29 | 0.827 | 0.834 | 0.842 | 0.851 | 0.865 | 0.882 | 0.902 | 0.914 | 0.920 | 0.927 | 0.941 | 0.953 | 0.959 | 0.965 | 0.897 |
| L30 | 0.910 | 0.922 | 0.923 | 0.930 | 0.945 | 0.971 | 0.997 | 1.007 | 1.009 | 1.016 | 1.024 | 1.032 | 1.042 | 1.045 | 0.983 |
| L31 | 0.805 | 0.823 | 0.832 | 0.845 | 0.865 | 0.895 | 0.926 | 0.937 | 0.937 | 0.940 | 0.946 | 0.954 | 0.963 | 0.967 | 0.901 |
| L32 | 1.008 | 1.015 | 1.021 | 1.027 | 1.033 | 1.039 | 1.051 | 1.061 | 1.068 | 1.081 | 1.087 | 1.087 | 1.089 | 1.090 | 1.054 |
| L33 | 0.903 | 0.913 | 0.913 | 0.910 | 0.916 | 0.931 | 0.947 | 0.954 | 0.954 | 0.954 | 0.959 | 0.974 | 0.988 | 0.994 | 0.943 |
| L34 | 0.788 | 0.793 | 0.795 | 0.800 | 0.814 | 0.831 | 0.851 | 0.865 | 0.867 | 0.867 | 0.919 | 0.977 | 0.987 | 0.996 | 0.865 |
| L35 | 1.046 | 1.052 | 1.059 | 1.059 | 1.063 | 1.070 | 1.071 | 1.068 | 1.069 | 1.075 | 1.083 | 1.085 | 1.088 | 1.093 | 1.070 |
| Avg.H | 0.936 | 0.944 | 0.951 | 0.955 | 0.961 | 0.971 | 0.981 | 0.993 | 1.004 | 1.015 | 1.024 | 1.032 | 1.043 | 1.053 | 1.009 a |
| Avg.L | 0.942 | 0.950 | 0.955 | 0.961 | 0.972 | 0.987 | 1.001 | 1.009 | 1.012 | 1.017 | 1.028 | 1.039 | 1.046 | 1.059 | 1.016 a |
| Avg.O | 0.938 | 0.946 | 0.952 | 0.957 | 0.965 | 0.977 | 0.989 | 0.999 | 1.007 | 1.015 | 1.025 | 1.035 | 1.044 | 1.057 | 1.015 a |
| Total | GMEPI | PMEPI | MECI | MTCI | GECI | GTCI | ECUI | TCUI | |
|---|---|---|---|---|---|---|---|---|---|
| Sub-industries | 35 | 20 | 15 | 7 | 28 | 11 | 15 | 0 | 9 |
| Heavy industry | 22 | 13 | 9 | 7 | 15 | 11 | 6 | 0 | 5 |
| productivity loss | 13 | 12(−) | 1(−) | 7(−) | 6(−) | 8(−) | 4(−) | 0 | 1(−) |
| productivity gain | 9 | 1(+) | 8(+) | 0 | 9(+) | 3(−) | 2(+) | 0 | 4(+) |
| Light industry | 13 | 7 | 6 | 0 | 13 | 0 | 9 | 0 | 4 |
| productivity loss | 6 | 0 | 6(−) | 0 | 6(−) | 0 | 3(−) | 0 | 3(−) |
| productivity gain | 7 | 7(+) | 0 | 0 | 7(+) | 0 | 6(+) | 0 | 1(+) |
© 2017 by the authors. Licensee MDPI, Basel, Switzerland. This article is an open access article distributed under the terms and conditions of the Creative Commons Attribution (CC BY) license (http://creativecommons.org/licenses/by/4.0/).
Share and Cite
Cao, L.; Qi, Z.; Ren, J. China’s Industrial Total-Factor Energy Productivity Growth at Sub-Industry Level: A Two-Step Stochastic Metafrontier Malmquist Index Approach. Sustainability 2017, 9, 1384. https://doi.org/10.3390/su9081384
Cao L, Qi Z, Ren J. China’s Industrial Total-Factor Energy Productivity Growth at Sub-Industry Level: A Two-Step Stochastic Metafrontier Malmquist Index Approach. Sustainability. 2017; 9(8):1384. https://doi.org/10.3390/su9081384
Chicago/Turabian StyleCao, Lizhan, Zhongying Qi, and Junxia Ren. 2017. "China’s Industrial Total-Factor Energy Productivity Growth at Sub-Industry Level: A Two-Step Stochastic Metafrontier Malmquist Index Approach" Sustainability 9, no. 8: 1384. https://doi.org/10.3390/su9081384
APA StyleCao, L., Qi, Z., & Ren, J. (2017). China’s Industrial Total-Factor Energy Productivity Growth at Sub-Industry Level: A Two-Step Stochastic Metafrontier Malmquist Index Approach. Sustainability, 9(8), 1384. https://doi.org/10.3390/su9081384