Evaluating Retrieval Effectiveness by Sustainable Rank List


Abstract
:1. Introduction
- Scoring: Modern search engines manipulate hundreds of signals. A variety of algorithms used these signals as input in different combinations for calculating scores for the ranking.
- Boosting: These search engines consider multiple factors in the calculation of the final score. They give some factors more weight than others, and if a page holds such factors than it will be promoted to the rank. For example, fast mobile sites are boosted while user searching from the Google app.
- Dampening: These factors can affect the higher rank of a web page. It is taken as a penalty; this factor stops a page from getting a top rank if it does not satisfy the condition.
2. Related Work
- Explicit Feedback (EF): This kind of feedback is usually started by assessors against a group of documents retrieved for a query (Relevance Judgment). It can be graded using numbers, characters, or binary (relevant or irrelevant) relevance systems. This kind of information is used in the query and documents. Usually, nDCG is used for this kind of feedback.
- Implicit Feedback (IF): This is based on user behaviors (view, copy, paste, etc.); in this kind of feedback, the user directly assesses the relevance of web pages or documents. However, the user is not aware of this process. For example, dwell time shows the time spent by users on the web page.
- Blind Feedback (BF)/Pseudo Relevance Feedback (PRF): This is an automatic way of judging the relevance between query and documents. Using this method, we can find top-K relevant document among a set of results. This scheme consists of following steps:
- (1).
- Take the results returned by initial queries (top-K);
- (2).
- Select the top 20 or 30 terms from these documents using some scheme;
- (3).
- Execute query rewriting and then match with returned documents to find the top relevant results.
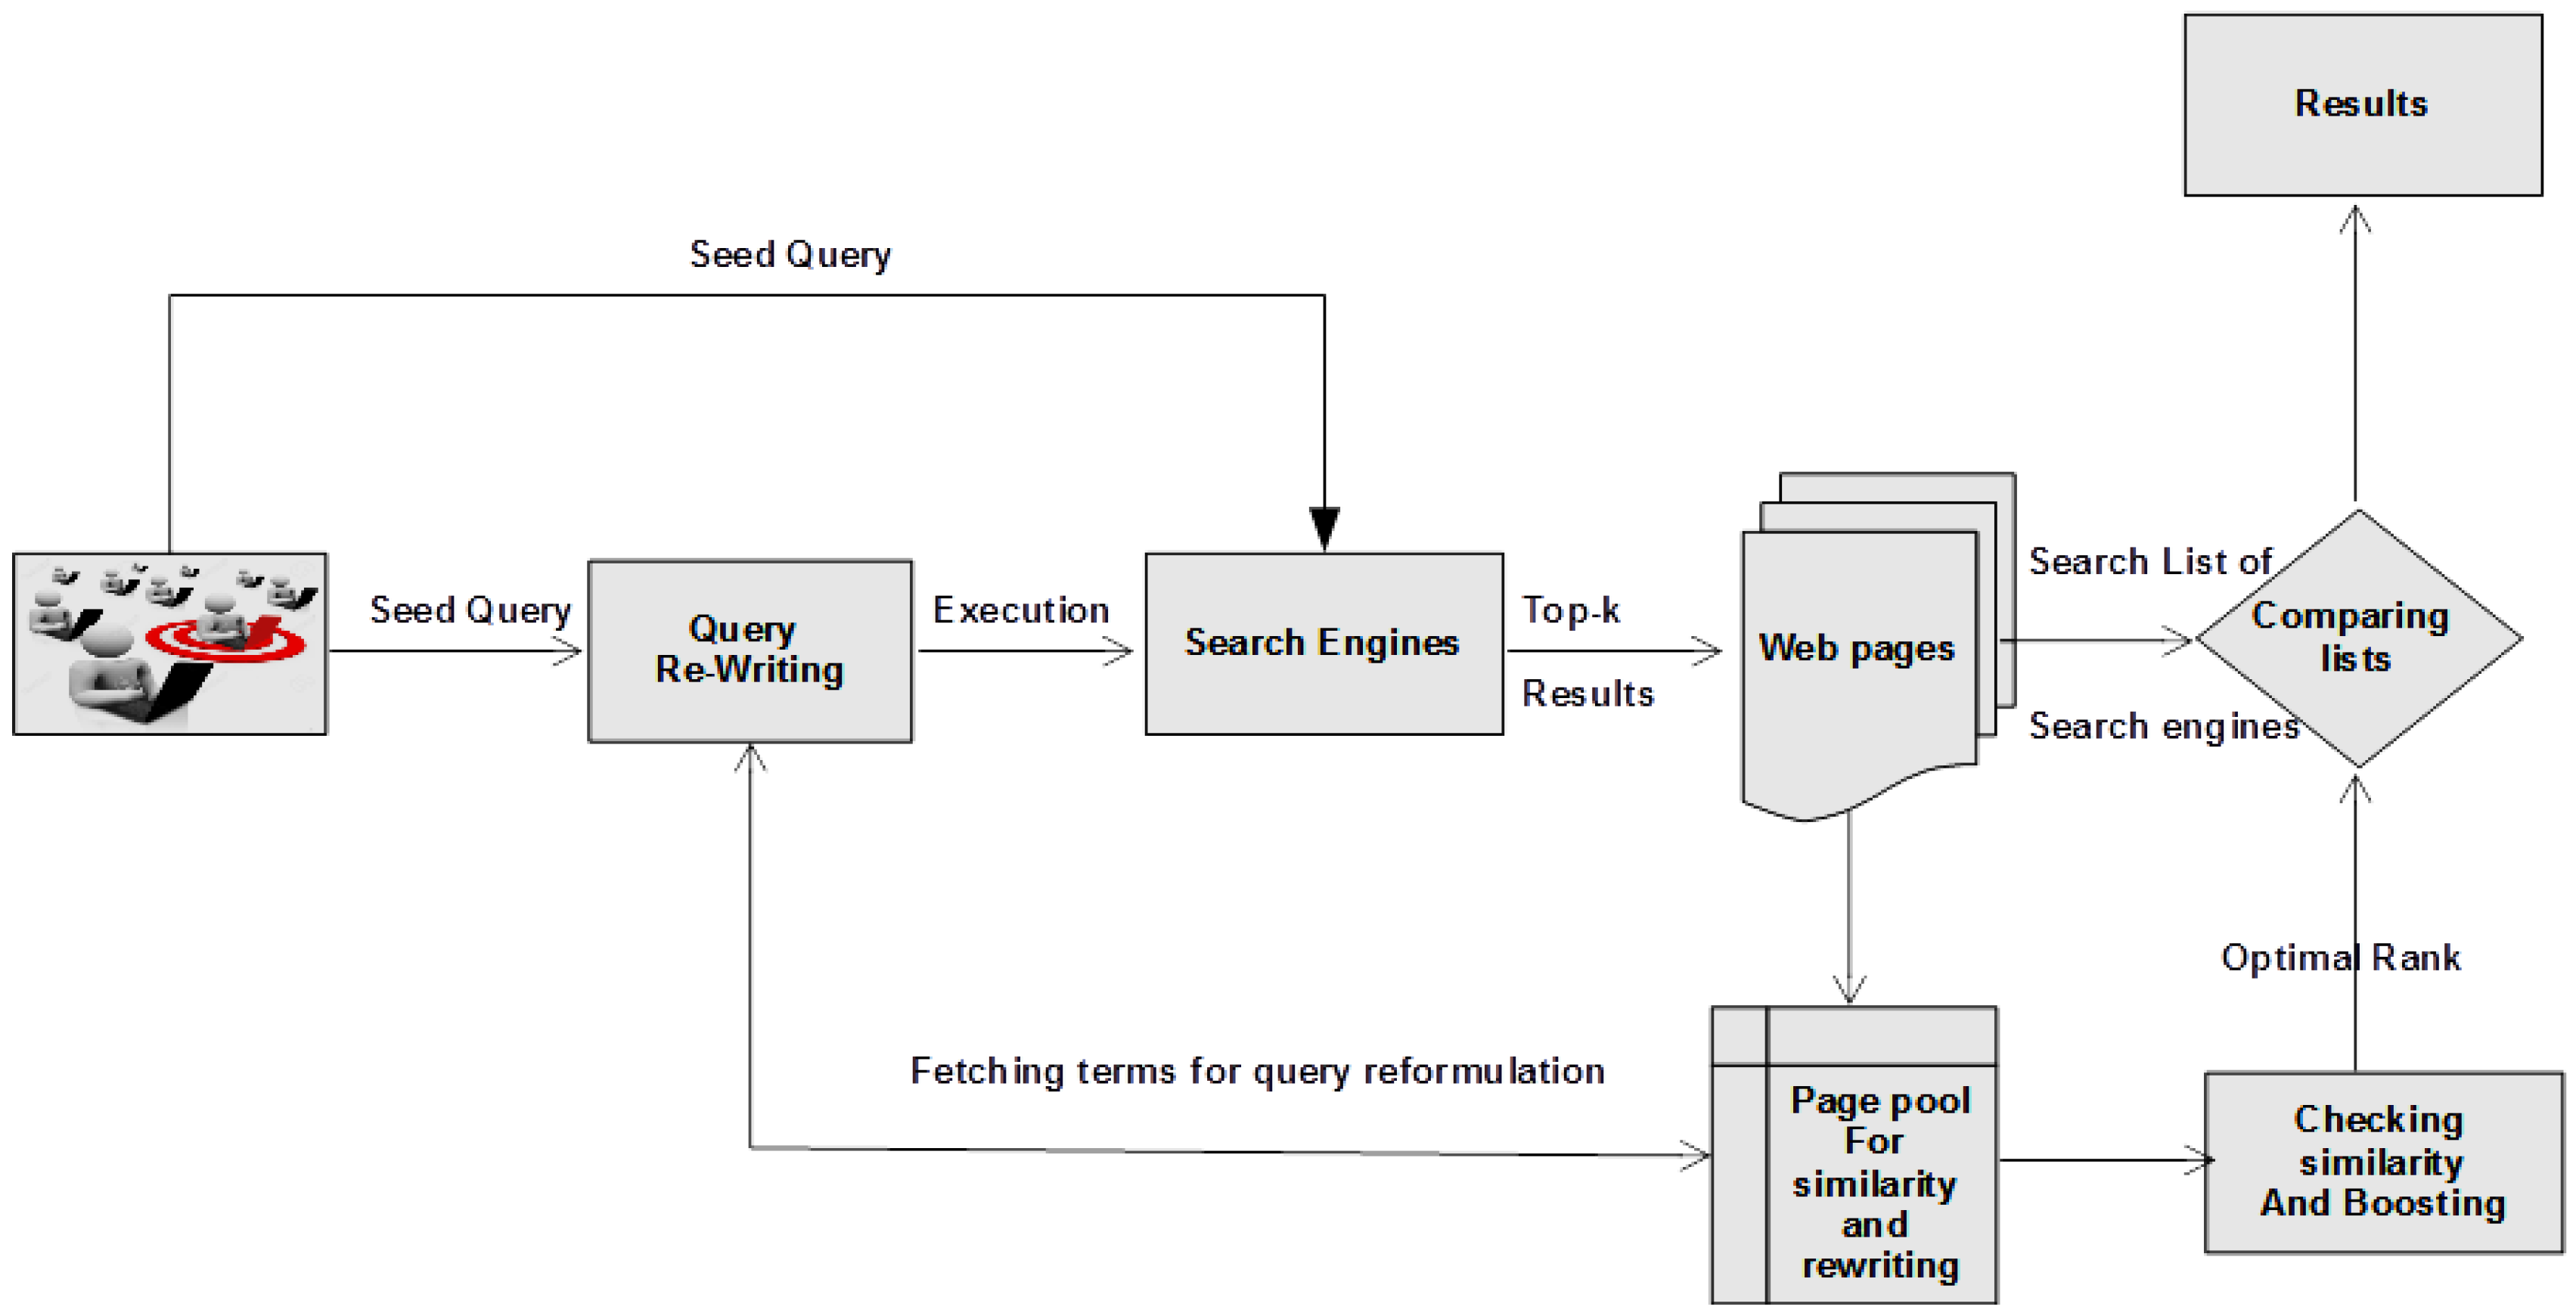
3. Sustainable Optimal Rank Preparation for Relative Assessment of IoT-Related Searches
3.1. Formulation of Information Need
3.2. Query Rewriting
3.3. Execution of Queries
3.4. Selecting Top-K Queries
| Algorithm 1: Random Walk on a Bipartite Graph |
| Input: q0 = seed query, run size n = |E|. |
| Output: Sample queries and their degrees; Sample Pages with Degree. |
| 1: Matrix R and list Us are empty; //Matrix R and list Us will store degrees of URLs because of Random Walk. 2: i = 1; 3: while i ≤ n do 4: ui = random (URL); //Assign one random URL which is fetched by the query. 5: if Us(cell)! = Null then 6: Us(cell) = dui; //Store degree of URL both in Us and R matrix against qiui. 7: else 8: ui = random (URL) 9: Us(cell) = dui; 10: Qi + 1 = random (qi); //Assign one random Query which is fetching URL. 11: end if 12: end while = 0 |
3.5. Text Similarity Score
3.6. Boosting-Based Page Re-Rank
3.6.1. Newness-Based Re-Rank
3.6.2. Geo-Sensitive-Based Re-Rank
4. Dataset and Evaluation Mechanism
5. Results and Discussion
6. Conclusions and Future Work
Acknowledgments
Author Contributions
Conflicts of Interest
References
- The Four Vs of Big Data. Available online: http://www.ibmbigdatahub.com/infographic/four-vs-big-data (accessed on 10 March 2017).
- KDnuggets: Analytics, Big Data, Data Mining and Data Science Feed. Available online: http://www.kdnuggets.com/2016/09/big-data-iot-match-made-heaven.html (accessed on 10 March 2017).
- Number of Internet Users (2016)—Internet Live Stats. Available online: http://www.internetlivestats.com/internet-users/ (accessed on 10 March 2017).
- Voorhees, E.M.; Harman, D. Overview of TREC 2001. Available online: http://trec.nist.gov/pubs/trec10/papers/overview_10.pdf (accessed on 6 July 2017).
- Justin, Z. How reliable are the results of large-scale information retrieval experiments? In Proceedings of the 21st Annual International ACM SIGIR Conference on Research and Development in Information Retrieval, Melbourne, Australia, 24–28 August 1998; ACM: New York, NY, USA, 1998. [Google Scholar]
- Harter, S.P. Variations in relevance assessments and the measurement of retrieval effectiveness. JASIS 1996, 47, 37–49. [Google Scholar] [CrossRef]
- Voorhees, E.M. Variations in relevance judgments and the measurement of retrieval effectiveness. Inf. Process. Manag. 2000, 36, 697–716. [Google Scholar] [CrossRef]
- Dwork, C.; Kumar, R.; Naor, M.; Sivakumar, D. Rank aggregation methods for the web. In Proceedings of the 10th International Conference on World Wide Web, Hong Kong, China, 1–5 May 2001; ACM: New York, NY, USA, 2001. [Google Scholar]
- Meng, W.; Yu, C.; Liu, K.L. Building efficient and effective metasearch engines. ACM Comput. Surv. 2002, 34, 48–89. [Google Scholar] [CrossRef]
- Fazli, C.; Nuray, R.; Sevdik, A.B. Automatic performance evaluation of Web search engines. Inf. Process. Manag. 2004, 40, 495–514. [Google Scholar]
- Nuray, R.; Fazli, C. Automatic ranking of information retrieval systems using data fusion. Inf. Process. Manag. 2006, 42, 595–614. [Google Scholar] [CrossRef]
- IoT Analytics. The 10 Most Popular Internet of Things Applications Right Now. Available online: https://iot-analytics.com/10-internet-of-things-applications/ (accessed on 3 October 2017).
- Tefko, S. Relevance: A review of the literature and a framework for thinking on the notion in information science. Part III: Behavior and effects of relevance. J. Am. Soc. Inf. Sci. Technol. 2007, 58, 2126–2144. [Google Scholar]
- Du, J.T.; Spink, A. Toward a web search model: Integrating multitasking, cognitive coordination, and cognitive shifts. J. Am. Soc. Inf. Sci. Technol. 2011, 62, 1446–1472. [Google Scholar] [CrossRef]
- Lv, Y.; Zhai, C.X. Adaptive relevance feedback in information retrieval. In Proceedings of the 18th ACM Conference on Information and Knowledge Management, Hong Kong, China, 2–6 November 2009; ACM: New York, NY, USA, 2009. [Google Scholar]
- Buckley, C.; Salton, G.; Allan, J.; Singhal, A. Automatic Query Expansion Using SMART: TREC 3. Available online: https://pdfs.semanticscholar.org/7859/071375af210096a2003f355df17817297173.pdf (accessed on 6 July 2017).
- Soboroff, I.; Nicholas, C.; Cahan, P. Ranking retrieval systems without relevance judgments. In Proceedings of the 24th Annual International ACM SIGIR Conference on Research and Development in Information Retrieval, New Orleans, LA, USA, 9–13 September 2001; ACM: New York, NY, USA, 2001. [Google Scholar]
- Chowdhury, A.; Soboroff, I. Automatic evaluation of worldwide web search services. In Proceedings of the 25th Annual International ACM SIGIR Conference on Research and Development in Information Retrieval, Tampere, Finland, 11–15 August 2002; ACM: New York, NY, USA, 2002. [Google Scholar]
- Mahmoudi, M.; Badie, R.; Zahedi, M.S. Evaluating the retrieval effectiveness of search engines using Persian navigational queries. In Proceedings of the 2014 7th International Symposium on Telecommunications (IST), Tehran, Iran, 9–11 September 2014; IEEE: Piscataway, NJ, USA, 2014. [Google Scholar]
- Wu, S.; Crestani, F. Methods for ranking information retrieval systems without relevance judgments. In Proceedings of the 2003 ACM Symposium on Applied Computing, Melbourne, FL, USA, 9–12 March 2003; ACM: New York, NY, USA, 2003. [Google Scholar]
- Joachims, T. Evaluating Retrieval Performance Using Clickthrough Data. Available online: http://www.cs.cornell.edu/People/tj/publications/joachims_02b.pdf (accessed on 7 July 2017).
- Thorsten, J.; Granka, L.; Pan, B.; Hembrooke, H.; Gay, G. Accurately Interpreting Clickthrough Data as Implicit. In Proceedings of the 28th Annual International ACM SIGIR Conference, Salvador, Brazil, 15–19 August 2005; ACM: New York, NY, USA, 2005. [Google Scholar]
- Sharma, H.; Jansen, B.J. Automated evaluation of search engine performance via implicit user feedback. In Proceedings of the 28th Annual International ACM SIGIR Conference on Research and Development in Information Retrieval, Salvador, Brazil, 15–19 August 2005; ACM: New York, NY, USA, 2005. [Google Scholar]
- Liu, Y.; Zhang, M.; Ru, L.; Ma, S. Automatic query type identification based on click-through information. In Proceedings of the Third Asia Information Retrieval Symposium, AIRS 2006, Singapore, 16–18 October 2006; Springer: Berlin, Heidelberg, Germany, 2006. [Google Scholar]
- Liu, Y.; Fu, Y.; Zhang, M.; Ma, S.; Ru, L. Automatic search engine performance evaluation with click-through data analysis. In Proceedings of the 16th International Conference on World Wide Web, Banff, AL, Canada, 8–12 May 2007; ACM: New York, NY, USA, 2007. [Google Scholar]
- Ali, R.; Beg, M.M.S. Automatic performance evaluation of web search systems using rough set based rank aggregation. In Proceedings of the First International Conference on Intelligent Human Computer Interaction, Allahabad, India, 20–23 January 2009; Springer: Allahabad, India, 2009. [Google Scholar]
- Badie, R.; Azimzadeh, M.; Zahedi, M.S. Automatic evaluation of search engines: Using web pages’ content, web graph link structure and websites’ popularity. In Proceedings of the 2014 7th International Symposium on Telecommunications (IST), Tehran, Iran, 9–11 September 2014; IEEE: Piscataway, NJ, USA, 2014. [Google Scholar]
- Mehmood, A.; Choi, G.S.; von Feigenblatt, O.F.; Park, H.W. Proving ground for social network analysis in the emerging research area “Internet of Things” (IoT). Scientometrics 2016, 109, 185–201. [Google Scholar] [CrossRef]
- Mehmood, A.; On, B.-W.; Lee, I.; Choi, G.S. Prognosis Essay Scoring and Article Relevancy Using Multi-Text Features and Machine Learning. Symmetry 2017, 9, 11. [Google Scholar] [CrossRef]
- Karami, A.B.; Fleury, A.; Boonaert, J.; Lecoeuche, S. User in the Loop: Adaptive Smart Homes Exploiting User Feedback—State of the Art and Future Directions. Information 2016, 7, 35. [Google Scholar] [CrossRef]
- Leth, S.; Hansen, J.; Nielsen, O.W.; Dinesen, B. Evaluation of Commercial Self-Monitoring Devices for Clinical Purposes: Results from the Future Patient Trial, Phase I. Sensors 2017, 17, 211. [Google Scholar] [CrossRef] [PubMed]
- Singh, J.N.; Dwivedi, S.K. Performance Evaluation of SE Using Enhanced Vector Space Model. J. Comput. Sci. 2015, 11, 692–698. [Google Scholar] [CrossRef]
- Lewandowski, D. Evaluating the retrieval effectiveness of Web SE using a representative query sample. J. Assoc. Inf. Sci. Technol. 2015, 66, 1763–1775. [Google Scholar] [CrossRef]
- Szummer, M.; Jaakkola, T. Partially labeled classification with Markov random walks. NIPS 2001, 14, 945–952. [Google Scholar]


| Term | Description | Term | Description |
|---|---|---|---|
| PRF | Pseudo-relevance feedback | qi | One of the rewritten query |
| DCV | Document cut off values | dui | Degree of URL i |
| ui | URL retrieved in a search result | Twp | Text of web page |
| PRs | Pseudo-relevance score | SSt | Similarity score with text |
| PRst | Pseudo-relevance score for time sensitive pages | SSu | Similarity score with URL |
| PRsg | Pseudo-relevance score for GEO-sensitive pages | Ct | Time sensitive query class |
| ⍺ | Page score boosting factor | Cnt | Non-time sensitive query class |
| Β | Page score dampening factor | Snew | Score for newness of web page |
| Cg | Geo-sensitive query class | SSE | Selected search engine |
| Cng | Non-Geo-sensitive query class | Confidence score of query | |
| Fu | Frequency factor for each URL | Vt | Vocabulary related to time words |
| Vg | Vocabulary related to geographic words |
| No. # | Topic | # of Searches |
|---|---|---|
| 1 | Smart home | 61 k |
| 2 | Smart City | 41 k |
| 3 | Smart grid | 41 k |
| 4 | Wearable | 33 k |
| 5 | Industrial Internet | 10 k |
| 6 | Connected Car | 5 k |
| 7 | Connected Health | 2 k |
| 8 | Smart retail | 1 k |
| 9 | Smart farming | 1 k |
| 10 | Smart Supply Chain | 0 k |
| URL | q1 | q2 | q3 | q4 | q5 |
|---|---|---|---|---|---|
| u1 | 1/5 | 1/5 | 1/5 | 1/5 | 1/5 |
| u2 | 1/5 | 1/5 | 1/5 | 1/5 | 1/5 |
| u3 | 0 | ¼ | 1/4 | 1/4 | 1/4 |
| u4 | 1/3 | 0 | 1/3 | 1/3 | 0 |
| Q # | du1 | du2 | du3 | du4 | ||
|---|---|---|---|---|---|---|
| q3 | 5 | 5 | 4 | 3 | 17 | 1.00 |
| q4 | 5 | 5 | 4 | 3 | 17 | 1.00 |
| q2 | 5 | 5 | 4 | 14 | 0.82 | |
| q5 | 5 | 5 | 4 | 14 | 0.82 | |
| q1 | 5 | 5 | 3 | 13 | 0.76 |
| New | Old | Not Given | |
|---|---|---|---|
| Useful | Useful (no change) | Somewhat useful (damped using β) | Somewhat useful (damped using β) |
| Somewhat useful | Useful (boosted using α) | Not useful (damped using β) | Not useful (damped using β) |
| Not useful | Not useful (no change) | Not useful (no change) | Not useful (no change) |
| Similar | Different | Not Given | |
|---|---|---|---|
| Useful | Useful (no change) | Not useful (damped using β) | Not useful (damped using β) |
| Somewhat useful | Useful (boosted using α) | Not useful (damped using β) | Not useful (damped using β) |
| Not useful | Not useful (no change) | Not useful (no change) | Not useful (no change) |
| SSE | DCG5 | DCG10 | DCG20 |
| Bing | 2.19 | 3.46 | 4.73 |
| Yandex | 3.13 | 6.27 | 7.30 |
| OR | 4.43 | 7.16 | 8.98 |
| SSE | iDCG5 | iDCG10 | iDCG20 |
| Bing | 3.63 | 6.19 | 8.08 |
| Yandex | 3.63 | 7.89 | 9.25 |
| SSE | nDCG5 | nDCG10 | nDCG20 |
| Bing | 0.60 | 0.56 | 0.50 |
| Yandex | 0.86 | 0.79 | 0.79 |
| SSE | DCG5 | DCG10 | DCG20 |
| Bing | 2.00 | 3.14 | 3.53 |
| Yandex | 3.13 | 6.27 | 7.30 |
| OR | 4.10 | 7.00 | 8.32 |
| OR + New | 4.47 | 7.01 | 9.00 |
| SSE | iDCG5 | iDCG10 | iDCG20 |
| Bing | 3.43 | 6.00 | 7.58 |
| Yandex | 3.50 | 7.46 | 9.00 |
| OR | 4.41 | 7.32 | 9.80 |
| OR + New | 4.41 | 7.32 | 9.80 |
| SSE | nDCG5 | nDCG10 | nDCG20 |
| Bing | 0.58 | 0.52 | 0.46 |
| Yandex | 0.89 | 0.84 | 0.81 |
| OR | 0.92 | 0.95 | 0.84 |
| OR + New | 0.93 | 0.95 | 0.91 |
| SSE | DCG5 | DCG10 | DCG20 |
| Bing | 2.10 | 3.12 | 3.48 |
| Yandex | 3.06 | 6.16 | 7.20 |
| OR | 4.00 | 7.01 | 8.20 |
| OR + GEO | 4.15 | 7.04 | 9.01 |
| SSE | iDCG5 | iDCG10 | iDCG20 |
| Bing | 3.41 | 5.90 | 7.42 |
| Yandex | 3.41 | 7.40 | 8.90 |
| OR | 4.29 | 7.18 | 9.60 |
| OR + GEO | 4.29 | 7.18 | 9.60 |
| SSE | nDCG5 | nDCG10 | nDCG20 |
| Bing | 0.61 | 0.52 | 0.46 |
| Yandex | 0.89 | 0.83 | 0.80 |
| OR | 0.93 | 0.97 | 0.85 |
| OR + GEO | 0.96 | 0.98 | 0.93 |
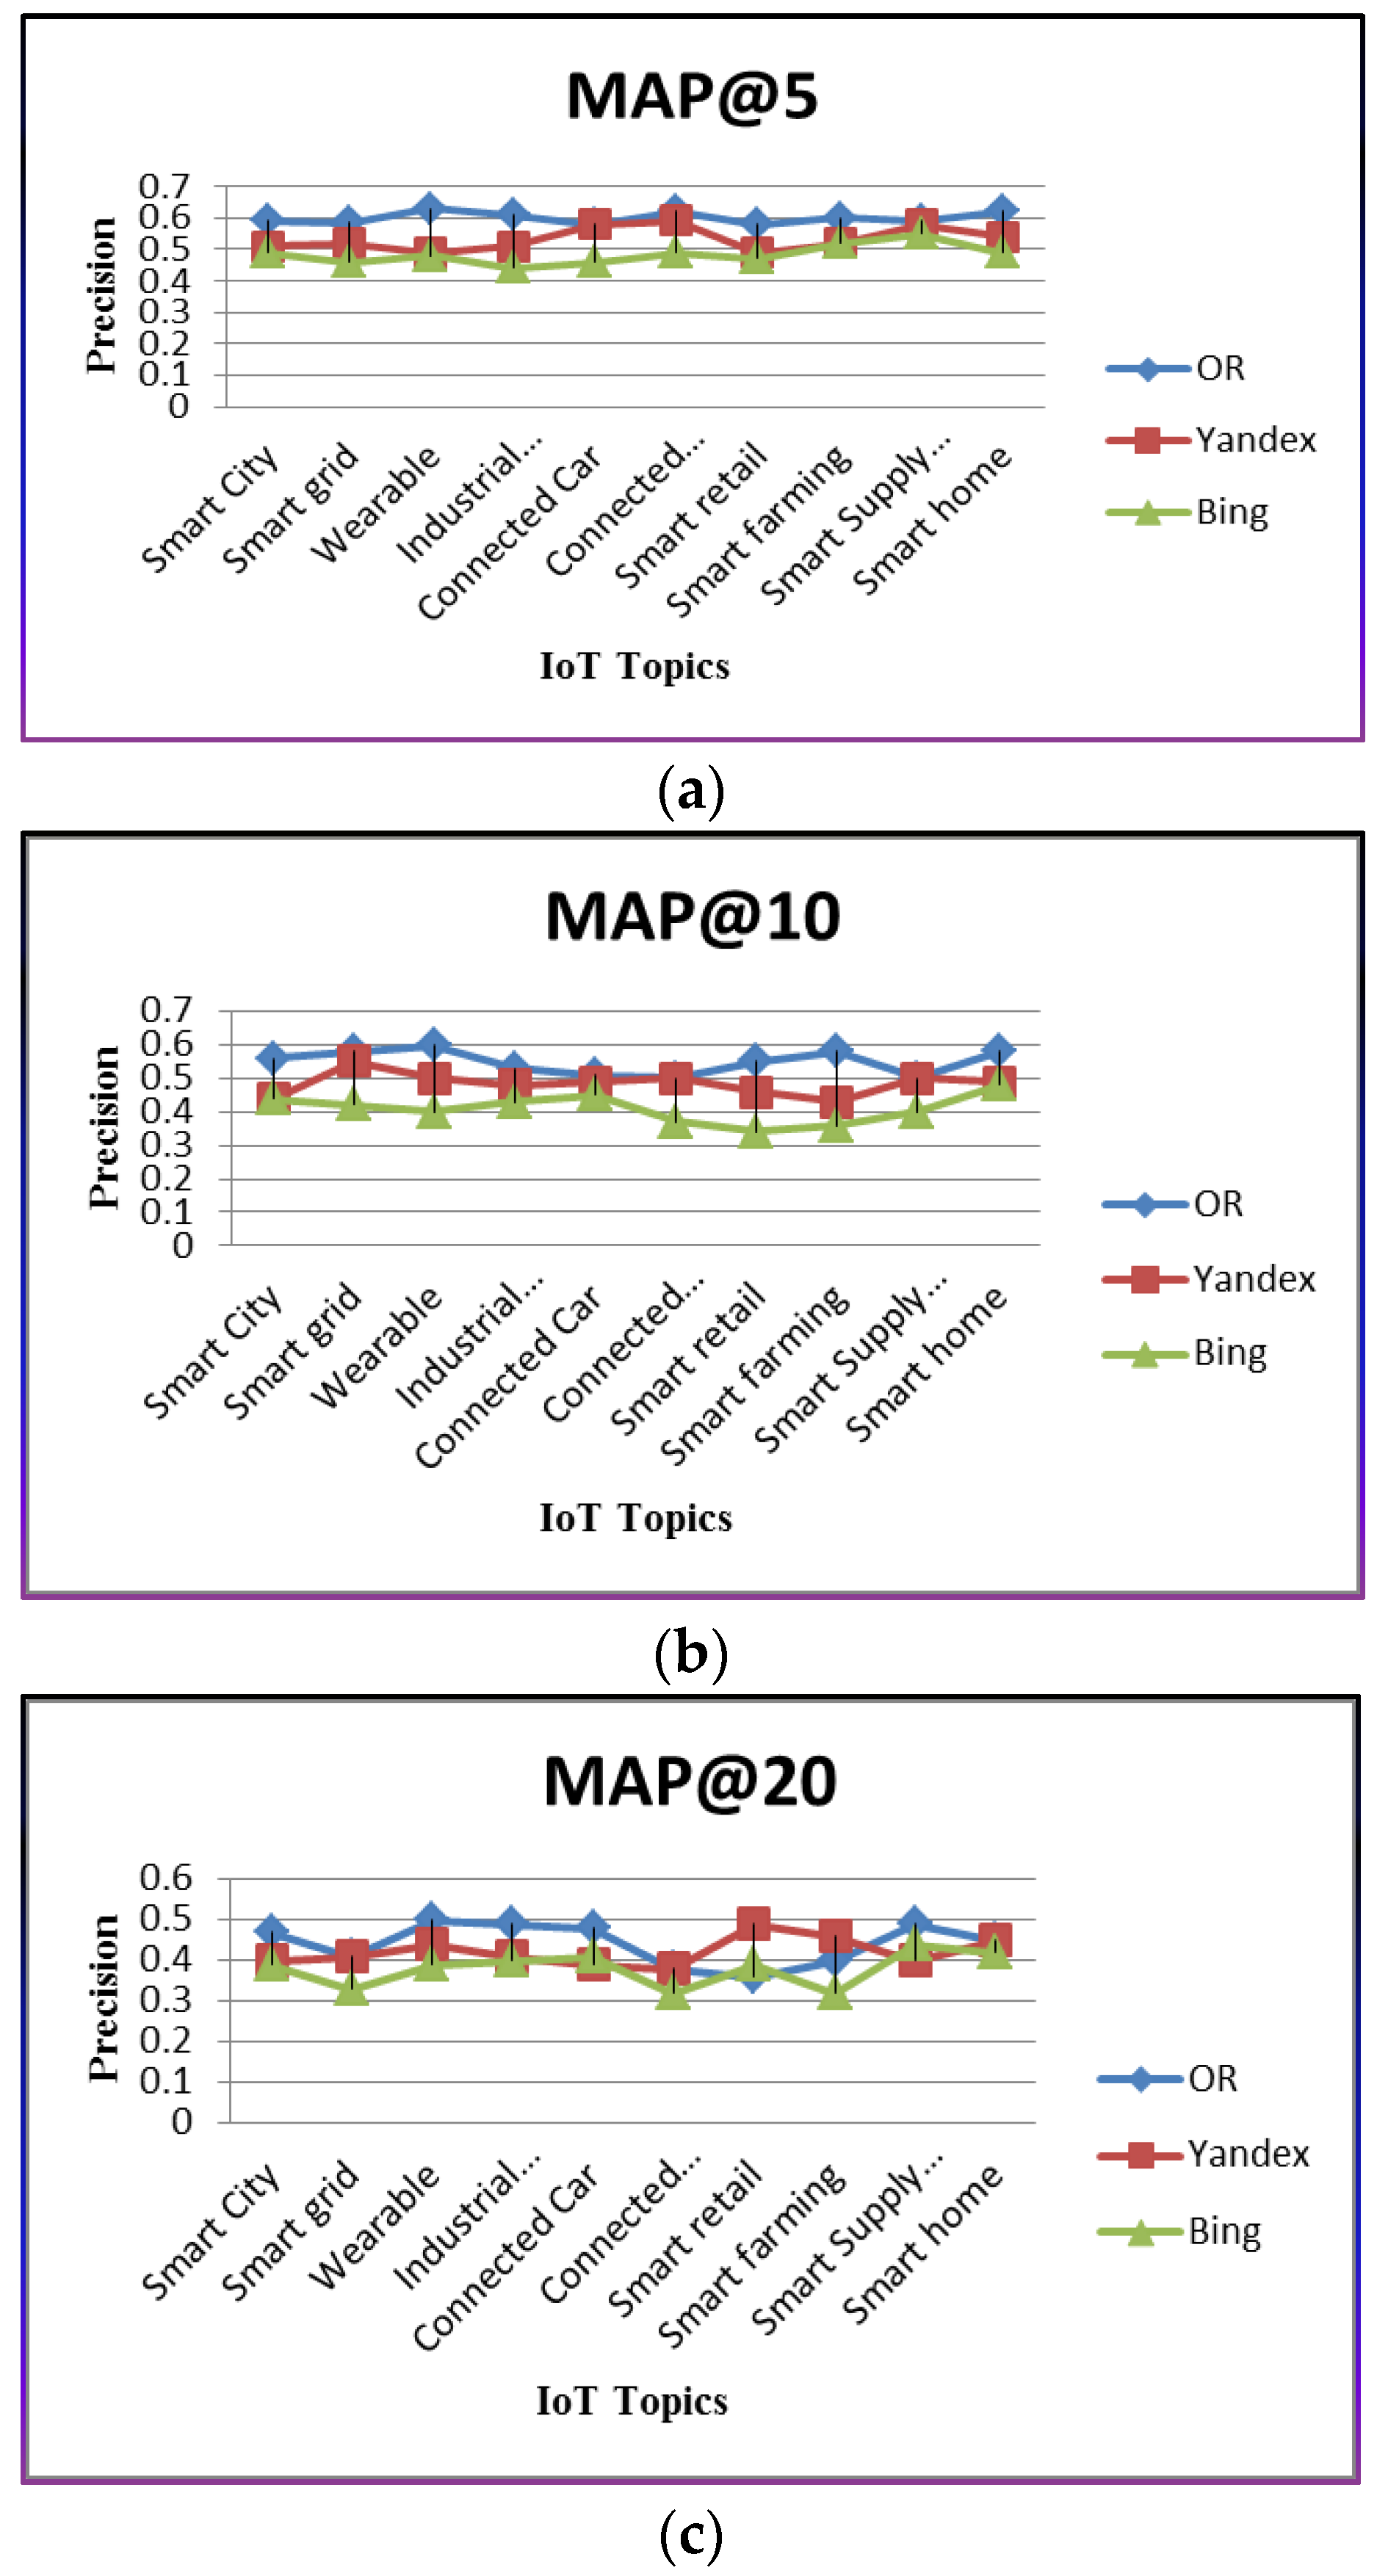
| MAP@5 | MAP@10 | MAP@20 | |
|---|---|---|---|
| OR | 0.60 | 0.54 | 0.44 |
| Yandex | 0.53 | 0.48 | 0.42 |
| Bing | 0.48 | 0.40 | 0.37 |
© 2017 by the authors. Licensee MDPI, Basel, Switzerland. This article is an open access article distributed under the terms and conditions of the Creative Commons Attribution (CC BY) license (http://creativecommons.org/licenses/by/4.0/).
Share and Cite
Ali, T.; Jhandir, Z.; Lee, I.; On, B.-W.; Choi, G.S. Evaluating Retrieval Effectiveness by Sustainable Rank List. Sustainability 2017, 9, 1203. https://doi.org/10.3390/su9071203
Ali T, Jhandir Z, Lee I, On B-W, Choi GS. Evaluating Retrieval Effectiveness by Sustainable Rank List. Sustainability. 2017; 9(7):1203. https://doi.org/10.3390/su9071203
Chicago/Turabian StyleAli, Tenvir, Zeeshan Jhandir, Ingyu Lee, Byung-Won On, and Gyu Sang Choi. 2017. "Evaluating Retrieval Effectiveness by Sustainable Rank List" Sustainability 9, no. 7: 1203. https://doi.org/10.3390/su9071203
APA StyleAli, T., Jhandir, Z., Lee, I., On, B.-W., & Choi, G. S. (2017). Evaluating Retrieval Effectiveness by Sustainable Rank List. Sustainability, 9(7), 1203. https://doi.org/10.3390/su9071203