1. Introduction
For the past several years, information and communications technology (ICT) and wireless sensor networks (WSNs) have attracted research interest due to their promising applications in many areas. Because of their development, physical items called “things” can now be connected to the Internet. As a result, those “things” are able to communicate and exchange information with each other [
1]. Information obtained by sensing devices are necessary in many realistic application scenarios, for example, tracking a moving object, where we need sensors to measure the position, the velocity of the object, or some other piece of information. Based on obtained information, analytical decisions can be made, and interactive and autonomous executions can be performed. However, if we need thousands or even millions of “things” to collect data, in this case, the data process will be slow and inefficient if we keep using traditional data storage/analytic platforms. In light of this limitation, cloud computing could be a feasible alternative solution to storing and analyzing big data due to their distributed computing environments and scalabilities. For example, Amazon Web Service (AWS) IoT can help us to collect and send data to a remote Cloud, making it easy to load and analyze information. Frameworks, such as Apache Hadoop, Apache Storm, and Apache Spark have shown advantages for large-scale data processing. Some Cloud vendors include these engines as a bundle of products. Google Cloud Dataproc, for instance, provides managed Hadoop and Spark services for customers to process big datasets.
Big data technologies have been extensively used in storage provision, and their services have been extended to numerous application fields. Nonetheless, relatively little research that deals with unsustainable computing problems has been reported. Yet problems of inefficiency and of wasting precious core processing powers, time, energy, and resources still exist. Those problems become more serious when the number of clusters increases. In 2010, Google used about 2.26 million MWh of electricity to run its datacenters, generating a carbon footprint of 1.46 million metric tons of carbon dioxide [
2]. Generally, companies and organizations setup their own Spark servers in distributed mode on a private cluster, and they need to maintain physical servers as well as saving costs. There is a tradeoff between the efficiency and energy consumption in such a complex environment. Data mining runs effectively on a large-scale cluster, but it may cause power wastage when some nodes are not in use. If the size of clusters is too small, the processing stage will experience delay. If we can dynamically add/remove (turn on/off) worker nodes according to the specific jobs, such an autonomous service can improve sustainability to some extent.
There are mainly two ways to improve the energy efficiency of a cluster. One is to set an appropriate number of nodes based on the current needs and set the remaining nodes in standby mode. Another way is to track and control all the computing and storage nodes to match the workload. Typical energy-saving technologies and mechanisms are shown as follows.
- (1)
Dynamic adjustment mechanism. As it is known that processors account for a large part of the energy consumption of a server, there is a relationship between clock frequency and required voltage. Dynamic Voltage and Frequency Scaling (DVFS) [
3] is a method that can be used to save energy by dynamically regulating the frequency and voltage. The technology can automatically adjust the CPU frequency to the load, and the voltage will change according to the load situation. CPU manufacturers like Intel and AMD have applied this technology to their products with power-saving modes.
- (2)
Control the number of active servers. Servers with low load can be shut down or put into energy-saving mode so as to reduce the waste of resources. A similar idea can also be applied to virtual machine management. Virtualization technology and migration technology enable schedulers to optimize the load by migrating a virtual machine from one server to another. Idle servers will be turned off for the sake of improving the utilization of active servers.
Various platforms have been used in analyzing big data, like Hadoop, Spark, or Flink. Earlier versions of these frameworks paid more attention to adding enormous processing capacity to handle big data. Recently, those frameworks’ effect on datacenter energy efficiency has attracted more attention. Leverich and Kozyrakis [
4] employed a scale-down operation to save energy consumption on Hadoop clusters. By recasting the data layout and task distribution, between 9 and 50% of the energy was conserved. An energy-conserving and scale-down enabled Hadoop Distributed File System was proposed by Kaushik et al. [
5], the results showed that Cold zones and Hot zones can be used for storage data according to data classification. Servers in a Cold zone can be set on inactive power modes so as to save energy cost. Wirtz and Ge [
6] compared the energy consumption of resource allocation and Dynamic Voltage and Frequency Scaling (DVFS) modes on Hadoop. In order to optimize efficiency, the number of available concurrent workers changes according to application characteristics. Further, the authors of [
7] implemented DVFS with different settings in Hadoop clusters. They also analyzed efficiency and power consumption while dynamically scaling the frequency of worker nodes. Many Cloud service vendors integrate data analytics frameworks like Hadoop or Spark with the Cloud resources. On the level of Cloud datacenters, energy saving can also be achieved by optimizing the mapping of virtual machines to physical hosts. Gao et al. [
8] proposed a multi-objective ant colony system algorithm to find the optimal scheme for virtual machine placement. Beloglazov et al. [
9] define an energy-efficient Cloud computing framework and propose energy-efficient resource allocation policies and scheduling algorithms considering QoS expectations and power usage characteristics of the devices. To maximize resource utilization and place idle nodes into power-saving mode, Lee et al. [
10] used energy-conscious task consolidation heuristics, while Jia et al. [
11] focused on auto-tuning simultaneous multithreading configurations for Spark-based big data workloads. Versatile machine learning algorithms are used for off-line training and online prediction so as to adjust the number of threads. Moreover, Maroulis et al. [
12] proposed an energy-efficient scheduler for Spark. They used time-series prediction and applied DVFS to Spark clusters considering both energy consumption and performance requirements. Furthermore, a runtime CPU management infrastructure for energy reduction was developed by Ge et al. [
13]. In their work, they divided the execution phase and schedule power modes based on workloads during each time interval. History-based workload prediction is used to decide CPU frequency allocation.
DVFS technology makes it possible to automatically balance performance with energy consumption on capable hardware. Operating systems also provide some simple CPU frequency adjusting policies, such as the “balanced” power plan for Windows and the “ondemand” governor for Linux. Research based on DVFS for cluster energy conservation has mostly focused on the accurate prediction of system workloads; thus, different jobs can obtain the most appropriate CPU frequency. For instance, Li et al. [
14] implemented comprehensive applications on Spark including machine learning (Logistic Regression, Support Vector Machine, and Matrix Factorization), graph computing (PageRank, SVD++ and TriangleCount), SQL query (Hive and RDD Relation), and streaming (Twitter and PageView). They demonstrate that different jobs need specific CPU, memory, I/O, and network requirements, and the resource consumption differs from time to time. However, we seldom know the specific resource needs throughout its execution period before the job is done. Off-line training prediction models cannot work efficiently if Spark configurations or specific data analytics jobs even slightly change. By contrast, controlling the number of active nodes provides coarse-grained solutions for energy saving. Moreover, public Cloud Computing venders or private Cloud owners are now increasingly building services with big data analytics platforms. Thus, it has become necessary to reduce the power consumption of these Cloud datacenters with big data processing jobs. The combination of Cloud and Spark/Hadoop also makes it easier to reconfigure the scale of Spark clusters because Virtual Machines (VMs) can be created or released flexibly. Furthermore, current virtualization technology makes it possible to migrate VMs online seamlessly from one physical machine to another, which also opens up new possibilities for Spark clusters.
Inspired by the works mentioned above, in this paper, we focus on the issue of power conservation for Spark clusters on Cloud. We propose an algorithm to change the number of Spark nodes according to the load. If there are underutilized workers, they will be removed and their jobs transferred to other nodes. When the cluster cannot meet the requirement of finishing the job within a certain period of time due to CPU utility, the mechanism for migration will begin. By doing this, on the one hand, nodes with low utilization can be turned off to save power; on the other hand, the cluster can also migrate some over utilized nodes to improve the performance.
The remainder of this paper is organized as follows. We give a brief overview of Spark in
Section 2. Next, we present our energy-efficient algorithm for cluster reconfiguration in
Section 3.
Section 4 provides the simulation and experiment results, comparing the proposed method with existing work. Finally,
Section 5 concludes the key contributions of this paper and describes our future work.
2. Background
Spark, a cluster computing framework, has become very popular in the field of big data analysis in recent years. It has similar characteristics to Hadoop, partitioning data and computation across a large number of hosts that execute application computations in parallel [
15]. Moreover, Spark introduces new features and enhancements such as resilient distributed datasets (RDDs), iterative machine learning algorithms, and interactive data analysis tools, which makes it operate more efficiently. As claimed in [
16], Spark outperforms Hadoop by 10× in iterative machine learning workloads. It can be used to interactively scan a 39 GB dataset with only sub-second latency.
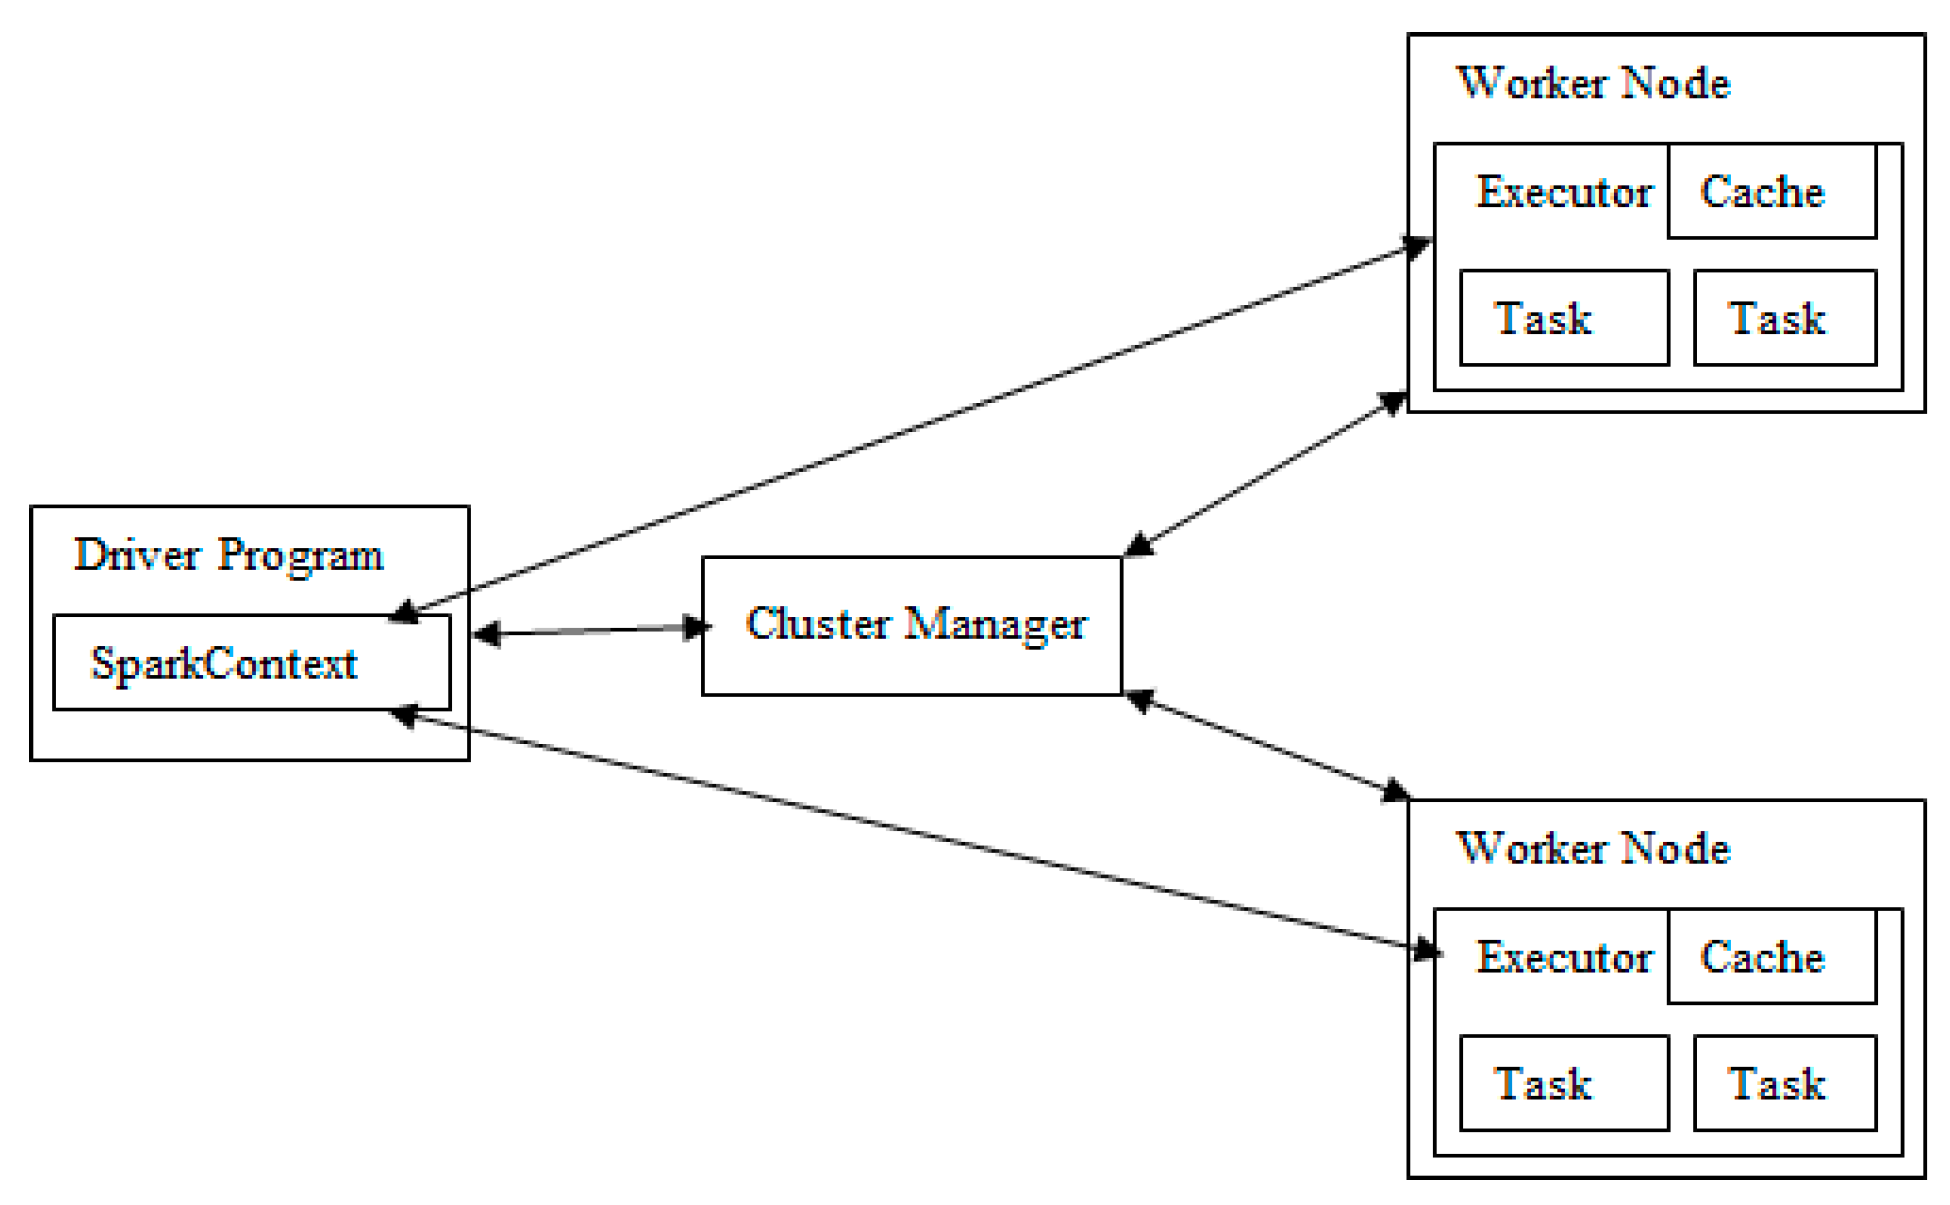
The main components of a Spark cluster are shown in
Figure 1. The SparkContext is created in Driver. A cluster manager such as Spark Standalone cluster manager, Mesos, and YARN, is responsible for resource allocation. The worker node is the running environment for the application code, and it can store data. After the SparkContext is connected to the cluster manager, Spark acquires executors on the nodes in the cluster. Then, the application code (JAR or Python files) is passed from SparkContext to the executors. Finally, SparkContext sends tasks to the executors to run. Generally, a Spark job will be divided into multiple stages. Previous stages include at least one ShuffleMapTask, and the last stage includes at least one ResultTask. The ShuffleMapTask transmits the output to multiple buckets. A ShuffleMapTask corresponds to one ShuffleDependency partition, and the number of partitions equals the degree of parallelism. The ResultTask executes and returns the result to the driver application.
Notice that, when clients submit their applications to the driver, they may not clearly know or care about the cluster scale. In view of the time constraint required by the clients, there are chances that the jobs are completed in less time with more worker nodes or at the expense of a longer run time with fewer worker nodes. Since large computing centers are among the largest consumers of energy, measures should be taken to reduce energy waste. Some data analysis jobs, such as cross-validation, have to be done repeatedly for testing. Thus, an appropriate scale of clusters that are accustomed to the demands of such users is necessary.
In [
18], the authors show that Dynamic Voltage and Frequency Scaling (DVFS) on a CPU results in a near-linear power-to-frequency relationship.
The energy consumption
can be calculated as follows:
where
is the number of physical hosts,
represents CPU utilization, and
stand for the average power consumptions of fully utilized and idle computers, respectively.
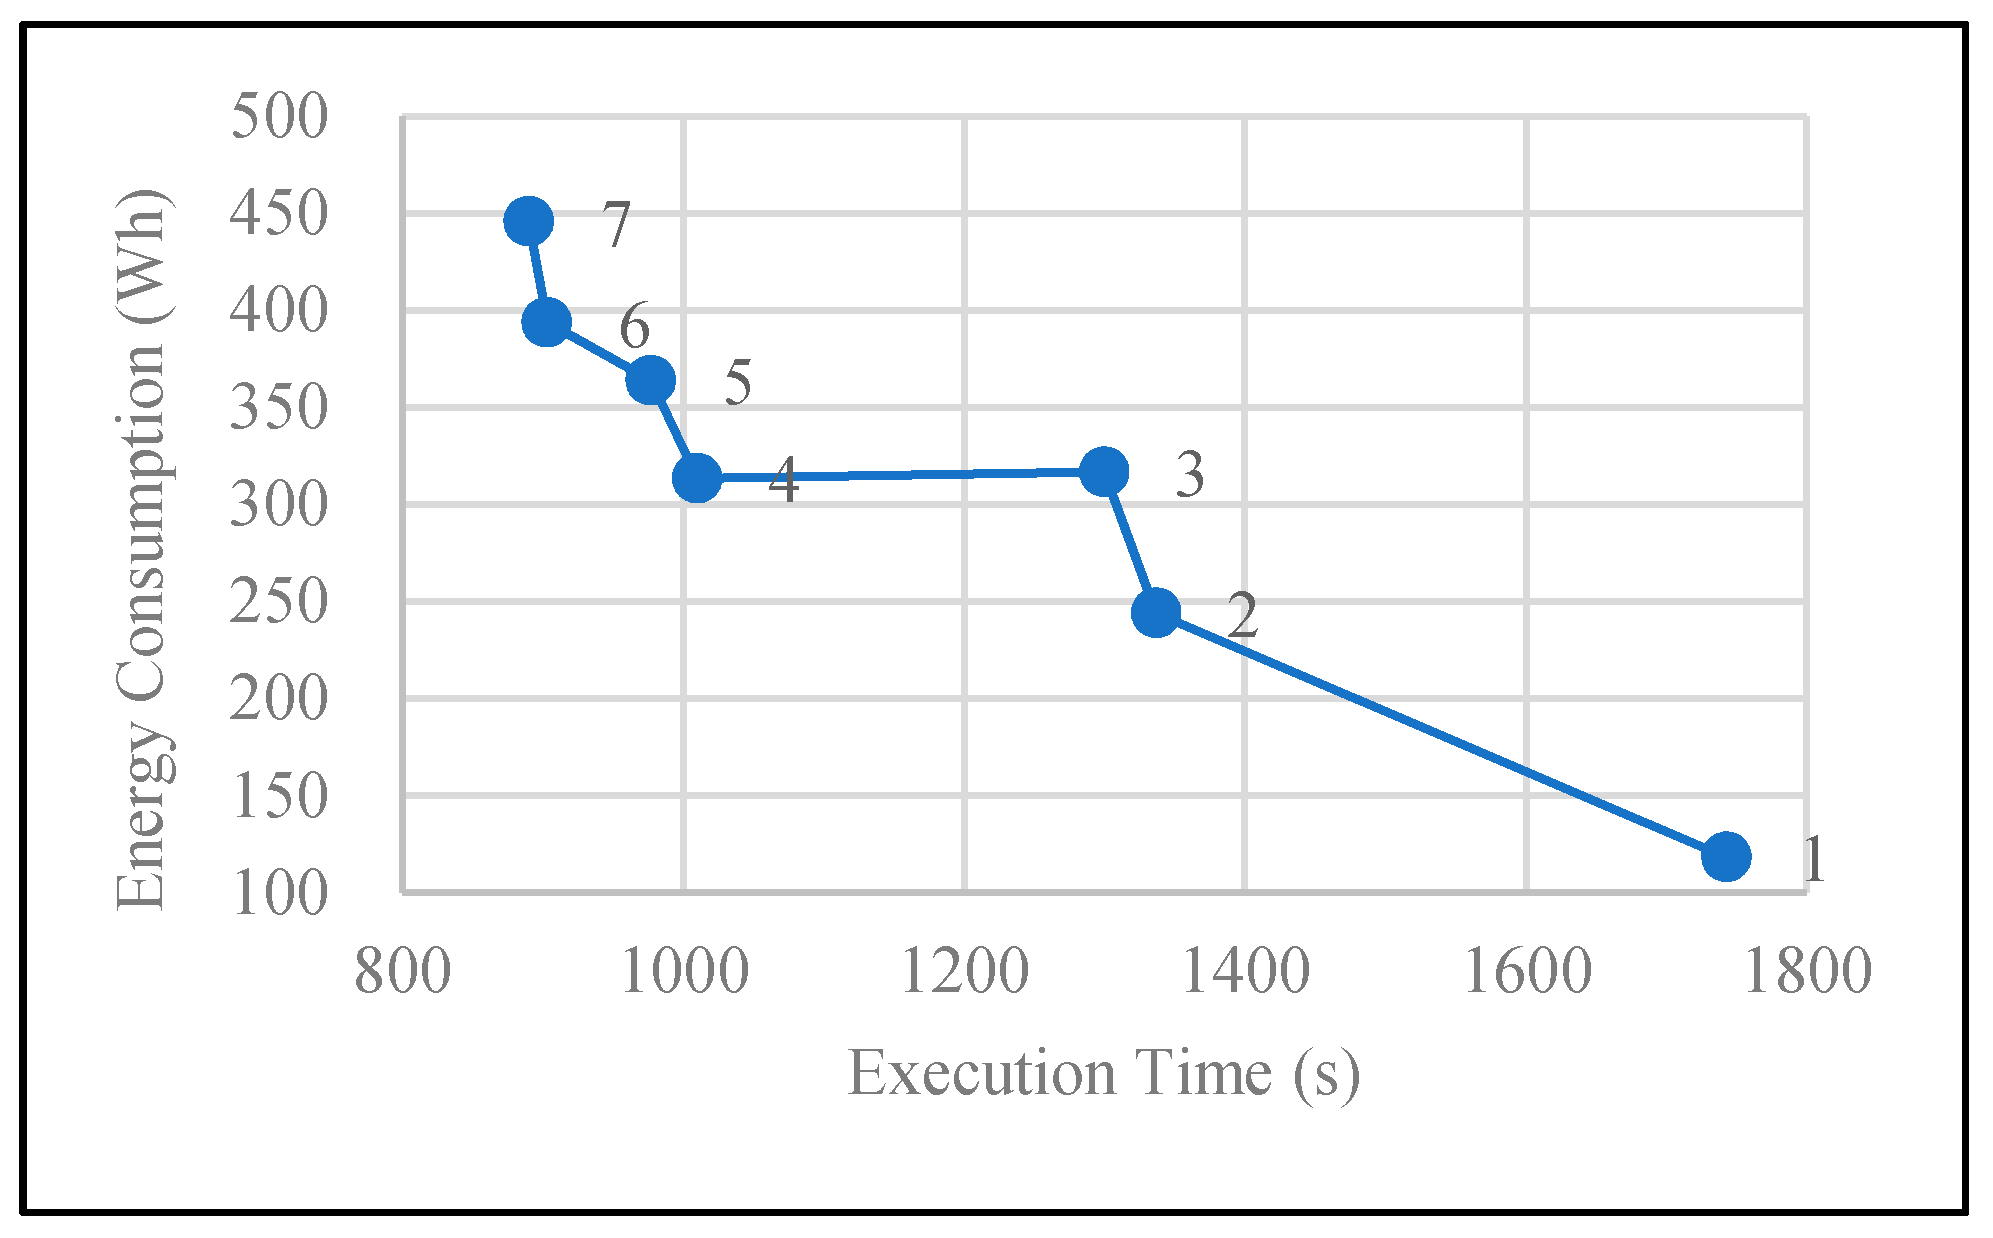
For example, we ran a simple classification job on Google Cloud Dataproc (integrate with Spark). The objective of the job was to train the random forest tree in parallel so as to find a better model. We used, from UCI, a Covertype [
19] dataset, which has 581,012 instances and 54 attributes. All nodes are n1-standard-2 type with 2 CPUs with 7.50 G RAM (supposing the average power consumption of fully utilized and idle nodes are 250 W and 200 W, respectively).
Figure 2 compares the energy consumption and execution time of different sizes of clusters. When the job works on Spark locally (only one node), the average execution time is at its longest, and the least amount of power is consumed. Overall, energy consumption increases and execution time reduces steadily as the number of nodes scales up from 1 to 7. Additionally, it is shown here that the scale of Spark clusters significantly affects the amount of power consumed.
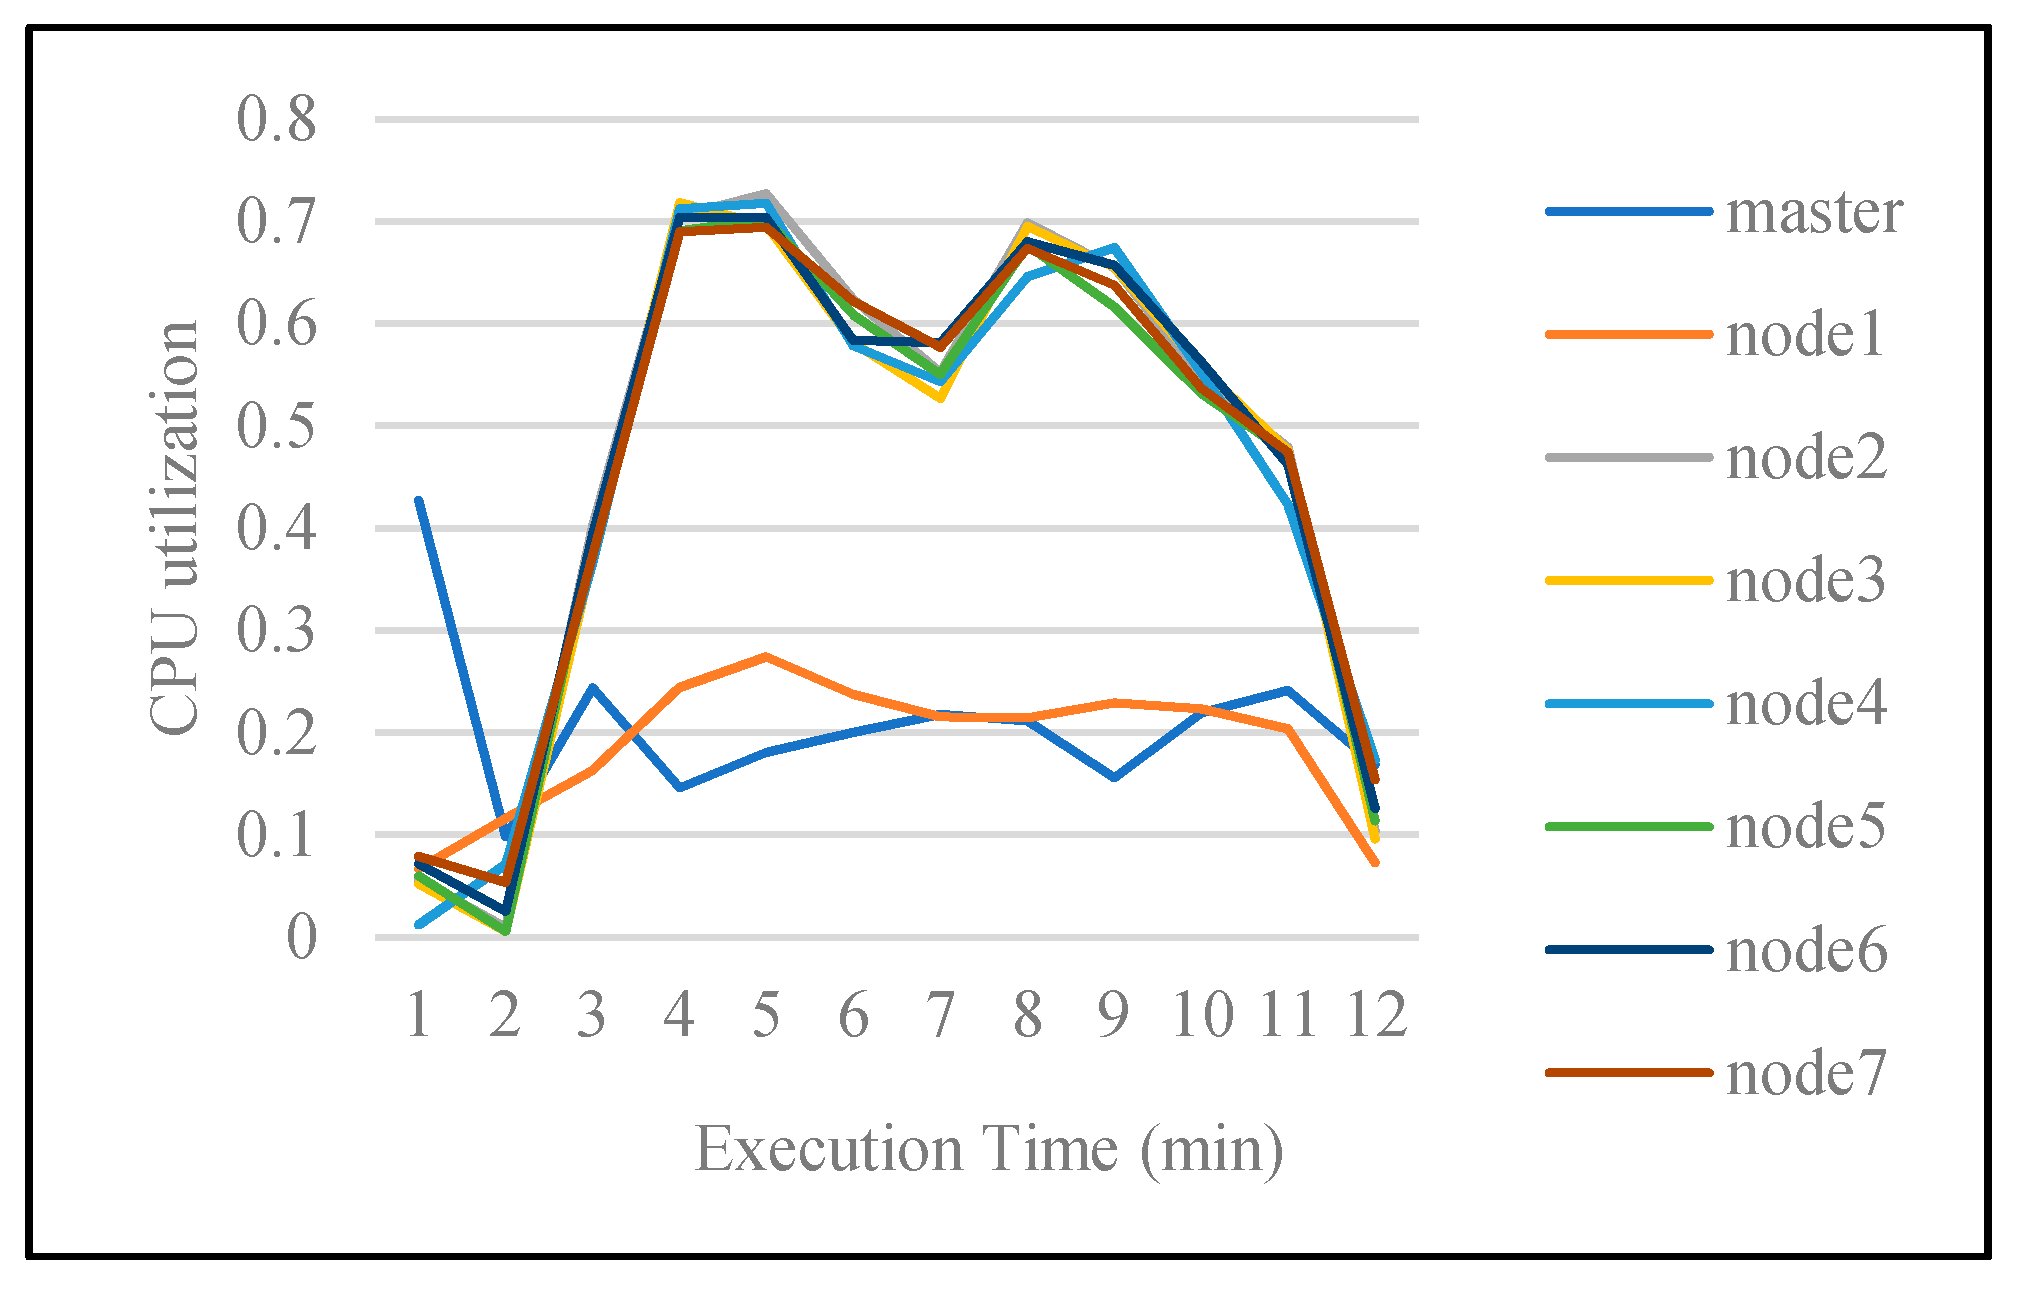
Figure 3 shows the CPU utilization of all seven nodes of the cluster. As the master node is responsible for managing available resources, its CPU utilization always differs from the others. It is noticed that most of the nodes have the same trend of CPU utilization, except for one node that shows a low utilization throughout the entire period.
3. Energy-Aware Spark Reconfiguration Methods
In this section, we present two Spark reconfiguration algorithms to reduce the energy consumption of the Spark cluster, the Scale Down Algorithm, and the VM Migration Algorithm. The Scale Down Algorithm aims to shrink the number of active nodes. It decreases power by shutting down some underutilized nodes. The VM Migration Algorithm is proposed for the purpose of increasing computational efficiency. It can shorten execution time, which is important for some time-constrained jobs.
As mentioned in
Section 1, many Cloud service providers have combined computing resources with Apache Hadoop and Spark, such as Google Dataproc or Amazon EMR. The configuration of Spark on Cloud has become much more convenient. For instance, a Google Dataproc cluster can set up a Spark cluster in less than 90 s on average. We believe this is important for reconfiguring Spark clusters even though performance degradation may occur. Ideally, those computation-intensive or memory-intensive data analytics jobs should fully maximize the use of available resources. However, some nodes may be underutilized. These nodes can be removed and turned off at the physical hosts or set to energy-saving mode. This will lead to workload increases for other normal nodes. The overall processing time of jobs on Spark can be either decreased or extended depending on data transmission costs.
We shall use the following notation in the rest of the paper:
= Number of nodes in the current cluster;
= the ith node, where ;
= Scale-down CPU threshold;
= Scale-down count threshold;
= Migrate CPU threshold;
= Migrate count threshold;
= CPU utilization of node at the jth unit time;
= Records of from start to the end;
= Records of the average CPU utilization, maximum and minimum CPU usage value and the corresponding index, and the number of nodes at the tth unit time;
= The minimum CPU utilization;
= The maximum CPU utilization;
= The index of the node that has minimum CPU usage;
= The index of the node that has maximum CPU usage;
= Information about the cluster from the beginning to the end of the experiment, which is also a list of .
The scale-down method follows Algorithm 1. When the difference between maximum and minimum values of CPU utilization in the cluster exceeds a threshold, the scale-down algorithm gets triggered. To avoid jitter, we should count how many times the node has the minimum CPU utilization during a certain period. If the count surpasses the given threshold, this node should be removed. When updating jobs on other active nodes, we choose those nodes with higher utilization than the average value to receive extra load. Thus, other potential underutilized nodes will not lengthen its execution time due to additional tasks. This policy can eliminate some low utilization nodes and ensures that high performance hosts can execute more jobs.
There are mainly two ways to improve the energy efficiency of a cluster, controlling the number of active hosts (CNAH) and a dynamically adjustment mechanism (DAM). Our proposed scale-down method belongs to the category of CNAH, aiming to remove the underutilized nodes for the sake of power consumption. Moreover, in order to determine the nodes that need to be removed, we use thresholds to estimate the overall state of the cluster. If a node exceeds the scale-down CPU threshold, then we use the count threshold to identify whether its CPU utilization is undergoing normal fluctuations or it is underutilized for a certain time. We may regard an underutilized node as removable if it has the lowest CPU utilization for a long period. In Algorithm 1, denotes the length of record , and is the index used for tracing the records list. The “for” loop checks the last records and counts how many times this node has the lowest CPU usage. If the count value equals threshold , this node will be removed.
In a Cloud environment, datacenters consist of a large amount of heterogeneous resources. It is highly possible that users do not have sufficient knowledge to configure the cluster scale appropriately because of various virtual machine types, different costs, and specific tasks. In this case, it is necessary to reconfigure the cluster scale for the purpose of energy conservation. However, due to the fact that the proposed scale-down algorithm removes these underutilized nodes according to the values of certain thresholds, it may not be applicable for the case when the tasks require great changes in CPU utilization.
| Algorithm 1: Scale Down Algorithm |
| Input: CPU utilization of all active nodes , |
Output: Node to be removed
Find the maximum and minimum value of CPU utilization of active nodes and , get the node with lowest utilization .
1: if and then
2: ,
3: for do
4: if and then
5:
6: end if
7:
8: end for
9: if then
10: Remove node
11: Update job on other actives nodes.
12: end if |
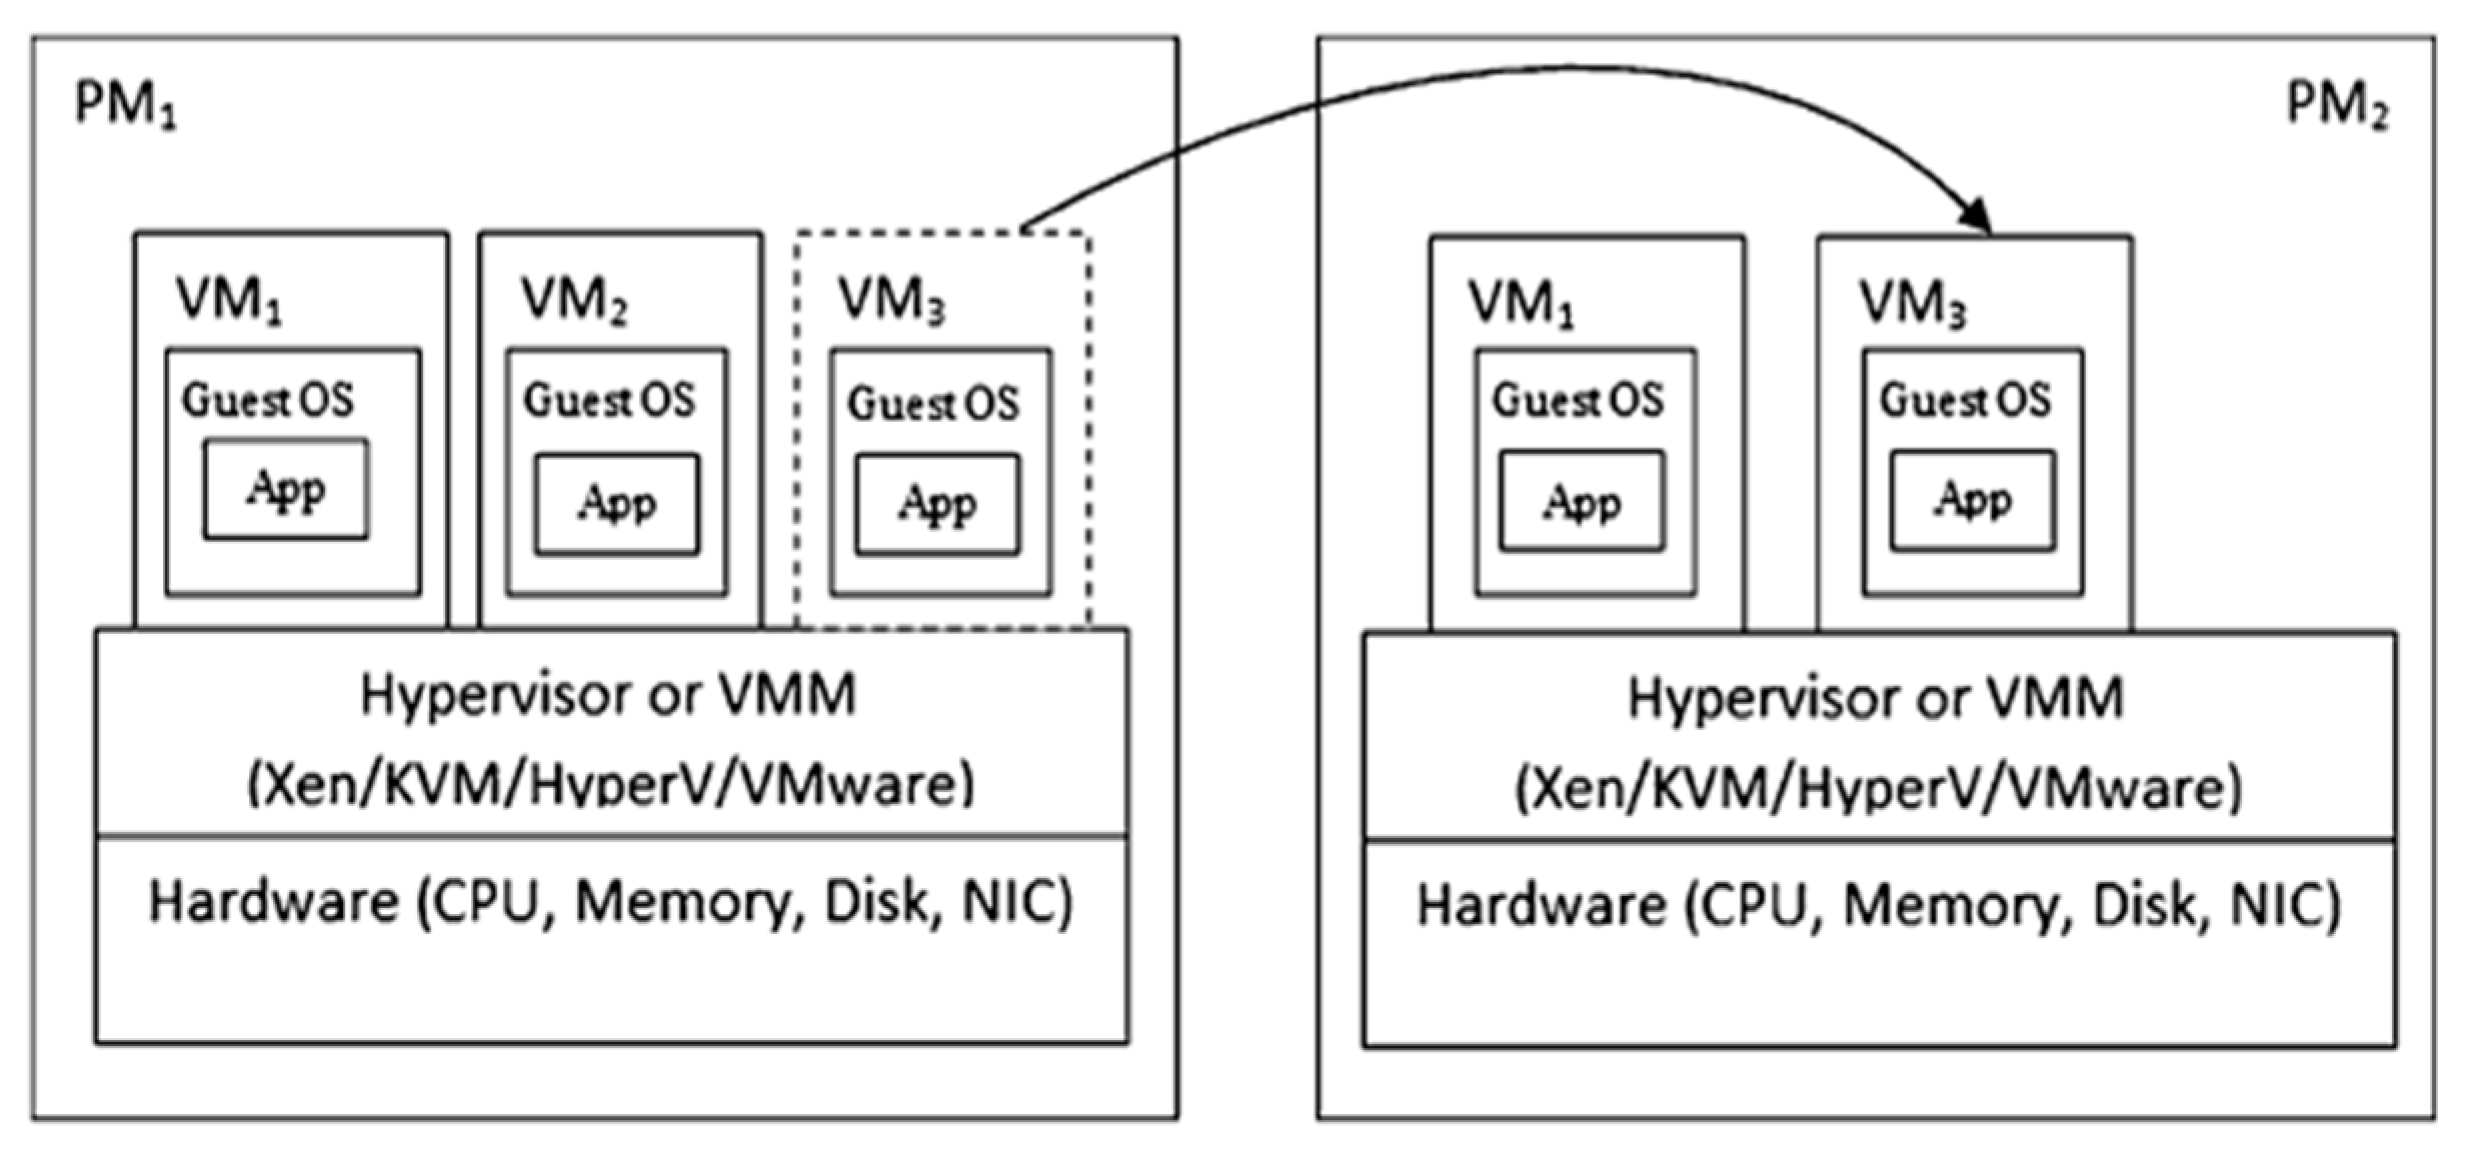
As is known, once the Spark cluster is built, all nodes share the same configuration file, which specifies the parameters (e.g., the IP address) of the master node and worker nodes. We cannot add a worker node on the fly unless we restart the Spark cluster after changing the profile. Sometimes, users do not have sufficient priori knowledge to estimate the running time or to choose the appropriate cluster scale for their jobs. Sometimes the current configuration fails to meet the requirement of resources or users’ time constraints. Thus, there is a need to increase the computing capacity of the Spark cluster without stopping existing running jobs. Virtual Machine (VM) migration technology makes this possible. VM live migration is completely transparent to the user, who can use VMs without any interruption. It has been used for load balancing, energy management, fault tolerance, online maintenance, and so on.
Figure 4 shows the architecture of VM live migration [
20].
The main steps of live migration include the following:
- (1)
Create empty system and data disks on the target physical machine whose paths must be exactly the same as those of the source physical machine.
- (2)
Create a virtual machine on the disks with the virtualization software. Configure the VM on the target physical machine in the same way as that of the original virtual machine, and put it in a paused state.
- (3)
Copy the disk data, save the dirty data, and synchronize the device status from the source to destination. Then, switch off the VM on the source host and restore the VM on the target back to the running state.
- (4)
Network broadcast to ensure that the mac address of the VM is updated to the virtual switcher on the target physical machine.
VM live migration enables adjustment of the resource allocations of the datacenter. We can also reconfigure the memory or the disk size of the VM before creating it in the target host. Thus, the new VM can accommodate workloads without restarting. We hope to use this method to increase the computing power of the Spark cluster on the Cloud. When the current nodes have very high CPU utilization, the performance of these nodes might be degraded. We consider migrating these nodes to other hosts in the Spark cluster environment as Algorithm 2 entails. If the CPU utilization of a node exceeds the threshold several times during a certain period, the VM migration algorithm will start. It then traces back through the CPU records to count the number of successive violations. If the count exceeds the given threshold, this node will be migrated.
The proposed VM migration algorithm builds upon the online migration technology, which is able to achieve the goal of transparent migration without shutting down the virtual machine. For each node in the cluster, we firstly estimate the length of its CPU utilization records . Then the last records are compared with threshold . If it is larger than the threshold value, will be increased by 1. As a consequence, those nodes with a count value the same as will be migrated.
| Algorithm 2: VM Migration Algorithm |
| Input: CPU utilization of all active nodes , , |
| Output: Node to be migrated |
1: for each node do
2: if then
3: ,
4: for do
5: if then
6:
7: end if
8:
9: end for
10: if then
11: Migrate node
12: end if
13: end for |
The proposed algorithms rely on threshold parameters, so these parameters will affect the simulation results. The scale-down CPU threshold is applied to determine the time taken to trigger the scale-down action and to find the nodes that need to be removed. Notice that we do not compare with the CPU utilization of each node because CPU usages will change in different stages, and different nodes can also have different CPU utilization. The disparity between the highest and lowest CPU usage is firstly calculated and then compared with . When the threshold is set with a higher value, the node with the lowest CPU usage is identified only if the highest CPU usage in the cluster also reaches a large value. If the threshold is low, a number of nodes can match this condition and be removed, which leads to high loads for the remaining nodes. is another parameter that determines the remove action. Considering regular fluctuations in CPU utilization, a node may satisfy the previous condition, but it goes back to a normal state after some time. is used for distinguishing the inactive nodes from fluctuating ones. This threshold is chosen based on the tolerance of fluctuations. A larger threshold can restrict the number of removable nodes, while a smaller value is more sensitive to changes in CPU usage, which leads to more removable nodes.
The migration CPU threshold is used for deciding whether to trigger the migration action or not. For each node, we compare with its CPU utilization. When the CPU utilization exceeds , we track the records of so as to find the duration of highly used CPU. and thresholds are used to estimate whether a high CPU usage is normal for a short time or caused by insufficient CPU cycles. Lower or can result in a large number of nodes to migrate. By contrast, higher or can filter an unnecessary migration.
4. Experimental Results
We use CloudSim toolkit to simulate a realistic Spark environment and perform the experiments. We compare the efficiency of our algorithm with default non-power aware implementation and Dynamic Voltage and Frequency Scaling (DVFS) algorithm.
CloudSim [
21] is an extensive simulation framework that enables seamless modeling, simulations as well as experimentation of emerging Cloud computing infrastructures and management services. It supports both system and behavior modeling of Cloud system components such as data centers, hosts, virtual machines, Cloudlet, and resource provisioning policies. A host models a physical resource (e.g., compute or storage server), which is described by the amount of memory and storage, a list of processing cores, allocation policies for sharing the processing power among VMs, and policies for provisioning memory and bandwidth to the VMs. A virtual machine is managed and hosted by a Cloud host component. VM has information about memory, the processor, storage size, and so on. Cloudlet is a Cloud-based application service, which has an instruction length and data transfer overhead that it needs to undertake during its life cycle. To simulate a Spark cluster, each Cloudlet binds to only one virtual machine and each host runs only one virtual machine. Based on the context, Cloudlet stands for the specific data analytics job running on Spark. Note that, in CloudSim, Million Instructions Per Second (MIPS) is used as the metric to evaluate the performance of a host or virtual machine, and the CPU utilization is calculated by dividing the allocated MIPS by the total MIPS. We set CloudletScheduler as CloudletSchedulerDynamicWorkload to simulate a different UtilizationModel for Cloudlets. By doing this, the CPU utilization changes according to the simulation model.
The parameters used in our simulation are specified in
Table 1. We configured 20 hosts, virtual machines, and Cloudlets to simulate a Spark cluster. The maximum MIPS of hosts and virtual machines is 1000 or 2000. All of them have one core CPU. The length of the Cloudlet is 2000 × 10 × 5. If the CPU is used with 1000 MIPS, it will take 100 units time to complete the job. The clock time of CloudSim is 5, so every 5 units of time, the simulator acquires the status of all nodes in the cluster. Regarding the scale-down experiment, we pre-set three types of CPU utilization, they are “high (80%)”, “medium (50%)”, “low (30%)” and their corresponding proportions are 30%, 30%, 40%. The CPU capacity of the nodes is 1000, with a maximum power of 250 W and a static power of 175 W. For the migration experiment, we simulated three kinds of CPU utilization, given by 50%, 60% and 95% where their corresponding occupancy percentages of the cluster nodes are 30%, 30% and 40%. At the beginning, all nodes are configured with 1000 MIPS, and the maximum power and static power are 250 W and 175 W, respectively. For the destination host, which can be migrated to, we set the CPU capacity with a higher value, 2000 MIPS, and a higher power consumption, 270 W for full use and 189 W statically. Based on the work of Fulsoundar and Ingle [
22], we know that the performance of the Cloud degrades when the CPU usage of a Virtual Machine (VM) running on the cloud increases (to 90–100%). Since performance degradation does exist, we assume that the CPU utilization can be degraded to 50% (it can also be 30%, 20%, or some other value according to the environment).
We compared the average CPU utilization, the execution time, and power consumption of the cluster by conducting experiments with the proposed algorithms.
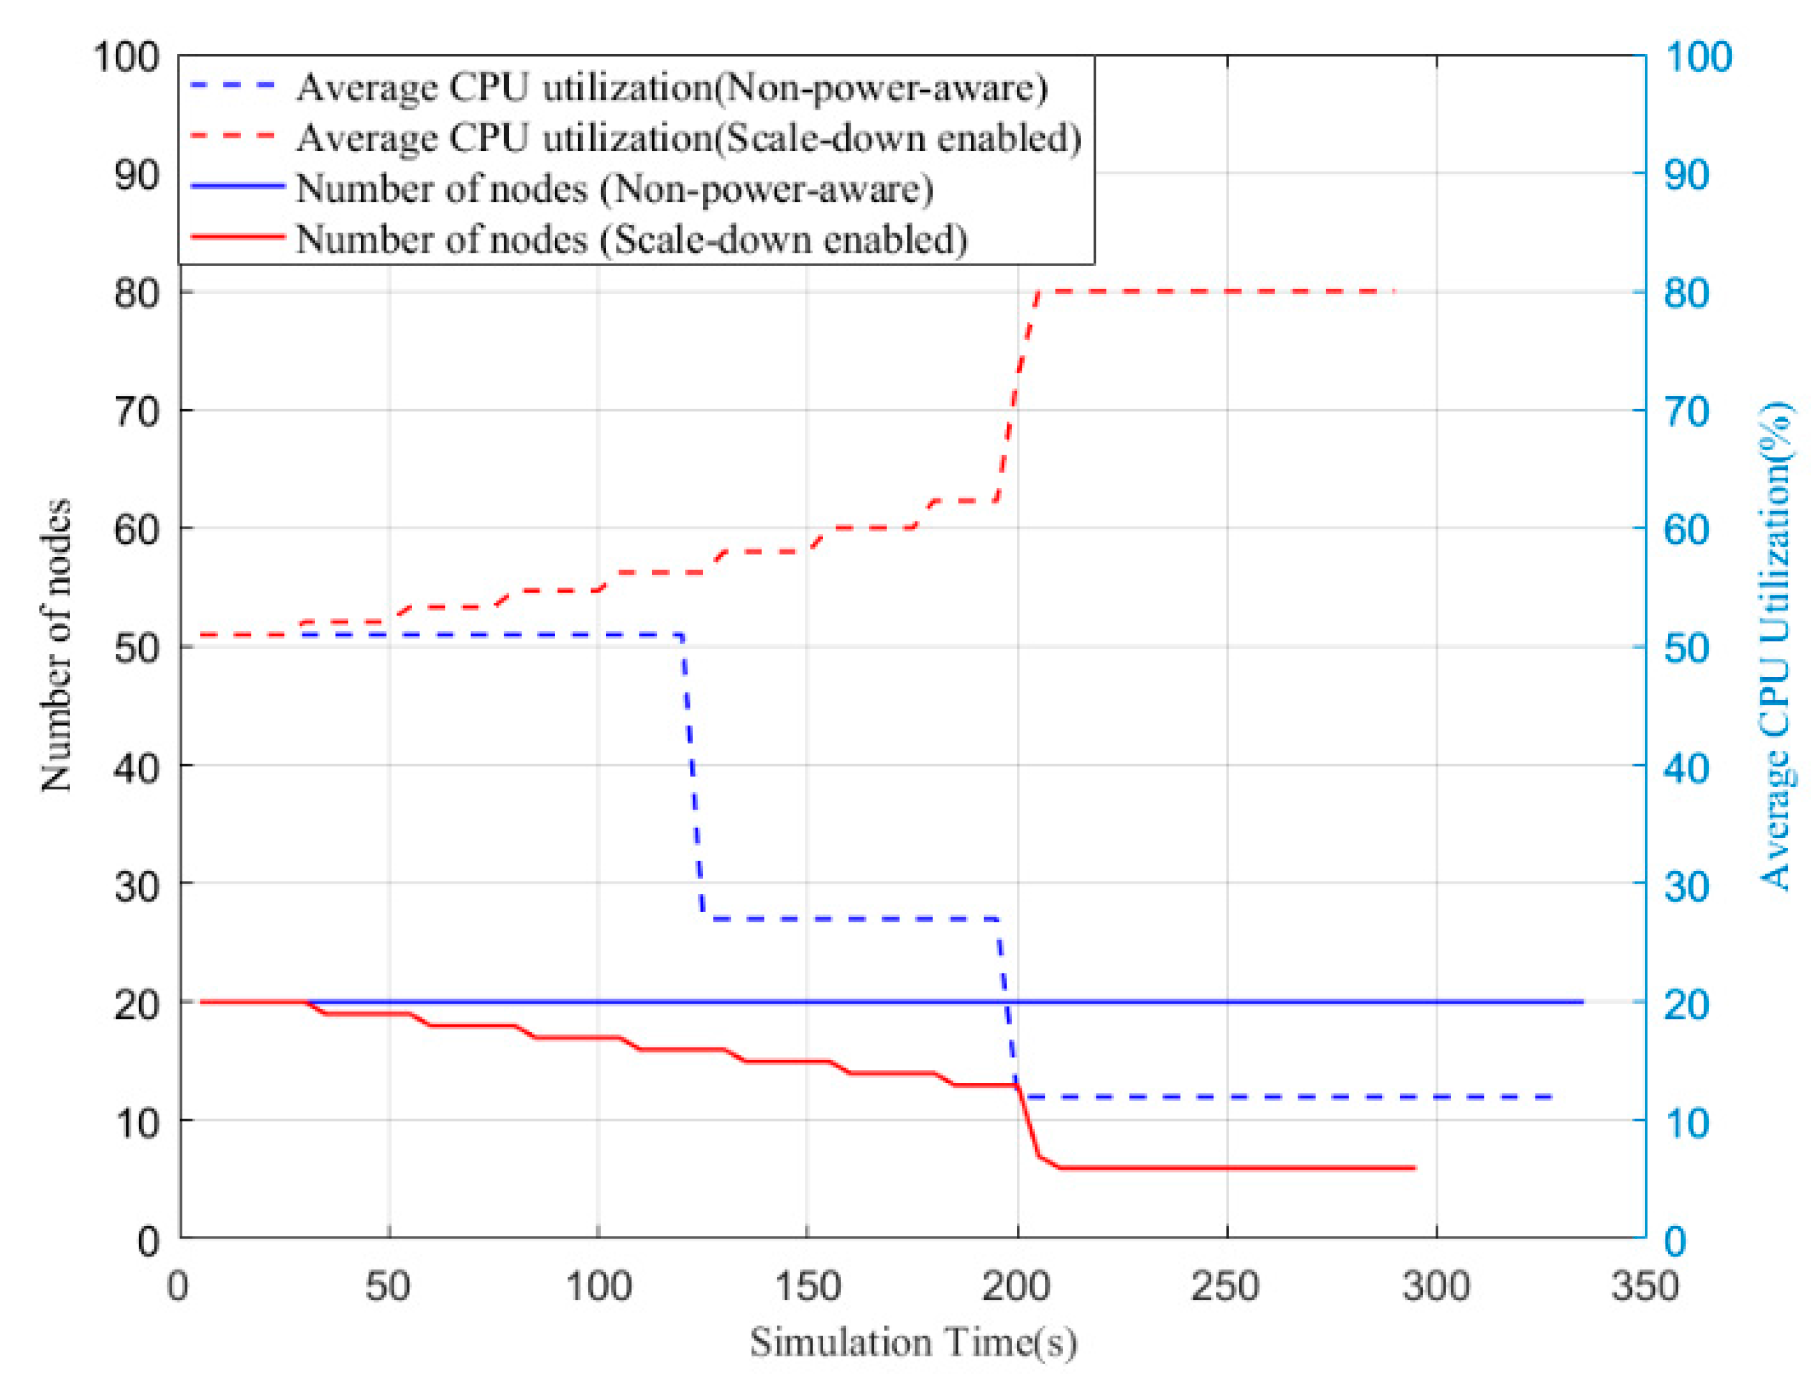
Figure 5 shows the average CPU utilization and the number of nodes in a cluster using the non-power-aware (default) method and the proposed scale-down algorithm. Notice that we do not present the number of nodes or the average CPU utilization of DVFS due to the fact that they are the same as the non-power-aware method. For the non-power-aware approach, the number of nodes remains unchanged during the simulation. Moreover, we can also see that the average CPU utilization decreases dramatically at around 125 s and 195 s when virtual machines with greater CPU capacity finish their tasks. By contrast, those nodes with less CPU utilization take longer to process the allocated jobs. The scale-down algorithm makes it possible to remove underutilized nodes, so the number of active nodes decreases steadily before 200 s. Similarly, a sharp drop appears at 200 s when the nodes complete their tasks. However, the average CPU utilization shows an opposite trend that increases stably. By moving jobs from less active nodes to more efficient nodes, the execution time is also reduced. Overall, the scale-down-enabled policy can improve the average CPU utilization of a cluster by removing underutilized nodes.
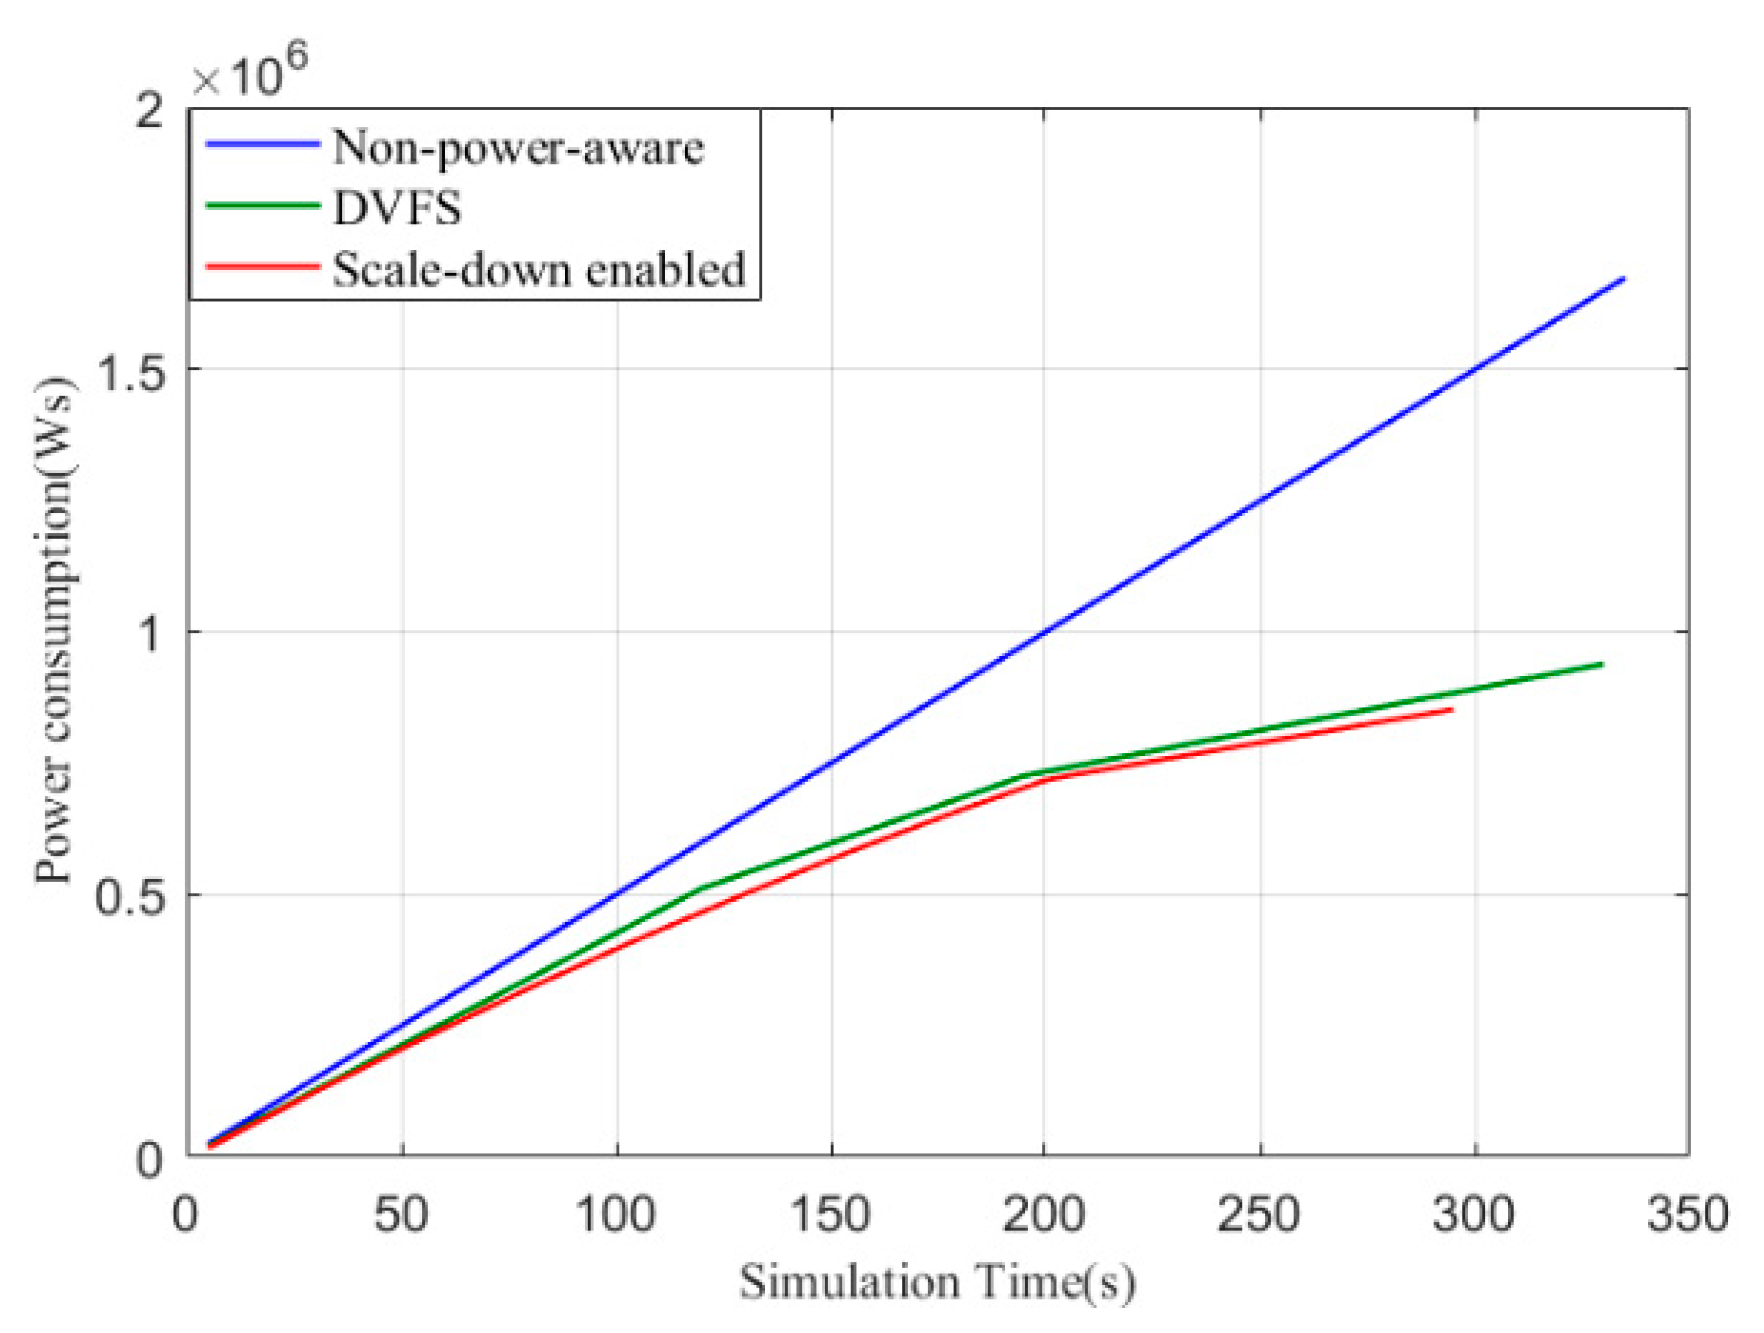
Figure 6 displays the power consumption of the cluster of the non-power-aware (default), DVFS, and scale-down algorithms. The default configuration consumes the most power, and the scale-down-enabled cluster shows the lowest energy consumption. DVFS requires a little more power compared with the proposed algorithm. The amount of energy consumption is associated with the number of active nodes and the processing time. The scale-down-enabled cluster with higher efficiency has fewer nodes and a lower execution time, which leads to energy conservation.
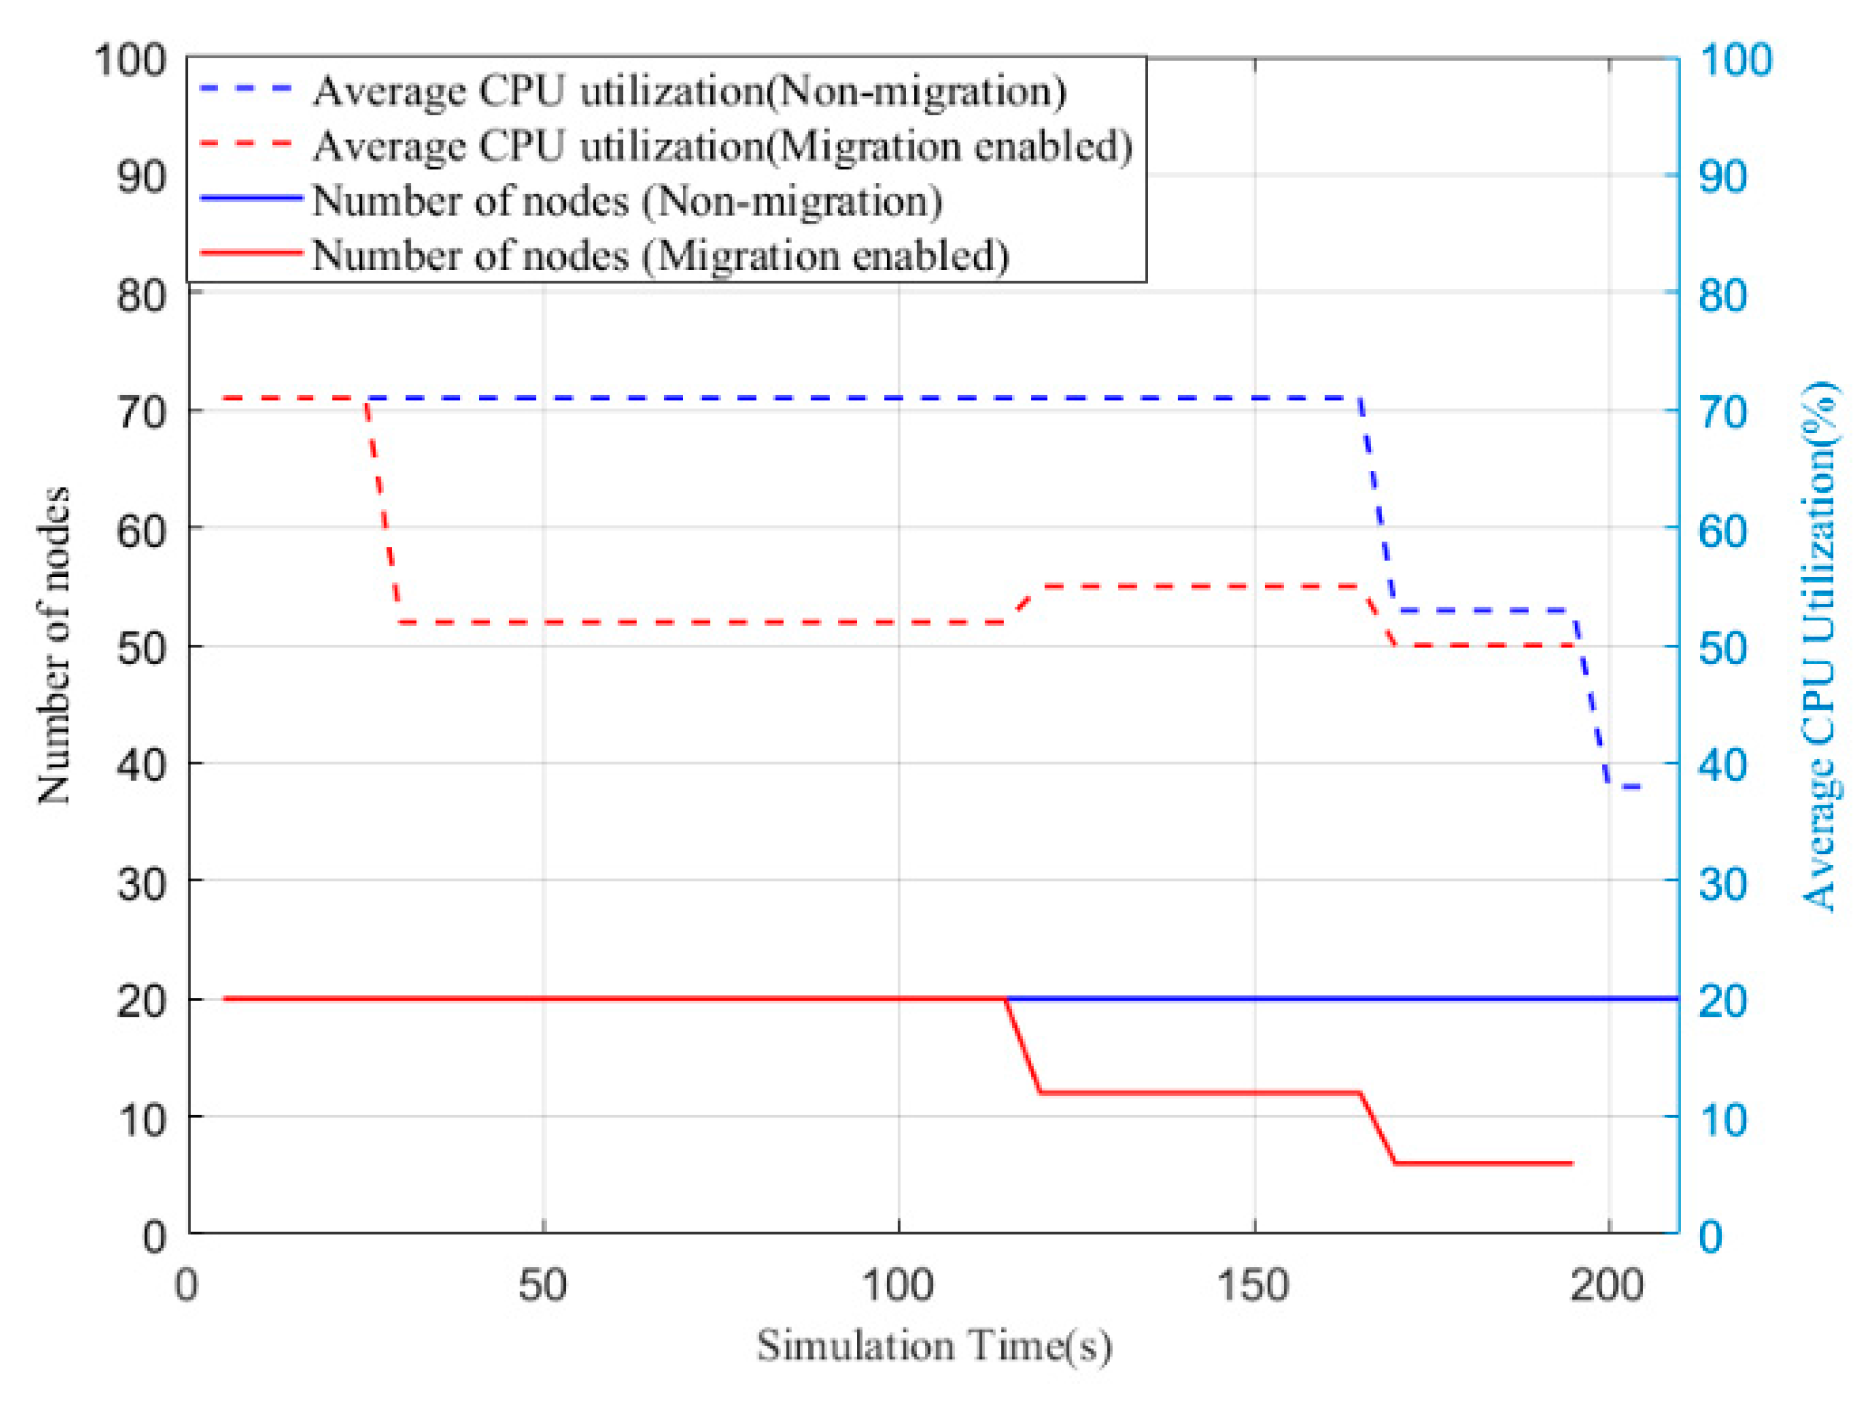
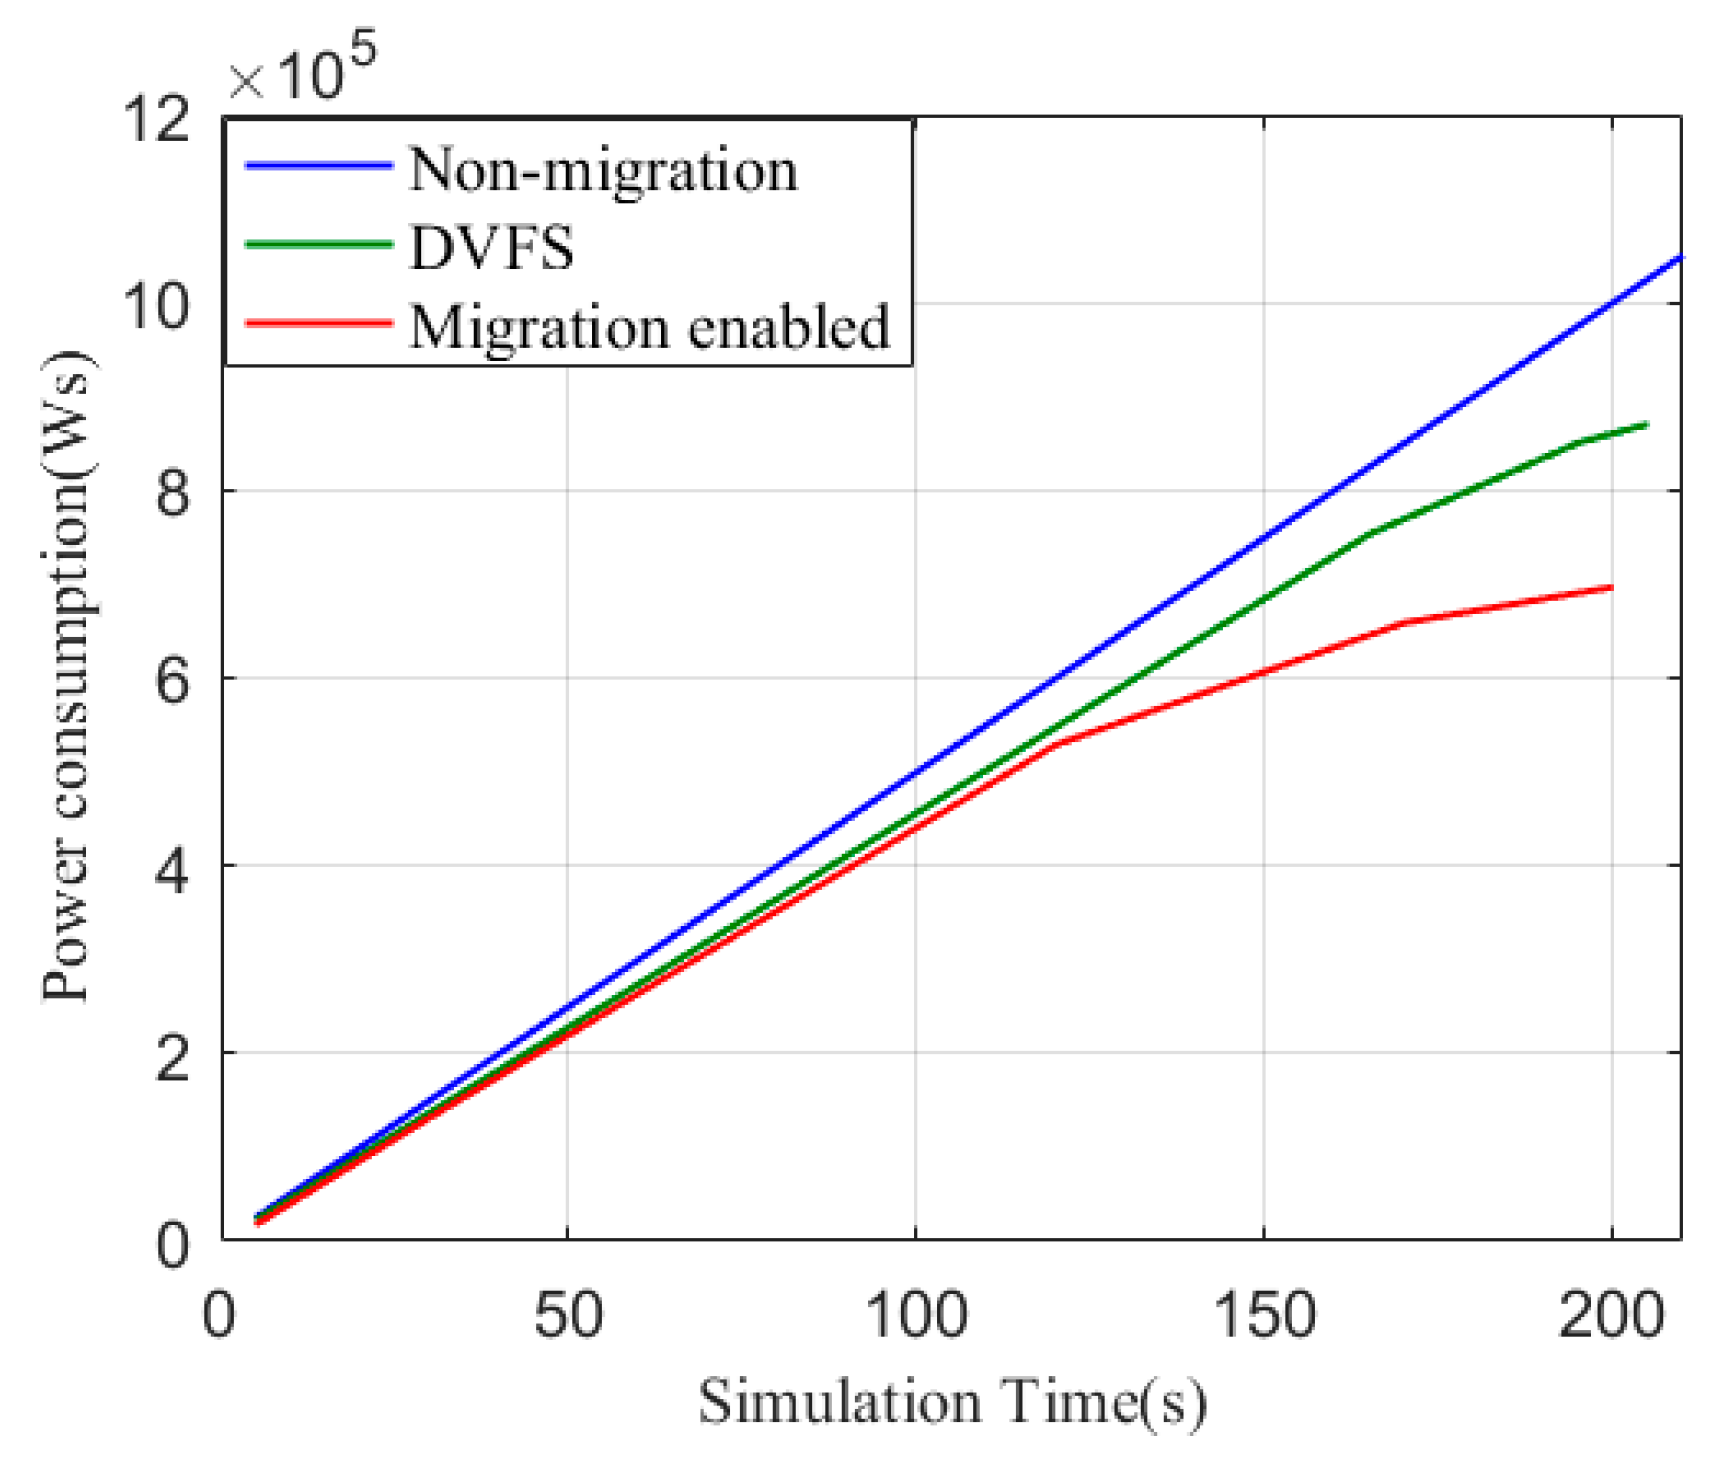
Figure 7 depicts the average CPU utilization and the number of nodes in a cluster with the non-migration (default) method and the proposed migration algorithm. Similar to what we mentioned before, we do not show the number of nodes or the average CPU utilization of DVFS here because they are the same as the default method. With respect to the default policy, the number of nodes was a constant value when we implemented the algorithm. The migration-enabled cluster also shows a decrease in number as the nodes finish their jobs. The average CPU utilization relates to both the number of active nodes and the CPU usage of each node in the cluster. When nodes are moved to a host with more CPU capacity (MIPS), the average CPU usage decreases. There is an increasing trend at around 120 s, which is when the nodes finish their jobs and release more available resources. It is important to point out that the execution time is reduced by moving tasks from inefficient nodes to efficient ones. To summarize, the migration-enabled policy is capable of decreasing the average CPU utilization and execution time. Furthermore, the power consumption of the given non-migration- (default), DVFS-, and migration-enabled clusters are presented in
Figure 8.


