Communication

Snapshot of Photovoltaics—March 2017

by
Arnulf Jäger-Waldau
European Commission, Joint Research Centre (JRC), Directorate C: Energy, Transport and Climate, Energy Efficiency and Renewables Unit, Via E. Fermi 2749, I-21027 Ispra (VA), Italy
Sustainability 2017, 9(5), 783; https://doi.org/10.3390/su9050783
Submission received: 11 April 2017 / Revised: 28 April 2017 / Accepted: 5 May 2017 / Published: 9 May 2017
(This article belongs to the Section Energy Sustainability)

Abstract

:
Renewable energy use, especially from solar photovoltaic electricity generation, is growing at a much faster pace than the rest of the economy world-wide. The significant cost reduction of solar PV over the last decade and the zero-fuel cost volatility have increased solar PV’s attractiveness. In 2016, the newly installed solar PV power of about 75 GW was more than all the world-wide installed capacity until the end of 2011. The fact that the Paris Agreement went into force on 4 November 2016 will be another accelerating factor for the use of electricity from renewable energy sources. Apart from the electricity sector, renewable energy sources for the generation of heat and environmental friendly synthetic-fuels for the transport sector will become more and more important in the future.

1. Introduction

The 21st session of the Conference of the Parties (COP 21, 30 November–12 December 2015) to the United Nations Framework Convention on Climate Change (UNFCCC) in Paris, France ended with a landmark agreement to keep the maximum global average temperature rise as close as possible to 1.5 °C.
With the signature of the European Union (EU) on 5 October 2016, the necessary number of at least 55 Parties to the Convention accounting in total for at least an estimated 55% of the total global greenhouse gas emissions have deposited their instruments of ratification, acceptance, approval, or accession with the Depositary [1]. As a consequence, the Paris Agreement entered into force on 4 November 2016 just 3 days before COP 22 (7–18 November 2016) started in Marrakesh, Morocco.
There is general consensus that the Nationally Determined Contributions (NDCs) proposed by each country are only a stepping stone on the way to realizing the goals of the Paris Agreement. In a recent publication, Sir Robert Watson, former Chair of the Intergovernmental Panel on Climate Change (IPCC), and co-authors stated that global green-house gas (GHG) emission are not projected to decrease fast enough to stay below 2 °C [2]. According to this analysis, the 1.5 °C would be reached by early 2030 and the 2.0 °C target by 2050. The authors urged all countries to revise their pledges by 2018 in order to really reach the targets of the Paris Agreement.
An important component to achieve the targets is the decarbonization of our energy supply, because 65% of the world’s current CO2 emissions are due to burning fossil fuels. In 2014, 81% of our total primary energy supply depended on burning fossil fuels, namely 29% coal, 31% oil, and 21% natural gas [3]. In terms of final energy consumption electricity only accounted for 18.1%, but was responsible for 35.2% of the total CO2 emissions [3,4].
Photovoltaics (PV) is one of the key technology options for implementing the shift to a decarbonized energy supply and can be deployed in a modular way almost everywhere on the planet. Solar resources across the world are abundant and cannot be monopolized by one country.

2. Materials and Methods

The production data used for this paper are collected on a regular basis from stock market reports of listed companies, commercial and private market reports, and colleagues. These different data sets are cross-checked for consistency to make sure that the same category of products are compared. Where necessary, the results were confirmed with personal communications. Regular fact-finding missions involving company visits—as well as meetings with officials from companies, funding organizations, and policymakers—complete the picture.
The market data for PV electricity generation system installations are collected from national statistics, solar and renewable energy associations, as well as consultancies and individual experts. Like for the production data, these different data sets are cross-checked for consistency to make sure that standard DC peak power capacities are compared.

3. Results

3.1. PV Solar Cell Production

Production data for the global cell production (Solar cell production capacities mean: —In the case of wafer silicon based solar cells, only the cells; —In the case of thin-films, the complete integrated module; —Only those companies which actually produce the active circuit (solar cell) are counted; —Companies which purchase these circuits and make cells are not counted.) in 2016 varies between 78 GW and 82 GW and estimates for 2017 are in the 80 to 85 GW range. The significant uncertainty in this data is due to the highly competitive market environment, as well as the fact that some companies report shipment figures, while others report sales, and others report production figures. China already overtook Germany in terms of cumulative installed nominal capacity in 2015, Japan followed in 2016 and the U.S.A. in early 2017.
The data presented—collected from stock market reports of listed companies, market reports, and colleagues—were compared to various data sources and thus led to an estimate of 77 GW (Figure 1), representing an increase of about 35% compared to 2015 and a moderate increase of about 10% is expected for 2017.
Uncertainties in Production Statistics:
  • Only a limited number of companies report production figures for solar cells or thin film modules. Often the production of “solar products” is reported, without a differentiation between wafers, cells, or modules.
  • Shipment figures can include products from stock, already produced in the previous year.
  • Some companies report shipments of “solar product” without a differentiation between wafers, cells or modules.
  • The increasing trend towards Original Equipment Manufacturing (OEM) increases the potential of double counts.
The production volume in 2016 was about 250 times that of 2000, with a compound annual growth rate (CAGR) of over 40%. After a rapid increase of the annual production in China and Taiwan since 2006, a new trend emerged in 2014 to increase production capacities in other Asian countries like India, Malaysia, the Philippines, or Vietnam. It is worthwhile to note that the largest share of these investments is done by Chinese companies. Another trend in the PV industry was the rapid increase in original equipment manufacturing (OEM) volumes since 2011, which allowed larger companies to significantly increase their shipment volumes without adding new capacity of their own.
The overcapacity in the solar industry, triggered by the massive capacity expansions between 2007 and 2011, has led to price pressure along the value chain and resulted in a brisk reduction of market prices for polysilicon materials, solar wafers and cells, as well as solar modules. Since 2008, PV module prices have decreased by more than 85%—and by 20% in 2012 alone—before it slowed in 2013 and continued to decrease more moderately since. However, the volatility of the spot market prices has increased considerably.
These rapid and ongoing price decreases put all companies along the solar value chain under enormous pressure and access to fresh capital was and still is crucial for survival. As a consequence, a significant number of companies in the PV manufacturing industry had to close or were taken over since 2009 [7]. Despite this consolidation, the number of new entrants to the field—notably large semiconductor, construction, or energy-related companies—added additional capacities and make a reasonable forecast for future capacity developments very speculative.
Since the beginning of 2014, the announcements of new capacity expansions have significantly increased, totaling more than 100 GW of thin film, solar cell, and module capacity in January 2017. However, there is a huge discrepancy between these announcements and confirmed equipment orders and actual equipment shipments. The ongoing cost pressure and the move to modules with higher efficiencies makes it is obvious that older production lines, where possible, have to be upgraded or substituted with manufacturing capacities capable of producing the higher efficiency solar cells needed. Therefore, the overall net capacity increase of solar cells will be much lower than the announcements imply.
Nevertheless, the general trend still is pointing in the direction of more capacity announcements despite a growing fear of oversupply. For 2016, capital expenditure (CAPEX) of new investments in manufacturing was expected to be more than USD 4.5 billion. CAPEX for a 1 GW solar silicon solar cell and module plant has been reduced from about USD 680 million in the U.S.A. and USD 510 million in China [8] in 2011, to USD 430 million in the U.S.A. in 2H2014 [9] to USD 190 million in China in 2015 [10]. According to information gathered at the 10th SNEC International Photovoltaic Power Generation Conference and Exhibition (SNEC 2016) in May 2016, CAPEX for silicon solar cell and module manufacturing equipment (made in China), without infrastructure and building, can be as low as about USD 60 million for 1 GW capacity.
It should be noted that the level of oversupply and excess capacity will be different in the four main parts of the silicon module value chain, i.e., (1) polysilicon production, (2) wafer production, (3) solar cell manufacturing, (4) module manufacturing. The current trend is a lowering of the oversupply in the first two sectors, whereas the excess capacity gap is growing in the latter two. As a consequence, this development will continue to add pressure to the margins of most manufacturers. The overall average selling price (ASP) of modules is decreasing further, due to three main factors: (1) the aforementioned oversupply, (2) contracting high price markets like Japan, and (3) a shift of supply to lower price markets like China or countries with extreme competitive price bids for PPAs.

3.2. Solar PV Electricity Generation and Markets

In March 2017, the world-wide average system price for residential systems with installation—without permitting or connection costs—was given with 1.56 USD/Wp (1.44 EUR/Wp) ranging between 1.23 USD/Wp (1.14 EUR/Wp) in Europe and up to 2.36 USD/Wp (2.18 EUR/Wp) in some other cases [11]. For commercial systems, the range was given with 0.86 USD/Wp (0.80 EUR/Wp) to 1.58 USD/Wp (1.46 EUR/Wp). For the total capital expenditure (CAPEX) for a project, which includes projecting and permitting costs, the range for all non-tracking utility PV systems is given between 0.77 USD/Wp and 4.18 USD/Wp by Bloomberg New Energy Finance in H2 2016 [12]. The resulting levelized costs of electricity (LCOE) in addition depend on the solar radiation, fixed operation, and maintenance (O&M) costs, cost of debt and the return on equity expectations, which differ from country to country. The overall range is given between 45 USD/MWh and 398 USD/MWh [12].
Since 2009, the price for Power Purchase Agreements (PPA) have decreased by almost 70% reaching 50 USD/MWh in sunnier regions of the world with reasonable financing costs. 2016 saw a number of record breaking power purchase agreements (PPA) contracts and bids below USD 30/MWh and a new low was observed with a USD 24.2/MWh bid for an Abu Dhabi Electricity and Water Authority’s tender in September 2016. These very low bids and PPAs in the United Arab Emirates and Chile are only possible through a combination of excellent solar resource, high debt shares, and very low debt costs as well as the fact that some tariffs are indexed to inflation and the start of electricity delivery can be as late as 2020.
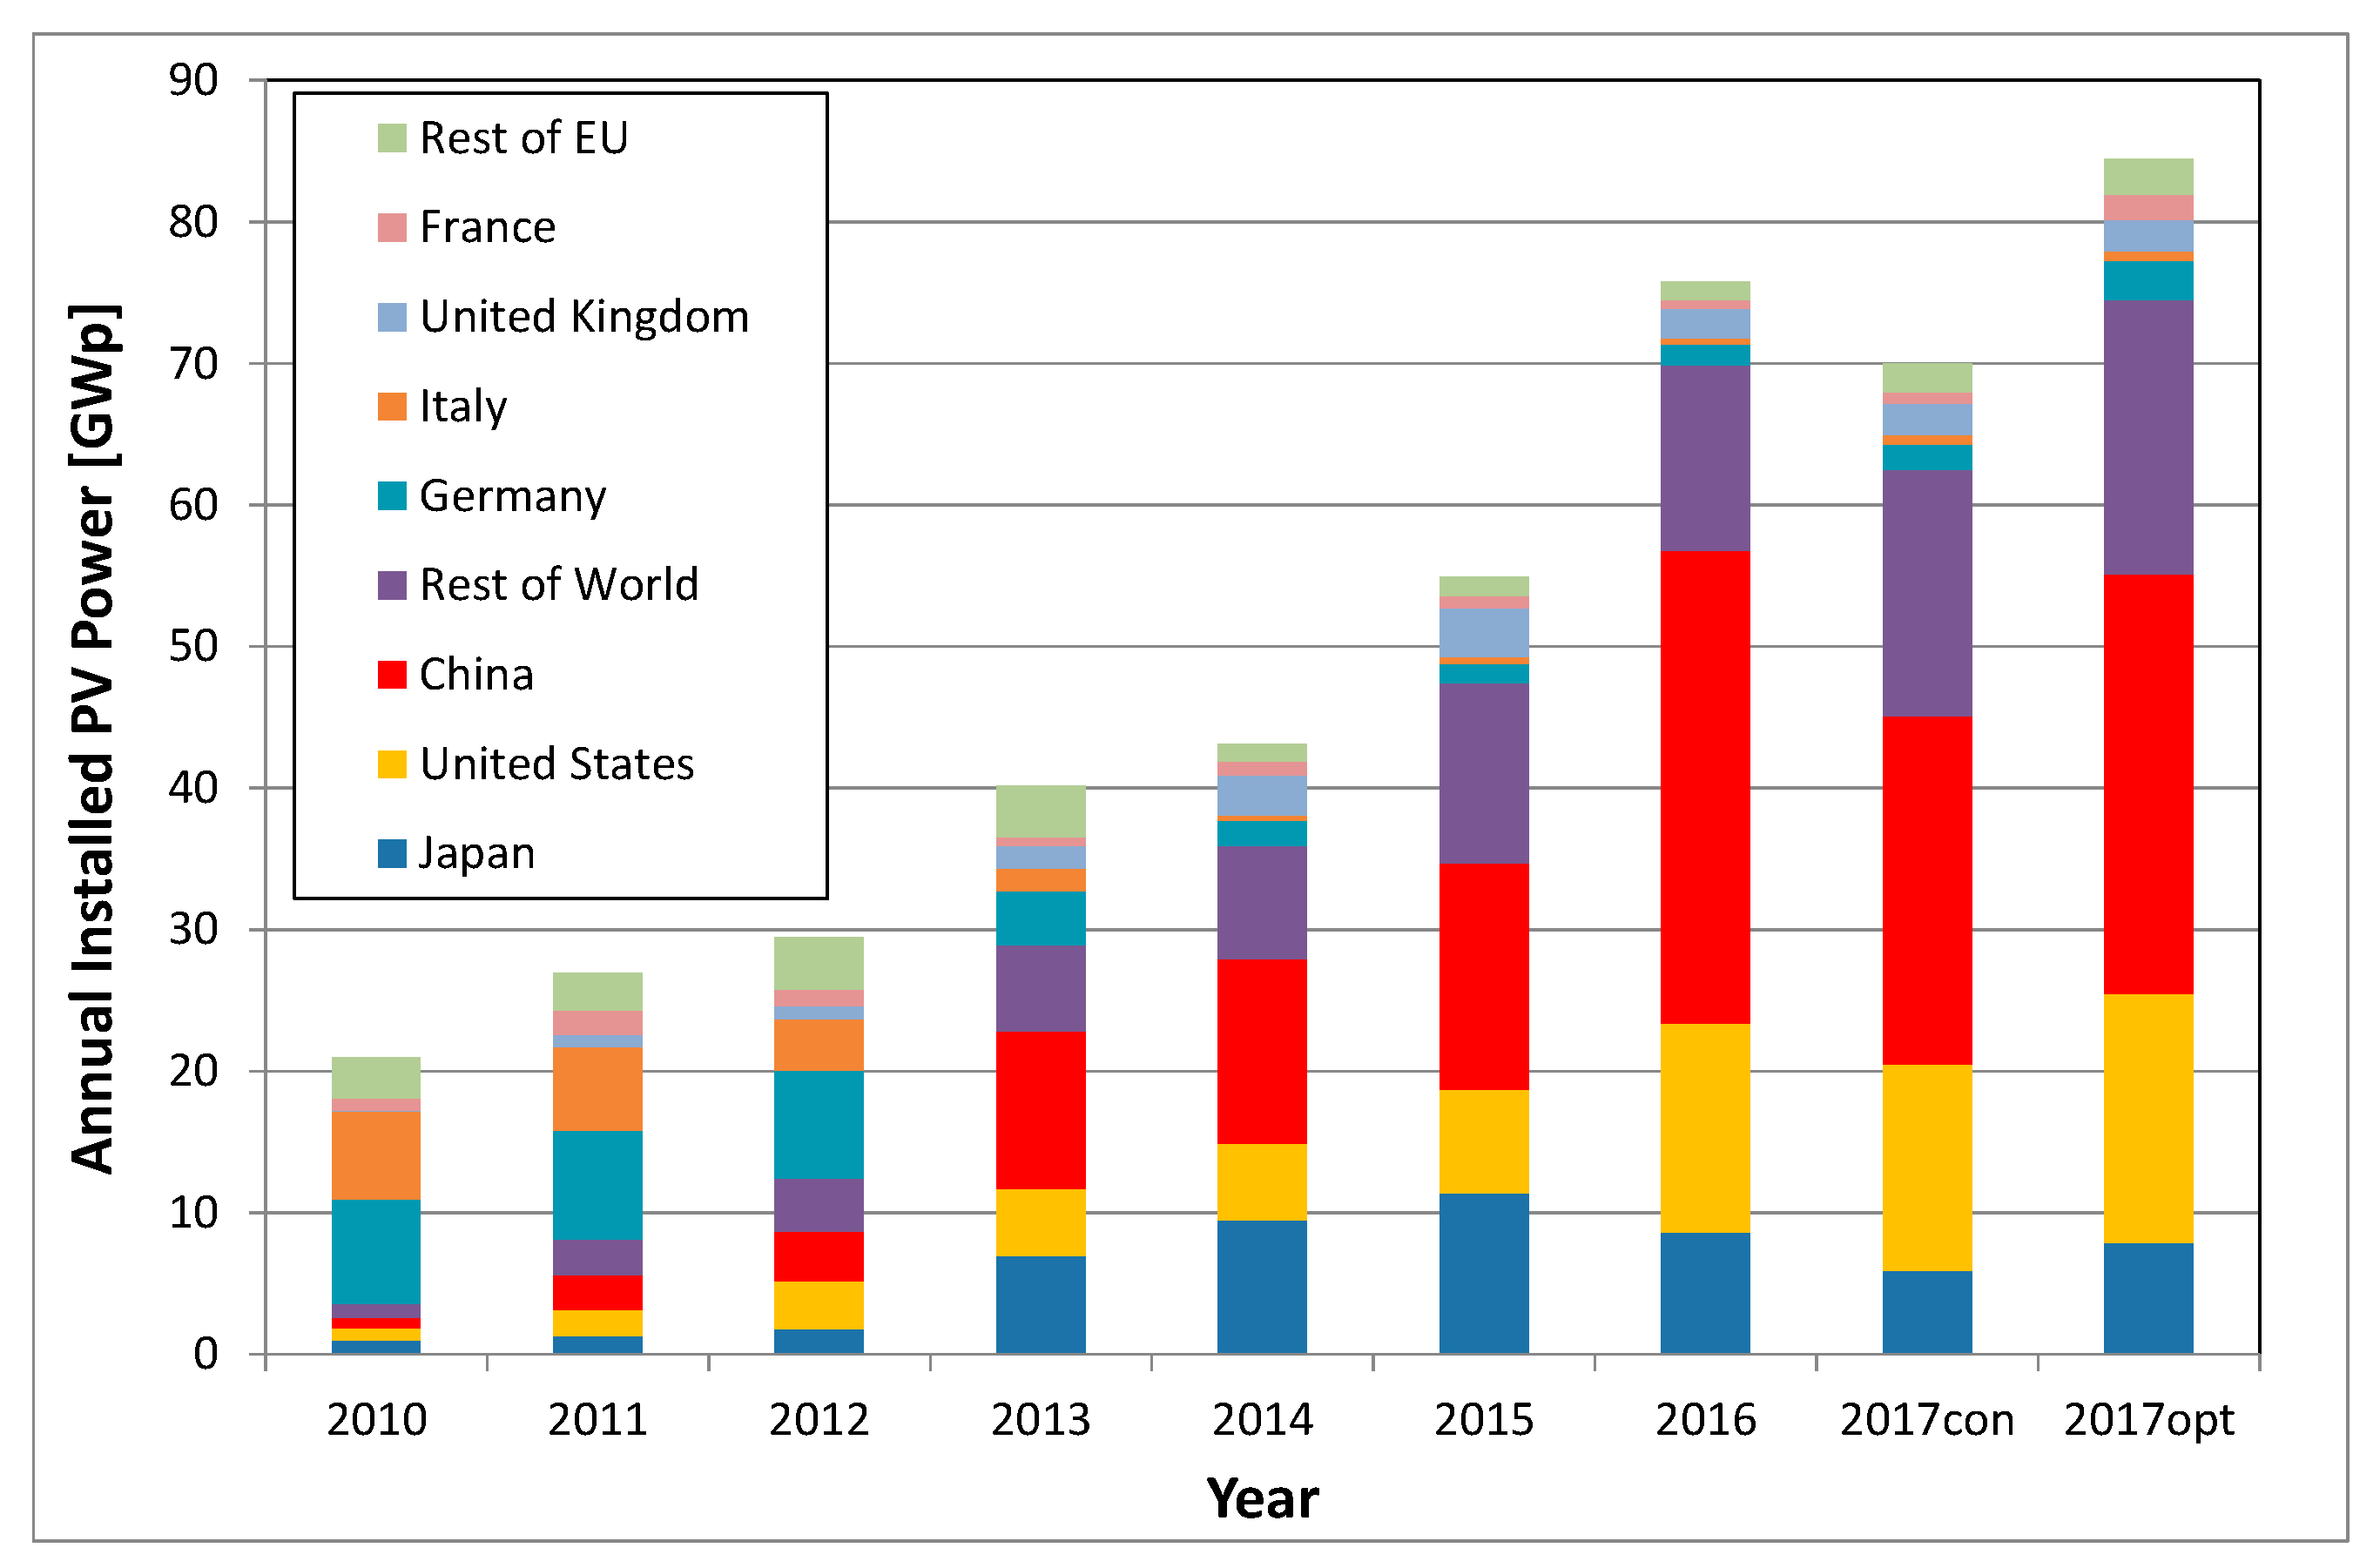
Despite a decline of about 30% in total global investment in solar energy from USD 156.7 billion in 2015 to 112.4 in 2016, the capacity of new installed PV systems increased by almost 50% to about 75 GW (Figure 2).
Market predictions for the 2017 PV market vary between 70 GW and 82 GW [13,14,15] with a consensus value in the mind 70 GW range, which is exceeding even the accelerated case scenario in the IEA Renewable Energy Medium-Term Market Report 2016 [16]. For 2018 to 2020, analysts expect a further increase, mainly driven by Asia and new markets in South America and Africa.
This represents mostly the grid-connected photovoltaic market. To what extent the off-grid and consumer product markets are included is not clear, but it is believed that a substantial part of these markets are not accounted for as it is very difficult to track them. However, with increasing market size, these segments become smaller and smaller in percentage terms.
Uncertainties in Market Statistics:
  • Not all countries report standard nominal power capacity for solar PV systems (DC—Wp under standard test conditions), but especially for larger scale system the utility peak AC capacity relevant for the transmission operator.
  • Some statistics only count the capacity which is actually connected or commissioned in the respective year for the annual statistics, irrespectively of when it was actually installed. This can lead to short term differences in which year the installations are counted. This can lead to differences in the annual statistics, but levels out in the long-run, if no double counting occurs. e.g.,:
    (1)
    In Italy, about 3.5 GW of solar PV systems were reported under the second ‘conto energia’ and installed in 2010, but only connected in 2011.
    (2)
    The construction period of some large solar farms spread over two or more years. Depending on the regulations—whether or not the installation can be connected to the grid in phases and whether or not it can be commissioned in phases, the capacity count is different.
  • Some countries do not have official statistics on the capacity of solar PV system installations or sales statistics of the relevant components.
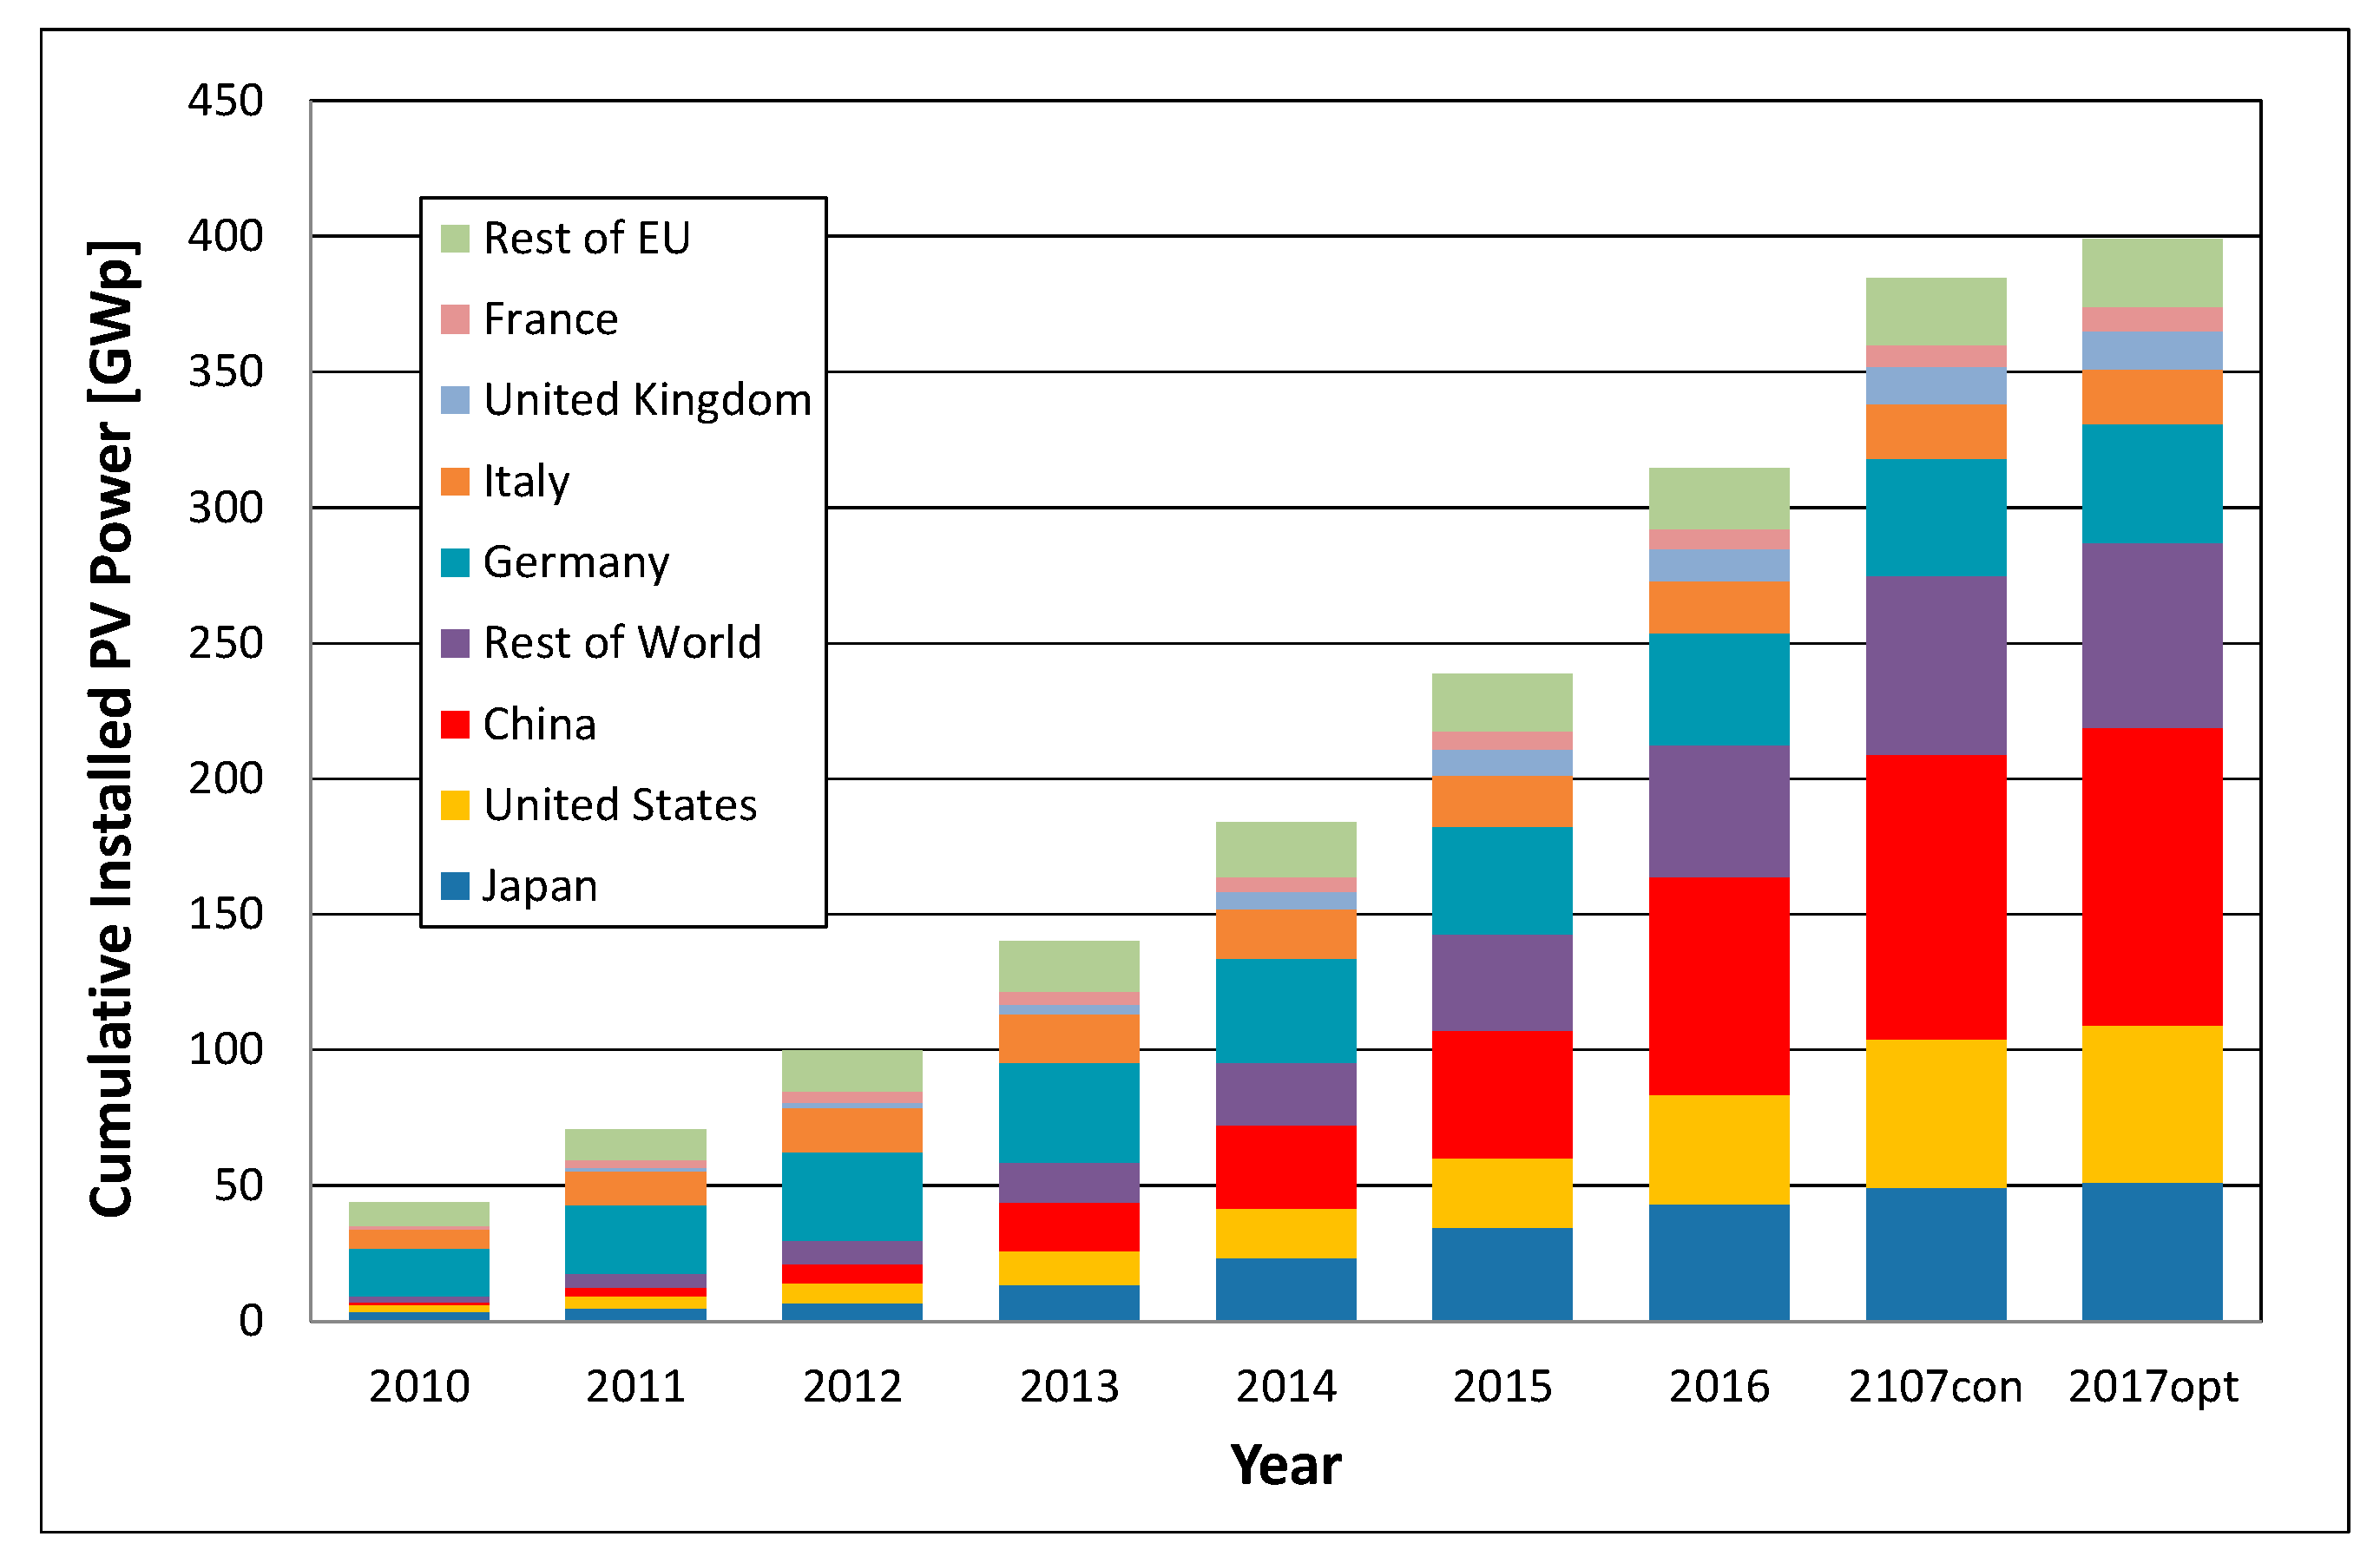
With a cumulative installed capacity 102 GW, the European Union contributes about one-third to the world-wide total 312 GW solar photovoltaic electricity generation capacity at the end of 2016 (Figure 3).
The Asia & Pacific Region saw again an acceleration of photovoltaic electricity system installations driven by China, Japan, and India. In addition, countries such as the Gulf States, Indonesia, Malaysia, Pakistan, South Korea, Taiwan, Thailand, the Philippines, and Vietnam continue a very positive upward trend, thanks to increasing governmental commitment towards the promotion of solar energy, the creation of sustainable cities and the substantial decrease of PV system prices.
In 2016 about 50 GW of new PV electricity generation systems were installed in the region a more than four-fold increase compared to the 8.2 GW in 2012. The largest market was China with 34 to 38 GW (34.5 GW were connected to the grid) followed by Japan with over 8.5 GW and India with about 4 GW. For 2017, a moderate market increase could be possible in the optimistic scenario.
In the European Union, market conditions for photovoltaics differ substantially from country to country. This is due to different energy policies and public support programs for renewable energies and especially photovoltaics, as well as the varying grades of liberalization of domestic electricity markets [20]. After a 20-fold increase of solar photovoltaic electricity generation capacity between 2001 and 2011, the capacity of newly installed PV systems decreased continuously from the peak in 2011 with almost 19 GW of new installations to about 5.8 GW in 2016. For 2017, a moderate increase to about 6.5 to 7 GW is possible.
The legal framework for the overall increase of renewable energy sources was set with the Directive 2009/28/EC, and in their National Renewable Energy Action Plans (NREAPs), the Member States have set specific photovoltaic solar energy targets, adding up to 84.5 GW in 2020. This target was already exceeded in 2014 but no new targets for solar energy have been set yet. However, during the European Council meeting on 23–24 October 2014 the Council adopted an EU target of at least 27% for the share of renewable energy consumed in the EU in 2030. This target will be binding at EU level.
In March 2017, the European average price of a residential system was 1.14 €/Wp [11] including installation but without tax and administrative and connection costs. However, there is a wide spread in the costs of PV systems for home owners. A price survey showed that prices for installed PV systems between 1 and 10 kWp in the European Union varied from quotes below EUR 1000 per kWp to more than EUR 2600 per kWp. At the same time, different VAT rates between 0% and 25% are applied throughout the Union. Administrative and connection costs as well as fiscal and financing conditions are a further source of huge differences in the European Union. These non-technical costs vary much more within in the European Union than the solar radiation and can make PV use in sun-rich countries less attractive than in countries with average solar radiation but low non-technical costs.
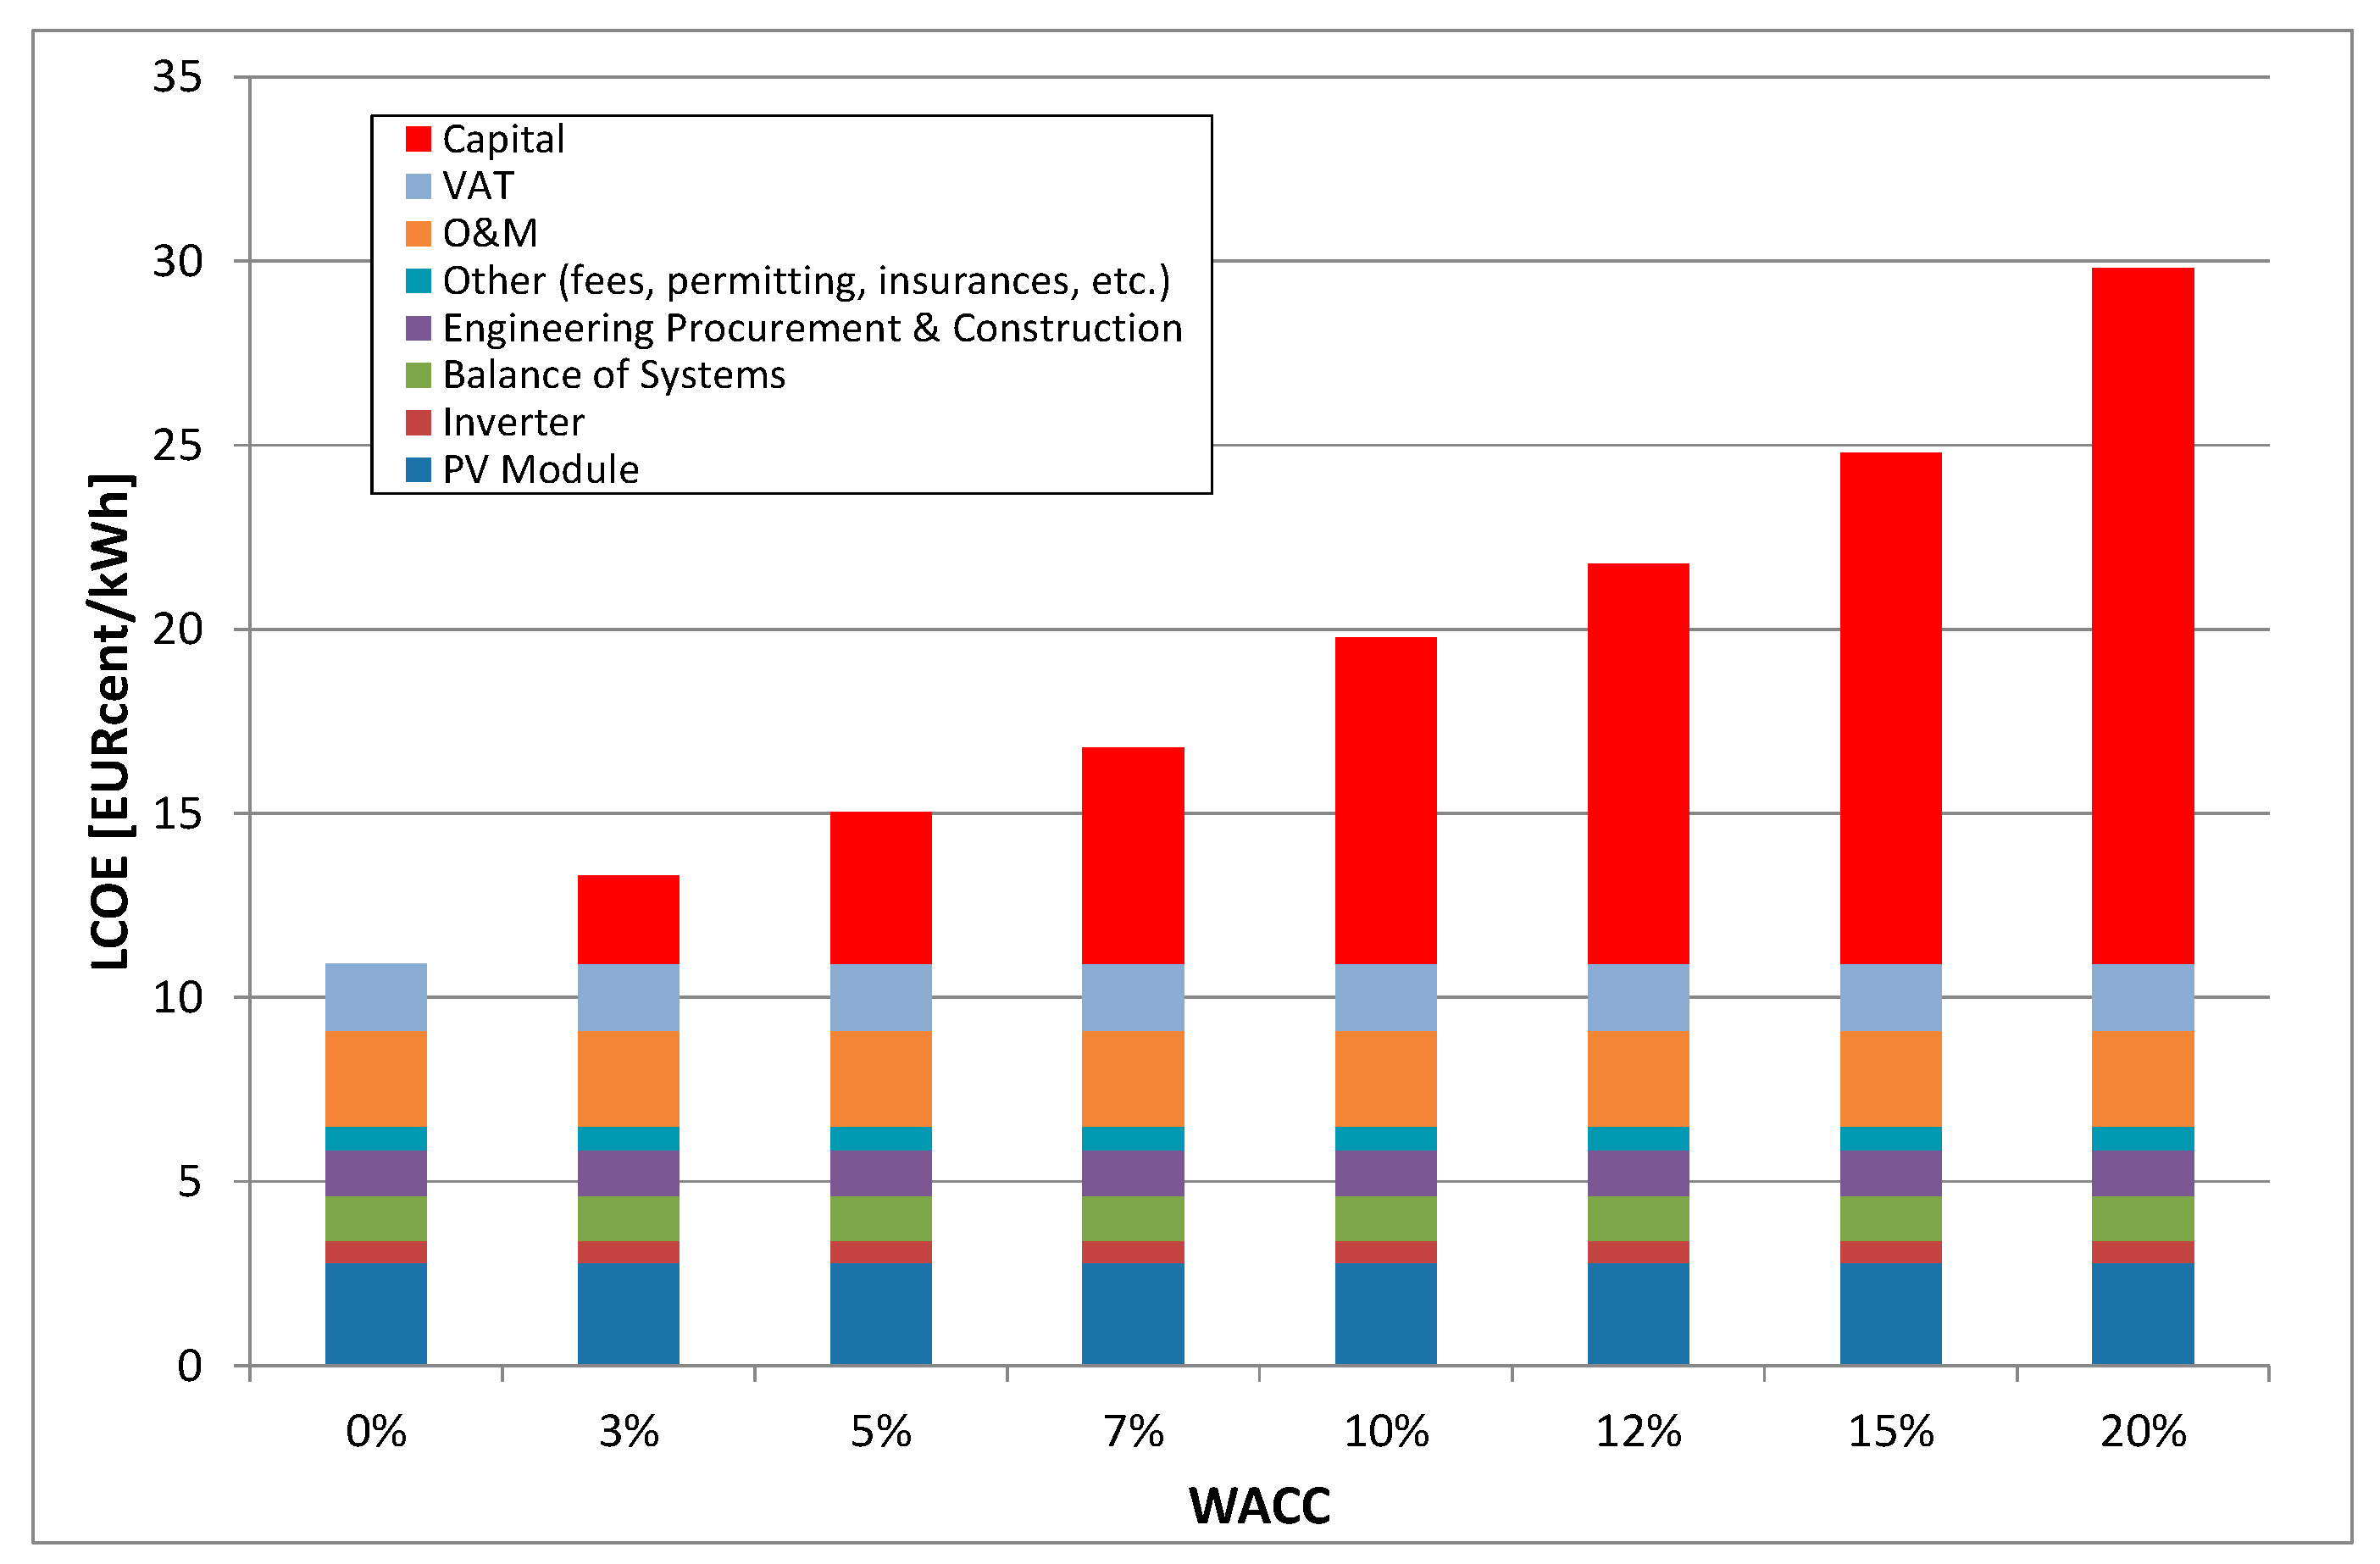
Already at 4% return on investment (ROI) the financing costs are the largest single cost factor. The influence of financing costs is shown in Figure 4 and Figure 5. Therefore, reasonable financing is key to low-cost photovoltaic electricity.
In North America, in 2016, the new installed PV capacity in the U.S.A. almost doubled to 14.8 GW and reached a cumulative PV capacity of 40.8 GW. Utility PV installations again were the largest segment with about two-thirds of new installed capacity in 2016. For 2017, a flat or slightly decreasing trend is expected. During Q1 of 2016, about 4 GW of contracted PPA projects were under construction and the total PV project pipeline in the U.S.A. is now in the range of 53 GW at different development and planning stages. For the first time, solar PV electricity generation capacity added the largest share of new nominal capacity with a 39% share.
Many state and federal policies and programs exist and one of the most comprehensive databases about the different support schemes in the US is maintained by the Solar Centre of the State University of North Carolina. The Database of State Incentives for Renewable Energy (DSIRE) is a comprehensive source of information on state, local, utility, and selected federal incentives that promote renewable energy. All the different support schemes are described therein and it is highly recommended to visit the DSIRE web-site http://www.dsireusa.org/ and the corresponding interactive tables and maps for details.

4. Discussion

The photovoltaic industry has changed dramatically over the last few years. Since 1990, PV production has increased by three orders of magnitude, from 46 MW to almost 80 GW in 2016. This corresponds to a CAGR of a little more than 33% over the last 26 years. Since 2006, China has become the major manufacturing place followed by Taiwan and Malaysia. A new trend started to emerge in 2014 when increased investments started to increase solar cell and module production capacities in other Asian countries like India, Thailand, the Philippines, or Vietnam. Another development, which allowed large solar companies to boost their shipment volumes without increase of own manufacturing capacity, was the rapid increase of original equipment manufacturing (OEM) since 2011.
This snapshot only gives figures for solar cell manufacturing and PV system deployment, but when looking at photovoltaics as a whole, it is important to remember that the PV industry is more than just cell and module manufacturing. To grasp the whole picture, one has to look at the whole PV value chain upstream and downstream, but this is beyond the scope of this paper to give a timely overview about solar cell manufacturing and PV system deployment.
Despite a more than 30% decrease in new investments in PV electricity systems between 2015 and 2016, the capacity of new installed systems increased by almost 50%. This development was made possible by the significant declining PV system costs in all markets. Technology advances will continue to enable a further cost reduction on the PV system hardware side, while increasing competition in retail markets and the introduction of standardized administrative procedures is lowering the non-technical “soft costs”.
According to investment analysts and industry prognoses, solar energy will continue to grow at high rates in the coming years. The different PV industry associations—as well as Greenpeace [21], Bloomber New Energy Finance [22], and the International Energy Agency [23]—have developed new scenarios for the future growth of PV systems. Table 1 shows the different scenarios of the Greenpeace study, BNEF, and the 2016 IEA World Energy Outlook scenarios. With forecasted new installations between 251 and 270 GW from 2017 to 2019 and annual installations to exceed 100 GW by 2020, even the Greenpeace advanced revolution scenario for 2020 no longer seems like fiction [21].

5. Conclusions

Over the last one and a half decades, the growth of photovoltaic electricity generation has always been faster than predicted. There are a number of reasons for this development, which are a combination of policy-driven demand creation, massive manufacturing capacity investments, and faster than expected technology progress.
Despite the current very positive trends, one should remember that the optimistic solar PV scenarios shown in Table 1 will only be possible if the technology progress in solar cell and module manufacturing are continuously improved. Novel design concepts are needed for a transformation of the PV industry to a satisfy a multi 100 GW annual market, since the current technology’s demand for certain materials—e.g., silver—could significantly increase the economic price of this resource within the next decades. The scientific community and PV industry is already very actively searching for alternatives to avoid such bottlenecks.
At the end of 2016, more than 310 GW of cumulative photovoltaic electricity generation capacity had been installed worldwide. With this capacity, photovoltaics could contribute about 1.7% of the worldwide electricity demand and is still a small contributor to the electricity supply. However, different to the past, its importance for our future energy mix is now acknowledged.

Conflicts of Interest

The author declares no conflict of interest.

References

  1. United Nations. Reference: C.N.735.2016.TREATIES-XXVII.7.d (Depositary Notification). Available online: https://treaties.un.org/doc/Publication/CN/2016/CN.735.2016-Eng.pdf (accessed on 28 April 2017).
  2. Watson, R.; Carraro, C.; Canziani, P.; Nakicenovic, N.J.; McCarthy, J.; Goldemberg, J.; Hisas, L. The Truth about Climate Change; Fundación Ecológica Universal (FEU): Buenos Aires, Argentina, 2016; ISBN 978-0-9831909-1-2. [Google Scholar]
  3. International Energy Agency. Key World Energy Statistics 2016; International Energy Agency: Paris, France, 2016. [Google Scholar]
  4. International Energy Agency. Emissions per kWh of Electricity and Heat Output (Edition 2016). Available online: http://dx.doi.org/10.1787/3cfe0c04-en (accessed on 28 April 2017).
  5. PV Activities in Japan. RTS Corporation. Available online: www.rts-pv.com (accessed on 28 April 2017).
  6. PV News. Greentech Media: Boston, MA, USA, 2014. ISSN 0739-4829. Available online: https://www.greentechmedia.com/research/pv-news (accessed on 28 April 2017).
  7. Wesoff, E.; Greentech Media. The Mercifully Short List of Fallen Solar Companies—2015 Edition. Available online: http://www.greentechmedia.com/articles/read/The-Mercifully-Short-List-of-Fallen-Solar-Companies-2015-Edition (accessed on 28 April 2017).
  8. Goodrich, A.; James, T.; Woodhouse, M. Solar PV Manufacturing Cost Analysis: U.S. Competitiveness in a Global Industry. Available online: http://www.nrel.gov/docs/fy12osti/53938.pdf (accessed on 28 April 2017).
  9. Powell, D.M.; Fu, R.; Horowitz, K.; Basore, P.A.; Woodhouse, M.; Buonassisi, T. The capital intensity of photovoltaics manufacturing: barrier to scale and opportunity for innovation. Energy Environ. Sci. 2015, 8, 3395. [Google Scholar] [CrossRef]
  10. Bloomberg New Energy Finance. Analyst Reaction, Suntech Is Up for Sale again. Available online: www.bnef.com (accessed on 28 April 2017).
  11. PV Insights. Available online: http://pvinsights.com/ (accessed on 28 April 2017).
  12. Bloomberg New Energy Finance. H2 2016 Global LCOE Outlook. Available online: www.bnef.com (accessed on 28 April 2017).
  13. Mercom Capital, Mercom’s Global Solar Forecast November 2016. Available online: http://mercomcapital.com/mercom-forecasts-76-gw-in-global-solar-installations-in-2016-a-48-yoy-increase-over-2015 (accessed on 28 April 2017).
  14. Bloomberg New Energy Finance. Q1 2017 Global PV Market Outlook, 17 February 2017. Available online: www.bnef.com (accessed on 28 April 2017).
  15. IHS PV Demand Tracker Q4 2016. Available online: https://technology.ihs.com/572650/pv-demand-market-tracker-q4-2016 (accessed on 28 April 2017).
  16. International Energy Agency. Medium-Term Renewable Energy Market Report 2016—Market Trends and Projections to 2021; International Energy Agency: Paris, France, 2016; ISBN 978-92-64-26497-7. Available online: https://www.iea.org/bookshop/734-Medium-Term_Renewable_Energy_Market_Report_2016 (accessed on 28 April 2017).
  17. European Photovoltaic Industry Association. Global Market Outlook for Photovoltaics. Available online: www.solarpowereurope.org (accessed on 28 April 2017).
  18. IEA PVPS. Snapshots of Global PV Markets and Trend Reports. Available online: http://www.iea-pvps.org (accessed on 28 April 2017).
  19. Systèmes Solaires, le Journal du Photovoltaique, Photovoltaic Energy Barometer. Available online: www.energies-renouvelables.org (accessed on 28 April 2017).
  20. Jäger-Waldau, A. PV Status Report 2016. Available online: http://publications.jrc.ec.europa.eu/repository/bitstream/JRC103426/ldna28159enn.pdf (accessed on 28 April 2017).
  21. Greenpeace International. Energy Revolution, 5th Edition 2015 World Energy Scenario, October 2015. Available online: http://www.greenpeace.org/international/en/publications/Campaign-reports/Climate-Reports/Energy-Revolution-2015 (accessed on 28 April 2017).
  22. BNEF. New Energy Outlook, Solar. Available online: www.bnef.com (accessed on 28 April 2017).
  23. International Energy Agency. World Energy Outlook 2016; International Energy Agency: Paris, France, 2016; Available online: http://www.iea.org/newsroom/news/2016/november/world-energy-outlook-2016.html (accessed on 28 April 2017).
Figure 1. World PV Cell/Module Production from 2005 to 2017 (data source: PV Activities in Japan [5], PV News [6] and own analysis).
Sustainability 09 00783 g001
Figure 2. Annual photovoltaic installations from 2010 to 2017 (data source: [17,18,19] and own analysis).
Sustainability 09 00783 g002
Figure 3. Cumulative Photovoltaic Installations from 2010 to 2017 (data source: [17,18,19] and own analysis).
Sustainability 09 00783 g003
Figure 4. Influence of WACC on LCOE. (LCOE of PV-generated electricity for residential systems with a system price of 1300 EUR/kWp, 20% VAT, 2% O&M cost, an annual generation of 1000 kWh/kWp/year and a financial lifetime of 20 years).
Sustainability 09 00783 g004
Figure 5. Influence of WACC on LCOE. (LCOE of PV-generated electricity for residential systems with a system price of 1300 EUR/kWp, 20% VAT, 2% O&M cost, an annual generation of 1300 kWh/kWp/year and a financial lifetime of 20 years).
Sustainability 09 00783 g005
Table 1. Evolution of the cumulative solar electrical capacities until 2040 [21,22,23].
Year2016
[GW]
2020
[GW]
2025
[GW]
2030
[GW]
2040
[GW]
Actual Installations312
Greenpeace
(reference scenario)
332413494635
Greenpeace
(advanced [r]evolution scenario)
844200037256678
BNEF New Energy Outlook 578104618313917
IEA New Policy Scenario 2016 4817159491405
IEA 450 ppm Scenario 2016 * 51781412782108
* 2025 value is extrapolated, as only 2020 and 2030 values are given.

