Article

Objective Building Energy Performance Benchmarking Using Data Envelopment Analysis and Monte Carlo Sampling

1
Convergence Laboratory, KT Institute of Convergence Technology, Seoul 06763, Korea
2
School of Civil, Architectural Engineering and Landscape Architecture, Sungkyunkwan University, Suwon 16419, Gyeonggi, Korea
*
Author to whom correspondence should be addressed.
Sustainability 2017, 9(5), 780; https://doi.org/10.3390/su9050780
Submission received: 10 April 2017 / Revised: 26 April 2017 / Accepted: 26 April 2017 / Published: 9 May 2017
(This article belongs to the Section Sustainable Engineering and Science)

Abstract

:
An objective measure of building energy performance is crucial for performance assessment and rational decision making on energy retrofits and policies of existing buildings. One of the most popular measures of building energy performance benchmarking is Energy Use Intensity (EUI, kwh/m2). While EUI is simple to understand, it only represents the amount of consumed energy per unit floor area rather than the real performance of a building. In other words, it cannot take into account building services such as operation hours, comfortable environment, etc. EUI is often misinterpreted by assuming that a lower EUI for a building implies better energy performance, which may not actually be the case if many of the building services are not considered. In order to overcome this limitation, this paper presents Data Envelopment Analysis (DEA) coupled with Monte Carlo sampling. DEA is a data-driven and non-parametric performance measurement method. DEA can quantify the performance of a given building given multiple inputs and multiple outputs. In this study, two existing office buildings were selected. For energy performance benchmarking, 1000 virtual peer buildings were generated from a Monte Carlo sampling and then simulated using EnergyPlus. Based on a comparison between DEA-based and EUI-based benchmarking, it is shown that DEA is more performance-oriented, objective, and rational since DEA can take into account input (energy used to provide the services used in a building) and output (level of services provided by a building). It is shown that DEA can be an objective building energy benchmarking method, and can be used to identify low energy performance buildings.

1. Introduction

For the energy performance assessment of existing buildings, various benchmarking methods have been developed, such as a regression model [1,2,3,4] and a dynamic simulation model [5,6]. However, both methods require in-depth knowledge and expertise, detailed information on each building, and significant time and effort to build a reliable prediction model. The current building energy performance benchmarking approaches are hampered by a range of deficiencies such as lack of objectively quantifiable expressions of requirements and lack of proper assessment tools to ascertain expected performance [7]. Among the building energy benchmarking methods, the Energy Use Intensity (EUI) method, defined as the energy consumption per unit floor area, has been widely used [8]. EUI is straightforward and easy to understand, but it only represents the amount of energy consumption, not the energy performance of a building. It does not calculate the degree to which a building serves its occupants and the service levels of a building (e.g., thermal comfort, operation hours). Therefore, EUI is at best a rough surrogate for determining the energy efficiency of buildings and should not be regarded as a performance indicator [9].
In engineering disciplines, performance is defined as the ratio of output to input. The input is a resource used to generate the output, e.g., a product or service. High performance implies either that more outcome is obtained when resources are equally used or that fewer resources are used for generating an equal outcome. However, the EUI only deals with the input (energy consumption) and does not have any output-related variables. To benchmark the building energy performance, both multiple inputs and outputs should be taken into account because the energy consumption (input) of a building is used for providing building services (output).
Case #1 in Figure 1 shows a situation in which a reduction of energy consumption is induced by encouraging the use of stairs instead of elevators [10]. A building such as Case #1 is likely to consume far less energy and be regarded as a high performance building.
Case #2 illustrates two thermally identical buildings with equal envelopes and HVAC (Heating, Ventilation and Air conditioning) systems but different operation hours. Eighteen rooms of the left building (marked in yellow) are being occupied and air-conditioned until 9 p.m., while five rooms of the right building are being used until 9 p.m. If the two buildings are assessed in terms of EUI, the right building will be regarded as a better thermal performance building than the left one, even though two buildings have the same thermal performance.
The last case is the opposite of Case #2. Case #3 shows two imaginary buildings with different thermal performances. The two buildings could consume the same amount of energy due to different indoor set-point temperatures, resulting in the same EUIs. When energy performance is evaluated based on EUI, the performance of the two buildings may be evaluated equally, regardless of different thermal performances (U values) of envelope and indoor thermal comfort.
To overcome this limitation, the Data Envelopment Analysis (DEA) method was employed in this study for objective building energy performance benchmarking. It was originally developed to measure the performance of a public educational program [11]. The DEA method is data-driven and non-parametric. The DEA method can handle multiple inputs and outputs without any energy model, and this makes DEA useful for the energy benchmarking of existing buildings.
Lee [12] used DEA to benchmark the energy management efficiency of government office buildings. Lee and Lee [13] evaluated the building energy efficiency as a ratio of observed and predicted energy consumption. Önüt and Soner [14] used DEA to assess the financial (or operational) efficiency of a hotel. In their study [14], the number of employees, electricity, water, and LPG (Liquefied Petroleum Gas) consumption were used as inputs, and room occupancy ratio, total annual revenues, and the annual total number of customers were used as outputs. Yu and Chan [15] studied the performance of a chiller in a building. To date, there is no complete study on objective energy performance benchmarking of a whole building in relation to a large set of peer buildings.
The goal of this study is to benchmark the energy performance of two existing office buildings using DEA and Monte Carlo sampling. Building services (occupancy density, operation time, thermal comfort, indoor air quality) were defined as outputs, and energy consumption was defined as an input. The authors generated 1000 virtual peer buildings from a Monte Carlo sampling and then simulated the generated buildings using EnergyPlus. Then, the relative energy performances of two actual office buildings were assessed.

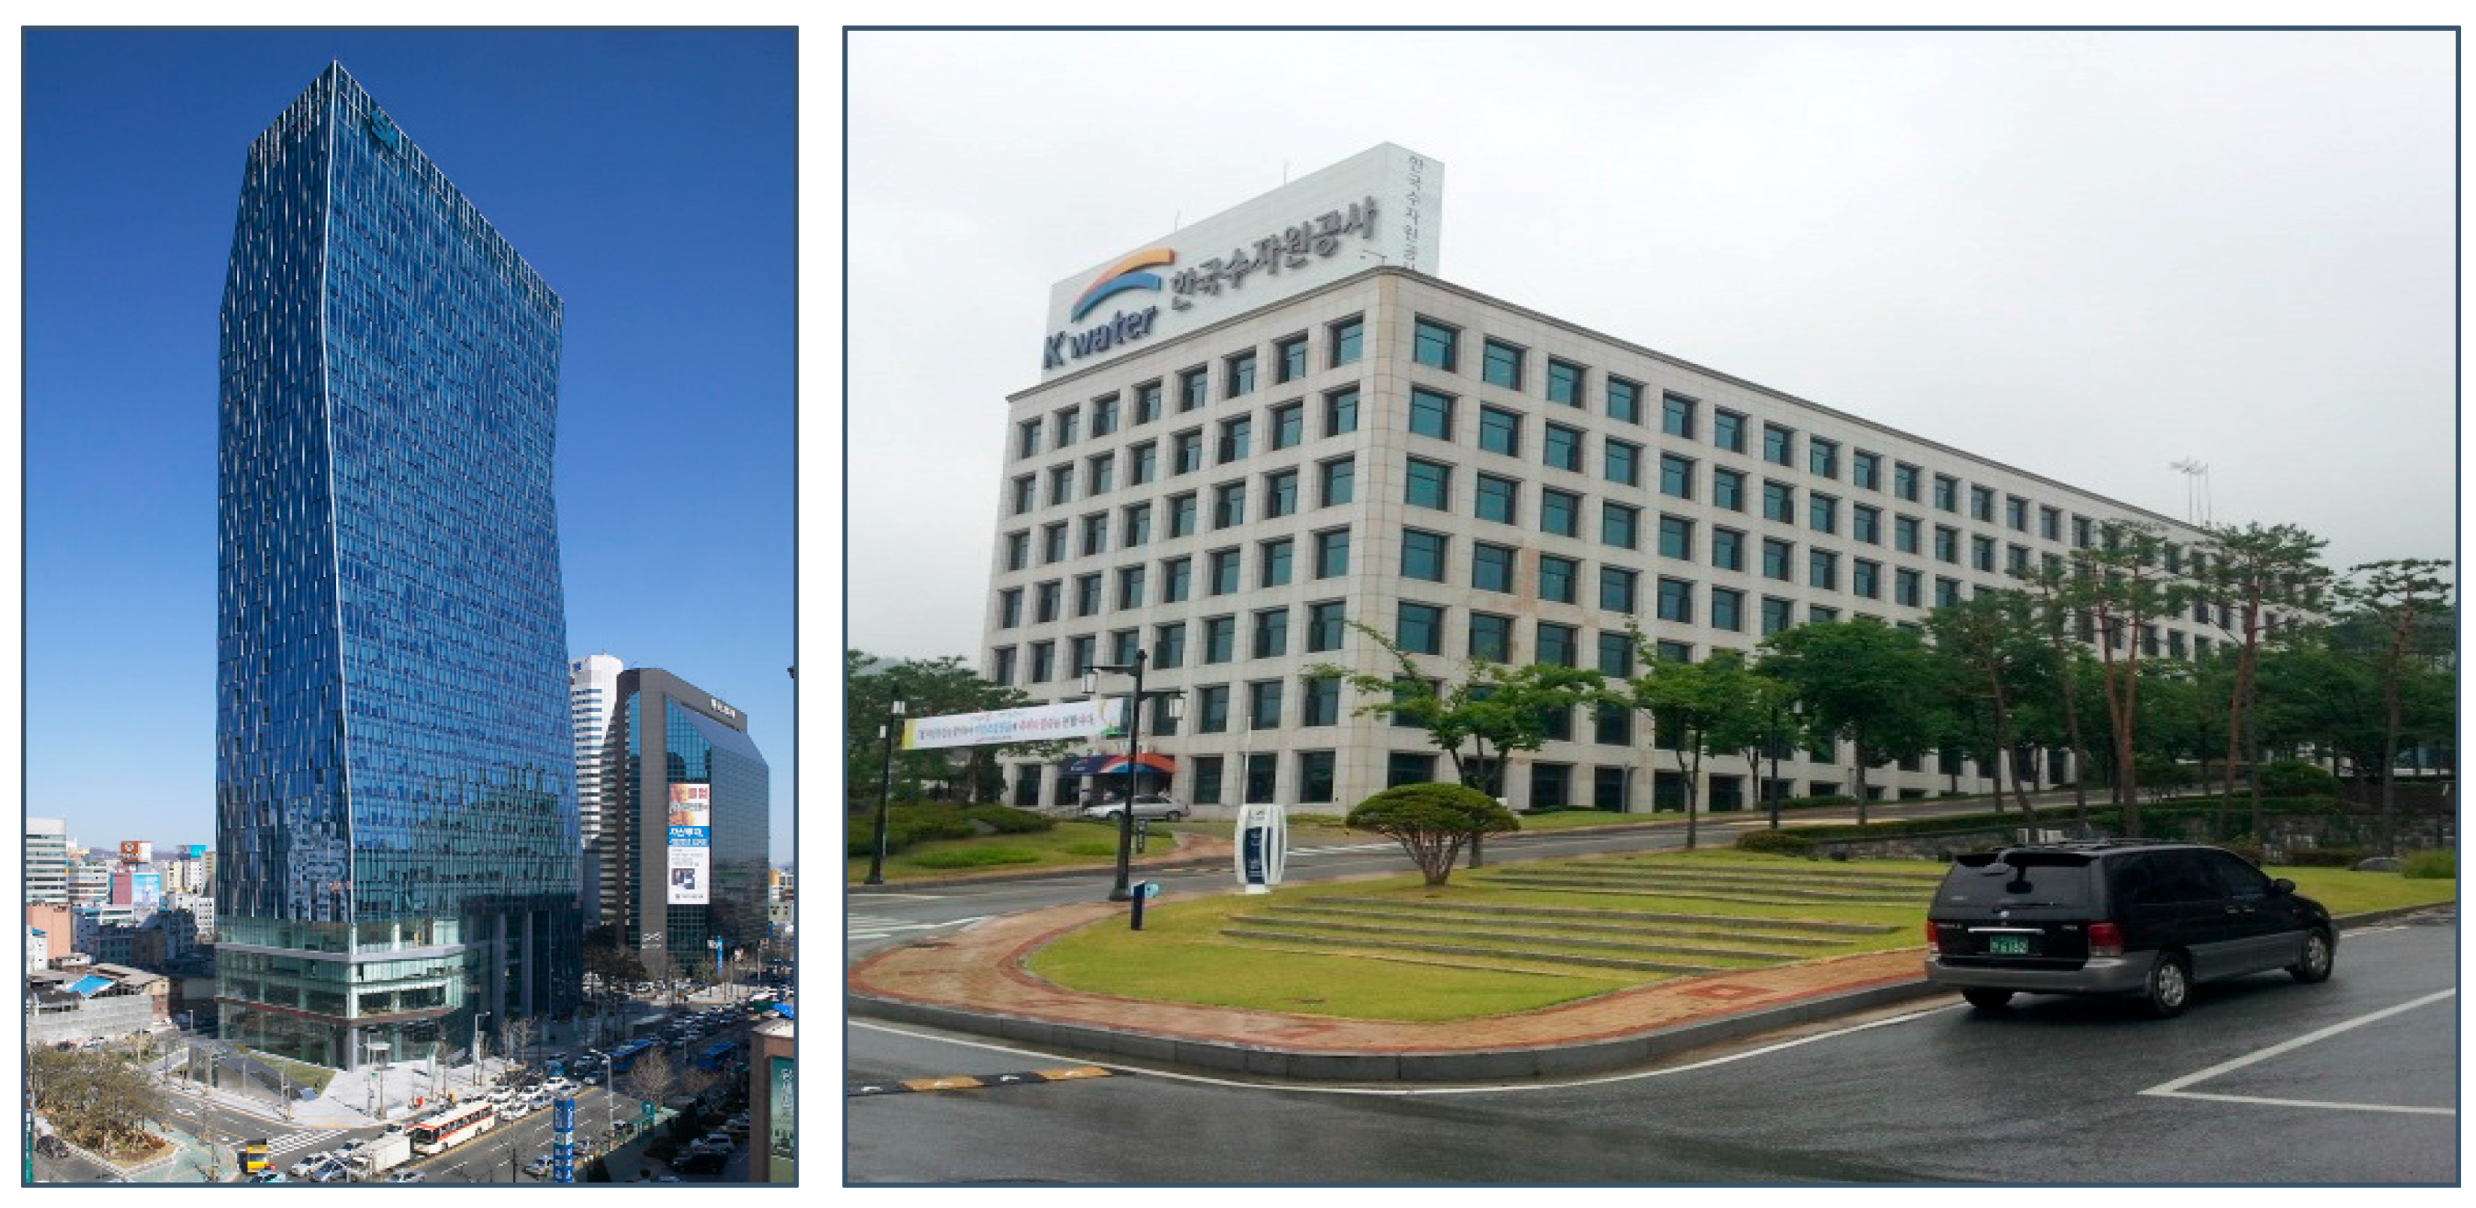
2. Case Studies: Two Office Buildings

2.1. Building A (Privately-Owned Office Building)

Building A, a typical office building, was constructed in 2004 (Figure 2) and is located in Seoul, South Korea. It consists of 33 stories above ground and six underground levels with a glass curtain wall system with a low-e double pane. The total floor area of building A is 91,830 m2 and the ratio of window to wall area is approximately 70%. Building A has several HVAC systems for various spaces including a constant air volume (CAV) system for a lobby, variable air volume (VAV) systems for interior zones of the building, and fan power units (FPUs) and fan coil units (FCUs) for perimeter zones of the building. The plant includes three steam boilers and two centrifugal chillers. The building has an ice storage system connected to two extra centrifugal chillers. A building energy management system (BEMS) was installed in the building and monitors 1692 measurement data in real time. In addition, occupancy sensors and daylight controls are used to reduce lighting energy use. Building A provides a high level of outdoor intake set at 15 L/s∙person and the indoor air temperature is set at 24 °C in summer and 22 °C in winter. Building A’s EUI is 75.6 kwh/m2.

2.2. Building B (Government-Owned Public Office Building)

Building B, located in Daejeon, South Korea, was completed in 1994 (Figure 2). The building comprises seven stories above ground and one underground level with regular 24 mm double pane windows. The total floor area of building B is 30,147 m2 and the ratio of window to wall area is approximately 70%. Building B is conditioned by two absorption chiller-heaters and one steam boiler. Due to the Korean government’s strict energy saving regulation, building B provides a thermally uncomfortable condition. For example, the indoor air temperature in summer increases up to 30 °C. In winter, a heating system begins to operate when the indoor air temperature reaches lower than 17 °C. Accordingly, building B’s EUI is 42.7 kwh/m2, far less than that of building A. Building B can be regarded as a good energy performance building, only if assessed in terms of EUI.

3. Data Envelopment Analysis and Monte Carlo Sampling

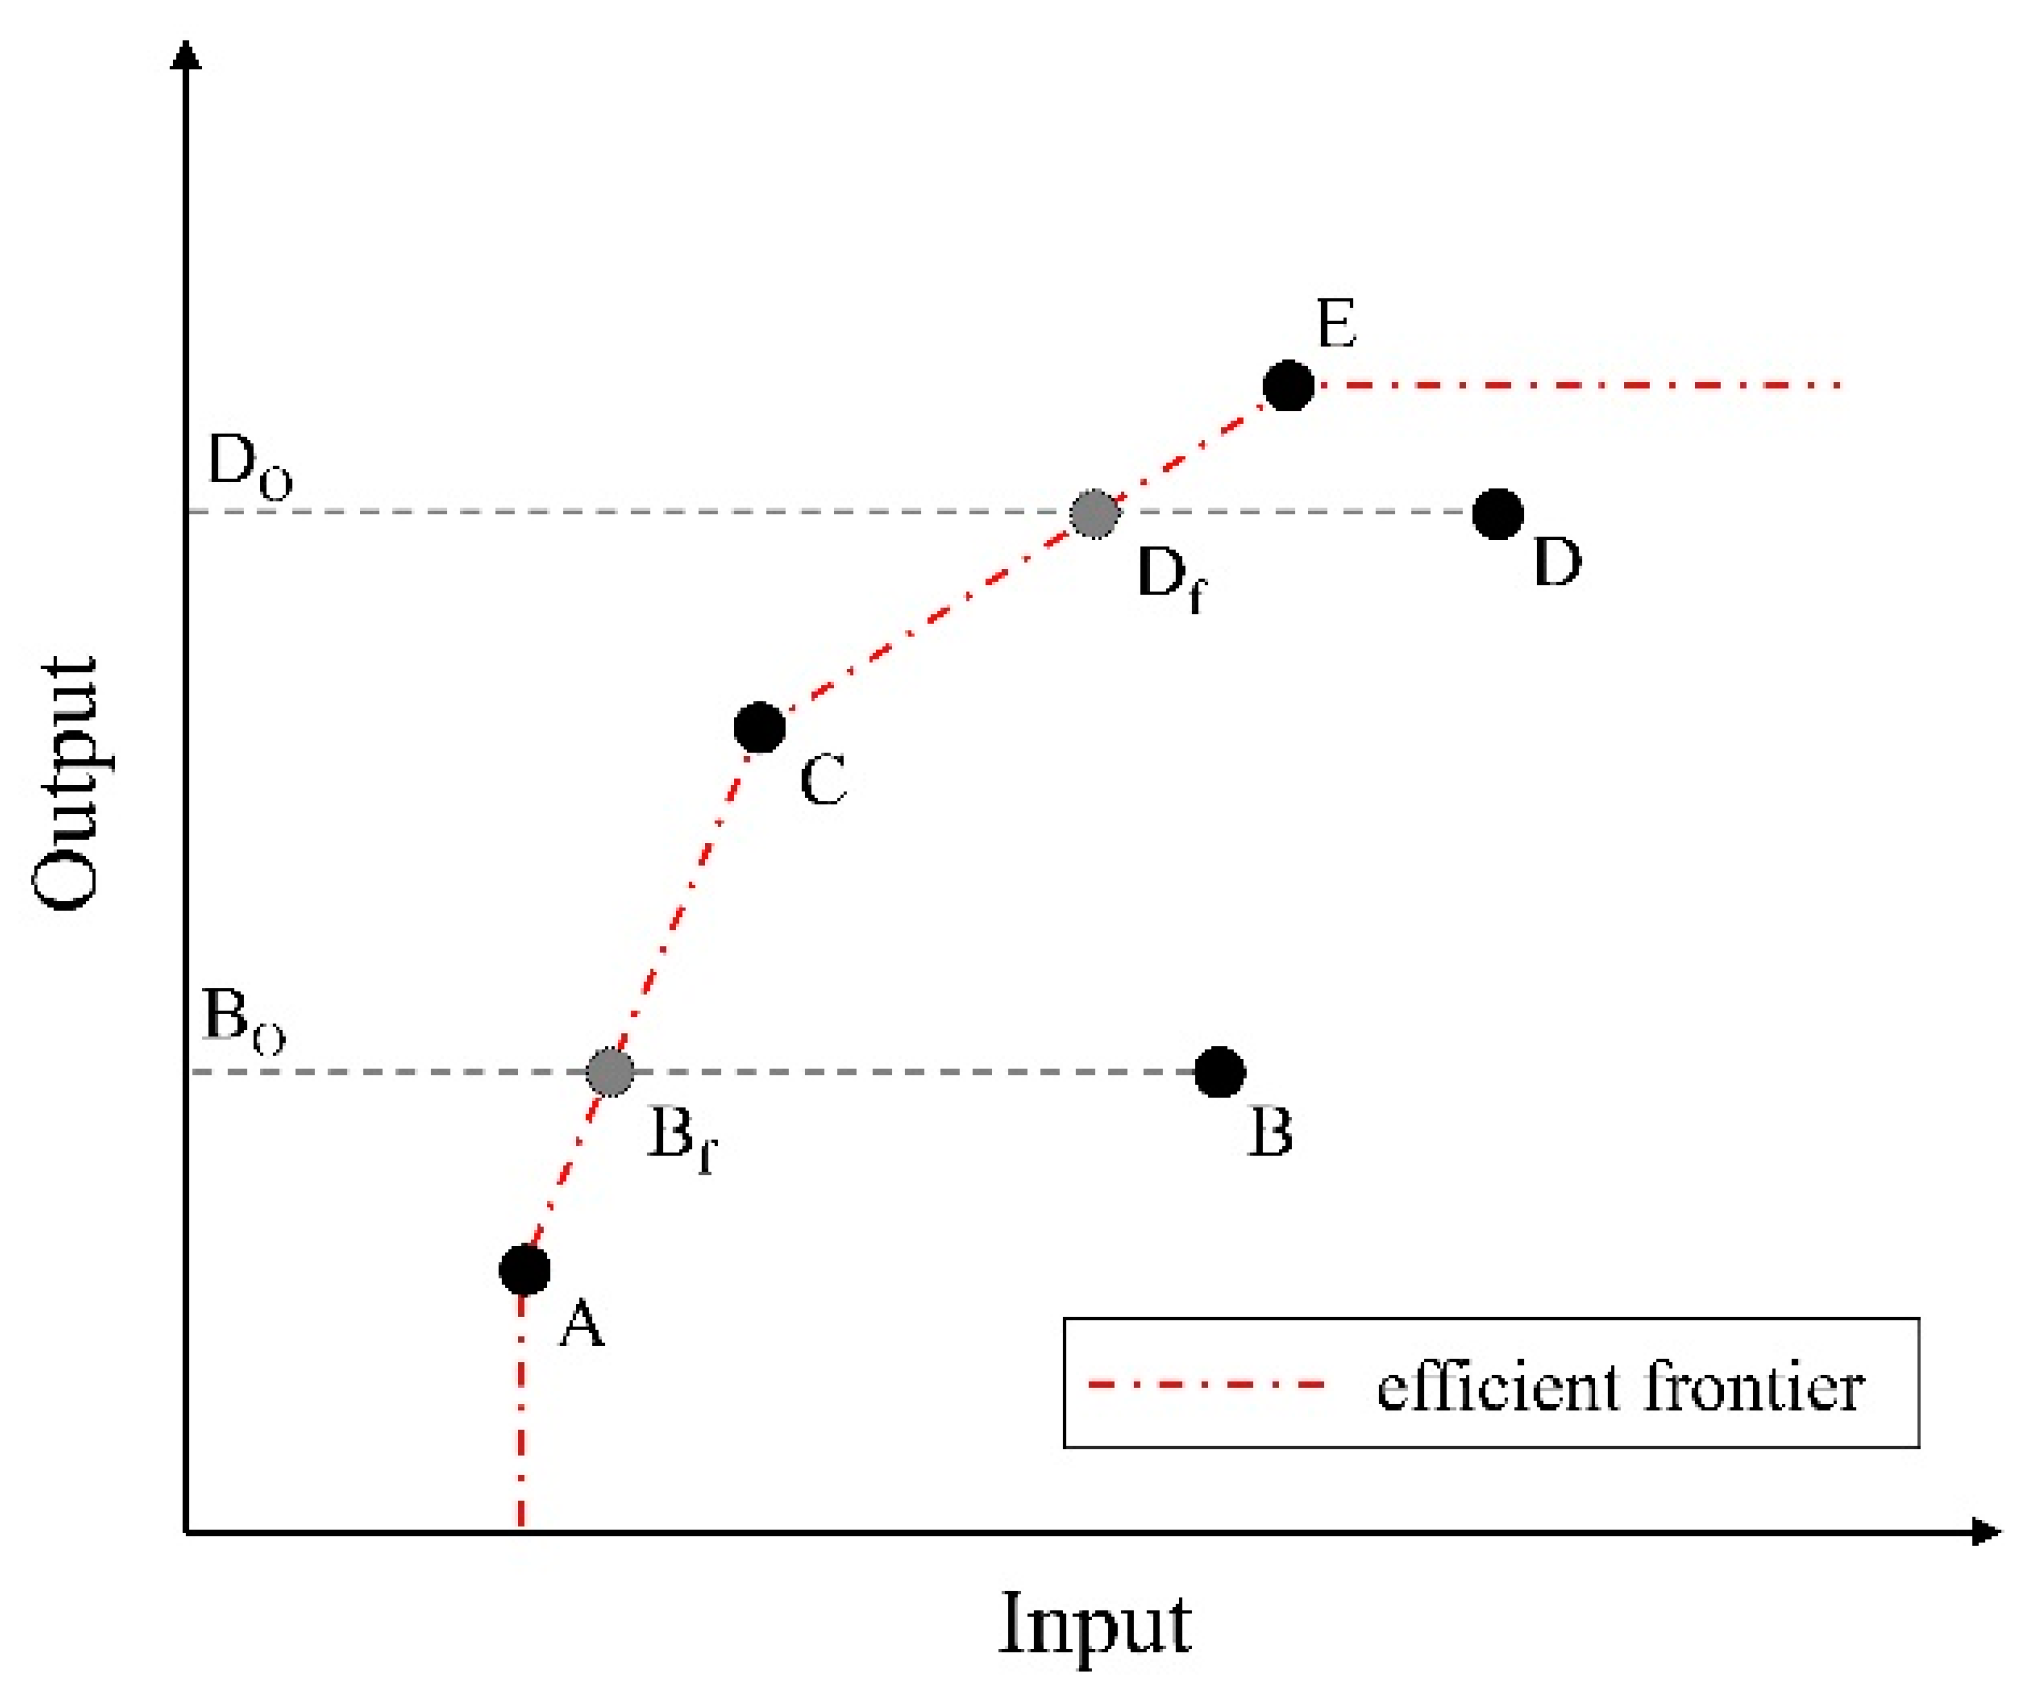
3.1. Data Envelopment Analysis (DEA)

Data Envelopment Analysis (DEA) is a multi-factor productivity analysis method for assessing a relative efficiency of decision making units (DMUs) [16]. DMUs are a homogeneous set of peer entities, which are the objects of performance evaluation. In this study, a building is defined as a DMU because it is in our interest to obtain an objective energy efficiency score of a given whole building. The DEA efficiency score is formulated as shown in Equation (1):
max v , u   θ t = i = 1 s u i y i , t ω t s . t . j = 1 m v j x j , t = 1 i = 1 s u i y i , t j = 1 m v j x j , t ω t 0 , t = 1 , 2 , , n u i , v j ε
where θ t is the DEA efficiency score of the decision making units t ( D M U t ), x is a vector of the input of DMUs, y is a vector of the output of DMUs, ν is a weight of input, u is a weight of output, m is the number of inputs, s is the number of outputs, i indicates each output, j indicates each input, t indicates a DMU under consideration, n is the number of DMUs, ε is a non-Archimedean absolute value, and ω t denotes an indicator of returns to scale.
Figure 3 shows the concept of the DEA method when a single input and a single output are used. The red dotted line passing through A, C, and E represents an efficient frontier. The black circles (A, B, C, D, and E) represent DMUs, and the grey circles (Bf and Df) represent the intersection of the lines B-Bo and D-Do with the efficient frontier. A, C, and E are defined as Pareto-efficient DMUs [17], and B and D are regarded as inefficient DMUs. When the efficient frontier is formed, then θ of the inefficient DMUs are calculated by the distance between the efficiency frontier and each DMUs. For instance, θ of B is calculated by (B − Bo/(Bf − Bo). In other words, θ represents the ratio of a present output to a maximum producible output, and ranges from 0.0 to 1.0. Therefore, 1.0 of θ means that the DMU is most efficient among peer DMUs.
The DEA method is useful to compare relative performance on multivariate problems such as building energy performance benchmarking. A notable advantage of DEA is that it can evaluate the performance of each DMU only when provided with simple data of inputs (e.g., energy use) and outputs (e.g., operation hours, occupancy density, thermal comfort, etc.). It is noteworthy that the DEA method is not intended for absolute performance assessment, but rather provides peer comparison. As benchmarking literally means relative comparison among peer entities, the DEA approach can be used for energy performance benchmarking for a large building portfolio.

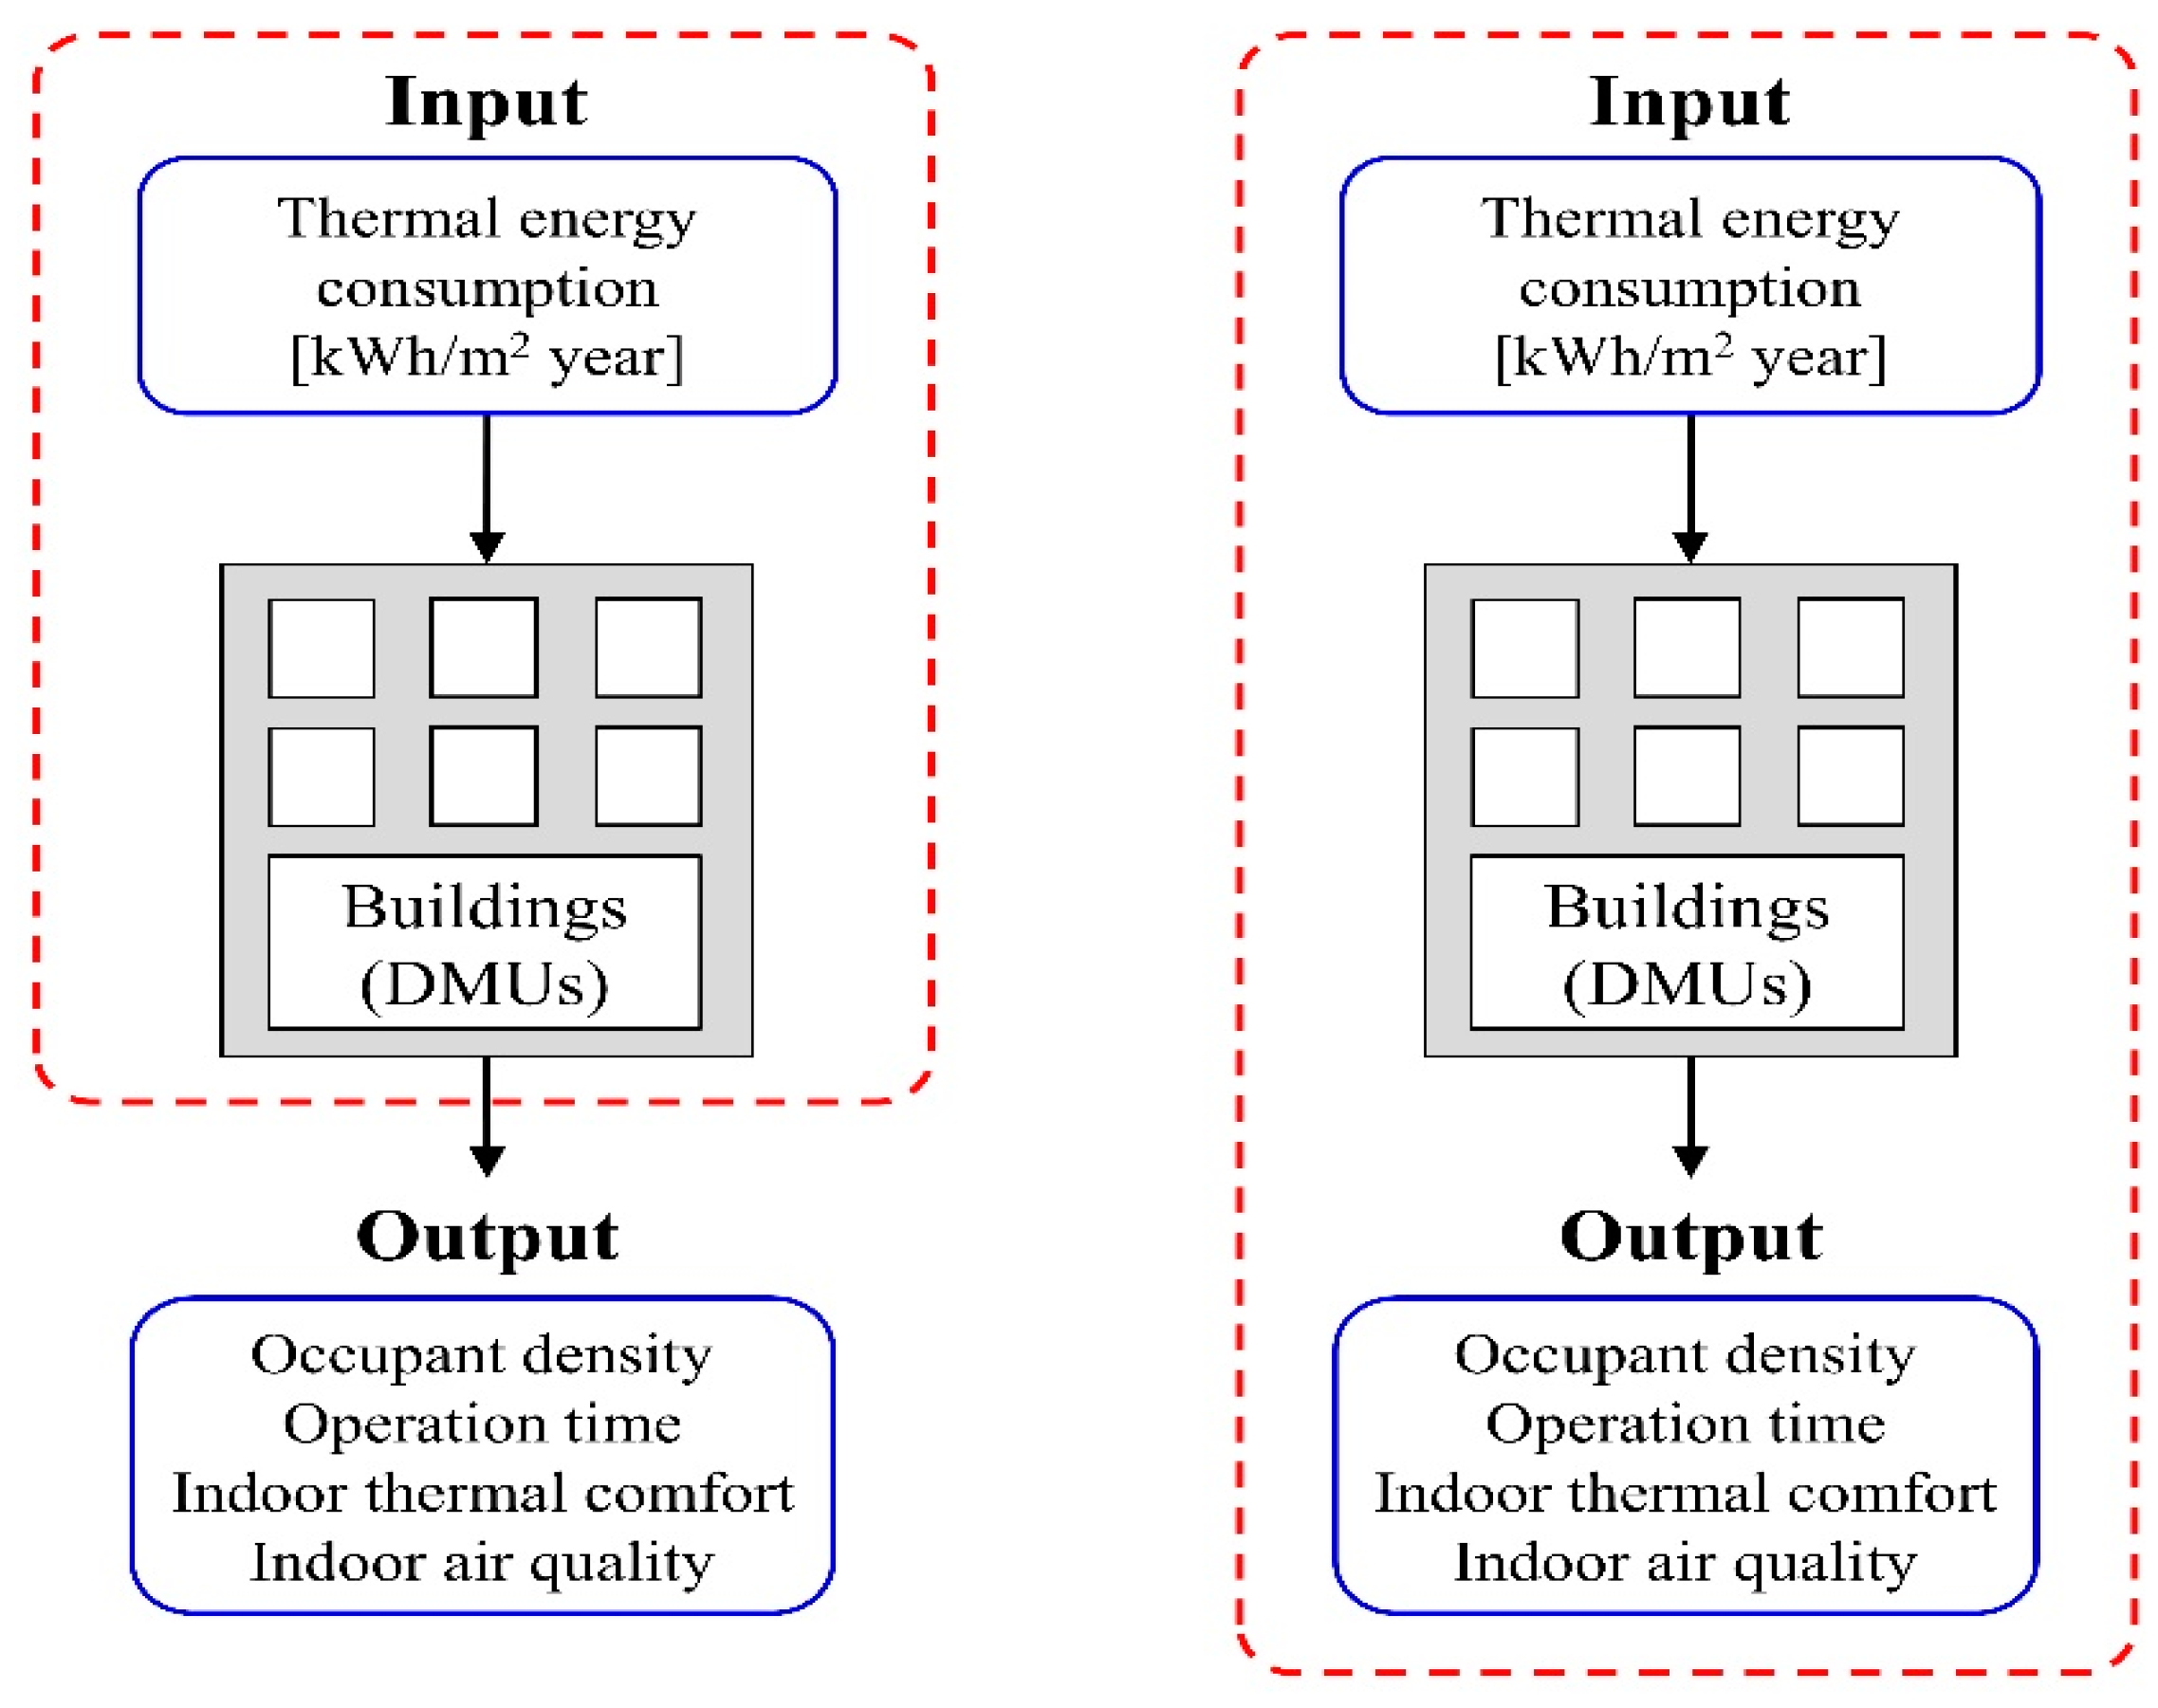
3.2. Inputs and Outputs for DEA

A key aspect of the DEA method is incorporating various factors into the problem as either input or output. Generally, input factors are selected from resources used for the DMUs, while output factors can be products or services provided by the DMUs [18]. In this study, energy consumption was selected as an input, and the services provided by a building such as occupancy density [the number of people/m2], operation time [hours], thermal comfort [1/PPD], and indoor air quality [1/CO2 concentration in ppm] were selected as outputs (Figure 4). In DEA, input and output must be a positive number, and the greater output indicates better performance. Therefore, the inverse numbers of the predicted percentage of dissatisfied (PPD) and indoor CO2 concentration were used as outputs. Depending on the DEA user’s interest or purpose, a different combination of input and output factors can be made. Compared to the two-dimensional DEA model (a single input and a single output) as shown in Figure 3, the DEA model of this study (Figure 4) makes a five-dimensional space since it has a single input and four outputs.

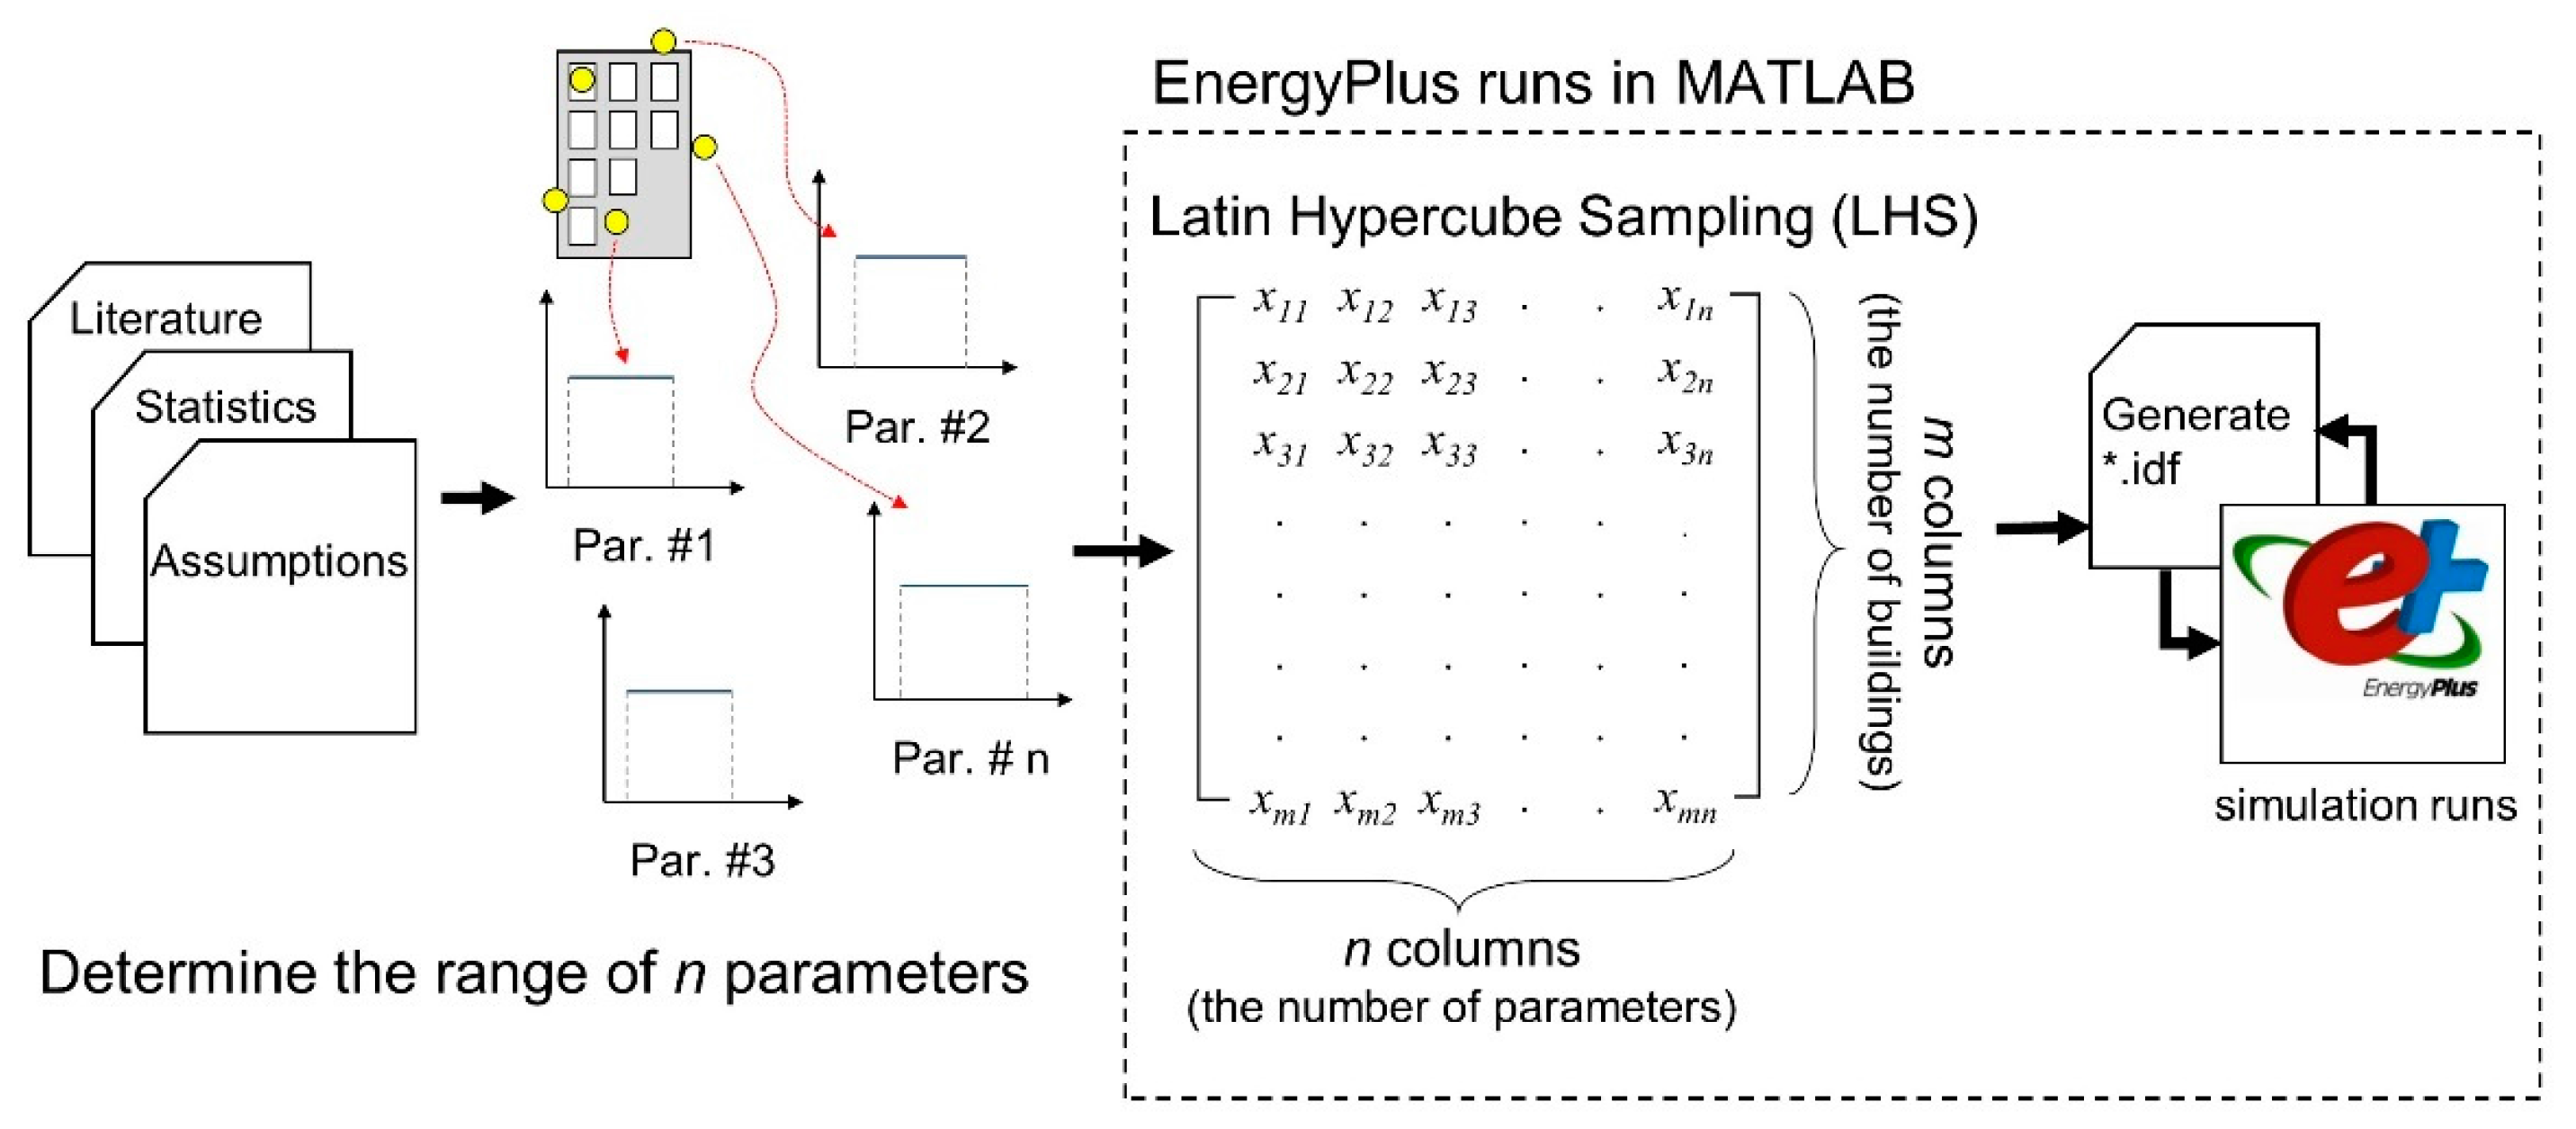
3.3. Monte Carlo Sampling for Generation of Peer Buildings

For peer comparison, 1000 virtual peer buildings were generated using a Latin hypercube sampling (LHS) technique, one of the Monte Carlo sampling methods (Figure 5). The input files of 1000 simulation models (*.idf) were sampled and executed using a batch run of EnergyPlus simulation by MATLAB. In this study, MATLAB script files (m-files) made by the authors were used to automatically generate a batch run of 1000 EnergyPlus simulation *.idfs and to capture simulation results.
Table 1 shows the simulation parameters used for LHS. The minimum and maximum values for the number of floors and the floor area were determined based on a building data book published by the Ministry of Land, Infrastructure, and Transport (MOLIT) of South Korea [19]. The average of the floor height was determined based on a commercial reference building [20]. The layer of wall construction was assumed to be a general concrete wall including inner and outer concrete layers with internal insulation [21]. The thermal properties of materials and the thicknesses of layers were then determined based on Macdonald [22]. The ranges of the transparent envelopes were based on the number of glazing types (61 types) and frame types (three types) [21]. The range of the internal load density was determined based on ASHRAE [20] and Kim [23]. The internal load density of office buildings were determined based on reference operation conditions for office buildings in South Korea [23,24,25]. The range of infiltration rates was set at 0.1–1.25 [1/hour] [26]. The outdoor air intake can vary. In this paper, the range of outdoor air intake was determined based on ASHRAE [21,27], which provides a minimum rate of outdoor air intake as well as the rate of outdoor air intake needed to maintain an acceptable indoor air quality.
The internal thermal capacity was used to take into account the thermal capacity of indoor furniture and structure. In the Department of Energy (DOE) commercial reference building model, the internal thermal capacity was represented as the ratio of a floor area to a surface area of indoor furniture [20]. In this study, the same approach was used and the range of this ratio was set at 0.4–0.6, which is ±20% of the reference model. Then, the internal thermal capacity was added to the thermal capacity of indoor air when calculating the heat balance equation in EnergyPlus [28]. All parameters in Table 1 were assumed to follow a normal distribution, which is widely accepted in many Monte Carlo studies [22,29,30,31].

4. Results

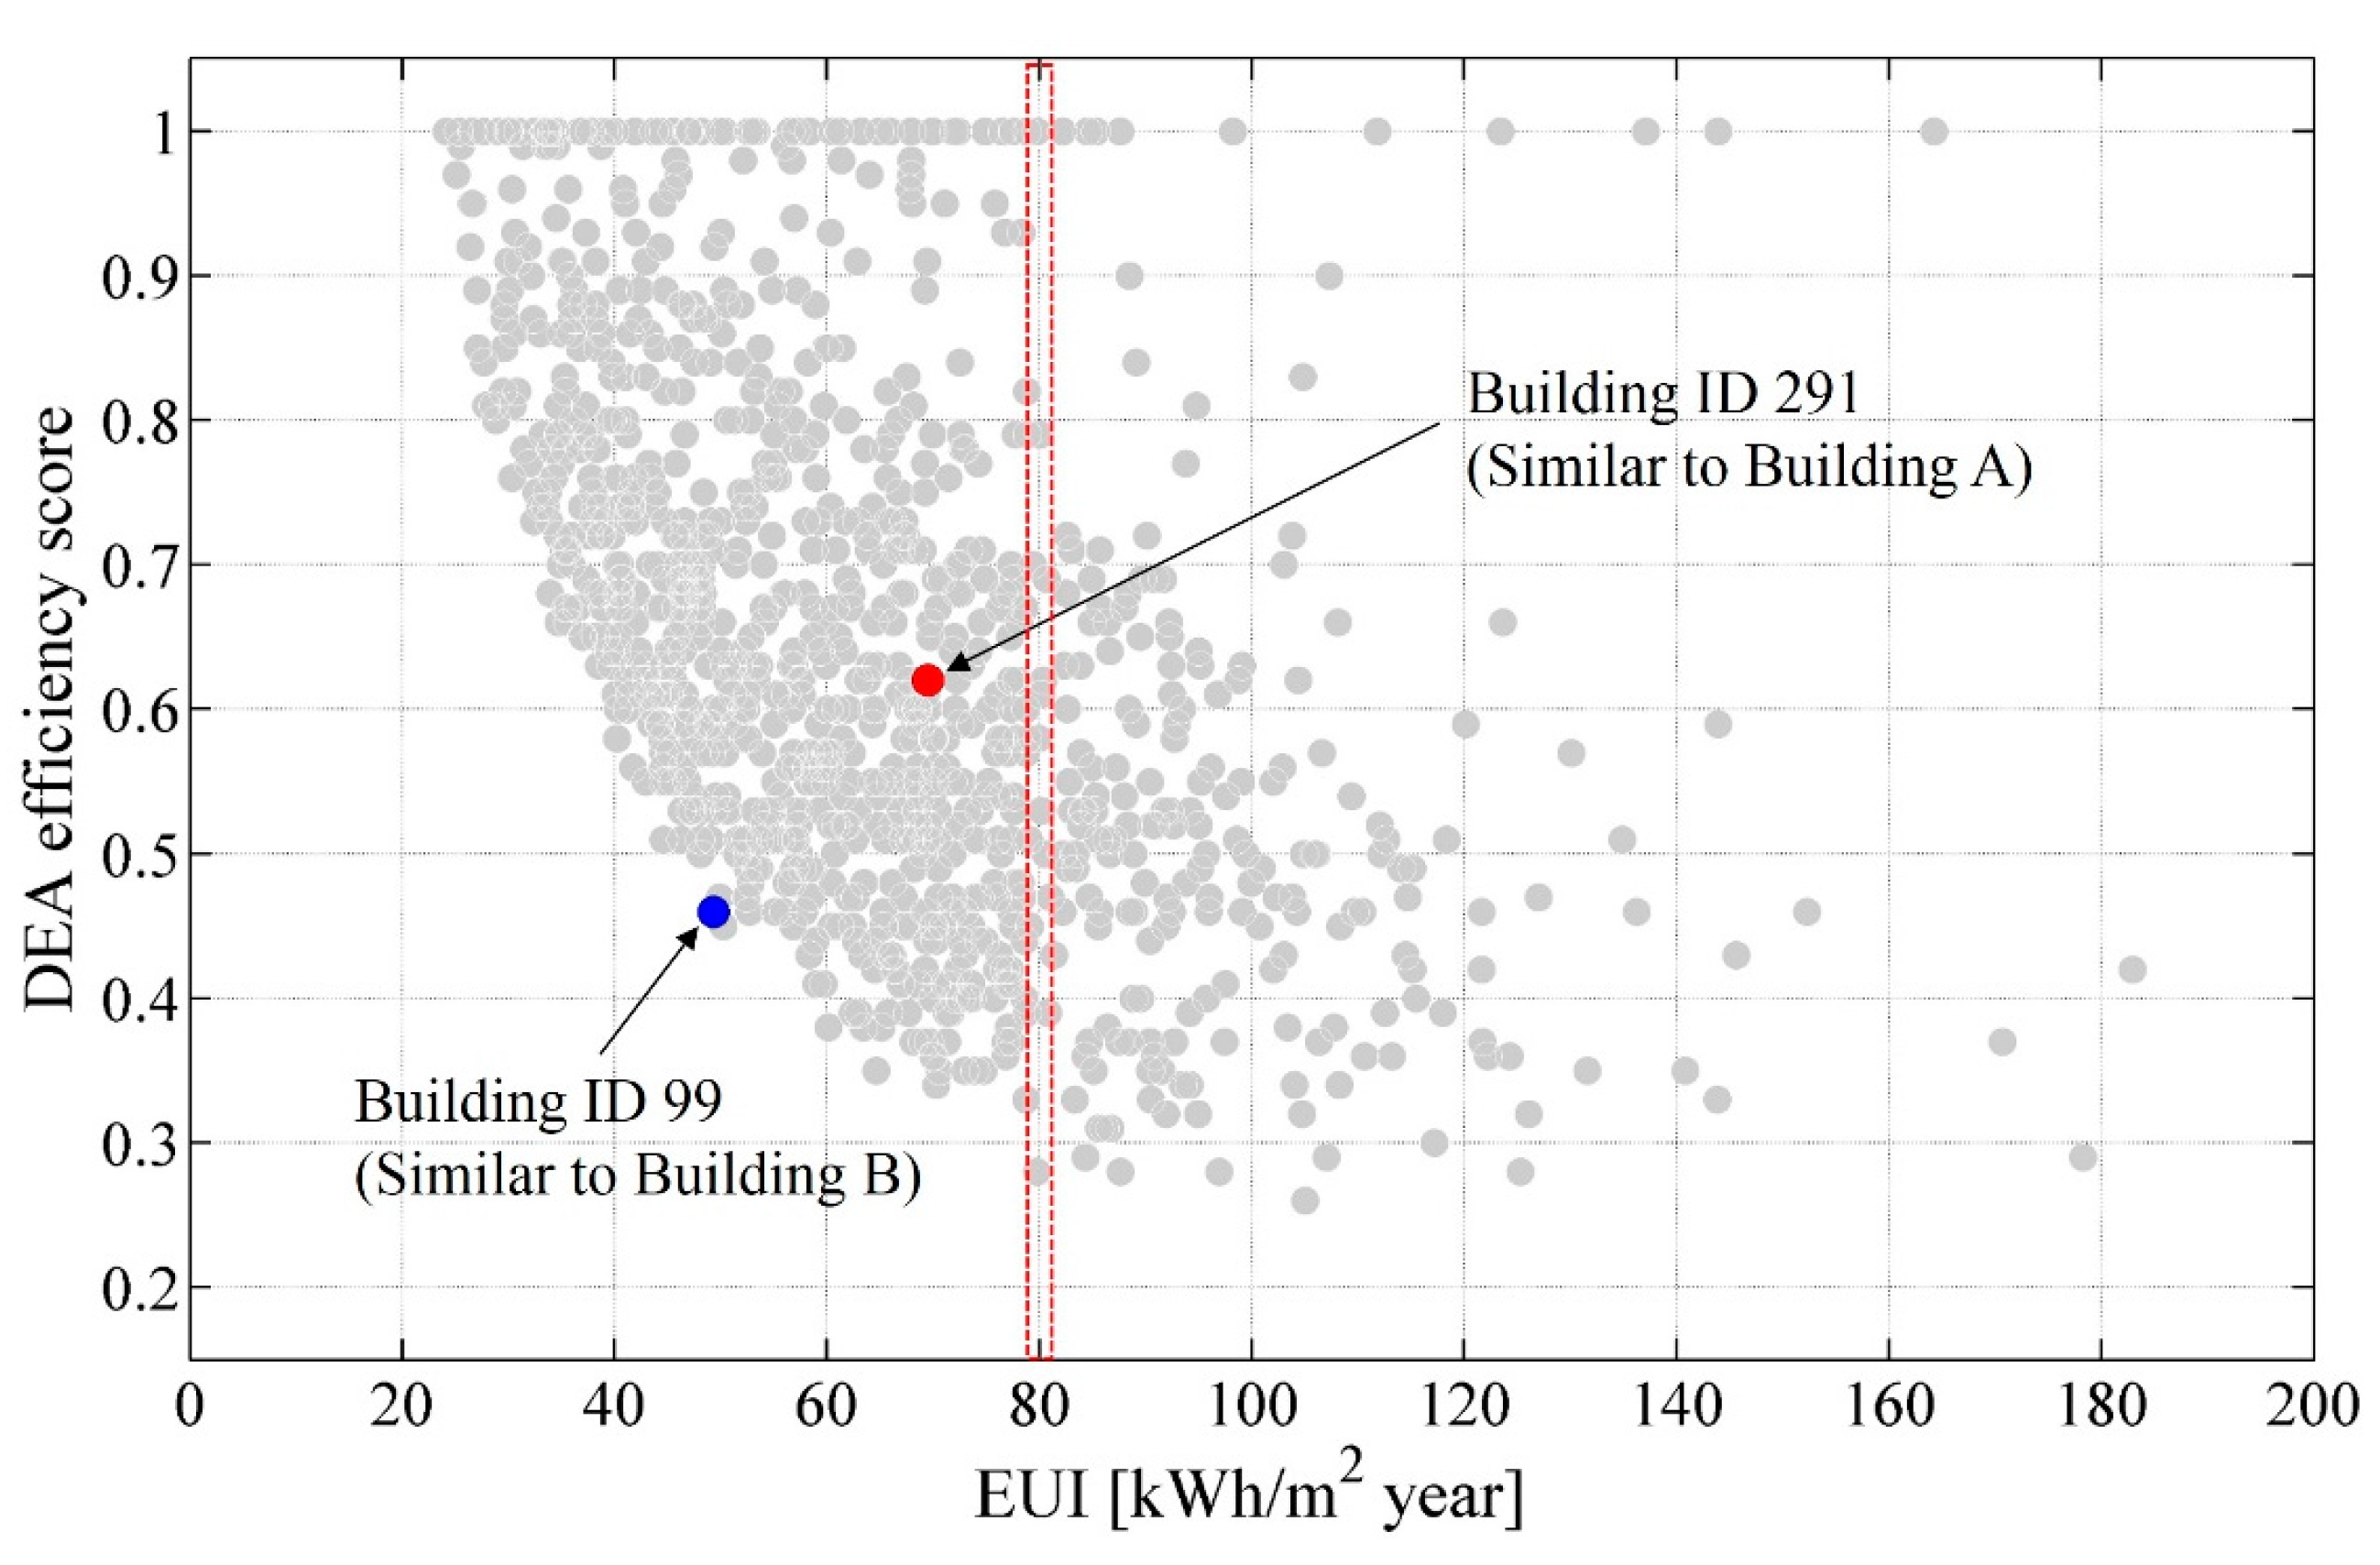
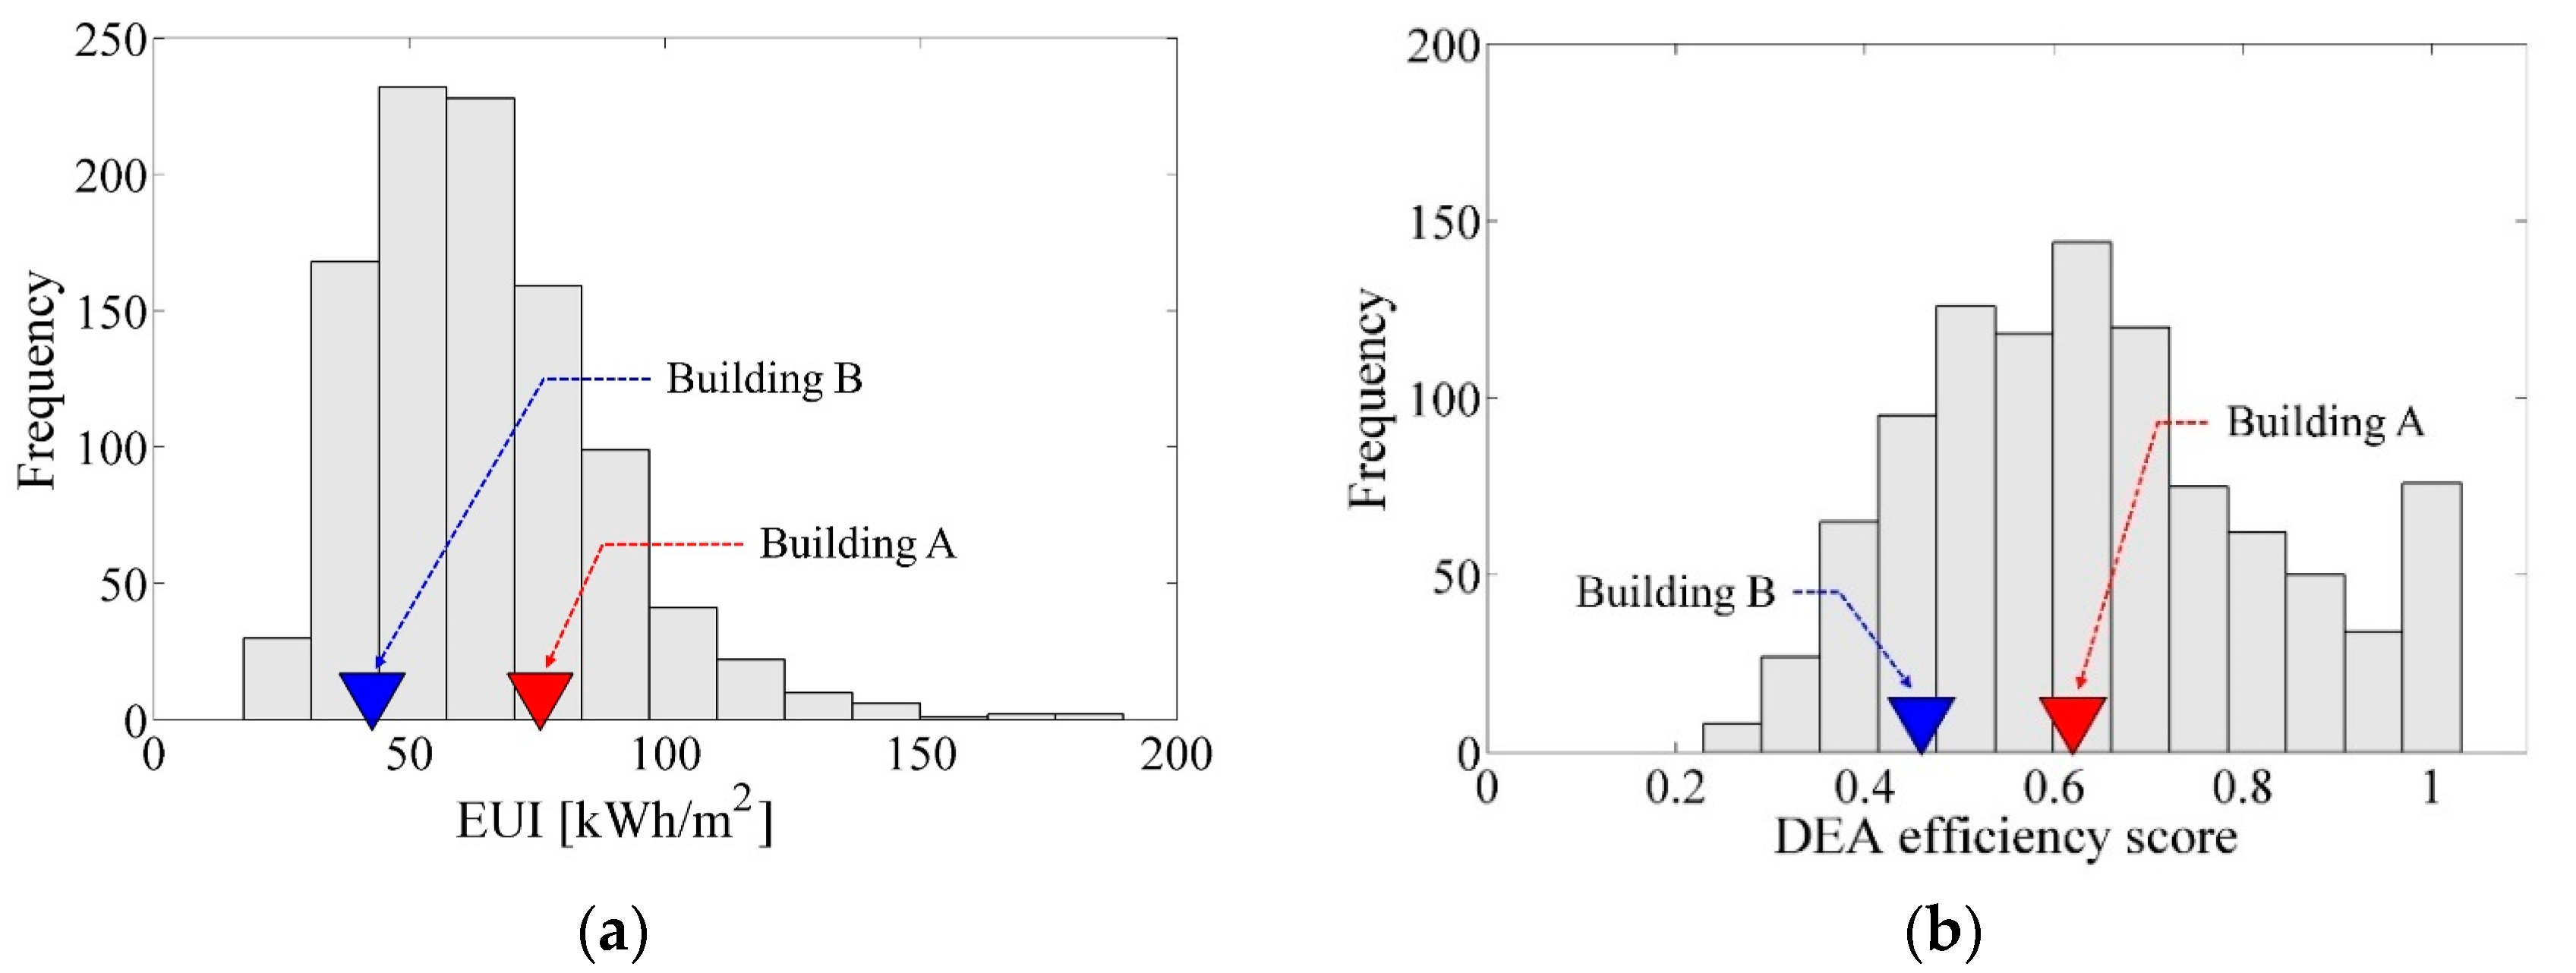
4.1. EUI and DEA Efficiency Scores of 1000 Virtual Peer Buildings

Figure 6 shows the DEA efficiency scores and the EUIs [kwh/m2] of 1000 virtual peer buildings. The calculated DEA efficiency scores (θ) (Equation (1)) of 1000 buildings range from 0.26 to 1.0, while the EUIs vary from 22.6 to 182.9 kwh/m2. The efficiency score of 1.0 implies the most efficient DMU. The EUIs of DMUs in the dotted red box (Figure 6) range from 79.5 to 80.5 kwh/m2, while the DEA efficiency scores of DMUs range from 0.28 to 1.0. The range of 79.5 to 80.5 kwh/m2 was randomly selected for explanation. This means that even if two buildings consume the same amount of energy, the efficiency scores of those two buildings can significantly vary.
Table 2 shows the inputs and outputs of the seven selected buildings of which energy consumption ranges from 79.5 to 80.5 kwh/m2. The differences between the selected buildings in outputs (up to 74% in PPD) is much greater than the differences in the input (up to 1% in EUI). This demonstrates that when assessed based on the EUI, these buildings in Table 2 may be regarded equally, even though there is significant difference in the outputs as well as the efficiency score.
Even though two buildings have similar DEA efficiency scores, their EUIs can significantly differ. Table 3 shows such a case, where two buildings (ID #442, #795) have the same DEA efficiency score of 1.0, but their EUIs differ considerably (22.6 vs. 164.2 kwh/m2). The service levels of building #442 is very low because the number of operation hours is low, the occupancy density is low, the PPD (thermal discomfort) is high, and the CO2 level is not satisfactory. However, building #442 consumes far less energy and is thus assessed as being efficient. In contrast, building #795 is opposite to building #442. Building #795 consumes much more energy than Building #442, but it provides longer operation hours, accommodates more occupants, provides a comfortable environment, and the CO2 level is satisfactory. In other words, building #795 consumes much more energy to provide better services, but building #442 sacrifices comfort and air quality for low energy consumption.

4.2. Energy Performance Benchmarking of Two Real Office Buildings against 1000 Peer Buildings

Among 1000 peer buildings, there is not one building exactly the same as building A or building B. In order to find two buildings most similar to building A and building B, repsectively (Figure 2), a similarity analysis was performed. The single input and four outputs in this study are continuous numerics and can be mapped in a 5-D Cartesian coordinate space. For similarity analysis, the Standardized Euclidean distance was used. The Standardized Euclidean distance is the distance between two n-dimensional vectors based on a normalized dataset [34]. The results of the similarity analysis is shown in Figure 6. The buildings that are most similar to buildings A and B are depicted as a red dot (building #291) and a blue dot (building #99) in Figure 6, respectively.
Table 4 shows the inputs and outputs of building A vs. Building #291. When assessed by the DEA effciency score, building A is evaluated slightly better than when assessed by EUI (ranked as 636 by EUI vs. ranked as 508 by DEA). This is because the operation hours, indoor thermal comfort (PPD), and indoor air quality (CO2 concentration) of building A are ranked in the upper range of 1000 peer buildings. However, the occupancy density of building A is not highly ranked. Hence, the rankings by the EUI and DEA scores do not significantly differ.
The closest peer building to building B is building #99 (Table 5). If assessed by EUI, building B can be regarded as a high performance building due to its low EUI (42.7 kWh/m2). However, the benchmarking based on the DEA effciency score shows a contradictory result. The DEA efficiency score of building B is 0.46 and ranked as 841. This is because all four outputs are ranked low when assessed against 1000 peer buildings. As mentioned in Section 2, building B provides an uncomfortable indoor environment (PPD of 55.2%, CO2 concentration of 1317 ppm) due to the government’s strict energy regulation.
Figure 7 shows the DEA and EUI distribution of 1000 peer buildings and the location of buildings A (red triangle) and B (blue triangle). Building A is placed 636th of the 1000 buildings in terms of EUI and ranked 508th of 1000 in terms of the DEA efficiency score. In contrast, building B is ranked 243rd of 1000 in terms of EUI and 841st of 1000 in terms of DEA efficiency score. The ranking of building B by DEA is significantly lower than that of building B by EUI. The service levels of building B are poor; thus, building B is poorly assessed by DEA.

5. Conclusions

In current practice, it can be argued that many performance aspects of buildings can and should be objectively measurable. The performance characteristics that are most amenable to an objective statement are those that relate to functions that the building or one of its systems is designed to perform. Instead of relying on subjective ‘quality’, a more objective ‘utility’ should be introduced for building performance benchmarking [7].
EUI has been used as a substitute for measuring building energy efficiency because it is straightforward and easy to understand. However, it cannot take into account the service levels of a building. To overcome this limitation, this study presents the DEA method coupled with a Monte Carlo sampling. By the proposed method, the service levels of a building (occupancy density, operation hours, indoor air quality, and thermal comfort) and energy consumption can be reflected in the building energy performance benchmarking. By conducting energy performance benchmarking of two selected real office buildings against 1000 peer buildings, it was demonstrated that DEA is a more objective building energy benchmarking approach than EUI.
One of the purposes of building energy performance benchmarking is to quickly identify a far less energy-efficient building among a large group of buildings. Decision-making on building energy retrofit is usually processed after building energy performance benchmarking is conducted. In this regard, the DEA approach can be beneficially used for energy performance benchmarking since it does not require any dynamic energy simulation model or rigorous expertise. With regard to data availability (e.g., occupancy density, operation hours, CO2 concentration, indoor air temperature), the data stored in Building Energy Management System (BEMS) or Internet of Things sensors/devices can be utilized in the near future. In addition, more inputs and outputs can be easily added to a current set of input/outputs depending on the DEA user’s interest because the DEA method is purely data-driven and non-parametric.

Acknowledgments

This work was supported by the Korea Institute of Energy Technology Evaluation and Planning (KETEP) and the Ministry of Trade, Industry & Energy (MOTIE) of the Republic of Korea (No. 20152020105550).

Author Contributions

Seong-Hwan Yoon implemented DEA using Monte Carlo sampling. Cheol-Soo Park analyzed the simulation results in this paper.

Conflicts of Interest

The authors declare no conflict of interest.

References

  1. U.S. Environmental Protection Agency. Benchmark with EPA’s ENERGY STAR® Portfolio Manager. US Environmental Protection Agency, 2014. Available online: http://www.energystar.gov/ia/partners/reps/ci_program_sponsors/downloads/Portfolio_Manager_Fact_Sheet.pdf (accessed on 11 January 2017).
  2. Filippín, C. Benchmarking the energy efficiency and greenhouse gases emissions of school buildings in central Argentina. Build. Environ. 2000, 35, 407–414. [Google Scholar] [CrossRef]
  3. Monts, J.K.; Blissett, M. Assessing energy efficiency and energy conservation potential among commercial buildings: A statistical approach. Energy 1982, 7, 861–869. [Google Scholar] [CrossRef]
  4. Sharp, T. Energy Benchmarking Commercial Office Buildings. In Proceedings of the 1996 American Council for an Energy-Efficient Economy (ACEEE 1996) summer study on energy efficiency in buildings, Washington, DC, USA, 1996; pp. 321–329. [Google Scholar]
  5. American Society of Heating, Refrigerating and Air-Conditioning Enginners. Standard 90.1-2016—Energy Standard for Buildings Except Low-Rise Residential Buildings; American Society of Heating, Refrigerating and Air-Conditioning Engineers, Inc.: Atlanta, GA, USA, 2016. [Google Scholar]
  6. British Standards Institution (BSI). Energy Performance of Buildings-Methods for Expressing Energy Performance and the Energy Certification of Buildings; EN 15217:2007; British Standards Institution: London, UK, 2007. [Google Scholar]
  7. Augenbroe, G.; Park, C.S. Quantification methods of technical building performance. Build. Res. Inf. 2005, 33, 159–172. [Google Scholar] [CrossRef]
  8. U.S. Environmental Protection Agency. What Is Energy Use Intensity (EUI)? Available online: http://www.eia.gov/emeu/efficiency/measure_discussion.htm (accessed on 11 January 2017).
  9. U.S. Energy Information Administration. Energy Efficiency Measurement Discussion. Energy Information Administration, 2000. Available online: http://www.eia.gov/emeu/efficiency/measure_discussion.htm (accessed on 11 January 2017).
  10. Department of Energy/Energy Information Administration. Measuring Energy Efficiency in the United States’ Economy: A Beginning; US Department of Energy/Energy Information Administration: Washington, DC, USA, 1995.
  11. Charnes, A.; Cooper, W.W.; Rhodes, E. Measuring the efficiency of decision making units. Eur. J. Oper. Res. 1978, 2, 429–444. [Google Scholar] [CrossRef]
  12. Lee, W.S. Benchmarking the energy efficiency of government buildings with data envelopment analysis. Energy Build. 2008, 40, 891–895. [Google Scholar] [CrossRef]
  13. Lee, W.S.; Lee, K.P. Benchmarking the performance of building energy management using data envelopment analysis. Appl. Therm. Eng. 2009, 29, 3269–3273. [Google Scholar] [CrossRef]
  14. Önüt, S.; Soner, S. Energy efficiency assessment for the Antalya Region hotels in Turkey. Energy Build. 2006, 8, 964–971. [Google Scholar] [CrossRef]
  15. Yu, F.W.; Chan, K.T. Improved energy management of chiller systems by multivariate and data envelopment analysis. Appl. Energy 2012, 92, 168–174. [Google Scholar] [CrossRef]
  16. Talluri, S. Data envelopment analysis: Models and extensions. Decis. Line 2000, 31, 8–11. [Google Scholar]
  17. Charnes, A.; Cooper, W.W.; Lewin, A.Y.; Seiford, L.M. Data Envelopment Analysis: Theory, Methodology, and Applications; Springer: New York, NY, USA, 2013. [Google Scholar]
  18. Ramanathan, R. An Introduction to Data Envelopment Analysis: A Tool for Performance Measurement; Sage Publication Ltd.: Thousand Oaks, CA, USA, 2003. [Google Scholar]
  19. Ministry of Land, Infrastructure and Transport. Building Data Book. Ministry of Land, Infrastructure and Transport, 2014. Available online: http://stat.molit.go.kr/portal/cate/statView.do (accessed on 11 January 2017).
  20. Deru, M.; Field, K.; Studer, D.; Benne, K.; Griffith, B.; Torcellini, P.; Liu, B.; Halverson, M.; Winiarski, D.; Rosenberg, M.; et al. Department of Energy Commercial Reference Building Models of the National Building Stock; National Renewable Energy Laboratory: Denver, CO, USA, 2011. [Google Scholar]
  21. American Society of Heating, Refrigerating and Air-Conditioning Engineers. Handbook Fundamentals; American Society of Heating, Refrigerating and Air-Conditioning Engineers, Inc.: Atlanta, GA, USA, 2013. [Google Scholar]
  22. Macdonald, I.A. Quantifying the Effects of Uncertainty in Building Simulation. Ph.D. Thesis, University of Strathclyde, Glasgow, UK, 2002. [Google Scholar]
  23. Kim, S.H. Air Conditioning System; Geongiwon Book Publishing: Seoul, Korea, 2012. (In Korean) [Google Scholar]
  24. Kotobuki Engineering Manufacturing Co. The Guide to Energy Saving Design Standard; Korea Energy Management Corporation: Seoul, Korea, 2011. (In Korean) [Google Scholar]
  25. Society of Air-Conditioning Refrigerating and Engineers of Korea. Equipment Engineering Handbook; The Society of Air-Conditioning and Refrigerating Engineers of Korea: Seoul, Korea, 2004. (In Korean) [Google Scholar]
  26. Heo, Y.S. Bayesian Calibration of Building Energy Models for Energy Retrofit Decision-Making under Uncertainty. Ph.D. Thesis, Georgia Institute of Technology, Atlanta, GA, USA, 2011. [Google Scholar]
  27. American Society of Heating, Refrigerating and Air-Conditioning Engineers. ASHRAE Standard 62.1. Ventilation for Acceptable Indoor Air Quality; American Society of Heating, Refrigerating and Air-Conditioning Engineers, Inc.: Atlanta, GA, USA, 2016. [Google Scholar]
  28. Department of Energy. EnergyPlus Input Output Reference: The Encyclopedic Reference to EnergyPlus Input and Output; US Department of Energy: Washington, DC, USA, 2012.
  29. Hopfe, C.J. Uncertainty and Sensitivity Analysis in Building Performance Simulation for Decision Support and Design Optimization. Ph.D. Thesis, Eindhoven University of Technology, Eindhoven, The Netherlands, 2009. [Google Scholar]
  30. Tian, W. A review of sensitivity analysis methods in building energy analysis. Renew. Sustain. Energy Rev. 2013, 20, 411–419. [Google Scholar] [CrossRef]
  31. Kim, Y.J.; Ahn, K.U.; Park, C.S. Decision Making of HVAC System using Bayesian Markov Chain Monte Carlo method. Energy Build. 2014, 72, 112–121. [Google Scholar] [CrossRef]
  32. MOL, Business Labor force Survey, Ministry of Employment and Labor in South Korea. 2012. Available online: http://laborstat.molab.go.kr/newOut/menu01/menu01_intro.jsp?pageNum=0 (accessed on 11 January 2017).
  33. Hanmi, C.E. Field Measurement of Building Plant Systems; Hanmi: Seoul, Korea, 2015. (In Korean) [Google Scholar]
  34. Greenacre, M.; Primicerio, R. Measures of Distance between Samples: Euclidean. In Multivariate Analysis of Ecological Data; Fundacion BBVA Publication: Bilbao, Spain, 2013; pp. 47–59. [Google Scholar]
Figure 1. Three cases for misinterpretation of Energy Use Intensity (EUI). (a) Case #1; (b) Case #2; (c) Case #3.
Sustainability 09 00780 g001aSustainability 09 00780 g001b
Figure 2. Views of two buildings: building A (left) and building B (right).
Sustainability 09 00780 g002
Figure 3. Data Envelopment Analysis (DEA) concept (a case of a single input and a single output).
Sustainability 09 00780 g003
Figure 4. EUI-based (left) vs. DEA-based (right) building energy benchmarking (red dotted line shows the coverage of two methods).
Sustainability 09 00780 g004
Figure 5. Generation of virtual peer buildings using Latin Hypercube Sampling (LHS).
Sustainability 09 00780 g005
Figure 6. DEA efficiency scores and EUIs of 1000 virtual peer buildings.
Sustainability 09 00780 g006
Figure 7. EUIs and DEA efficiency scores of Building A and Building B vs. 1000 peer buildings. (a) EUI distribution; (b) DEA score distribution.
Sustainability 09 00780 g007
Table 1. Parameters for Latin Hypercube Sampling.
ParametersRange [min, max]References
GeometricThe number of floors [-][10, 18]MOLIT [19]
Floor area [m2][1112, 2282]
Aspect ratio [-][0.25, 1]
Floor height [m][3.85, 4.57]Deru et al. [20]
Window to wall ratio [%][50, 95]MOLIT [19]
Opaque envelopeConcrete–Conductivity [W/mK][0.36, 1.69]Macdonald [22]
Concrete–Specific heat [J/kgK][790, 926]Macdonald [22]
Concrete–Density [kg/m3][974, 2280]Macdonald [22]
Construction thickness [mm][50, 300]ASHRAE [21]
Insulation–Conductivity [W/mK][0.03, 0.07]Macdonald [22]
Insulation–Specific heat [J/kgK][693, 1273]Macdonald [22]
Insulation–Density [kg/m3][19.8, 123.8]Macdonald [22]
Insulation thickness [mm][50, 200]ASHRAE [21]
Transparent envelopeGlazing type [-][1, 61]ASHRAE [21]
Frame type [-][1, 3]
Internal load densityOccupant density [person/m2][0.14, 0.25]Kim [23], ASHRAE [21]
Lighting density [W/m2][12, 30]
Appliance density [W/m2][10.8, 21.5]ASHRAE [21]
ControlHeating set-point temperature [°C][18, 24]KEMCO [24], SAREK [25]
Cooling set-point temperature [°C][24, 29]KEMCO [24], SAREK [25]
Operation hours [hour][7, 11]MOL [32]
Plant/HVACHeating system efficiency[0.5, 0.85]Hanmi C&E [33]
Cooling system COP[2.5, 4.5]Hanmi C&E [33]
Fan total efficiency[0.6, 0.7]Heo [26]
Fan motor efficiency[0.75, 0.87]
Pump motor efficiency[0.7, 0.83]
OthersInfiltration [1/hour][0.1, 1.25]Heo [26]
Outdoor air intake [m3/s/person][0.0025, 0.01]ASHRAE [21], ASHRAE [27]
Internal thermal capacity [-][0.4, 0.6]Deru et al. [20]
Table 2. Inputs and outputs of selected buildings in the range of 79.5 to 80.5 kWh/m2.
Building ID #InputOutputsDEA Efficiency Score
EUI [kWh/m2]Operation Hour [Hours]Occupancy Density [Person/m2]PPD [%]CO2 [ppm]
27679.990.2327.18230.58
49479.7110.2417.37651.00
49980.080.2322.27640.79
64880.270.2340.18350.53
77080.290.2015.88460.61
78679.780.1560.212510.28
84580.470.2317.98480.62
Difference (%)1%36%37%74%39%72%
Table 3. Inputs and outputs of two buildings (the efficiency scores of the two buildings are 1.0).
Building ID #InputOutputsDEA Efficiency Score
EUI [kWh/m2]Operation Hour [Hours]Occupancy Density [Person/m2]PPD [%]CO2 [ppm]
kWh/m2Ran-KinghoursRan-KingPerson/m2Ran-King-Ran-KingppmRan-King
44222.6186720.1867059.296710987681.0
795164.299710930.2412218.467727171.0
Table 4. Comparison of building A and building #291.
Building ID #Input (EUI)Output #1 (Operation Hour)Output #2 (Occupancy Density)Output #3 (PPD)Output #4 (CO2)DEA Efficiency Score
kWh/m2Ran-KinghoursRan-KingPerson/m2Ran-King-Ran-KingppmRan-King-Ran-King
29169.563610930.1593118.9797882260.62508
Building A75.6-10 -0.12-15.0-759---
Table 5. Comparison of building B and building #99.
Building ID #Input (EUI)Output #1 (Operation Hour)Output #2 (Occupancy Density)Output #3 (PPD)Output #4 (CO2)DEA Efficiency Score
kWh/m2Ran-KinghourRan-KingPerson/m2Ran-King-Ran-KingppmRan-King-Ran-King
9949.324386720.1773859.696913219200.46841
Building B42.7-8 -0.14-55.2-1317---

