Article

GHG Emissions from the Production of Lithium-Ion Batteries for Electric Vehicles in China

State Key Laboratory of Automotive Safety and Energy, Tsinghua University, Beijing 100084, China
*
Author to whom correspondence should be addressed.
Sustainability 2017, 9(4), 504; https://doi.org/10.3390/su9040504
Submission received: 14 January 2017 / Revised: 13 March 2017 / Accepted: 21 March 2017 / Published: 4 April 2017

Abstract

:
With the mass market penetration of electric vehicles, the Greenhouse Gas (GHG) emissions associated with lithium-ion battery production has become a major concern. In this study, by establishing a life cycle assessment framework, GHG emissions from the production of lithium-ion batteries in China are estimated. The results show that for the three types of most commonly used lithium-ion batteries, the (LFP) battery, the (NMC) battery and the (LMO) battery, the GHG emissions from the production of a 28 kWh battery are 3061 kgCO2-eq, 2912 kgCO2-eq and 2705 kgCO2-eq, respectively. This implies around a 30% increase in GHG emissions from vehicle production compared with conventional vehicles. The productions of cathode materials and wrought aluminum are the dominating contributors of GHG emissions, together accounting for around three quarters of total emissions. From the perspective of process energy use, around 40% of total emissions are associated with electricity use, for which the GHG emissions in China are over two times higher than the level in the United States. According to our analysis, it is recommended that great efforts are needed to reduce the GHG emissions from battery production in China, with improving the production of cathodes as the essential measure.

1. Introduction

In recent years, the great promotion of electric vehicles (EVs) by the Chinese government has boosted the development of the EV battery industry. Among all sorts of EV batteries, lithium ion batteries are currently the best sellers on the market due to the advantages of high energy density, high power density, long service life, and favorable environmental properties compared to lead-acid batteries and Ni-MH batteries. In 2015, China’s EV battery yield reached 15.45.GWh, up 277.7% compared to 2014 [1]. This boom for the lithium ion battery industry will surely leave a considerable burden on the environment.
Vehicle-use lithium ion batteries are currently divided into three categories depending on their different anodes, i.e., the (LFP) battery, the (NMC) battery, and the (LMO) battery. Among the battery distribution on the Chinese market in 2015, LFP accounted for 52%, NMC 39%, and LMO 3% (relatively preferred for Japanese and Korean cars) [2]. At present, domestic research on lithium ion batteries is primarily focused on performance, falling short of further understanding the environmental impact of the battery, particularly of the manufacturing process of the battery.
This study focuses on the manufacturing process of vehicle-use lithium ion batteries in China. Based on the life cycle assessment (LCA) method, it establishes a local model for study of the green gas (GHG) emissions of vehicle-use lithium ion batteries, reveals the carbon emission strength of all components in the “Cradle-to-Gate” phase, analyzes the GHG emission reduction potential of all components, and makes a transverse comparison and Sino-US comparison of the GHG emissions of LFP, NMC, and LMO batteries. In addition, it analyzes the uncertainty of the GHG emission model based on study results in the existing literature.

2. Overview of Relevant Studies

As the life cycle database has been established and gradually improved, many foreign studies have adopted LCA for automobiles or accessories. Notter and other foreign scholars have studied the entire-life environment and energy impacts of LMO batteries [3], giving the mean values of input and output materials during the production of LMO batteries. Zackrisson et al. have explored the environmental impact of different binders during the production of LFP batteries based on experimental data [4], suggesting that it is environmentally preferable to use water as a solvent instead of N-methyl-2-pyrrolidone, NMP, in the slurry for casting the cathode and anode of lithium-ion batteries. Majeau-Bettez et al. have studied the environmental and energy impact of LFP and NMC batteries based on secondary data [5], contributing a public and detailed inventory, which can easily be adapted to any electricitytrain, along with readily usable environmental performance assessments. Ellingsen et al. have researched the GHG emissions during the manufacturing process of NMC batteries based on primary data provided by the battery manufacturers [6], providing us with a transparent inventory for a lithium-ion nickel-cobalt-manganese traction battery. Dunn et al. from the Argonne National Laboratory in the U.S. have researched the energy flow and material flow during the production of all materials of the NMC, LFP, LMO and LCO batteries [7,8], and have calculated total (full fuel cycle) energy consumption associated with the production of each of the cathode materials. Other foreign studies on lithium ion batteries include the Environmental Protection Agency (EPA) Amarakoon et al. [9] of the US, who have presented a life-cycle assessment (LCA) study of lithium-ion (Li-ion) batteries used in electric and plug-in hybrid electric vehicles, Kim et al. [10], who reported the first cradle-to-gate emissions assessment for a mass-produced battery in a commercial battery electric vehicle, and Hendrickson et al. [11], whose study combined life-cycle assessment and geographic information systems(GIS) to analyze the energy, (GHG) emissions, etc. for lithium-ion batteries in California.
Domestically, Wang Qi from South China University of Technology assessed the environmental effect and life cycle cost of three lithium battery anode materials (NMC, LMO, and LFP) [12], and the results show that the environmental benefits of LMO is the highest, with greater environmental benefits than the LFP and the life cycle environment cost of LFP is the lowest, followed by LMO and NMC. Lu Qiang from Jilin University analyzed the GHG emissions throughout the entire cycle of LFP batteries [13], providing us with the values of energy consumption and greenhouse gases emission in the “cradle to use” stage. Chen Bo from Beijing Institute of Technology assessed the environmental impact of lithium batteries with such anode materials as NMC, LNM, LFLM, and LFP [14], and the life cycle environmental impact scores of these batteries were 275 Pt, 129 Pt, 142 Pt and 100 Pt respectively.
Above all, while more foreign studies on the energy and environmental impact of EV batteries were carried out earlier, the domestic study of this topic still in the initial phases. Additionally, electric vehicle is becoming a main application field of lithium-ion batteries, whereas there is no specialized study on these kinds of batteries. As such, this study mainly assesses the environmental impact of the vehicle-use lithium-ion battery.

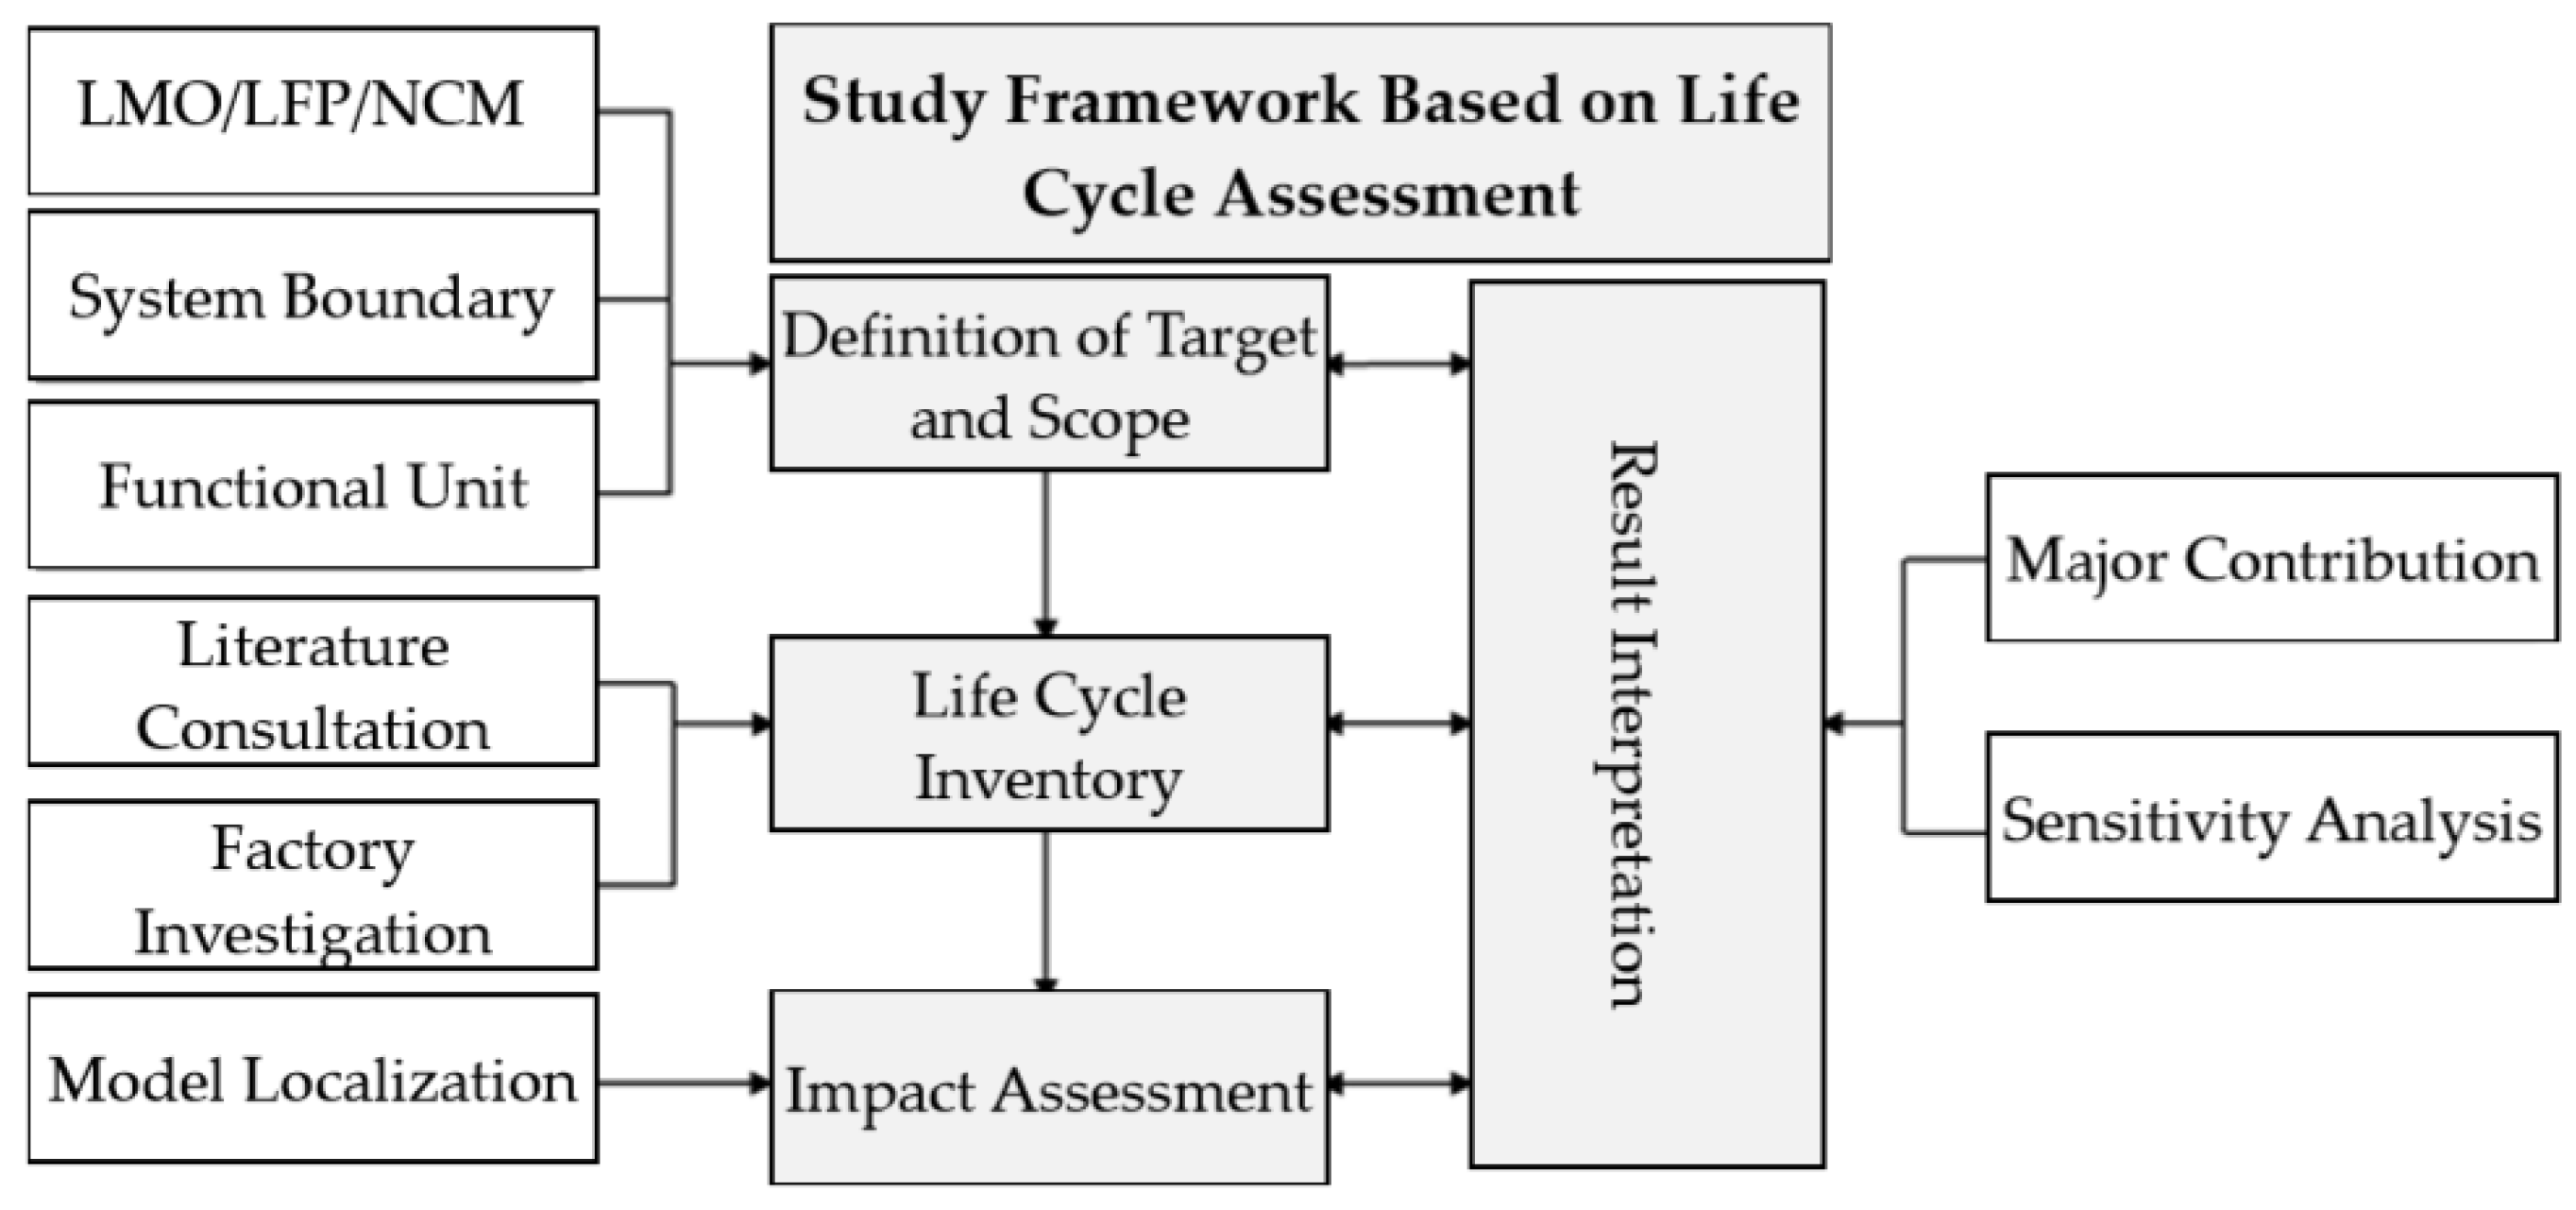
3. Research Content and Methods

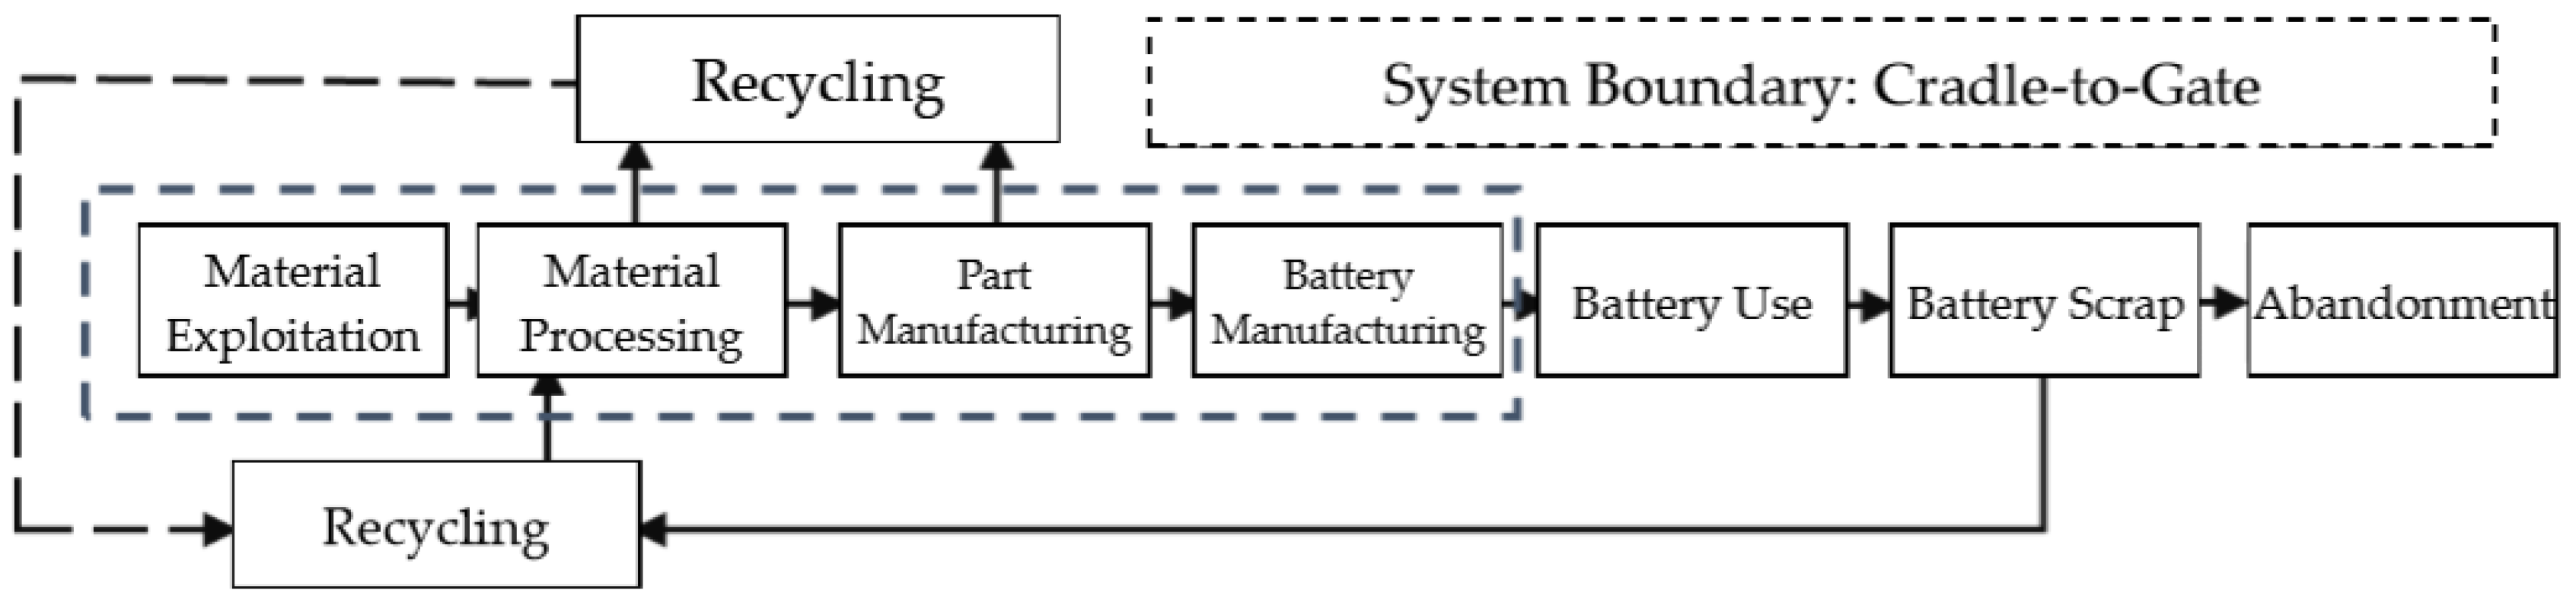
3.1. Research Framework and System Boundary

Based on the LCA study method, the study process is divided into four parts: Definition of Target and Scope, Inventory, Impact Assessment, and Results Interpretation. For collection of life cycle inventory, this study primarily adopts the literary consultation and factory investigation methods (Figure 1).
In the LCA process, the manufacturing process of lithium ion batteries is also called the “Cradle-to-Gate” phase. The manufacturing process is divided into the four links of material exploitation, material processing, part manufacturing and battery manufacturing. Since vehicle-use lithium ion batteries are not widely recycled in China now, it is hard to find data to support the research. Thus, instead of an analysis of the GHG emissions throughout the entire battery life, this study simply studies the manufacturing process (Figure 2).
Commonly used functional units for the energy and environmental impact of batteries include “per km of travel”, “per kWh of battery”, and “per kg of battery”. A study with “per km of travel” as the functional unit will always have the usage phase of the batteries within its system boundaries, which can intuitively embody the usage features of the battery, and facilitate the comparison with other energy-driven cars in terms of energy and environmental impact. Since this study focuses on the manufacturing process of the battery, it is more intuitive and accurate to select “per kWh of battery” as the functional unit. The index used for assessment of GHG emissions in this study is the emission of carbon dioxide as equivalent to the energy production of each kWh of battery (kgCO2-eq/kWh).

3.2. Calculation Method

The calculation of GHG emissions includes two parts, the GHG emissions from the “raw material exploitation, material processing, and parts manufacturing” process of all components/materials (Formula (1)), and the GHG emissions from the single cell production and assembly process (Formula (2)). As most emissions during the battery manufacturing process come from combustion, we need to know the energy and material input of each process, as well as the process energy consumed by this process, and substitute the GHG emission factor for the process energy, so as to work out the GHG emissions. It should be noted that while GHG emissions originating from non-combustion are not shown in the formula, they can be neglected if they are too small.
C E M P = i j E F j · k E C i , j , k ,
C E B P = C E M P + C E B A ,
wherein, i refers to the material, j to the energy, and k to the process (to the GHG emissions of each component/material, to the GHG emissions from the single cell production and assembly process, and to the GHG emissions during the battery manufacturing process).

3.3. Establishment of Battery Model

For battery modeling, this study adopts the BatPac Model of the Argonne National Laboratory of the US. For the battery capacity option, investigation of the EV market in mainland China in 2015 and 2016 and relevant literature revealed that the capacity of lithium ion batteries carried by purely electric vehicles normally ranges between 20 kWh and 30 kWh [15]. With reference to the GREET-2015 Model (The Greenhouse Gases, Regulated Emissions, and Energy Use in Transportation Model of the Argonne National Laboratory ), as total battery capacity of 28 kWh comparatively conforms to the current technical mainstream, 28 kWh is presumed as the total battery capacity in this study.
The BatPac Model and GREET-2015 Model of the Argonne National Laboratory are adopted because (i) they are relatively reliable due to their summarization of research findings of Majeau-Bettez et al. [12], and Notter et al. [10], to establish a rather complete assessment chain for a car’s life cycle; and (ii) it’s easy to compare the GHG emissions calculated by local data in the Chinese market with that of the Laboratory (Table 1).
The mass fraction of each material/component of the three lithium ion batteries fitted through the BatPac Model is shown in Table 2. Among all of these, the anode active materials take up the biggest share, respectively 24.4%, 28.2%, and 33.6% for LFP, NMC, and LMO batteries. Wrought aluminum then follows. Aluminum is also heavily used in the batteries, including the anode current collector, anode tab, aluminum plastic film of battery cell, battery package, and module shell. Plastics include PP, PT and PET, used in the membrane and aluminum plastic film.

3.4. Data Localization

The most important step in establishing the local model for GHG emission of lithium ion batteries in China is to localize the database. Energy consumption or carbon emission data of each process is shown in Table 3.
Since many production processes and technologies are still under research and development amid the rapid development of the lithium ion battery industry, most enterprises are reluctant to disclose their primary data for process details and energy consumption of the production process. The study on energy consumption of the manufacturing process of anode active materials mostly relies upon the process flow, coupled with the physical and chemical parameters of the material. By presumption of the production equipment, reaction temperature and finished product yield, it estimates the thermal consumption of the reaction process. Representative studies include those carried out by Majeau-Bettez et al. [5], and Dunn et al. [7].
The data from the study on the whole-life environmental impact of anode materials ( Li M n 2 O 4 ,   Li N i 1 / 3 C o 1 / 3 M n 1 / 3 O 2   and   LiFeP O 4 ) based on LCA method as carried out by Wang Qi from South China University of Technology in 2012 primarily come from the China Energy Statistical Yearbook [12]. As it directly refers to the research of Majeau-Bettez et al., it is relatively compliant with China’s current production reality [5]. Due to the difficulty in gaining first-hand data on the anode materials, the data on GHG emissions during the exploitation, transportation, and production process in this study all originate from Wang’s study (Table 4).
Graphite is chiefly used in the cathode material of the battery. Graphite in this study is presumed to be artificial, which undergoes the carbonization and graphitization phases during the manufacturing process. While the carbonization data come from the GHG emission data during carbon cathode production in the aluminum industry, the energy consumption data of the graphitization process originate from GREET-2015.

3.5. GHG Emission Factor of Process Energy

Commonly seen GHG emission factors of process energy are shown in Table 5, which have all been localized, with the data source listed in the table below.

4. Research Findings and Discussion

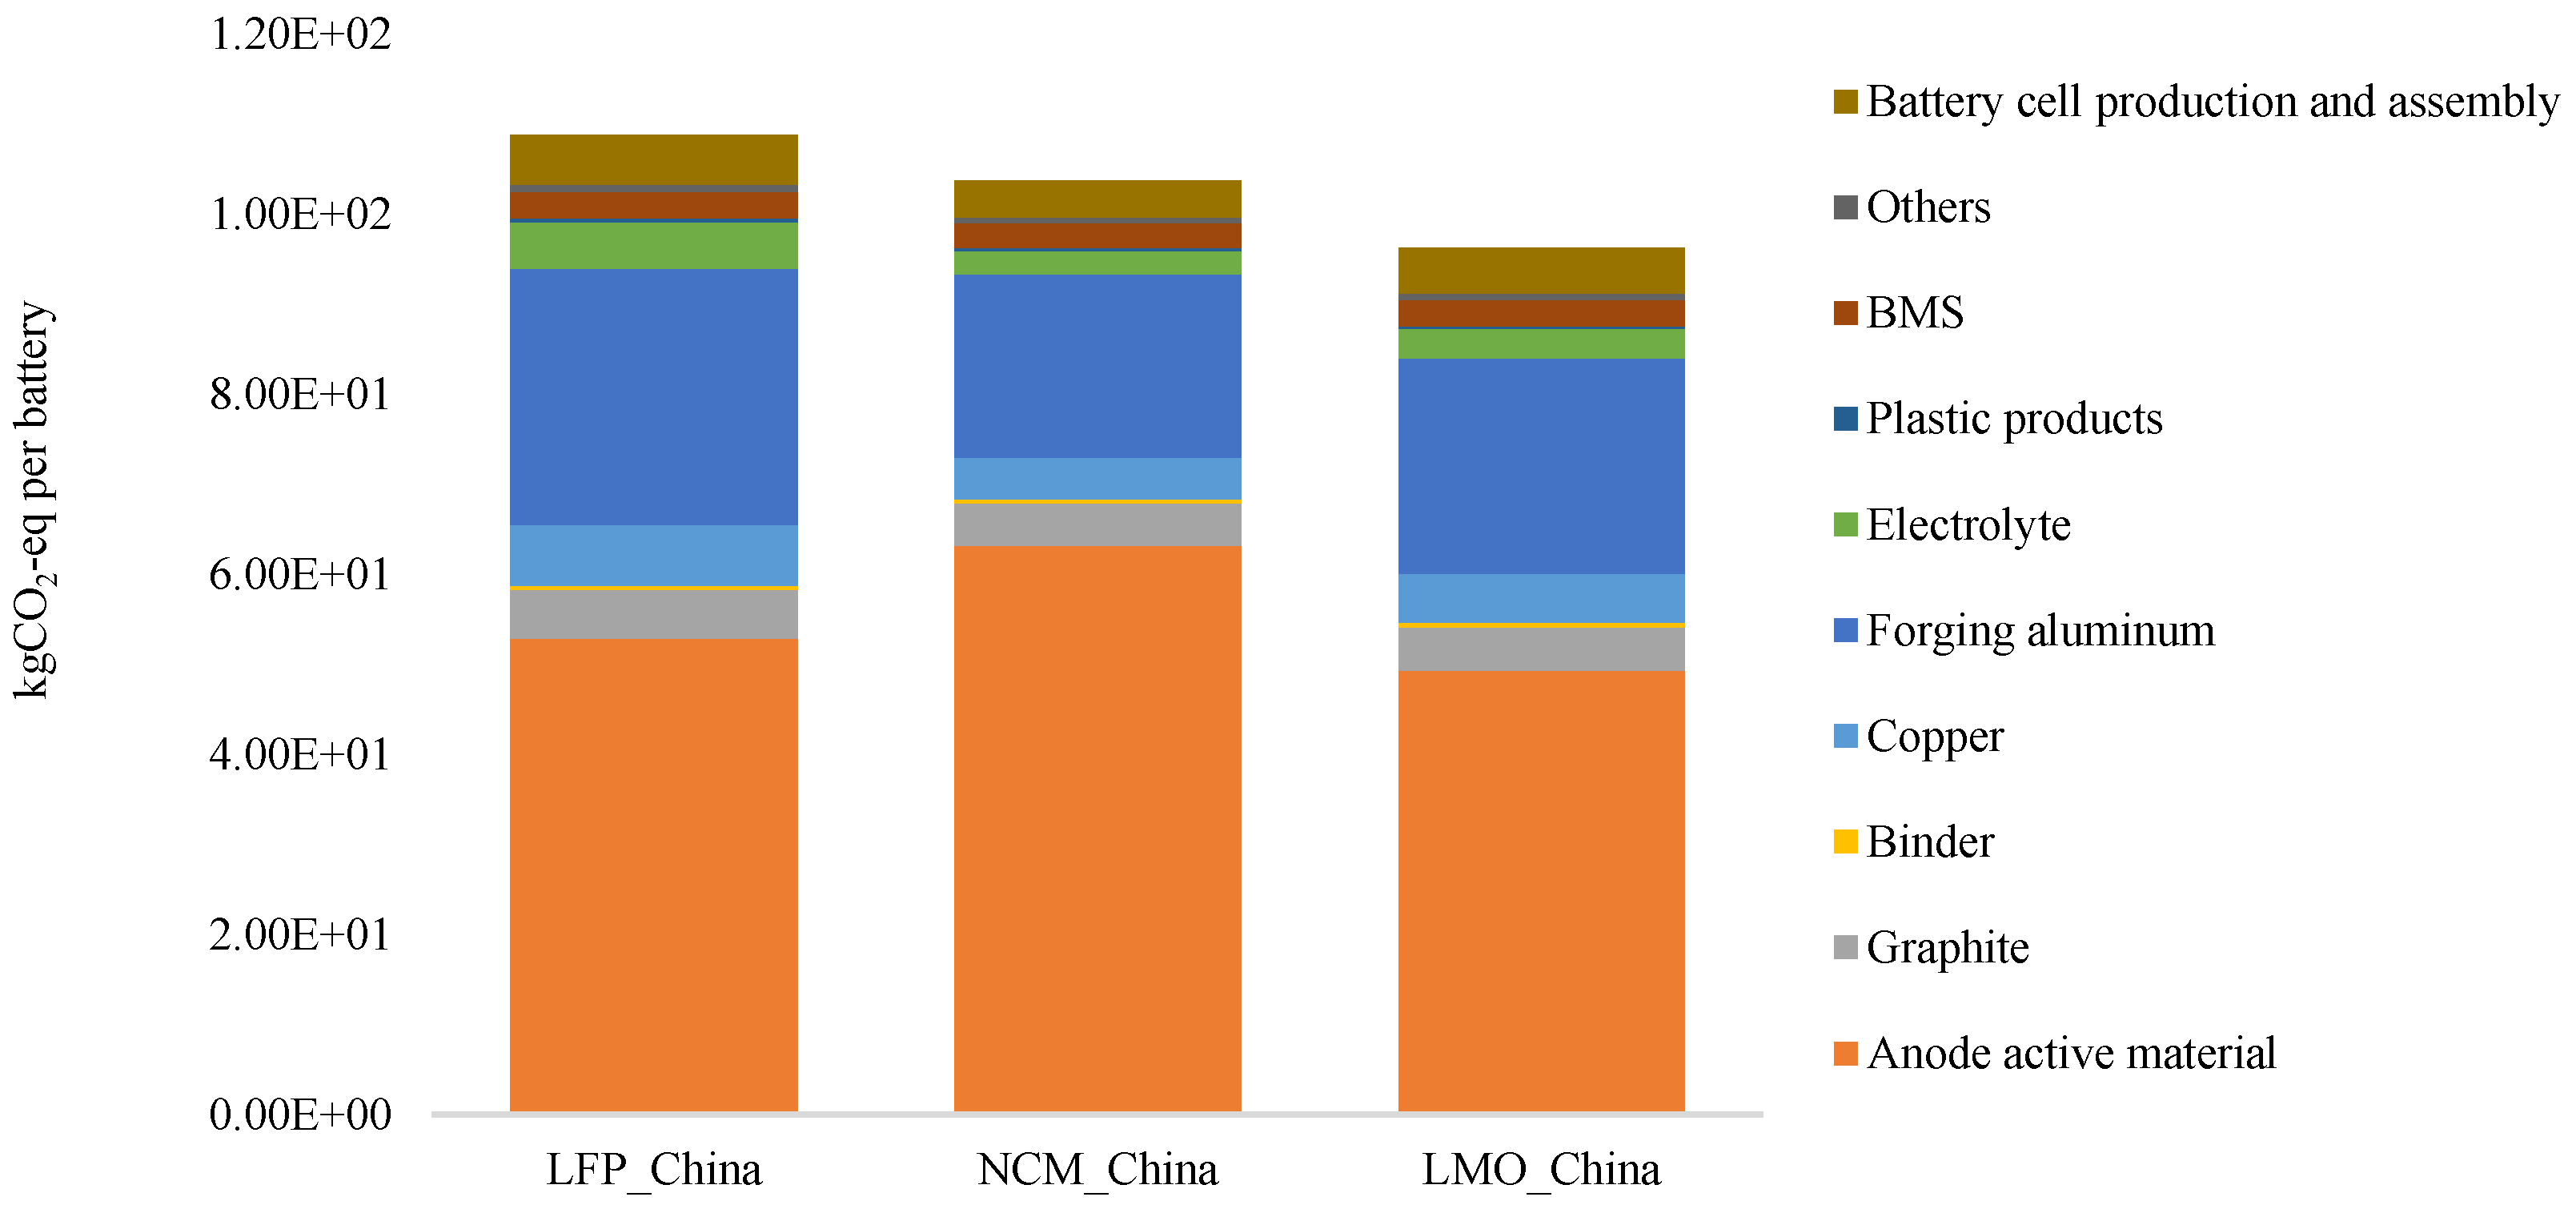
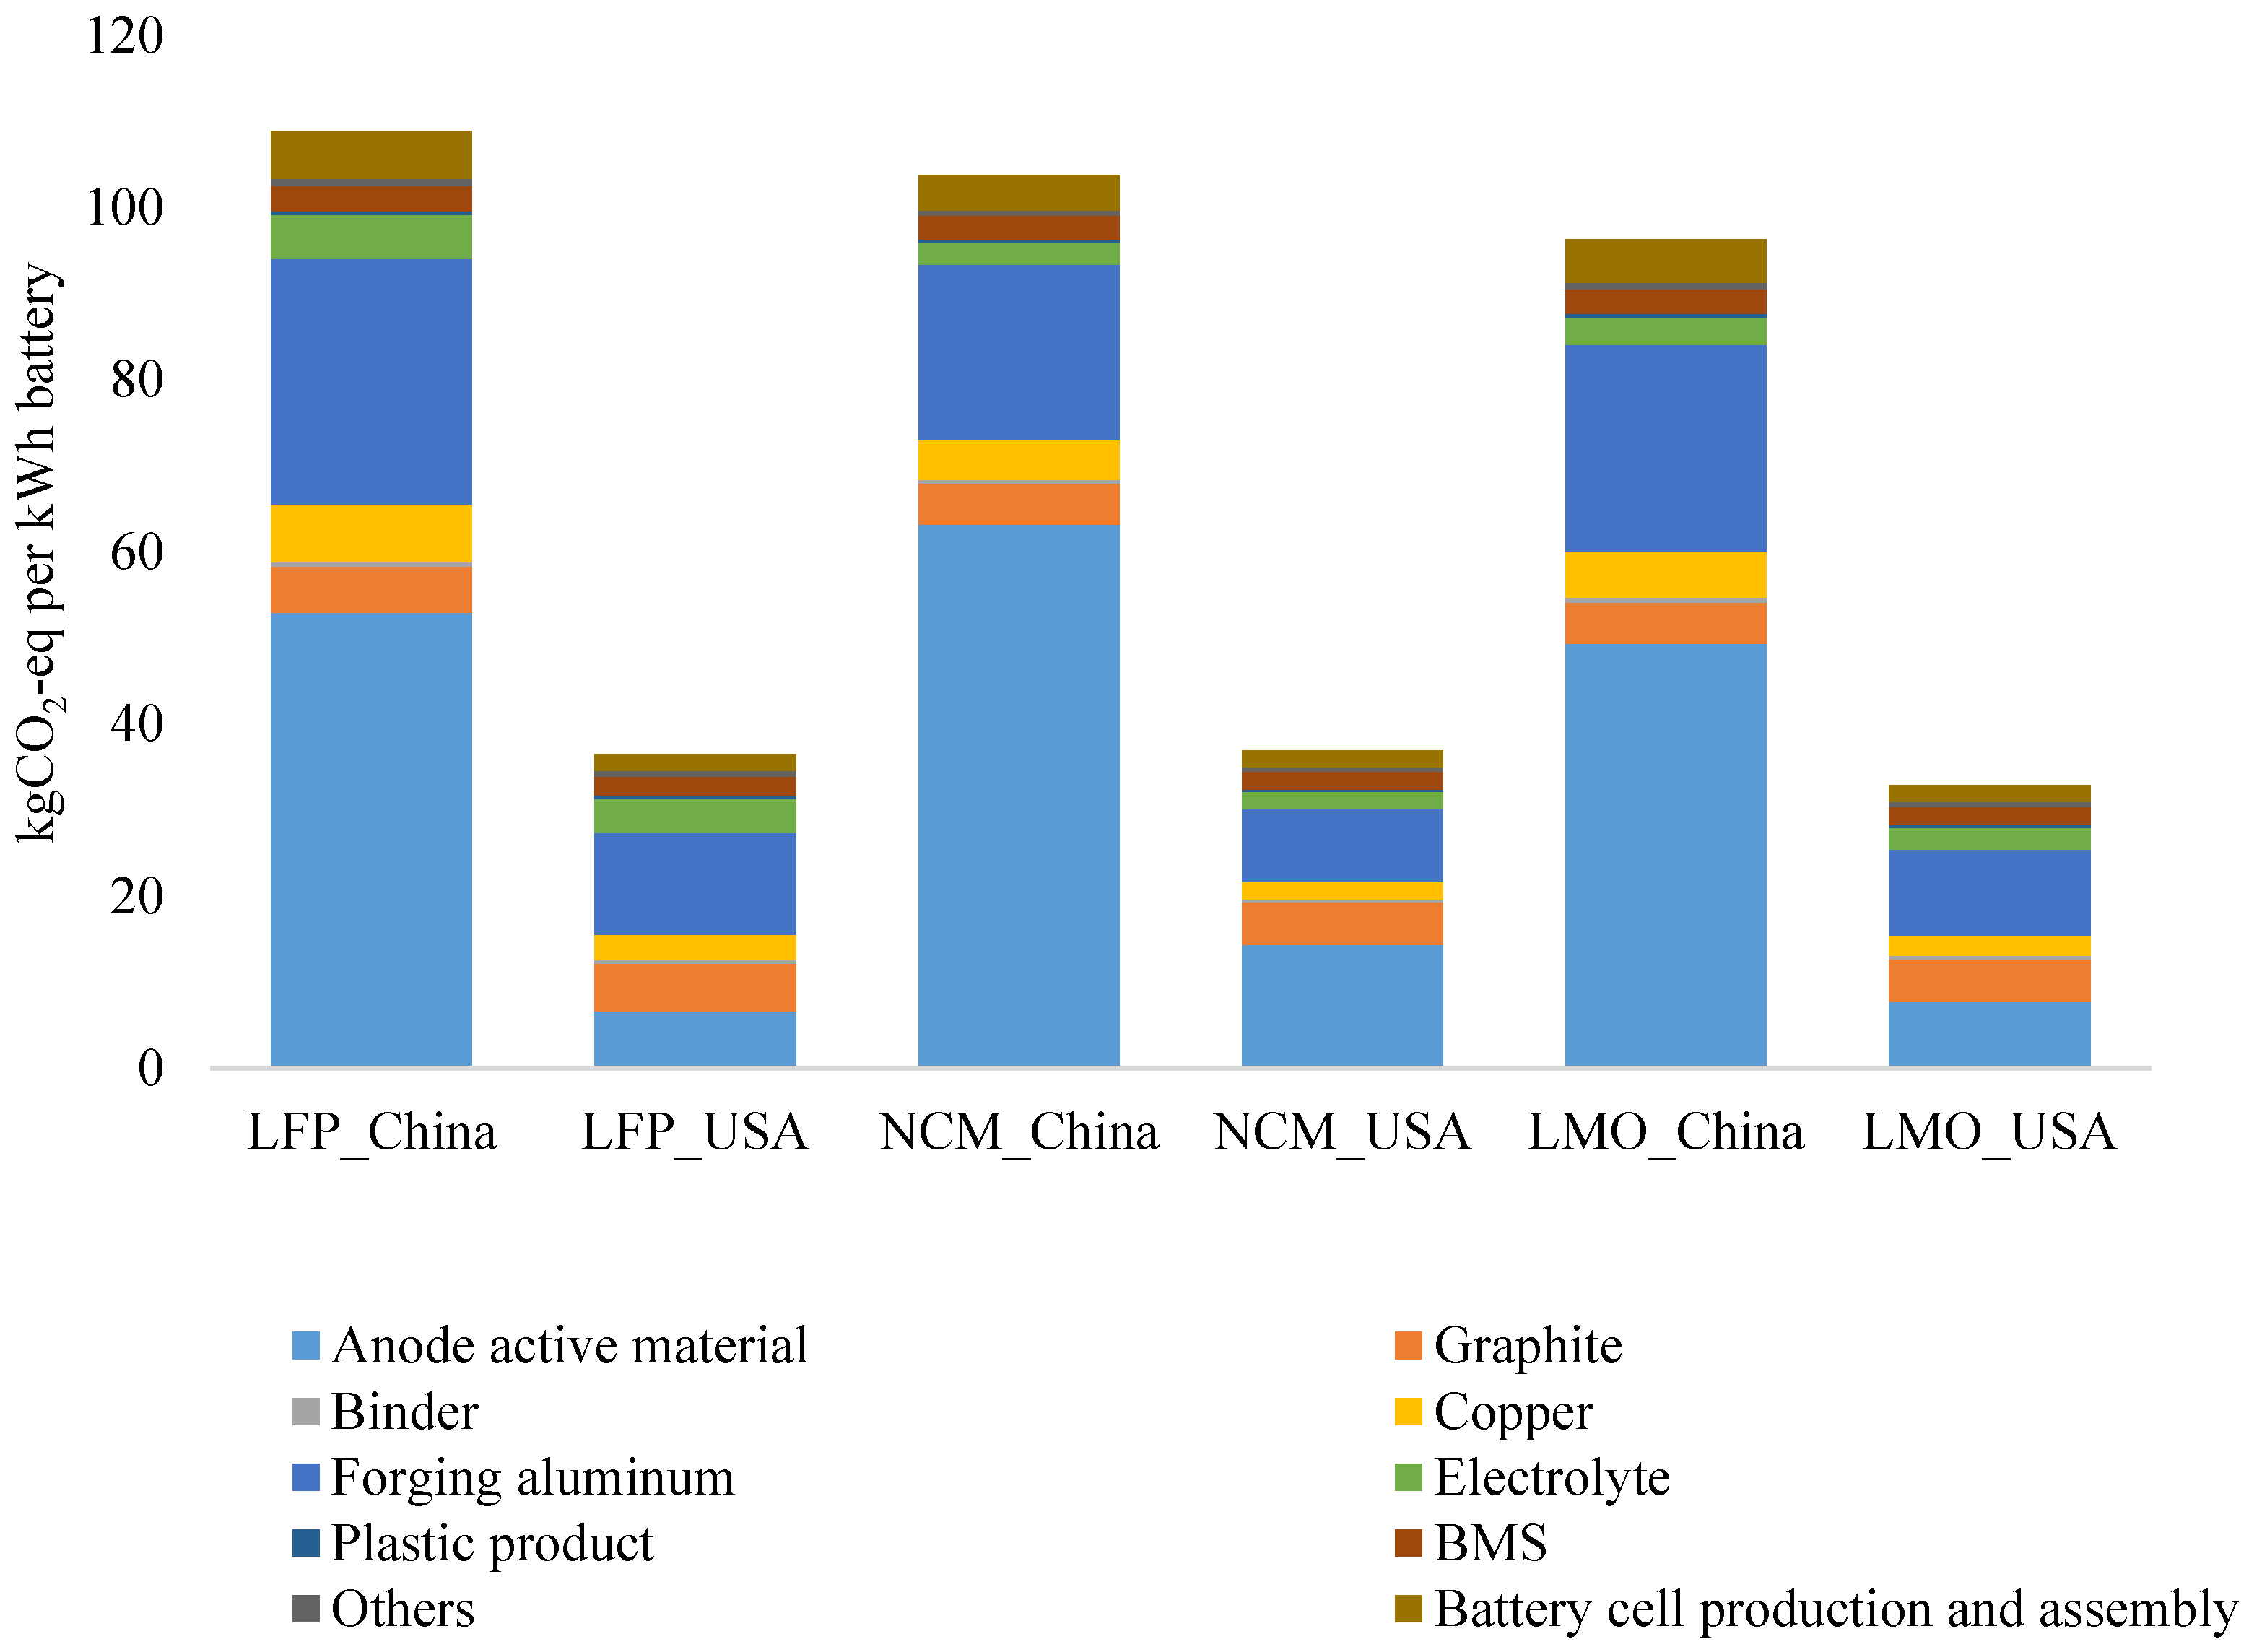
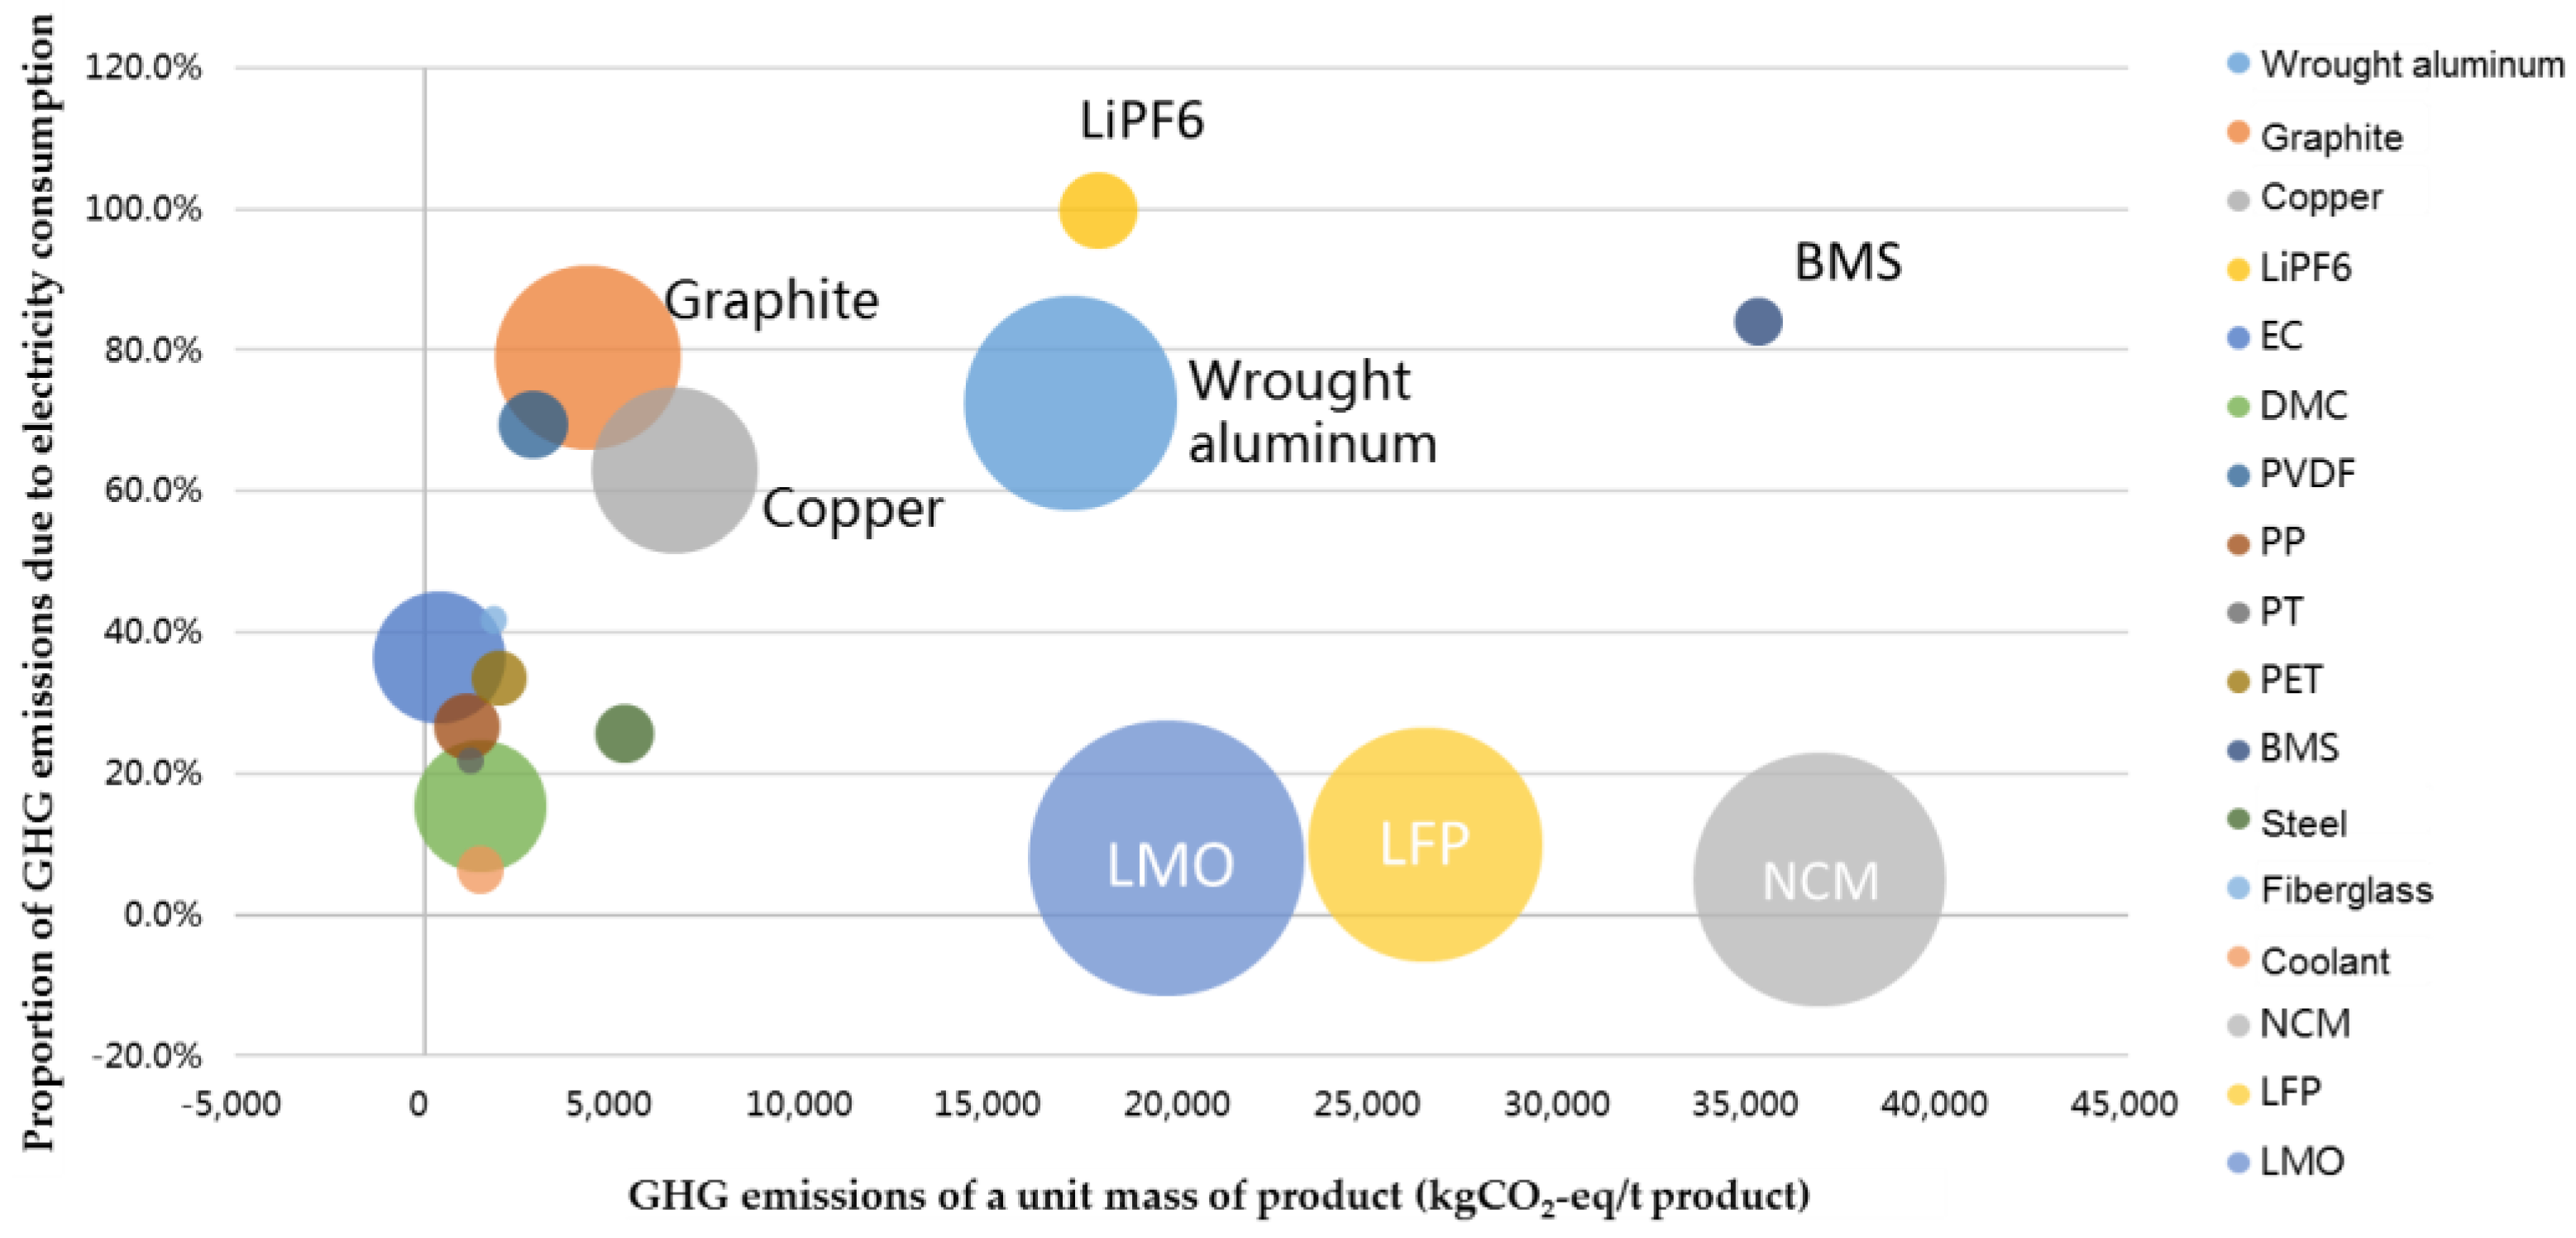
4.1. GHG Emissions Calculation Result

Using the data above, Formula (1) and Formula (2), we calculated that the production of a rated capacity of 28 kWh of LFP, NMC, and LMO vehicle-use lithium ion batteries respectively leads to 3061 kgCO2-eq, 2912 kgCO2-eq, and 2705 kgCO2-eq of GHG emissions. With the same capacity, the production of LMO batteries results in relatively lower GHG emissions, while LFP and NMC batteries, taking the largest share in the Chinese market, generate basically the same amount of GHG emissions. Anode active materials take up the greatest share of the contribution to GHG emissions made by all components of the battery, respectively 48.4%, 60.7% and 51.1%; followed by wrought aluminum, respectively 26.2%, 19.7%, and 24.9% (Figure 3).
What do such high GHG emissions mean? The manufacturing process of a traditional car will emit about 9 t of GHG [20], while LFP batteries emit nearly 3 t. Carrying the 28 kWh LFP battery will increase the GHG emission of the whole car manufacturing process by 30%. While the car consumes electricity throughout the entire use phase and GHG emissions in the manufacturing process account for merely 5% of the whole life cycle, only a limited impact is left for GHG emissions from the battery manufacturing process on the total life cycle.

4.2. Comparison of GHG Emissions between Chinese and American Lithium Ion Batteries

The data on American batteries come from the GREET-2015 Model of the Argonne National Laboratory. Generally speaking, GHG emissions during the manufacturing process of Chinese LFP, NMC, and LMO batteries are respectively 3, 2.8 and 2.9 times greater than those of their American counterparts. Anode active materials and wrought aluminum are the main causes of the differences. Due to complexity of the process and uncertainty of the data, the GHG emissions in production of anode materials show an apparent difference with those in the U.S. The second biggest contribution is from wrought aluminum, particularly in China. As China’s average electrical structure leads to higher GHG emission factors and aluminum production consumes a considerable amount of electricity, it generates a remarkable amount of GHG emissions (Figure 4).

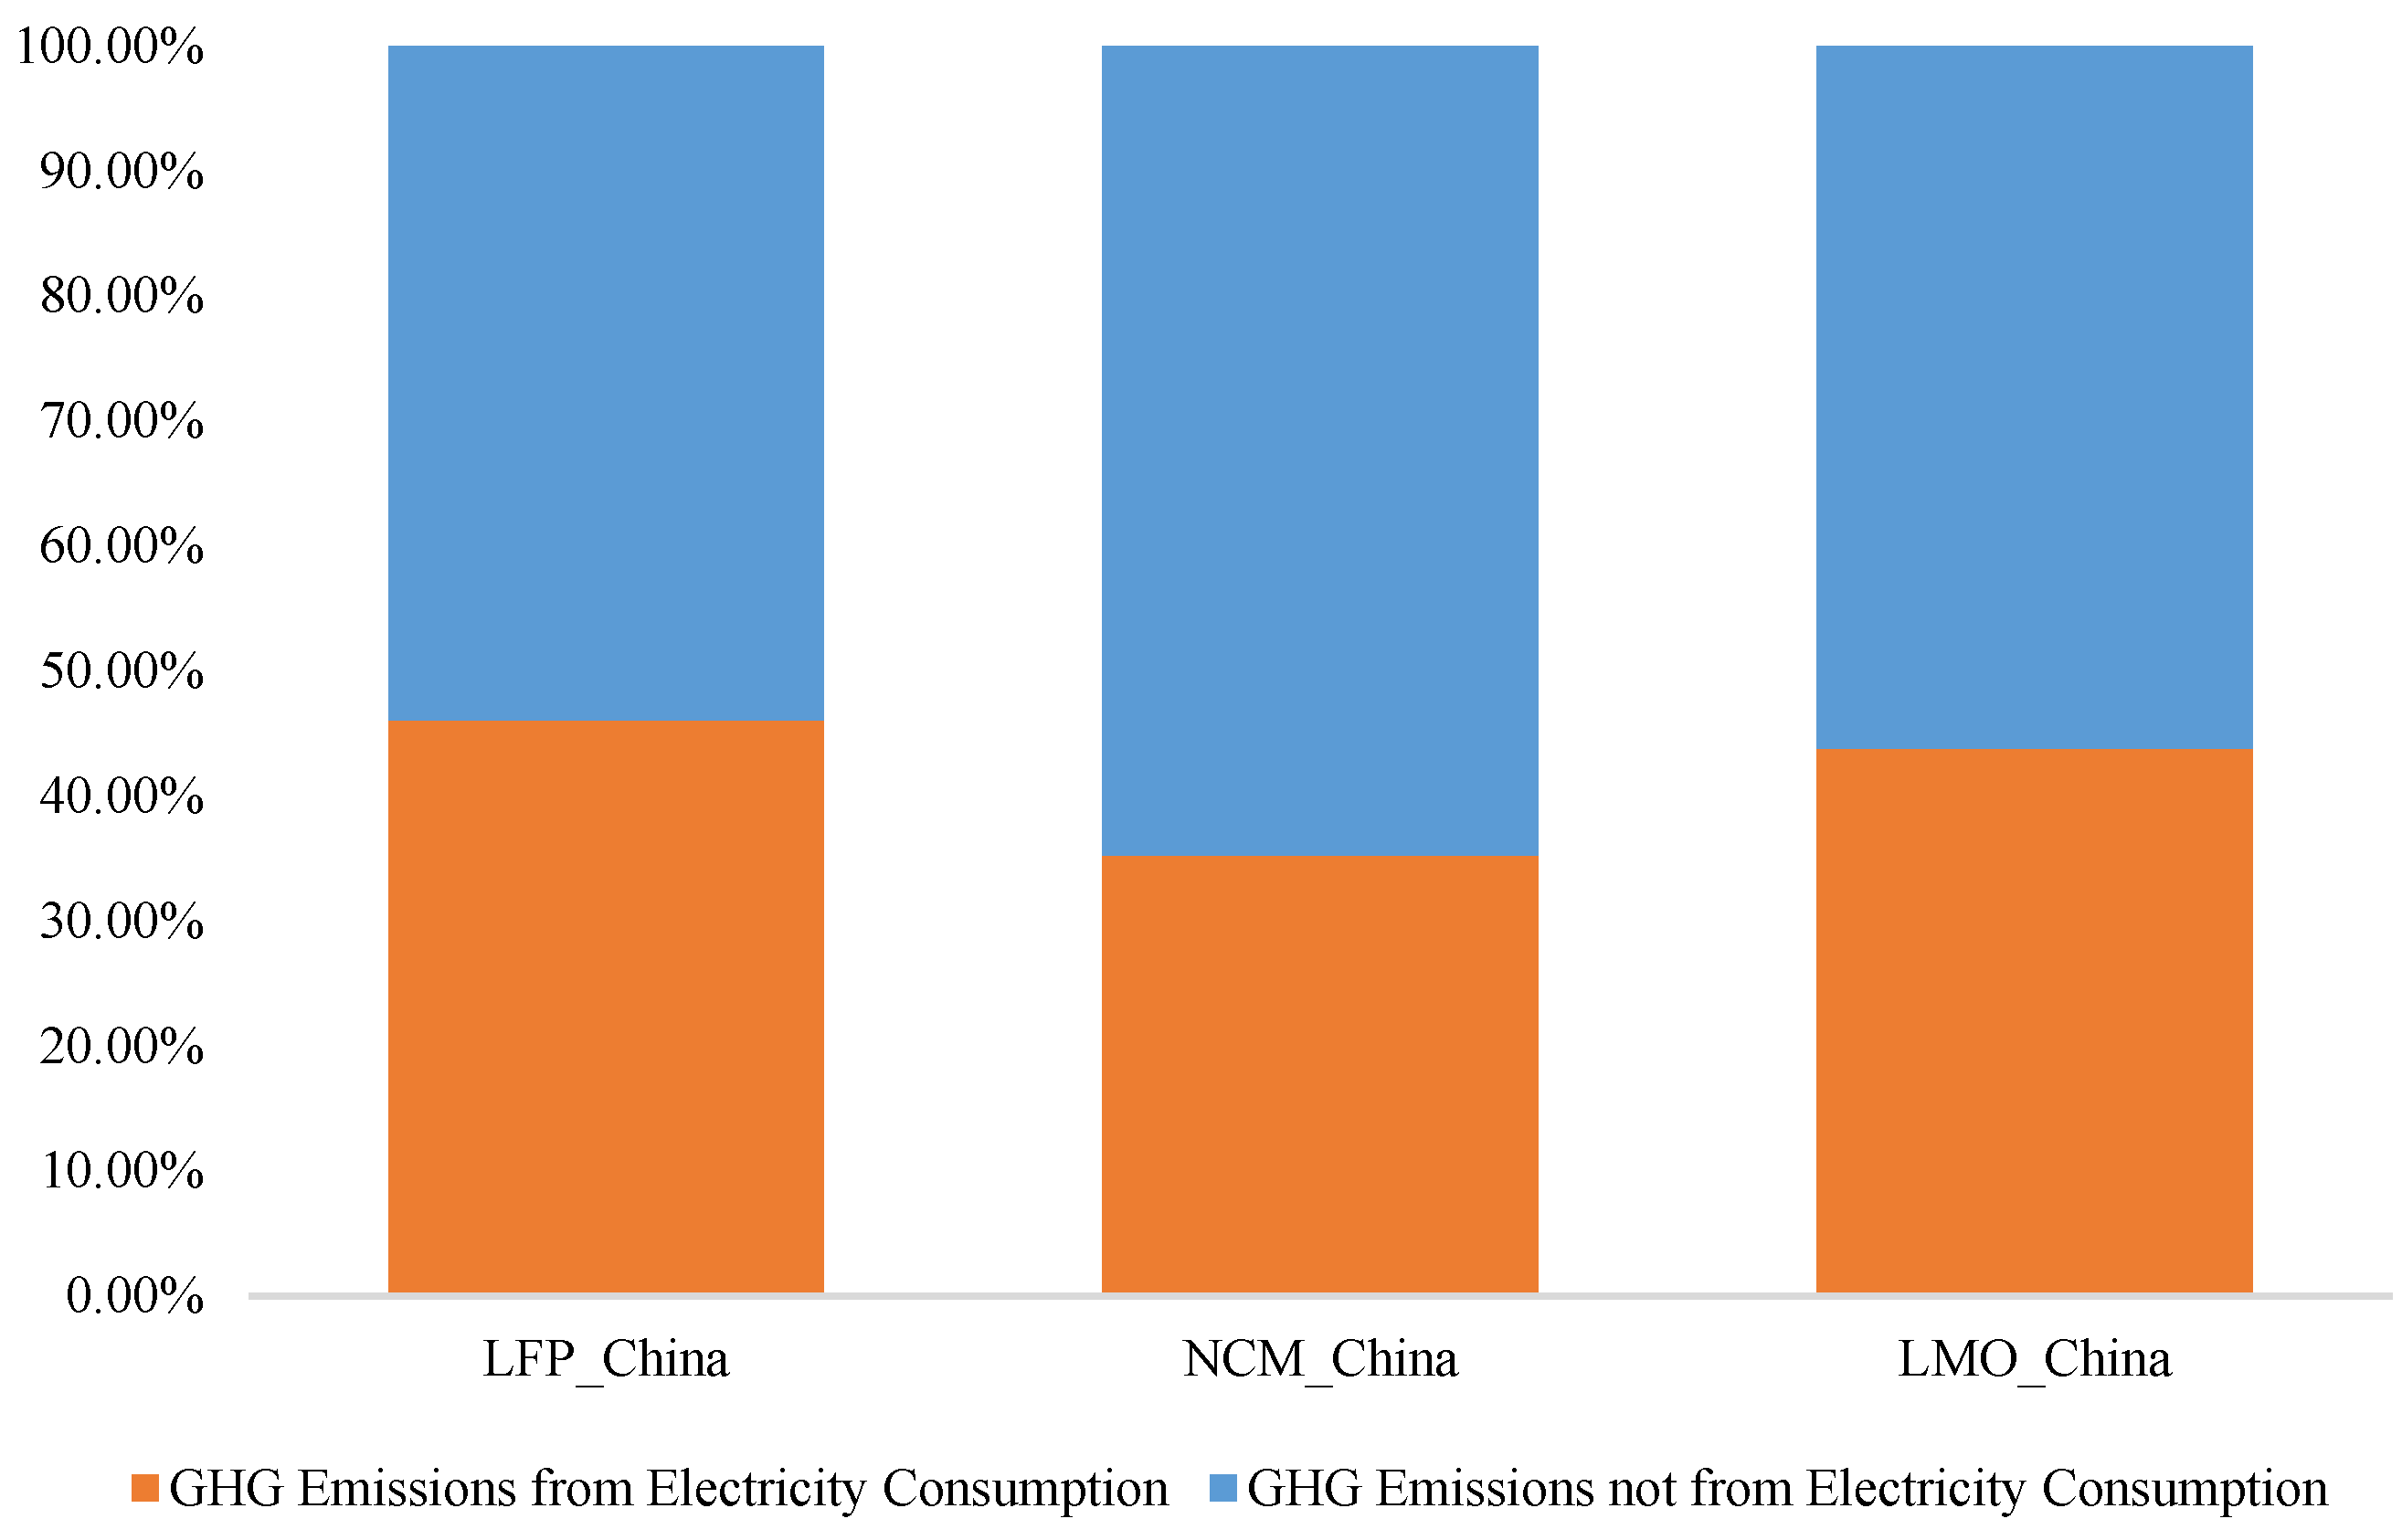
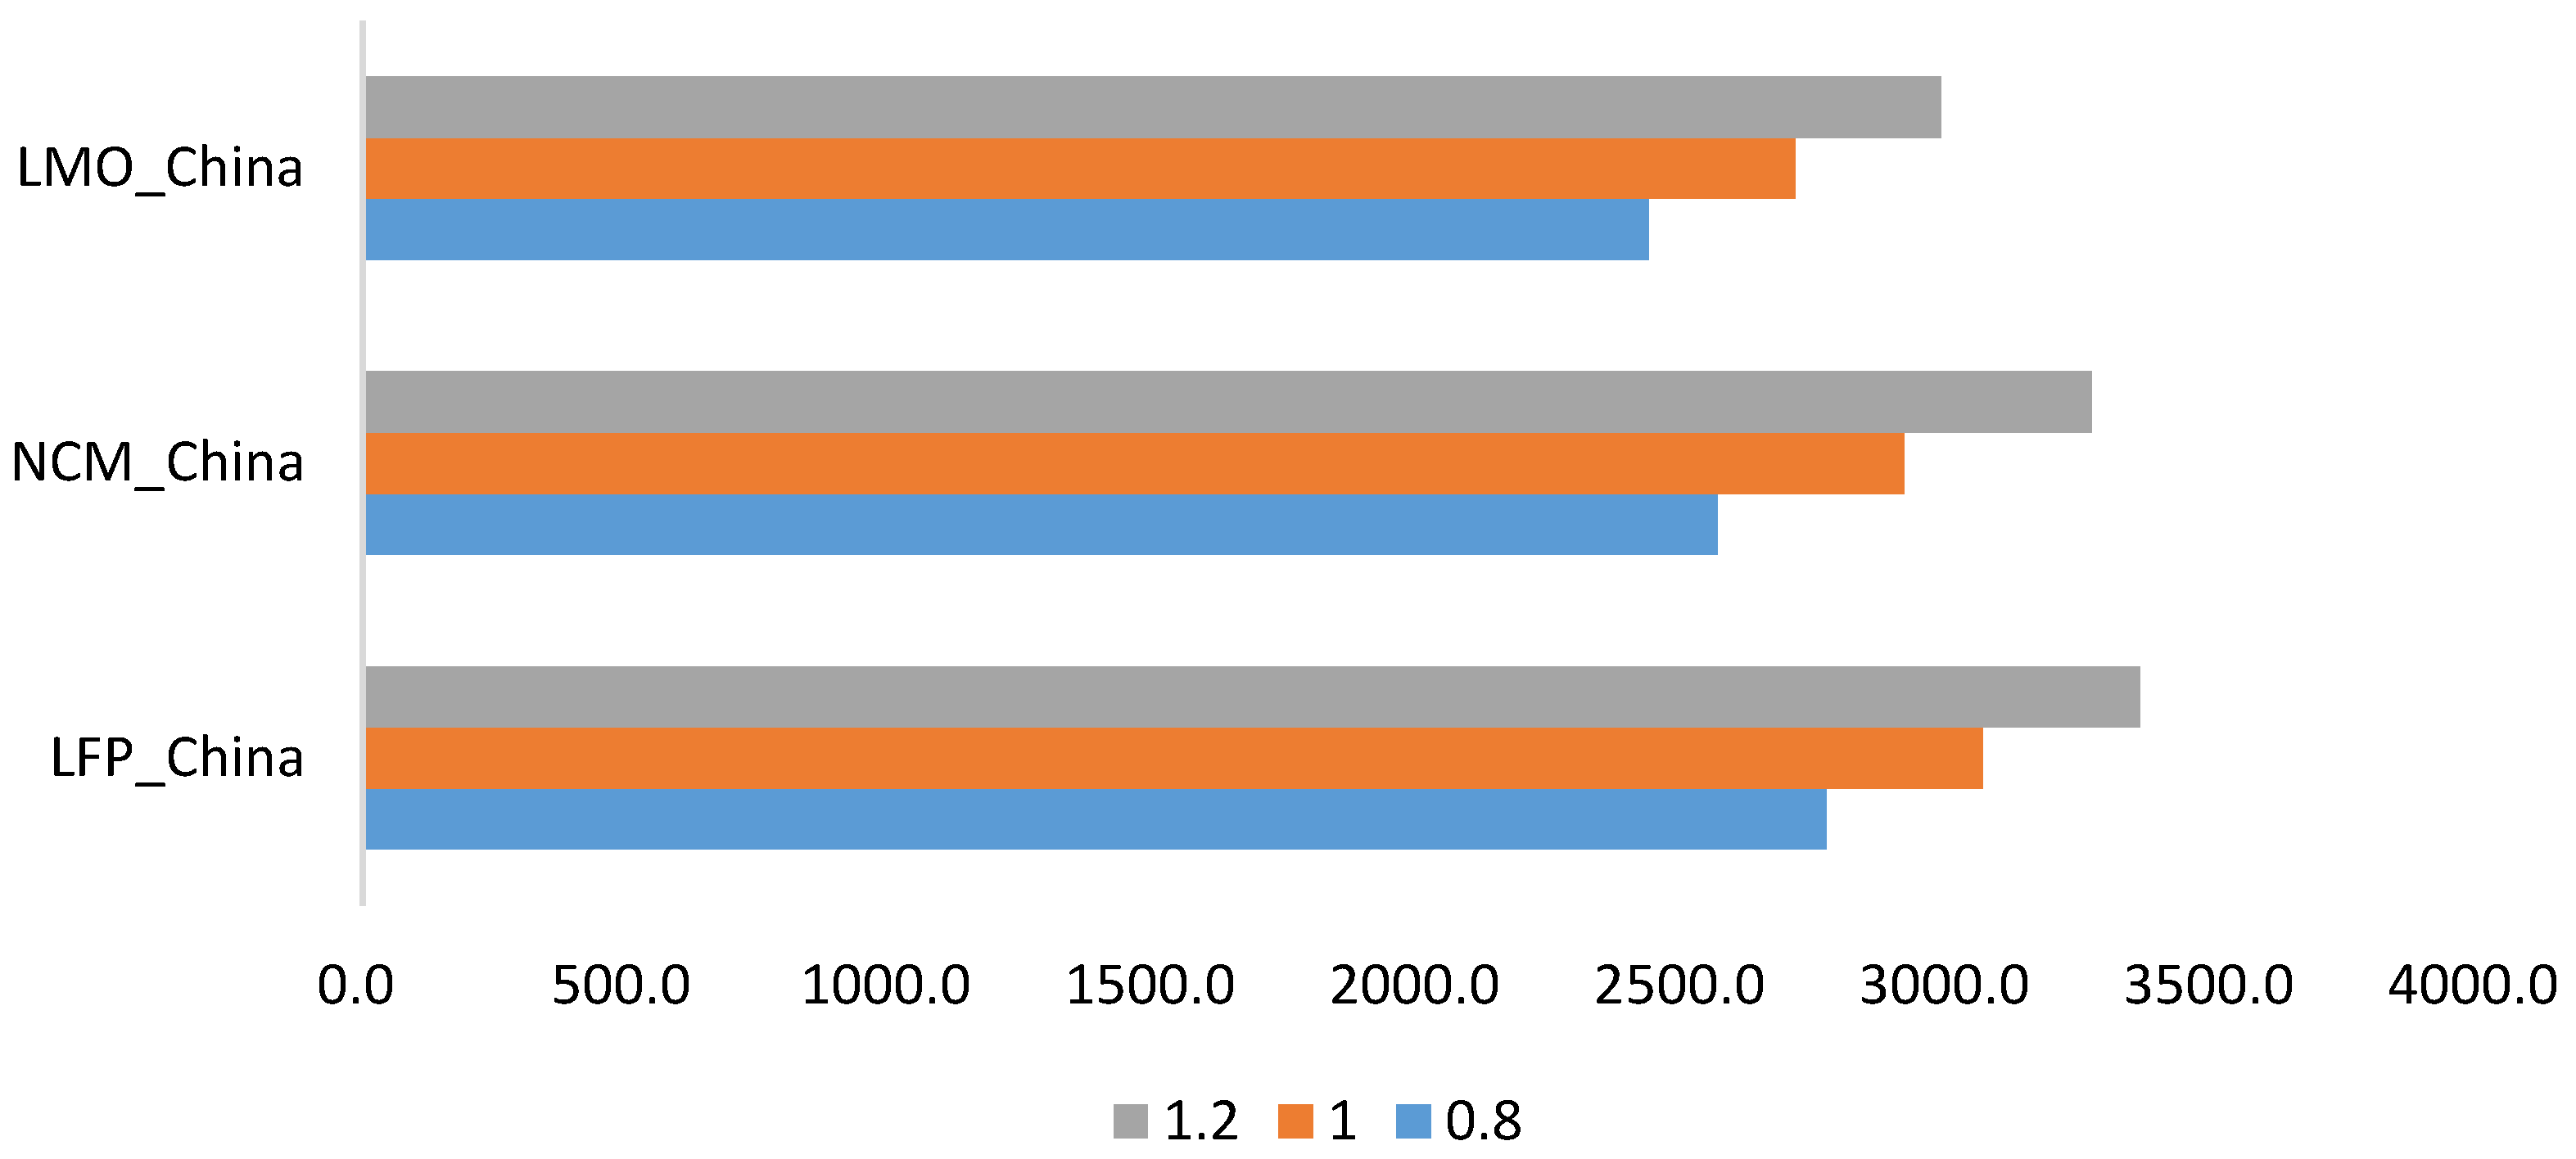
4.3. Exploration of GHG Emission Reduction Potential

Because China’s electricity features higher GHG emission factors, different electrical production structures lead to greatly varying GHG emission factors in different provinces. Therefore, GHG emissions caused by electricity consumption are separated. GHG emissions due to electrical consumption during the manufacturing of LFP, NMC, and LMO batteries respectively account for 46.1%, 35.2%, and 43.8% of the total GHG emissions. Though GHG emissions due to electricity consumption take up a considerable share, an optimized electricity production structure could greatly impact the GHG emissions of batteries (Figure 5).
We have explored the GHG emissions reduction potential of all battery components. In Figure 6, different colors of circles refer to different battery components and their sizes according to their respective mass fractions. While the transverse coordinates stand for the GHG emissions of a unit of mass of the battery component, rising from left to right, the horizontal coordinates signify the proportion of GHG emissions due to electricity consumption of each component, rising from bottom to top. The bigger the circle and the further the position is toward the upper right, the higher the component’s GHG emissions reduction potential. It is obvious that wrought aluminum has the highest potential of GHG emissions reduction. Though positioned at the upper right, the battery management system (BMS) and LiPF6 account for a small mass fraction. Though showing a rather high level of GHG emissions, the three anode active materials currently carry a low potential for GHG emissions reduction due to the limited GHG emissions during the manufacturing process.

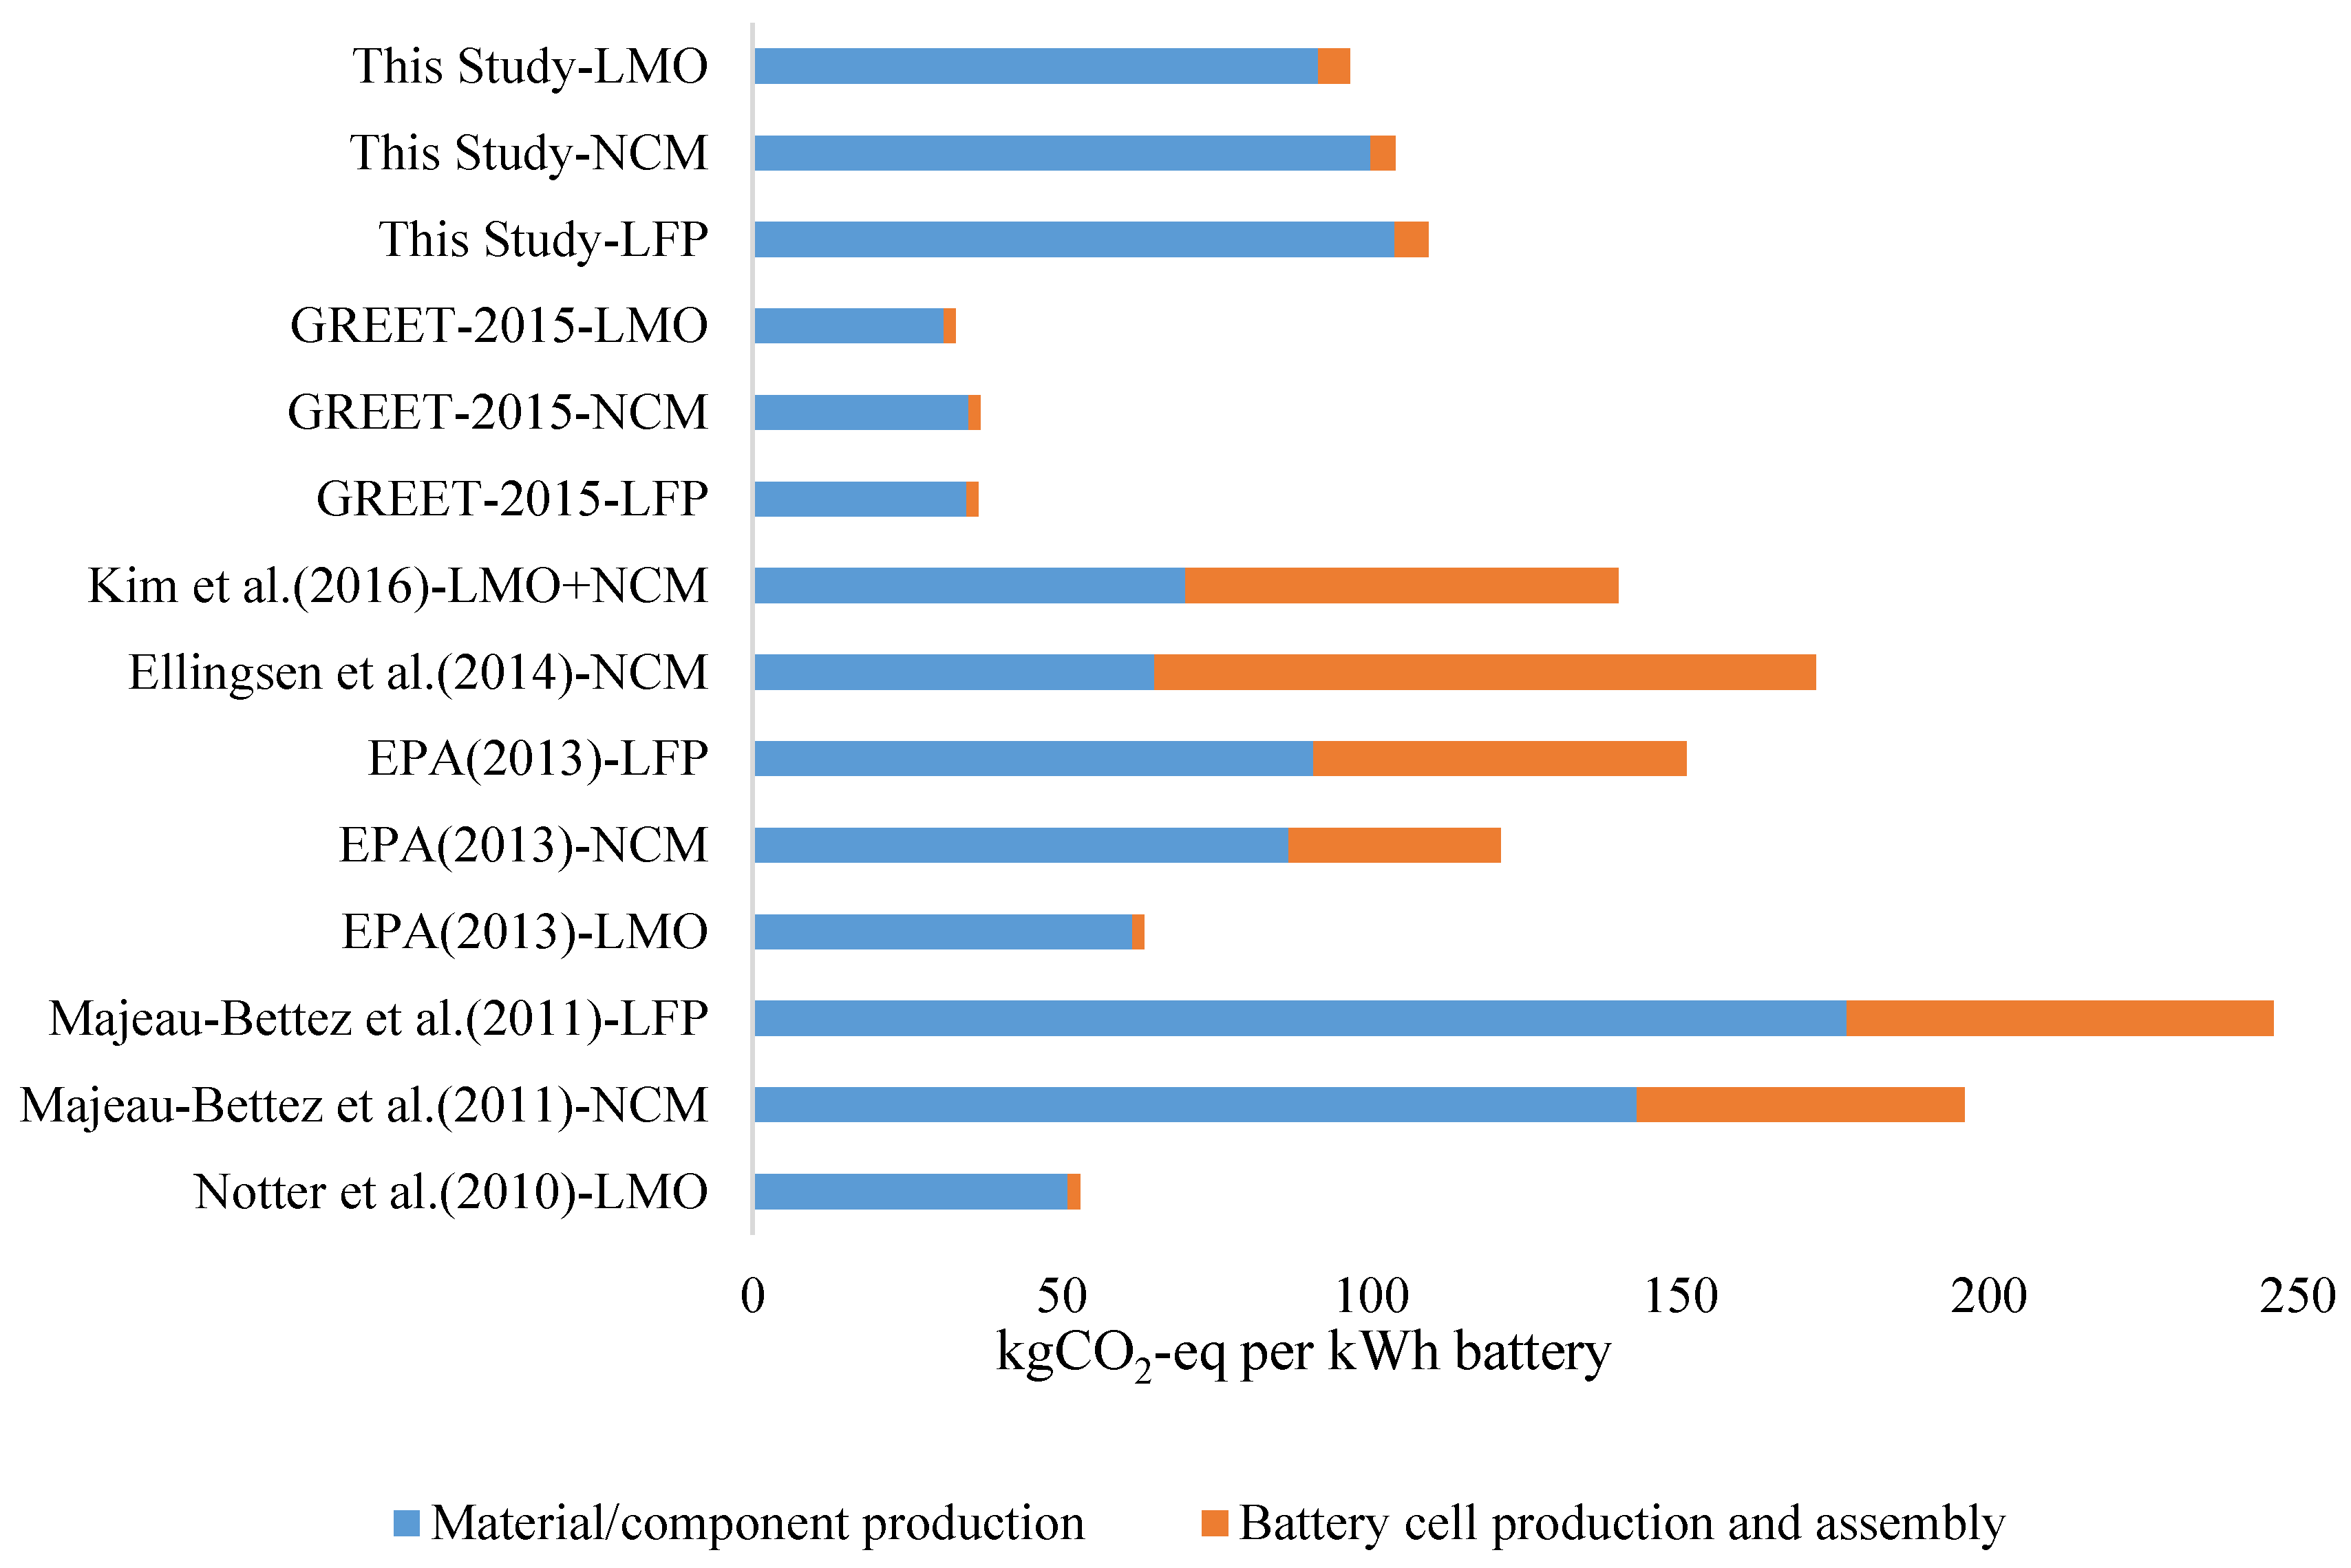
4.4. Result Comparison and Discussion

As lithium ion batteries have been widely used in the EV industry only in recent years, studies on GHG emissions during the battery manufacturing process vary greatly. While research findings from some of the literature are listed in Table 6, the comparison is intuitively shown in Figure 7. The difference in such studies primarily comes from the uncertainty of the battery structure and the GHG emissions in the assembly process. While the difference of physical batteries and battery models is inevitable in different studies, only the gradually improving battery standardization can reduce this uncertainty. The difference in research findings due to different production processes and channels of data acquisition during the battery cell production and assembly process is also worth deeper exploration in the future.
In this research, anode active materials make the largest contribution, far larger than other components, to GHG emissions. Due to limited local data acquisition in the Chinese market, uncertainty of the GHG emissions of anode active materials must be considered. Multiplying by the uncertainty factors of 0.8, 1.0 and 1.2, the GHG emissions of the three batteries show great changes.
As discussed above, there is the issue of uncertainty in the calculation of the GHG emissions. The uncertainties arise from several sources. For example, the BatPac Model, which reflects the U.S. condition, is adopted to calculate battery mass composition in China. There is a certain deviation between the models established respectively in U.S. and China. We also neglected some tiny GHG emission contributors such as non-combustion emissions. Although the issue of uncertainty issue is not quantitatively addressed in this study, the comparison of the results from different studies in Figure 7 and the parametric analysis in Figure 8 can show some general implications for the uncertainties. The issue of uncertainty could be further explored in future study.

5. Summary and Prospects

This study focused on the GHG emissions during the manufacturing of LFP, NMC, and LMO batteries, and established a GHG emissions model for lithium ion batteries in the Chinese market as based on the LCA method. As shown in the study findings, production of 28 kWh of LFP, NMC, and LMO batteries in China results in the respective GHG emissions of 3061 kgCO2-eq, 2912 kgCO2-eq, and 2705 kgCO2-eq, with LMO batteries emitting the least. Carrying the 28 kWh LFP battery will increase the GHG emissions of the whole car manufacturing process by 30%. While the car consumes electricity throughout the entire use phase and GHG emissions in the manufacturing process account for merely 5% of the whole life cycle, the impact of GHG emissions in the battery manufacturing process is not significant on the total life cycle. By battery composition, anode active materials and wrought aluminum make the greatest contribution to the GHG emissions, while by process energy, GHG emissions from electricity consumption take up a larger share. Chiefly due to China’s higher GHG emission factor and production of anode active materials, GHG emissions from the manufacturing of lithium ion batteries in China are some three times greater than those in the U.S. From exploration of the GHG emissions reduction potential of all battery components implemented in this study, improving the electricity production structure and optimizing the production process of anode active materials can significantly lower the GHG emissions during the manufacturing of lithium ion batteries in China. Additionally, the uncertainty in battery models and data was compared and analyzed in the study in combination with relevant literature. Recycling and reuse of the batteries was not discussed in this study, and will be considered in a future study. Battery materials specified in this study are disposable.

Acknowledgments

This study was sponsored by the National Natural Science Foundation of China (71403142, 71690241, 71572093), the Beijing Natural Science Foundation (9162008), and the State Key Laboratory of Automotive Safety and Energy (ZZ2016-024).

Author Contributions

Han Hao, Zongwei Liu and Fuquan Zhao designed the whole study; Han Hao and Shuhua Jiang conducted data collection, modeling, and results analysis; Zhexuan Mu refined the analysis based on previous work; Zhexuan Mu, Shuhua Jiang and Han Hao wrote the paper.

Conflicts of Interest

The authors declare no conflict of interest. The founding sponsors had no role in the design of the study; in the collection, analyses, or interpretation of data; in the writing of the manuscript, and in the decision to publish the results.

References

  1. China Automotive Technology Research Center; Beijing National Energy Information Technology Co., Ltd.; Energy Saving and New Energy Automobile Yearbook Office (Eds.) 2015 Energy Saving and New Energy Automotive Industry Yearbook; China Economic Publishing House: Beijing, China, 2015. [Google Scholar]
  2. China Automotive Industry Association; China Automotive Technology Research Center; Toyota Auto Body Co. (Eds.) Annual Report on the Development of China’s Automobile Industry; Social Sciences Academic Press: Beijing, China, 2016. [Google Scholar]
  3. Notter, D.A.; Gauch, M.; Widmer, R.; Wager, P.; Stamp, A.; Zah, R.; Althaus, H.J. Contribution of Li-ion batteries to the environmental impact of electric vehicles. Environ. Sci. Technol. 2010, 44, 6550–6556. [Google Scholar] [CrossRef] [PubMed]
  4. Zackrisson, M.; Avellán, L.; Orlenius, J. Life cycle assessment of lithium-ion batteries for plug-in hybrid electric vehicles—Critical issues. J. Clean. Prod. 2010, 18, 1519–1529. [Google Scholar] [CrossRef]
  5. Majeau-Bettez, G.; Hawkins, T.R.; Strømman, A.H. Life cycle environmental assessment of lithium-ion and nickel metal hydride batteries for plug-in hybrid and battery electric vehicles. Environ. Sci. Technol. 2011, 45, 4548–4554. [Google Scholar] [CrossRef] [PubMed]
  6. Ellingsen, L.A.W.; Majeau-Bettez, G.; Singh, B.; Srivastava, A.K.; Valøen, L.O.; Strømman, A.H. Life cycle assessment of a lithium-ion battery vehicle pack. J. Ind. Ecol. 2014, 18, 113–124. [Google Scholar] [CrossRef]
  7. Dunn, J.B.; James, C.; Gaines, L.G.; Gallagher, K.; Dai, Q.; Kelly, J.C. Material and Energy Flows in the Production of Cathode and Anode Materials for Lithium Ion Batteries; Argonne National Laboratory (ANL): Argonne, IL, USA, 2014. [Google Scholar]
  8. Dunn, J.B.; Gaines, L.; Barnes, M.; Wang, M.; Sullivan, J. Material and Energy Flows in the Materials Production, Assembly, and End-of-Life Stages of the Automotive Lithium-Ion Battery Life Cycle; Argonne National Laboratory (ANL): Lemont, IL, USA, 2012. [Google Scholar]
  9. Amarakoon, S.; Smith, J.; Segal, B. Application of Life-Cycle Assessment to Nanoscale Technology: Lithium-Ion Batteries for Electric Vehicles. Available online: https://trid.trb.org/view.aspx?id=1300236 (accessed on 22 March 2017).
  10. Kim, H.C.; Wallington, T.J.; Arsenault, R.; Bae, C.; Ahn, S.; Lee, J. Cradle-to-Gate Emissions from a Commercial Electric Vehicle Li-Ion Battery: A Comparative Analysis. Environ. Sci. Technol. 2016, 50, 7715–7722. [Google Scholar] [CrossRef] [PubMed]
  11. Hendrickson, T.P.; Kavvada, O.; Shah, N.; Sathre, R.; Scown, C.D. Life-cycle implications and supply chain logistics of electric vehicle battery recycling in California. Environ. Res. 2015. [Google Scholar] [CrossRef]
  12. Wang, Q. Comparative Analysis of Cathode Materials Based on Life Cycle Assessment. Ph.D. Dissertation, South China University of Technology, Guangzhou, China, 2012. [Google Scholar]
  13. Lu, Q. Life Cycle Analysis and Evaluation of Electric Vehicle Battery. Ph.D. Dissertation, Jilin University, Changchun, China, 2014. [Google Scholar]
  14. Bo, C. Synthesis and Environmental Analysis of Lithium Ion Battery Materials Based on Life Cycle Assessment. Ph.D. Dissertation, Beijing Institute of Technology, Beijing, China, 2015. [Google Scholar]
  15. Zhang, J.; Lu, L.; Li, Z. Key Technologies and Fundamental Academic Issues for Traction Battery Systems. Auto. Saf. Energy 2012, 2, 87–104. [Google Scholar]
  16. IAI. Primary Aluminum Production. Available online: http://www.world-aluminium.org/statistics (accessed on 20 March 2016).
  17. Zeng, G.; Yang, J.; Song, X. Analysis of Copper Smelting Energy Consumption and Carbon Emission Scenarios Based on the Life Cycle Perspective. China Popul. Resour. Environ. 2012, 22, 46–50. [Google Scholar]
  18. Sullivan, J.L.; Burnham, A.; Wang, M. Energy-Consumption and Carbon-Emission Analysis of Vehicle and Component Manufacturing; Argonne National Laboratory (ANL): Lemont, IL, USA, 2010. [Google Scholar]
  19. Hao, H.; Geng, Y.; Hang, W. GHG Emissions from Primary Aluminum Production in China: Regional Disparity and Policy Implications. Appl. Energy 2015, 166, 264–272. [Google Scholar] [CrossRef]
  20. Hao, H.; Qiao, Q.; Liu, Z.; Zhao, F.; Chen, Y. Comparing the Life Cycle CO2 Emissions from Vehicle Production in China and the US: Implications for Targeting the Reduction Opportunities. Clean. Technol. Environ. Policy 2016. [Google Scholar] [CrossRef]
  21. Chen, Z. Life Cycle Ecological Benefit Evaluation of Automobile Parts. Ph.D. Dissertation, Hunan University, Changsha, China, 2014; pp. 42–48. [Google Scholar]
  22. National Bureau of Statistics of China. Annual Provincial Electricity Generation. Available online: http://data.stats.gov.cn/easyquery.htm?cn=C01 (accessed on 30 March 2016).
  23. Ma, C.; Li, S.; Ge, Q. Research on greenhouse gas emission factors of provincial electricity grid. Resou. Sci. 2014, 5, 1005–1012. [Google Scholar]
  24. National Development and Reform Commission. Low Carbon Development and Provincial Greenhouse Gas Inventory Preparation Training Materials. Available online: http://qhs.ndrc.gov.cn/gzdt/201403/t20140328_604827.html (accessed on 20 March 2016).
  25. Intergovernmental Panel on Climate Change (IPCC). 2006 IPCC Guidelines for National Greenhouse Gas Inventories. Available online: http://www.ipcc-nggip.iges.or.jp/public/2006gl (accessed on 20 March 2016).
Figure 1. Study Framework.
Sustainability 09 00504 g001
Figure 2. System Boundary.
Sustainability 09 00504 g002
Figure 3. Comparison of GHG Emission Strengths of the Manufacturing of Three Commonly Used Lithium Ion Batteries.
Sustainability 09 00504 g003
Figure 4. Comparison of GHG Emissions by Chinese and American Lithium Ion Batteries.
Sustainability 09 00504 g004
Figure 5. Proportion of GHG Emissions from Electricity Consumption.
Sustainability 09 00504 g005
Figure 6. GHG Emissions Reduction Potential of Different Battery Components.
Sustainability 09 00504 g006
Figure 7. Comparison among Research Findings.
Sustainability 09 00504 g007
Figure 8. Parametric Analysis of Anode Active Materials.
Sustainability 09 00504 g008
Table 1. Setup of Lithium Ion Battery Parameters.
Battery TypeLFPNMCLMO
Rated Capacity (kWh)282828
Battery Weight (kg)230170210
Battery’s Energy Density (Wh/kg)122165133
Qty. of Battery Cells1009696
Table 2. Battery Mass Composition.
Battery ComponentsLFPNMCLMO
Anode Active Materials24.4%28.2%33.6%
Graphite15.2%18.3%14.7%
Binder2.1%2.4%2.5%
Copper12.4%11.4%10.9%
Wrought aluminum20.3%19.7%18.7%
Electrolyte: LiPF62.7%1.9%1.9%
Electrolyte: EC7.8%5.4%5.4%
Electrolyte: DMC7.8%5.4%5.4%
Plastic: PP1.9%1.7%1.7%
Plastic: PT0.3%0.3%0.3%
Plastic: PET1.3%1.2%1.2%
Steel1.5%1.4%1.4%
Fiberglass0.3%0.4%0.3%
Coolant: Glycol1.0%1.0%0.9%
Battery Management System(BMS)1.0%1.3%1.1%
Table 3. Source of Energy Consumption/Greenhouse Gas (GHG) Emission Data of the Battery Manufacturing Process.
MaterialData Source
Anode Active Material (LFP, NMC, LMO)[12]
GraphiteCarbonization[16]
GraphitizationGREET-2015
BinderGREET-2015
CopperProduction of Copper Ingot[17]
Brushing[18]
Wrought aluminumProduction of Aluminum Ingot[19]
Punching (Cold Rolling)GREET-2015
ExtrudingGREET-2015
Electrolyte: LiPF6, EC, DMCGREET-2015
Plastic: PP, PT, PETGREET-2015
Steel[20]
Glass fiberGREET-2015
Coolant: GlycolGREET-2015
Battery Management SystemGREET-2015
Single Cell Production and Battery Assembly[13]
Note: When the data come from GREET-2015 (The Greenhouse Gases, Regulated Emissions, and Energy Use in Transportation Model of the Argonne National Laboratory), the energy consumption data adopt those in GREET-2015, and the GHG emission factor of the energy is localized.
Table 4. GHG Emissions of Three Anode Materials* [12].
MaterialRaw Material ExploitationRaw Material TransportationAnode Material Production
L i M n 2 O 4 11,6007967200
Li N i 1 / 3 C o 1 / 3 M n 1 / 3 O 2 18,20052218,100
Li F e P O 4 13,200113012,100
* Unit: kgCO2/t-Anode Material.
Table 5. Commonly Seen GHG Emission Factors in China.
Process EnergyGHG Emission Factor
(g-CO2/MJ, g-CO2/kWh)
Data Source
Coal94.8Chen Yisong, 2014 [21]
Electricity834.5NBSC, 2016 [22], Ma Cuimei, et al., 2014 [23]
Natural Gas63.5Chen Yisong, 2014 [21]
Coke 1105.9NDRC, 2014 [24]; IPCC, 2006 [25]
Residual Oil89.3Chen Yisong, 2014 [21]
Gasoline82.0Chen Yisong, 2014 [21]
Diesel79.9Chen Yisong, 2014 [21]
COG144.4IPCC, 2006 [25]
BFG1260.0IPCC, 2006 [25]
1 Coke, LPG and BFG are generated during the production of coke. Although IPCC only specifies emission factors during the use phase, they could be used for the whole life cycle.
Table 6. Summary of Literature Research Findings.
ReferenceBattery TypeBattery Mass (kg)Battery Capacity (kWh)GHG Emission (kgCO2-eq/kWh Battery)
Material/Part ProductionBattery Cell Production and AssemblyTotal
Notter et al. (2010) [3]LMO30034.251253
Majeau-Bettez et al. (2011) [5]NMC--14353196
Majeau-Bettez et al. (2011) [5]LFP--17769246
EPA (2013) [9]LMO--61.51.963.4
EPA (2013) [9]NMC--86.734.3121
EPA (2013) [9]LFP--90.860.2151
Ellingsen et al. (2014) [6]NMC25326.665107172
Kim et al. (2016) [10]LMO + NMC303247070140
GREET-2015LFP2302834.61.936.5
GREET-2015NMC17028351.936.9
GREET-2015LMO21028311.932.9
This StudyLFP23028103.85.5109.3
This StudyNMC1702899.94.1104
This StudyLMO2102891.55.196.6

