Article

The Role of Bioeconomy Sectors and Natural Resources in EU Economies: A Social Accounting Matrix-Based Analysis Approach

by
Patricia D. Fuentes-Saguar
1,
Alfredo J. Mainar-Causapé
2,* and
Emanuele Ferrari
2
1
Department of Economics, University Pablo de Olavide, 41013 Sevilla, Spain
2
Joint Research Centre, European Commission, 41092 Seville, Spain
*
Author to whom correspondence should be addressed.
Sustainability 2017, 9(12), 2383; https://doi.org/10.3390/su9122383
Submission received: 30 November 2017 / Revised: 11 December 2017 / Accepted: 16 December 2017 / Published: 20 December 2017
(This article belongs to the Special Issue Natural Resources Economics)

Abstract

:
The bio-based economy will be crucial in achieving a sustainable development, covering all ranges of natural resources. In this sense, it is very relevant to analyze the economic links between the bioeconomic sectors and the rest of the economy, determining their total and decomposed impact on economic growth. One of the major problems in carrying out this analysis is the lack of information and complete databases that allow analysis of the bioeconomy and its effects on other economic activities. To overcome this issue, disaggregated social accounting matrices have been obtained for the highly bio-based sectors of the 28 European Union member states. Using this complex database, a linear multiplier analysis shows the future key role of bio-based sectors in boosting economic development in the EU. Results show that the bioeconomy has not yet unleashed its full potential in terms of output and job creation. Thus, output and employment multipliers show that many sectors related to the bioeconomy are still underperforming compared to the EU average, particularly those with higher value added; although, they are still crucial sectors for the wealth creation.

1. Introduction

The bioeconomy comprises several economic sectors, academic disciplines, and areas of policy. It encompasses the production of renewable biological resources and the conversion of these resources and waste streams into value-added products such as food, feed, bio-based products, and bioenergy. In this way, the bioeconomy is grouped into different sectors of the economy that produce, process, and re-use renewable biological resources (agriculture, forestry, fishing, chemicals, food, bio-based materials, and bioenergy). It is therefore of great interest to analyze the possible impacts of sectoral policies at national or regional level, as well as cross-sectoral policies (environment, climate change, the circular economy, waste, industrial policies, innovation and regional policies, etc.) related to dealing with new social challenges such as increasing food demand and climate change.
It should be borne in mind that the bioeconomy is one of the last challenges to economic science. Interest in it is starting to grow and the economic process is being considered as an extension of the biological evolution. The objective is to integrate economic activities with natural resources, because not only are the natural resources not always in line with the markets, but because its own intrinsic potential may be a decisive factor in growth. In this way, the economy is defined more widely and is allowing the development of a new bioeconomic model to reconcile public and private interests with the common interest. The origins of this approach to the economy can be found in Boulding [1] who compared the planet’s limited resources with an already-launched spacecraft, in order to integrate the concept of circular economy with the use and care of natural resources. The work of Georgescu-Roegen [2,3] discusses when economic development is included in the energy flow of the biosphere.
The relationship between the bioeconomy and the principle of circular economic flow [4] is clear in so far as this is defined by a system of production towards the transformation of renewable biological resources and waste streams into value-added food, feed, industry, and energy, etc. A bioeconomy allows a competitive, circular, and sustainable industrial-based economy [5].
Hence, there is a growing interest in analyzing the bioeconomy, both at an academic level [6,7,8,9] and a political and institutional level, such as in the European Union (EU) [5,10]. In this sense, the relevance of the bioeconomy in the EU is growing. It is becoming a key subject in the development of policies of sustainable development, as demonstrated by the development of a bioeconomy strategy by the European Union [10,11]), and it is playing a role in different framework programs [12] and in ambitious international consortiums with private sectors [4]). Also, individual policies are being developed by the member states [13,14]. In this context of the growing relevance and interest in the bioeconomy by European policymakers, research work such as that presented here acquire greater importance because it provides significant information on the structure of these types of activities, their links with the rest of the economy, and the ability to generate wealth and employment in a context of sustainable development.
Empirically, the question is how can the economic potential of these activities be maximized in a responsible manner and from a biological point of view, but also how can the impact on economic growth as a whole be maximized. In this respect, it is interesting to know and quantify the contribution of these economic sectors. Making the criteria and information for the development of these policies available was one of the main aims of this work.
Furthermore, an analysis of the bioeconomy sectors should recognize the economic, environmental, and social aspects for the implementation of a genuine and sustainable growth model on the development of a single framework, as well as the implementation of a quantitative model for assessing its pillars and the defined parameters. This should be underpinned by the quantification of the contribution to the overall growth and the mechanisms activated to this end.
In a first attempt in this regard, the Joint Research Centre (JRC) of the European Commission launched an ambitious project to identify the significant primary agricultural activities for the year 2000: The estimate of “AgroSAMs”, the social accounting matrices (SAMs), with a specific breakdown of the primary sector for each member state for the year 2000 [15]. Using this database and multiplier analysis, a first attempt at the structural classification and quantification of the potential for wealth and job creation for the Spanish economy was realized by Cardenete et al. [16]. Subsequently, the database was updated and enlarged to 2007 AgroSAM [9]. using statistical analyses to derive the structural segmentation typical of the bio-based products sector for groups of the member states of the EU. In general, both studies agree that the potential to generate wealth from bioenergy, as compared with the average of all economic activities, was relatively limited.
The significant contribution of this work is the use of a new set of SAMs specifically designed for studying the bioeconomy and natural resources, now called BioSAMs [17]. Improvement in the studies referred to was made by incorporating additional biomass sources, biotechnology applications, fuel, electricity, and chemical substances, and by adopting an approach similar to Philippidis et al. [9]. Following this work, the main objective of this paper was to analyze the activities of the bio-based profile between both sectors and regions in terms of wealth and jobs, in order to better understand the typologies of bio-based products in the member states of the EU in terms of wealth and job creation.
A social accounting matrix (SAM) is a database that contains organized economic and social data for all transactions between economic operators in the economy at a given time. This matrix provides for a certain period of time a coherent, comprehensive, and complete overview of all economic transactions between institutions and production and markets, as well as on markets, savings and investments, households, government, and the rest of the world. Each cell (i, j) describes both the expenditure represented in column j and an income to the account represented in row i, equaling the totals of rows and columns by the principle of the double entry accounting. A SAM integrates social statistics in the traditional input-output model, and includes the productive sectors and the interdependence with institutional sectors and the final demand, as well as flows of income between the factors of production and those institutions responsible of final demand components, thus completing the circular flow of income represented in a matrix format. Since its inception by Stone [18] as integrated production accounts in the form of input-output tables for the economy as a whole, and due to its coherence, comprehensiveness, and flexibility in registration of data, the SAM approach (linear) to pricing models in the last three decades has been applied to issues of economic growth [19], income distribution and redistribution [20], the circular flow of income [21,22,23], pricing [24], structural policy analysis of the agricultural sector in developed [25] and developing countries [26], and the effect of the public policy and poverty reduction [27].
A major barrier to the use of a detailed SAM for analyzing the activities of a bioeconomy is the lack of available data. More specifically, in the framework of the standard national accounts, bioeconomy activities generally are represented as broad sectoral aggregates (i.e., agriculture, food processing, forestry, fisheries, wood, and pulp) or even in their parent sectors (e.g., chemical industries, clothing, energy). This study continues the sectoral breakdown of the agricultural and agro-food industries used in AgroSAMs [15], but provides an explicit representation of the current uses of biomass in the areas of bioenergy, biochemicals, and bio-based industries. The main contribution of this work is that it is the most complete multisectorial database that, as far as we know, exists on the bioeconomy sectors and their links with other activities and institutional sectors (households, government, corporations, etc.), both for the EU as an aggregate and for each of its 28 member states, presenting here an intuitive application, but with significant information on the structure and capacity of the sector.

2. Materials and Methods

2.1. Data Sources. The BioSAMs

The BioSAM estimation consists of two main phases, subdivided into several steps, each of which has been repeated systematically for each member state. The first phase consists of designing a standard SAM, distinguishing the activities and commodities according to the classification of activities and products in Eurostat NACE2 Rev. 2 (Nomenclature statistique des Activités économiques dans la Communauté Européenne Rev. 2—Statistical classification of Economic Activities in the European Community, revised version 2) and CPA (Classification of Products by Activity), respectively. As a first step, the macro-SAM was estimated, reflecting in a dual entry matrix the macro-magnitudes of each national economy, considering 2010 as the reference year and using integrated accounts [28]. The objective of these first macro-SAMs was to serve as a benchmark in the process of constructing the matrix and, above all, the calculation of the closure of the SAM (factors and institutions). On the basis of these macro-SAMs for each member state, standard SAMs were obtained using the supply and use tables (SUT) of 2010 [29] and solving when necessary minor differences in the allocation of concepts that can arise between the two statistical operations (for example, consumption by residents abroad, payments of indirect taxation, labor, etc.). The result of this procedure was a SAM with general sectoral classifications that may be used not only for modeling or analysis, but also serve as a basis for obtaining the much disaggregated BioSAMs. Finally, to complete this first stage, SAMs were adapted slightly, incorporating and adapting certain accounts to the classification of activities carried on by the Global Trade Analysis Project (GTAP) [30]. The reason for this was to facilitate the subsequent use of databases on agriculture and biofuels, which are incorporated in the BioSAMs (in particular, to calculate technical coefficients for activities related to bioenergy and bio-based chemicals).
The second main step in the construction of the BioSAMs was a breakdown of the agriculture and food industries, as well as the sectors of bioenergy and bio-based industries. The division of agricultural primary products and food industries was carried out using, as the main source of data, the CAPRI database (Commom Agricultural Policy Regionalised Impacts) [31] in combination with the Economic Accounts for Agriculture (EAA) (Eurostat, 2016). The basis for breaking the sectors into the biomass, bioenergy, and bio-based industries was obtained from the database for MAGNET (Modular Applied General Equilibrium Tool), which is an advanced overall neoclassical general equilibrium model (MAGNET Consortium is led by Wageningen Economic Research (WEcR) and includes JRC) and the databases available at the European Commission [32] and Eurostat on employment and turnover. Thus, a set of non-agricultural accounts on the bioeconomy are split from other groups or matrices. More specifically, bioenergy and the new bio-industrial sectors are extracted from their origins of “forest-based industries”, “chemicals”, “wood products”, and “electricity and gas”.
Once SAMs were unbundled in accordance with the information from the bioenergy and agricultural production, food, and bio-industrial sectors, discrepancies between the accounts (expected because of the use of different sources of data, which are not always directly compatible) were eliminated using well-known adjustment methods such as the cross-entropy method or RAS [33,34,35,36].
The final result is a set of 29 BioSAMs for 2010 (one for each EU member state and one aggregate for the European Union), which includes 80 activities and commodities in the accounts. There are 22 activities/commodities for cropping, 6 for livestock, 14 for food processing, 5 for bioenergy (biofuels of first and second generation and bio-electricity), 3 for biomass supply (forestry biomass, energy crops, and pellets), 3 accounts for bio-industrial (textiles, wood and biochemistry) and one for fisheries. The remaining 27 accounts cover sectors such as fossil fuels (2), industry (11), and services (14). In addition, the BioSAMs contain two factors of production (capital and labor), an account of trade and transport margins, and three tax accounts (taxes and subsidies on production and consumption and direct taxation). Finally, there is a single account for households, corporations, public administration, saving-investments, and rest of the world.

2.2. Output and Employment Multipliers

The starting point for the analysis is the following equilibrium equation:
x = A x + y x = ( I A ) 1 y = M
where x is the vector of total gross output of endogenous accounts (N) and y is the vector of values of exogenous variables (usually form final demand) for these accounts; A is the matrix of total coefficients in the SAM framework where the representative element i, j = 1, ..., N, shows the participation that the payment Xij of a sector j in another sector i has on the total payments of sector j (xj); M is the matrix of SAM accounting multipliers. Adding in each commodity column of M (taking values from activities), the output multipliers are obtained, showing the increase in output of the economy generated by a shock in exogenous values (for example, exports) for the corresponding commodity.
An empirical decision refers to the choice of the endogenous variables. In this approach it is assumed that the exogenous variables are government, saving investments, and ’rest of the world’. Thus, impacts from complete circular flow are reflected in the short run with government expenditure, investment, and foreign trade acting as potential shock causes.
To obtain employment multipliers, a vector e is required that contains the ratios of the number of jobs per million euros of output value. To populate this matrix, employment data from the Labor Force Survey [37] are used, although for specific primary agricultural activities they are combined with data from the Economic Accounts for Agriculture [38]. For non-agricultural bio-based sectors, estimates from JRC [32] are used. This matrix E is multiplied by the part of the multiplicative decomposition called Ma, which incorporates the rows and columns corresponding to the productive accounts plus the endogenous accounts of labor, capital, and households. The expression of the employment multiplier, Me, is given as:
Me = e′M
Each element in Me is the increment in the number of jobs of the account i when the account j receives a unitary exogenous injection. Adding in the same way that for output multipliers, the effect on employment resulting from an exogenous shock is obtained. Also, using a diagonal matrix version of e instead of e′, the decomposition of total impact multipliers is calculated [39].

3. Results

In order to analyze the results more clearly, the productive sectors considered in the BioSAMs have been aggregated, first into coherent sectors of activity and then in subsectors related to the broad groups of activities included in the bioeconomy. The description of these sectors is in Table 1.

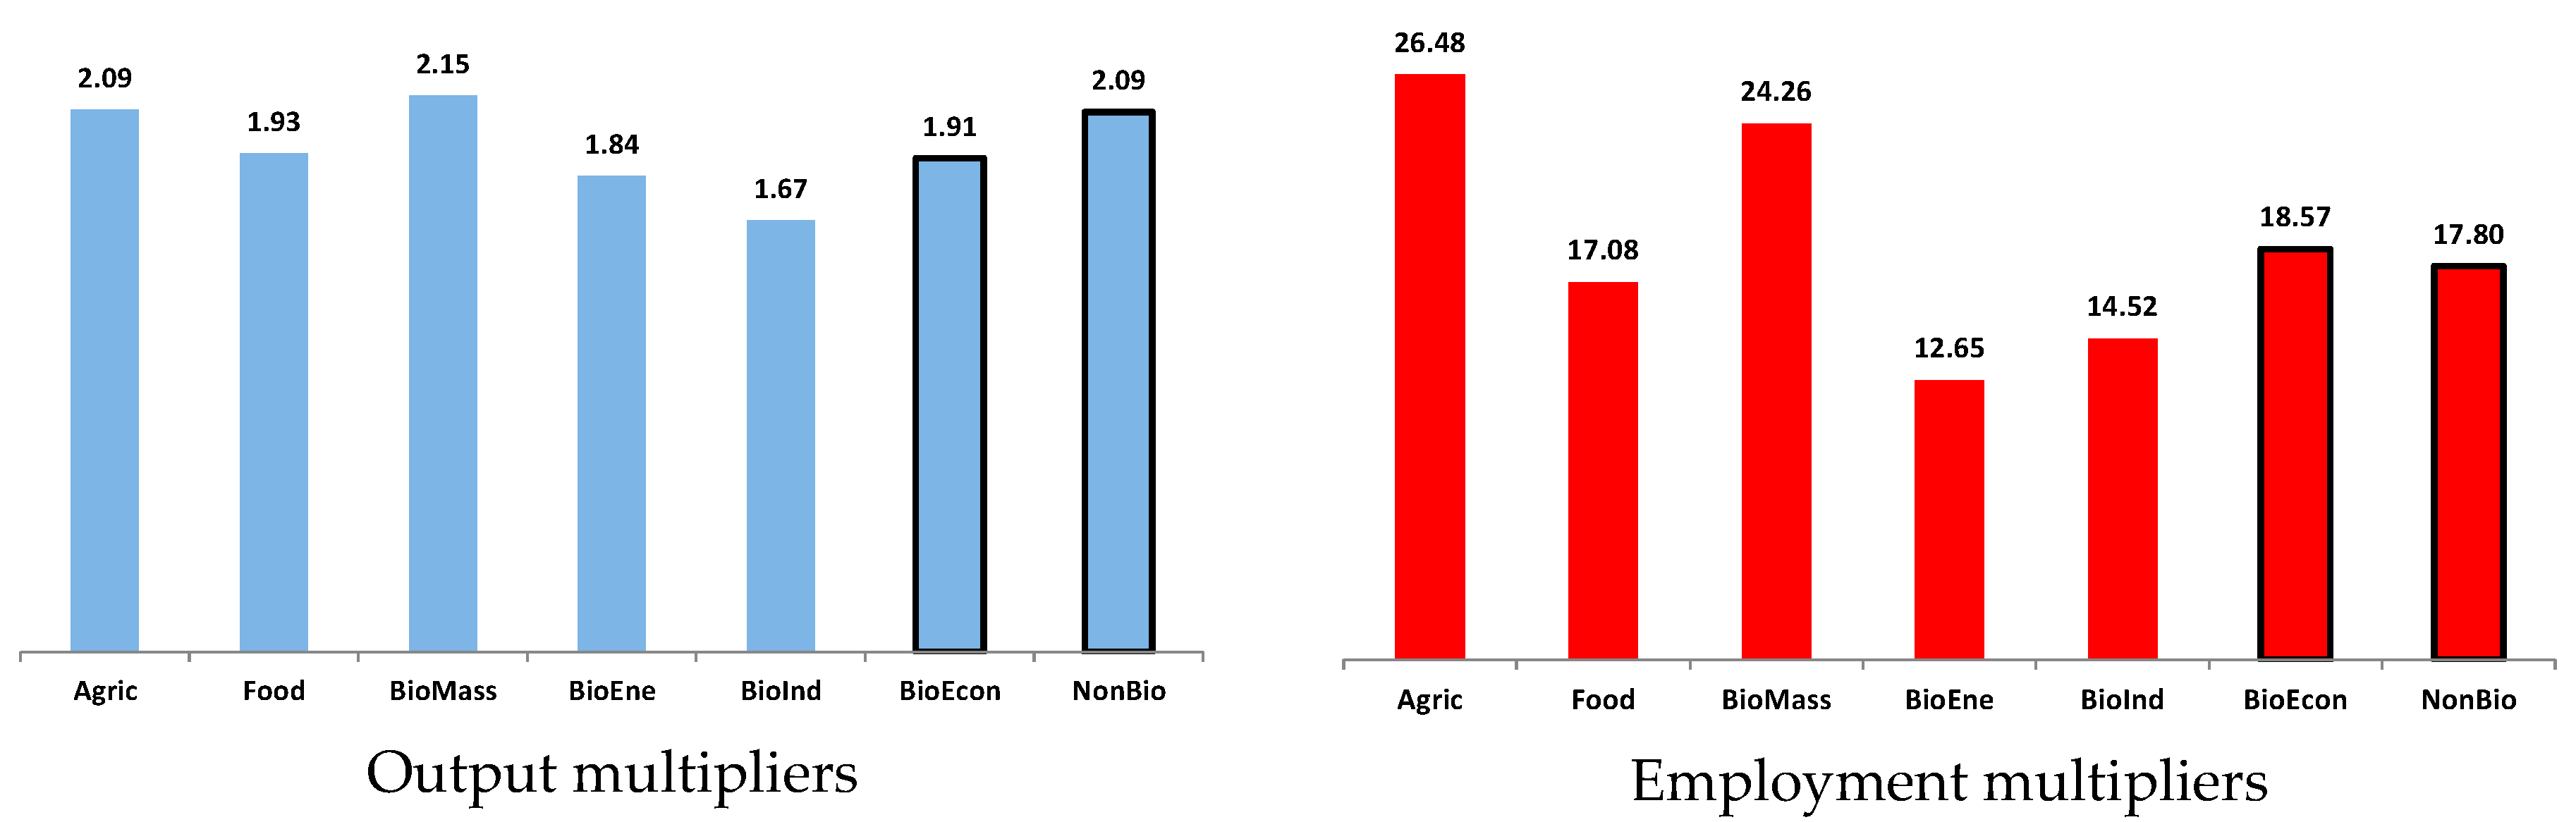
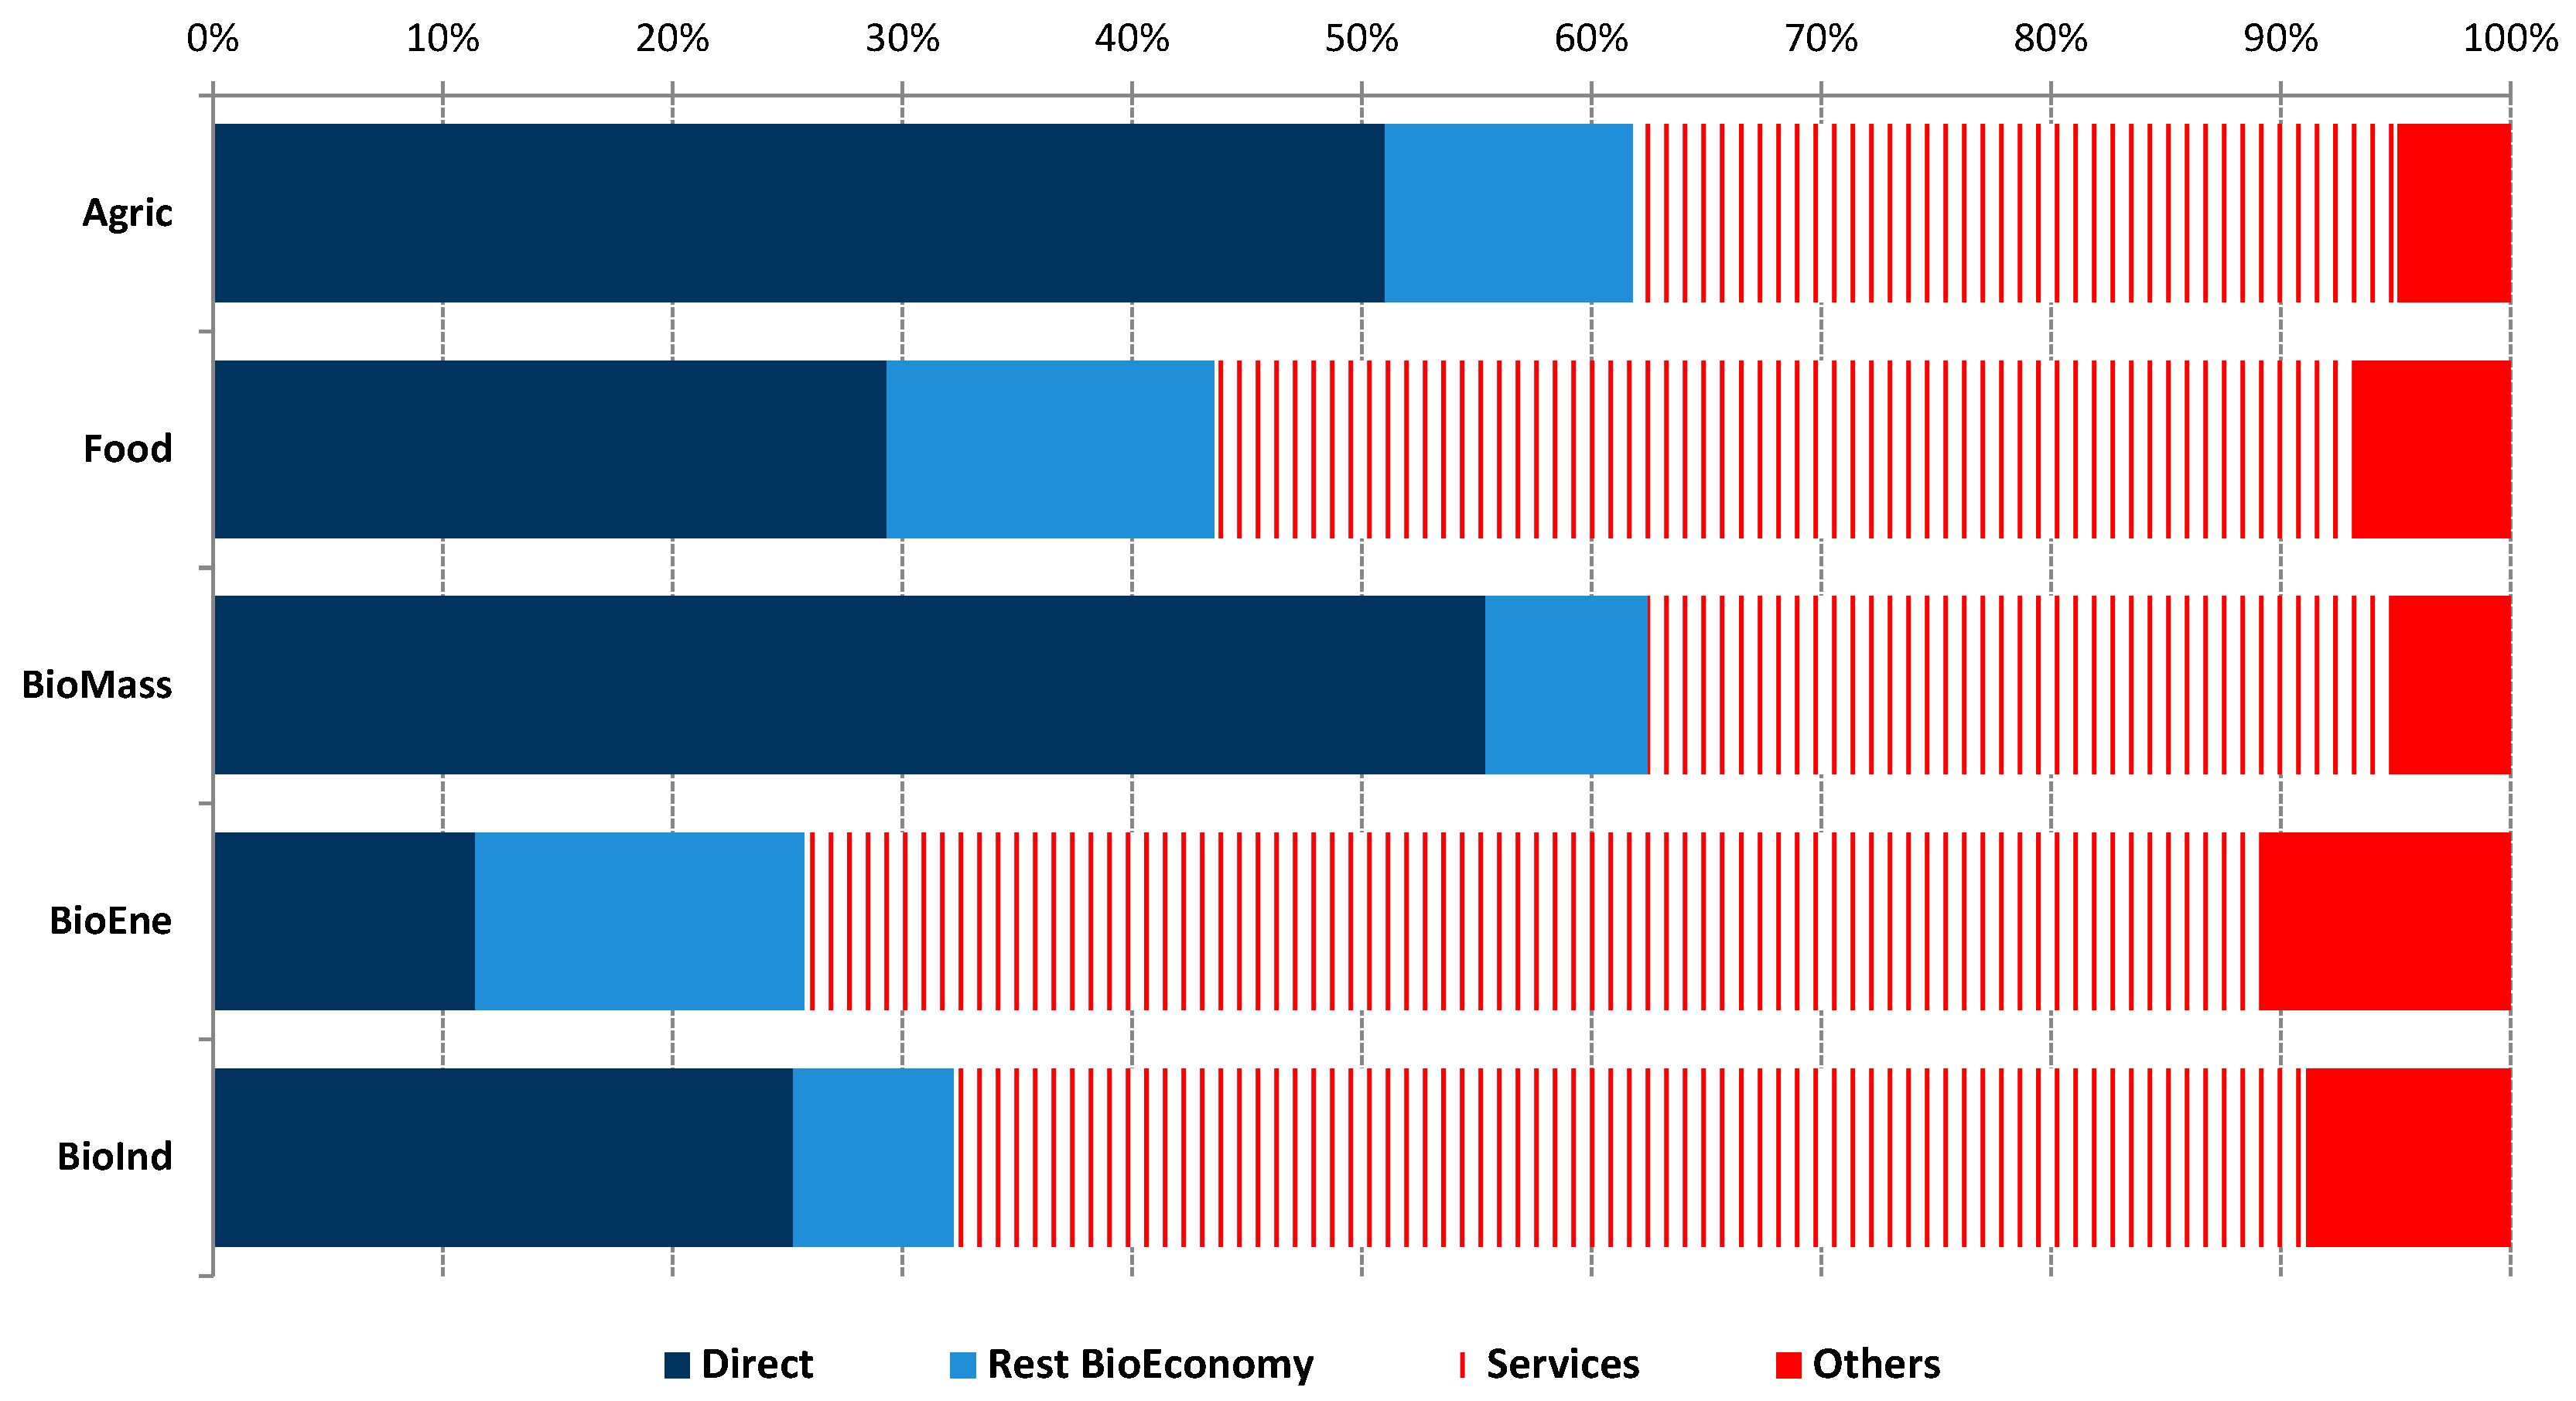
3.1. Bioeconomy Sectors in the EU28 Aggregate

Starting with the aggregate of all 28 member states of the European Union, the sectors considered as the bioeconomy show an expansion capacity of the total output in the economy through the multiplier of the output as lower than the other sectors (see Figure 1). The aggregate multiplier of the bioeconomy sectors is 1.91, compared to 2.09 for the other sectors. Unbundling the bio-based subsector shows significant differences between those that are more linked to the primary sector and those related to bio-industries or bioenergy. Thus, activities in agriculture and livestock (aggregated in Agric) have a multiplier of 2.09, reaching 2.15 for biomass. However, the values for the bio-based industries (textile, biochemicals, and wood products) and bioenergy are 1.67 and 1.84, respectively. The agro-food industry (Food) has a somewhat higher multiplier, 1.93.
Regarding employment multipliers (Figure 1), the results are significantly different. As for the bioeconomy as a whole, the multiplier is greater than that of the other sectors, with an average of 18.6 jobs per million euro of exogenous increase in final demand (compared to 17.8). Again, the sectors of agriculture and biomass are the most relevant subsectors in this context with multipliers of 26.48 and 24.29, respectively. The food industry (Food) again shows a similar capacity (17.08) to the bioeconomy, as in the case of the output. Bioenergy and BioInd (bio-based industries) values are once more lower, mainly the former.
Table 2 shows more disaggregated results for the EU28. Thus, in the primary sector, the values of livestock activities and of raw milk stand out in both output and employment. In the case of livestock farming, both extensive and intensive and raw milk, the output multiplier values are around 2.6. The high values of the employment multipliers are particularly significant with 51.3 jobs per million euro in extensive livestock farming and 31.5 in the production of raw milk. This is consistent with high values that within the broad sector of food show red and white meat and animal feed. On the other hand, it is also remarkable, regarding biomass, the high generation of output and employment (2.2 and 24.4, respectively) for forestry activities are again in line with high values for agricultural activities.
Focusing the analysis on the employment-generating capacity of the bioeconomy sectors, it is interesting to see where (in which areas) new potential jobs might be allocated, after a hypothetical external shock on demand. By using the distribution of the total impact multipliers (TIM) [39] described above, the sectoral distribution of these impacts was estimated and is presented here in aggregated form for ease of interpretation (Figure 2). Again, the primary sector (Agric) and the biomass show similar behavior, being themselves the main recipients of the jobs created. Farming activities would create more than half (51%) of the new jobs generated by shocks in these sectors, while in the case of biomass this percentage rises to 55.4%. In the latter sector, however, the allocation of jobs in other sectors of the bioeconomy is lower (7.1% compared to 10.85% in agriculture). In both cases, one-third of the new jobs created would correspond to the services sector.
At the other extreme is the subsector of bioenergy, receiving only 11% of jobs created, with about 14% being allocated in the other bioeconomy subsectors. It is very significant that around two-thirds of the jobs would be created in the services sector. Food and bio-based industries suffer a similar behavior with nonbio sectors having the main benefit from the creation of jobs in this subsector (56.4% and 67.7% respectively), but with greater involvement of itself and other bioeconomic activities (29.3% and 25.3%, respectively), in particular the food industry (14.3%).

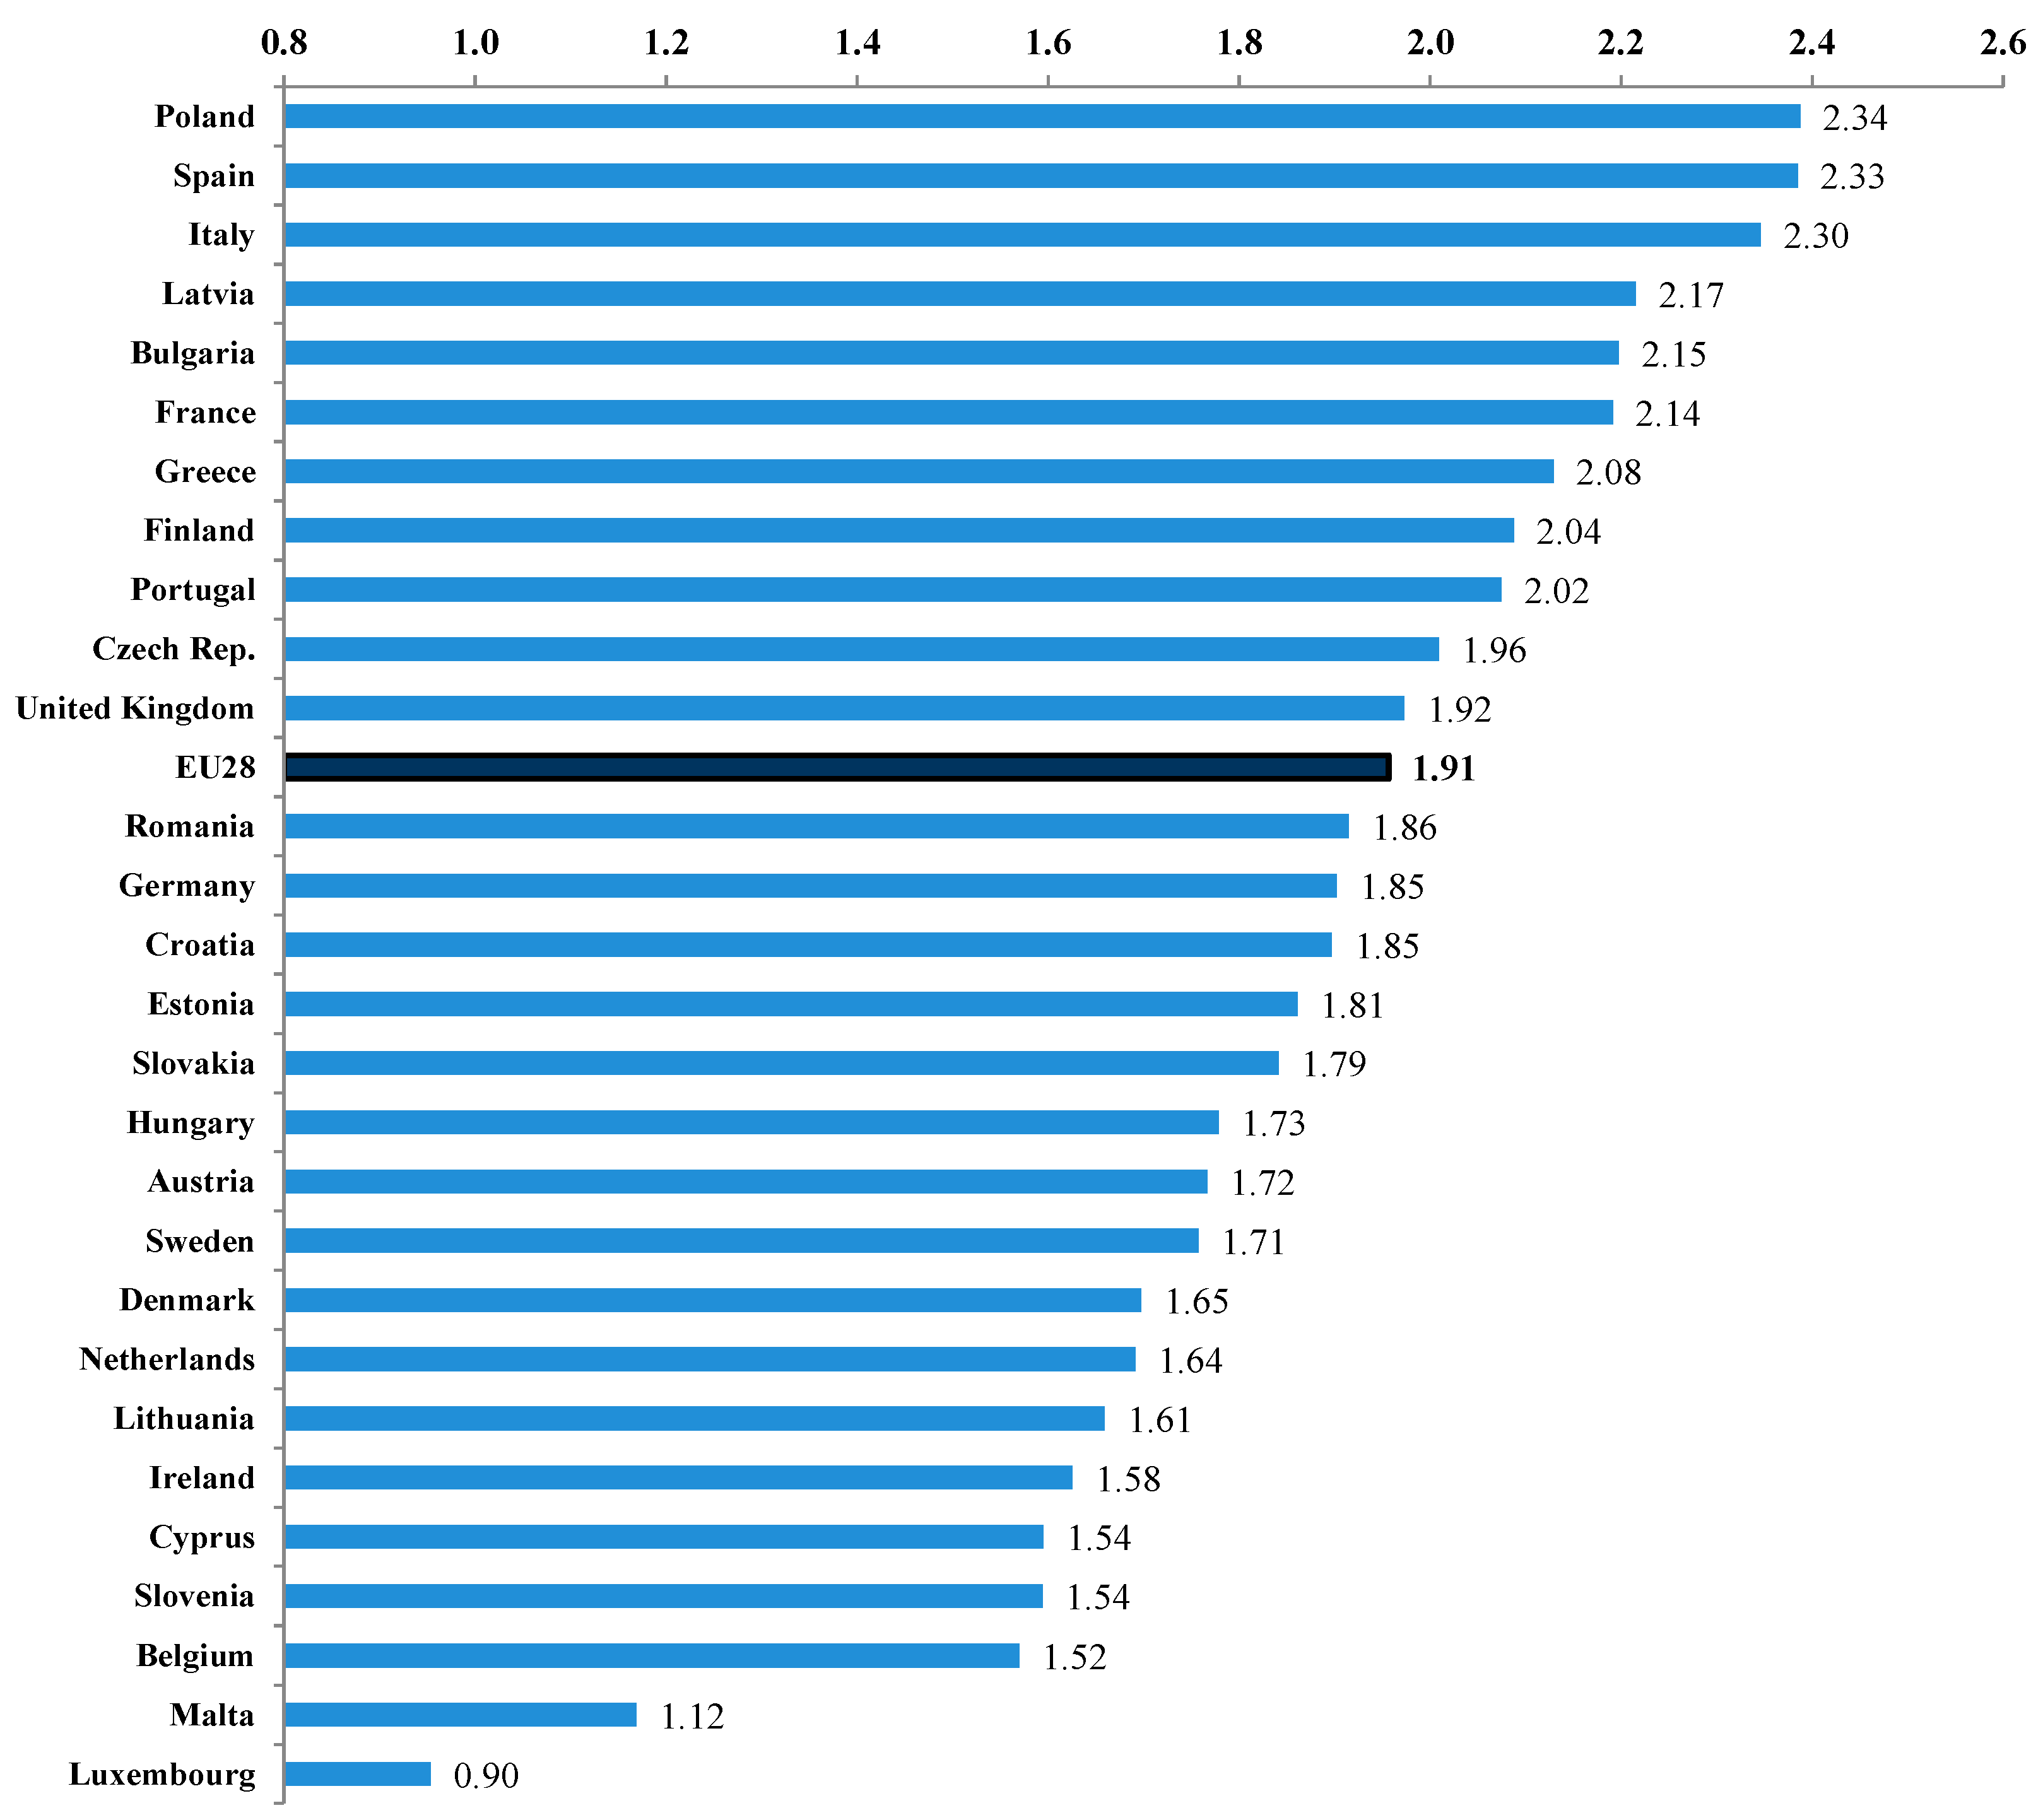
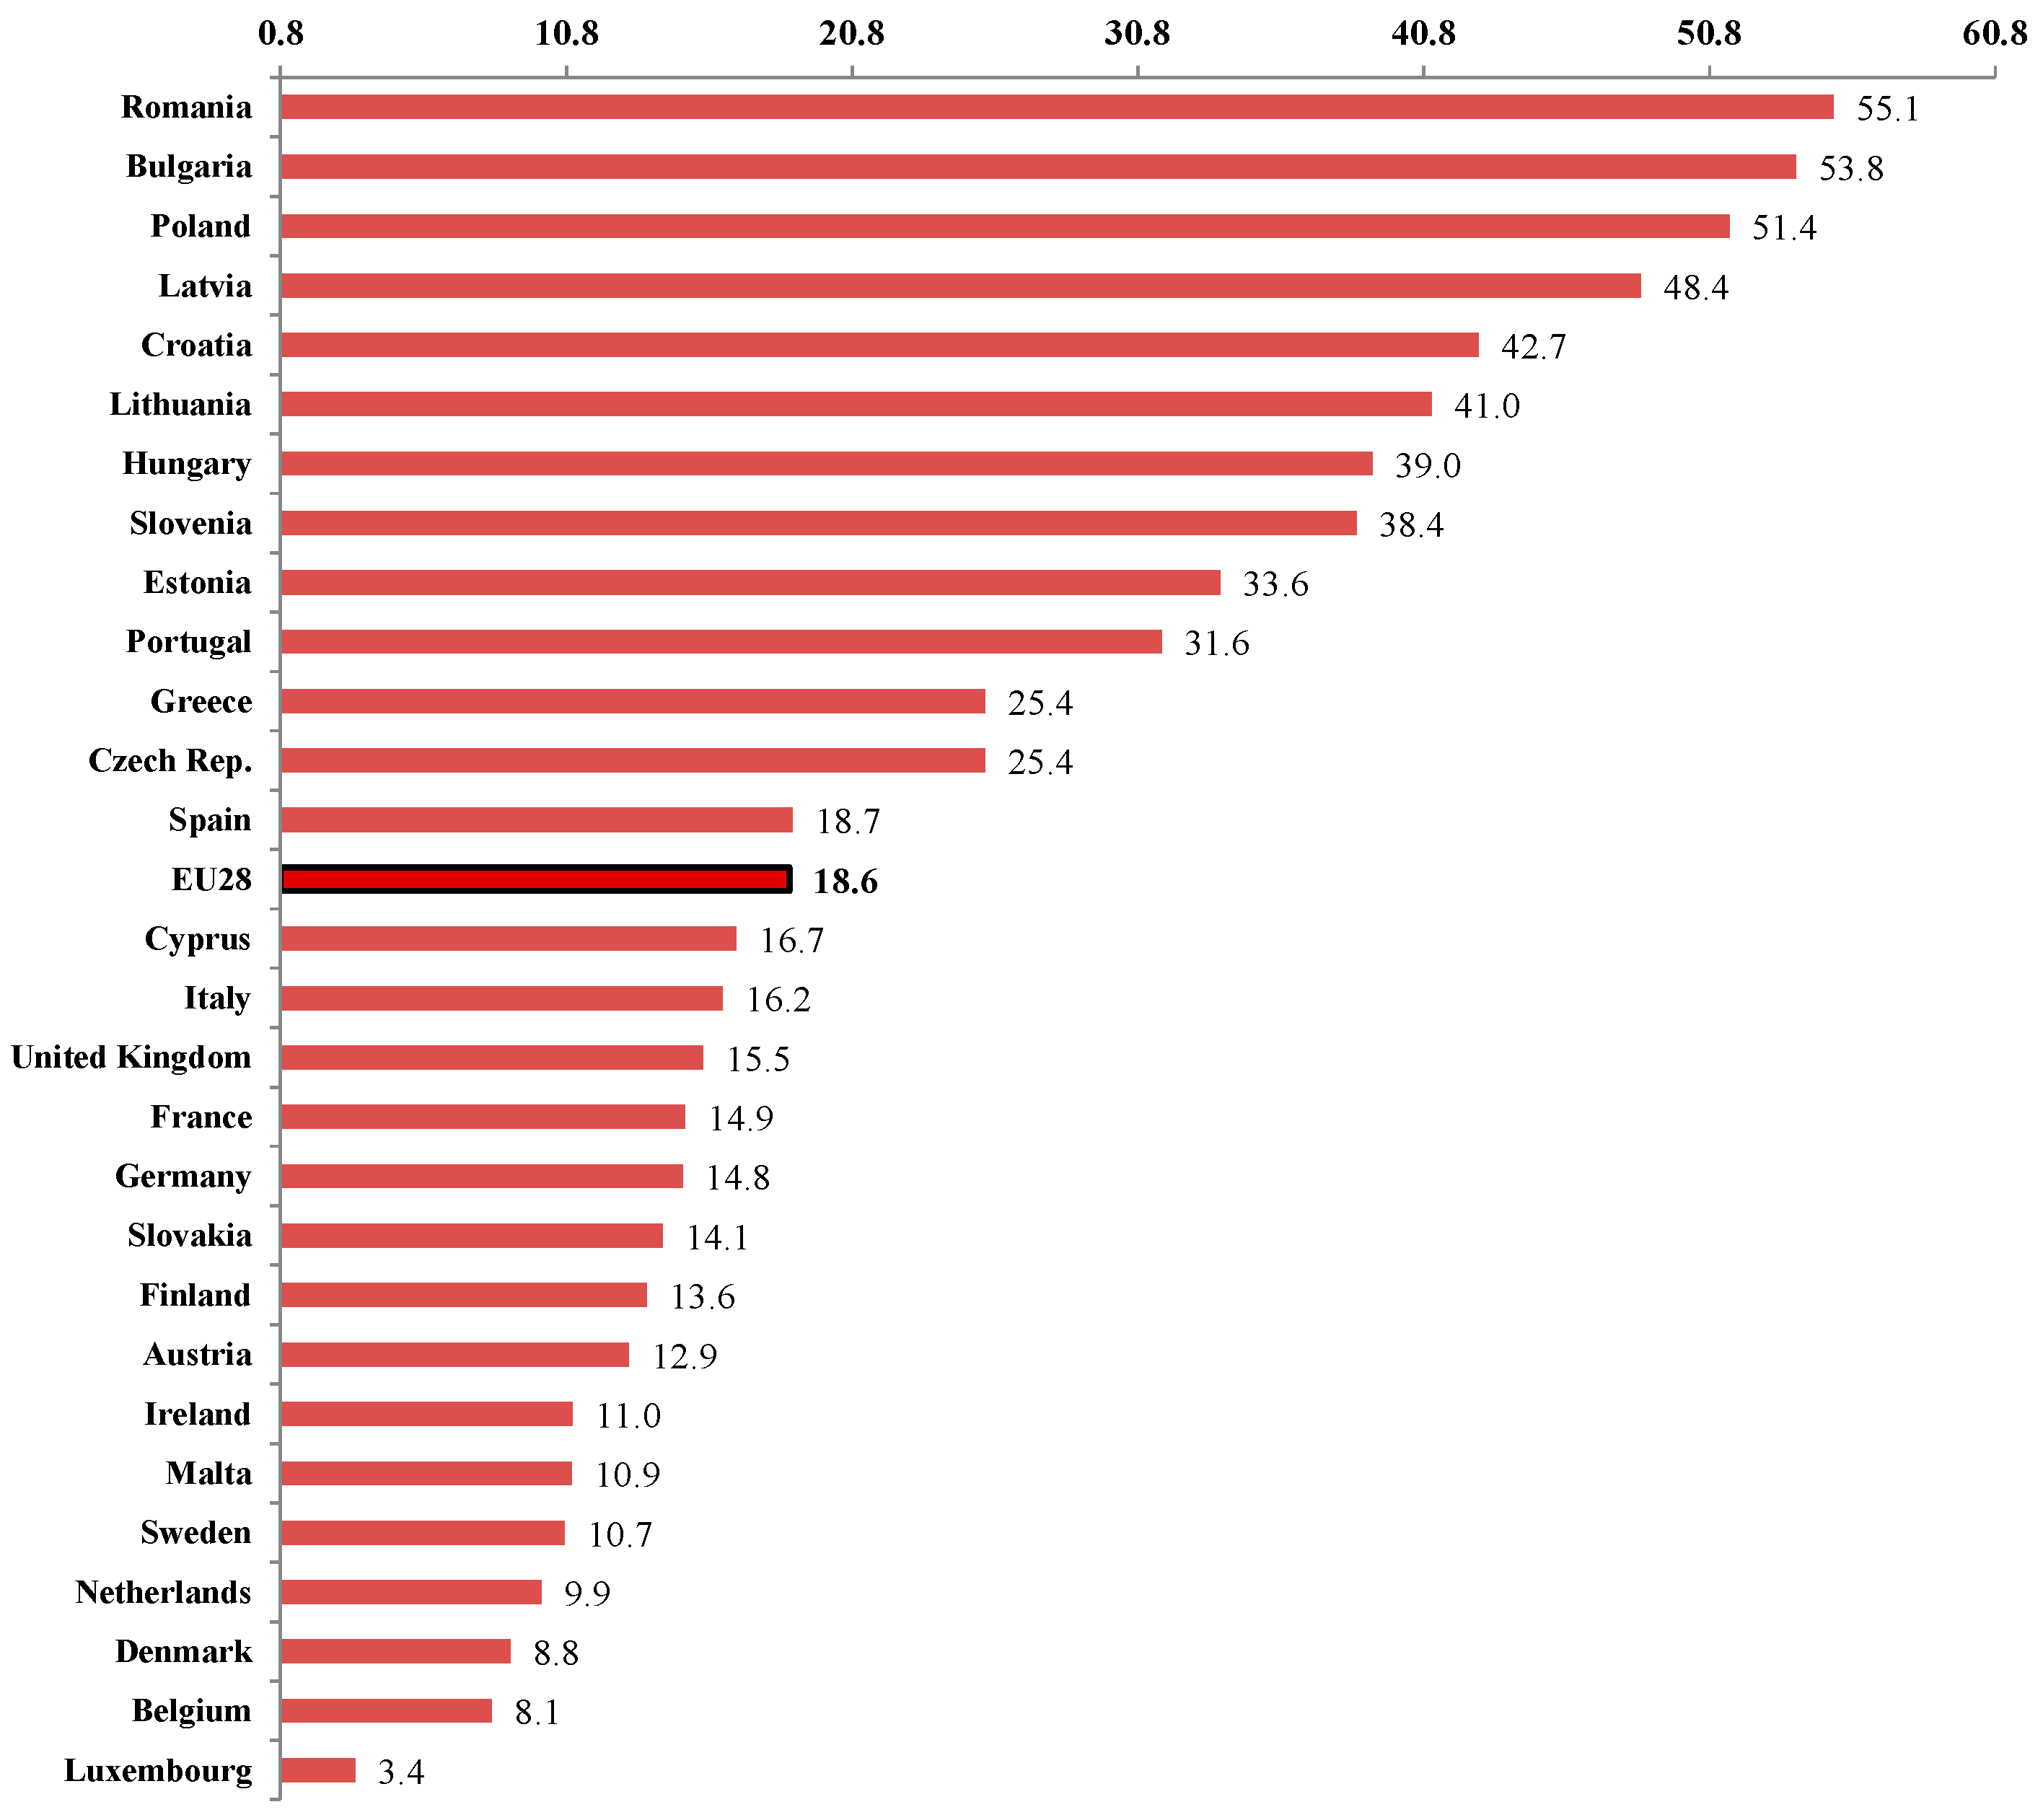
3.2. Disaggregated Results of the Member States

Results for each of the member states show a high volatility, although some patterns can be observed. For multipliers of output (Figure 3 and Table 3), 11 countries are above the EU28 aggregate value for the bioeconomy (1.91). Poland (2.34), Spain (2.33), and Italy (2.30) show the highest values, followed by Latvia (2.17), Bulgaria (2.15), and France (2.14). In general, this indicates that the countries above the average of the EU28 are those with a significant contribution to the primary sector, either by their relative size (Poland) or by their important participation in social structure and income generation (Spain, France, Italy, etc.). In the data according to country and subsectors (Table 3), some correlation can be observed among the countries that are better than average in agriculture and biomass and, to a lesser extent, with the highest values in bioenergy. As to the food industry, the highest values are displayed by a small number of countries, mainly those where the food processing industry has weight (Spain, France, Italy, Greece, Portugal, etc.).
Considering the employment multipliers (Figure 4), the pattern changes and those countries that are above the EU28 average (18.6 jobs per million euro of exogenous shock) are now countries of Eastern Europe. Thus, of the 13 member states that are better than average, 10 are countries of this area; the only exceptions are Portugal (31.6), Greece (25.4), and Spain (18.7). Higher values correspond to Romania (55.1), Bulgaria (53.8), and Poland (51.4). Latvia, Croatia, and Lithuania also have multipliers higher than 40 jobs per million euro. These are countries with greater intensity in the use of labor, which leads to higher levels of use of this factor with increases in production. Taking into account that this factor is especially increased in the agricultural sector and given the important weight of these activities in these countries, this change in the pattern is logical. There is, therefore, a clear influence from the agricultural sector, which is a fundamental part of the bioeconomy. The weight of the intensity in labor use is key in this behavior. As shown in Table 4, member states with high values of the multiplier for the bioeconomy, also presented this pattern in each of the subsectors and also for the rest of the economy (NonBio).

4. Discussion and Conclusions

The bio-based economy, covering all ranges of natural resources, will be crucial for achieving a sustainable economic development in the EU and globally. It is very relevant to analyze the current economic links between bio-economic sectors and the rest of the economy, determining their total and decomposed impacts on economic growth. This paper, thanks to a brand new database for the EU and its member states, overcomes one of the major problems of the current literature on the topic, which is the lack of data. In this sense, this is one of the main contributions of this work: providing a complete multisectorial database on the bio-based sectors and their economic links with the rest of the activities and institutional sectors for EU28. Also, this database allows a useful and informative linear multiplier analysis (one of the few in the literature about this sector) to be computed to show the role of bio-based sectors in the economic development of the EU.
Results for the EU member states in 2014 still show a low potential for creating wealth and a quite low level of integration of the bioeconomy sectors—particularly those that are considered at higher value added—with the rest of the economy.
Output multipliers show that many sectors related to the bioeconomy in the 2014 data were still underperforming compared to the EU average. In particular, those that are considered more innovative and with higher value-added content are not yet able to produce more than average wealth. On the other hand, the primary ones are still crucial sectors for the EU process of wealth creation. All sectors related to livestock, meat, and dairy production have a particularly higher than average output multiplier.
Employment multipliers report a similar picture in the bioeconomy sectors. Agricultural and other primary sectors are still highly labor intensive so in a purely quantitative assessment, an exogenous shock of their demand will create more than average employment in the EU. Agricultural activities (particularly intensive and extensive livestock) still look like a key generator of employment. On the other hand and as largely expected in this type of static analysis, under the hypothesis of a linear model that is of a very short run horizon, more capital-intensive industrial sectors generate relatively less employment.
Nevertheless, these figures cannot say anything about the quality of these jobs, neither in terms of qualification nor in terms of the wage level attached to them. Additionally, a longer term of evolution in terms of both output and employment creation, which at least theoretically are in favor of the more innovative sectors, cannot be captured by the current model and requires a different method of analysis.
It should be underlined that all these conclusions are in line with the current literature [9,17], which adopted similar methods to analyze the structural patterns of the bioeconomy sectors in the EU.
The distribution of the total impact multipliers (TIM) methodology shows how the primary sectors, which are still key in terms of output and job creation, exhibit a weak relationship with the rest of the sectors. Where job creation is the greatest, most of the new jobs are mainly concentrated in the same sector where the exogenous shock takes place (e.g., agriculture and biomass). On the other hand, sectors that are creating more jobs for the rest of the economy and showing a better integration are those with the lower employment multipliers. The exception is the second generation biofuels sector with a job multiplier equal to the rest of the economy average. These results show how investing in the latter type of sector (food industry and the less traditional ones such as bioenergy) would foster a process of job creation that spreads over many sectors.
Looking at the member states’ results show that the capacity of generating output from bioeconomic activities is highly heterogeneous across countries. Ten member states (Belgium, Cyprus, Denmark, Germany, Ireland, Lithuania, Luxembourg, Malta, Netherlands, and Slovenia) show output multipliers below the EU average in all bioeconomic subsectors. On the other hand, Poland, Spain, and Portugal have greater than average output multipliers in all subsectors
The picture of the job multipliers is even more heterogeneous across member states than the output multipliers. Again, it should be underlined that this is highly dependent on the level of labor intensity linked to each sector in each member state. All Eastern member states show a very high level of labor intensity (particularly high in all primary sectors as agriculture and biomass production) and consequently of job multipliers. Again, these figures do not take into account any consideration related to the quality and skills attached to these jobs or any other qualitative inference. As already underlined by [9,17], these figures have to be interpreted with caution. In particular, in the agricultural sector, typically less prosperous member states employ low skilled and less productive and/or lower remunerated workers.
Regarding the caveats and limitations of the analysis, we must take into account the limitations of the model and the database used. It is a linear model that gives valuable information about the economic structure at a moment in time, but prices or effects of synergy on productivity, etc. are not considered. On the other hand, the estimation of the BioSAMs is an important contribution to the study of the bioeconomy. However, when analyzing the results, the difficulties in obtaining them and the need to estimate some values must be taken into account.
Summarizing, despite the EU’s growing policy interest in renewable resources, supported by the EU’s bioeconomy strategy, analysis of current data shows that the bioeconomy has not yet unleashed its full, so far mainly theoretical, potential in terms of output and job creation. If the bioeconomy is not seen as a niche area or as a concrete opportunity to create growth and jobs—and at the same time to reduce fossil fuel dependence and improve the economic sustainability of primary production and processing industries—then the final target is still not achieved by the EU member states. In this sense, an intense interaction is necessary between industrial, academic, and socio-economic stakeholders. Programs such as the EU’s Horizon 2020 (with close to 4 billion euros in support of bioeconomy-related research) [5] or the Bio-Based Industries Consortium that mix sectors such as agriculture, agri-food, technology providers, forestry/pulp and paper, and chemicals and energy [4] are good examples for the way in which to develop the bioeconomy and exploit its possibilities. Market incentives for commercialization of bio-based products, lower costs for intellectual property rights protection, and an intensive mobilization of new investors could help the bioeconomy achieve its potential capacity of generating wealth and employment.
To achieve the objectives that the EU bioeconomy strategy has set, the development of a coherent European framework—under which all policies that encompass bioeconomy sectors can develop and help improve its capacity to create jobs and growth—would be one of the keys.

Acknowledgments

The authors thank George Philippidis (Aragonese Agency for Research and Development—ARAID, Centre of Agro-Food Research Technology of Aragón—CITA) and Ana I. Sanjuán (CITA), coauthors of previous reports on this topic, for their help in estimating the EU28 aggregate BioSAM. Thanks also to Robert M’barek (Joint Research Centre-D.4, Seville) who provided helpful comments about bioeconomy. This work was supported by the European Commission (Specific Contract 154208.X16 “Jobs and Growth in the Agri-Food Sector”). The sponsor has contributed to the collection and construction of databases and covers the costs to publish in open access. The views expressed are purely those of the authors and may not in any circumstances be regarded as stating an official position of the European Commission.

Author Contributions

All the tree authors designed the scenario and analysis; Alfredo Mainar estimated the database and performed the calculations; Patricia Fuentes analyzed the data and wrote Section 1, Section 2 and Section 3, Emanuele Ferrari wrote Section 4 and had input in Section 1, Section 2 and Section 3.

Conflicts of Interest

The authors declare no conflict of interest.

References

  1. Boulding, K.E. The economics of the coming spaceship earth. In Environmental Quality in a Growing Economy; Jarrett, H., Ed.; John Hopkins University Press: Baltimore, MD, USA, 1966. [Google Scholar]
  2. Georgescu-Roegen, N. The Entropy Law and the Economic Process; Harvard University Press: Cambridge, MA, USA, 1971. [Google Scholar]
  3. Georgescu-Roegen, N. Bioeconomics, a New Look at the Nature of Economic Activity. In The Political Economy of Food and Energy; Junker, L., Ed.; Taylor & Francis: Boca Raton, FL, USA, 1977; pp. 105–134. [Google Scholar]
  4. Mengal, P.; Wubbolts, M.; Zika, E.; Ruiz, A.; Brigitta, D.; Pieniadz, A.; Black, S. Bio-based Industries Joint Undertaking: The catalyst for sustainable bio-based economic growth in Europe. New Biotechnol. 2018, 40, 31–39. [Google Scholar] [CrossRef] [PubMed]
  5. Bell, J.; Paula, L.; Dodd, T.; Németh, S.; Nanou, C.; Mega, V.; Campos, P. EU ambition to build the world’s leading bioeconomy—Uncertain times demand innovative and sustainable solutions. New Biotechnol. 2018, 40, 25–30. [Google Scholar] [CrossRef] [PubMed]
  6. McCormick, K.; Kautto, N. The Bioeconomy in Europe: An Overview. Sustainability 2013, 5, 2589–2608. [Google Scholar] [CrossRef]
  7. Fritsche, U.; Iriarte, L. Sustainability Criteria and Indicators for the Bio-Based Economy in Europe: State of Discussion and Way Forward. Energies 2014, 7, 6825–6836. [Google Scholar] [CrossRef]
  8. M’barek, R.; Philippidis, G.; Suta, C.; Vinyes, C.; Caivano, A.; Ferrari, E.; Ronzon, T.; Sanjuan-Lopez, A.; Santini, F. Observing and analysing the Bioeconomy in the EU: Adapting data and tools to new questions and challenges. Bio-Based Appl. Econ. 2014, 3, 83–91. [Google Scholar]
  9. Philippidis, G.; Sanjuán, A.I.; Ferrari, E.; M’barek, R. Employing social accounting matrix multipliers to profile the bioeconomy in the EU member states: Is there a structural pattern? Span. J. Agric. Res. 2014, 12, 913–926. [Google Scholar] [CrossRef]
  10. European Commission. Innovating for Sustainable Growth: A Bioeconomy for Europe. 2012. Available online: http://ec.europa.eu/research/bioeconomy/pdf/official-strategy_en.pdf (accessed on 10 November 2017).
  11. European Commission. Review of the 2012 European Bioeconomy Strategy. 2017. Available online: https://ec.europa.eu/research/bioeconomy/pdf/review_of_2012_eu_bes.pdf (accessed on 10 November 2017).
  12. Patermann, C.; Aguilar, A. The origins of the bioeconomy in the European Union. New Biotechnol. 2018, 40, 20–24. [Google Scholar] [CrossRef] [PubMed]
  13. Gobierno de España, Ministry of Economy and Competitiveness. The Spanish Bioeconomy Strategy 2030 Horizon. 2016. Available online: http://bioeconomia.agripa.org (accessed on 10 December 2017).
  14. Gouvernement de la France, Ministère de l’Agriculture et de l’Alimentation. Une Stratégie Bioéconomie Pour la France. 2017. Available online: http://agriculture.gouv.fr/ (accessed on 10 December 2017).
  15. Müller, M.; Perez-Dominguez, I.; Gay, S.H. Construction of Social Accounting Matrices for the EU27 with a Disaggregated Agricultural Sector (AgroSAM); JRC Scientific and Technical Reports; JRC 53558; European Commission-Joint Research Centre: Luxembourg, 2009. [Google Scholar]
  16. Cardenete, M.A.; Boulanger, P.; Delgado, M.; Ferrari, E.; M’Barek, R. Agri-food and bio-based analysis in the Spanish economy using a key sector approach. Rev. Urban Reg. Dev. Stud. 2014, 26, 112–134. [Google Scholar] [CrossRef]
  17. Mainar-Causapé, A.; Philippidis, G.; Sanjuan, A.I. Analysis of Structural Patterns in Highly Disaggregated Bioeconomy Sectors by EU Member States Using SAM/IO Multipliers; JRC Technical Reports; EUR 28591; European Commission-Joint Research Centre: Luxembourg, 2017. [Google Scholar]
  18. Stone, J.R. Input-Output and the Social Accounts. In The Structural Interdependence of the Economy, Proceedings of the International Conference on Input-Output Analysis, Varenna, Italy, 27 June–10 July 1954; Wiley: New York, NY, USA; Giuffre: Milan, Italy, 1955; pp. 155–172. [Google Scholar]
  19. Robinson, S. Multisector Models of Developing Countries: A Survey. In Handbook of Development Economics; Chenery, H.B., Srinivasan, T.N., Eds.; North-Holland: Amsterdam, The Netherlands, 1989; pp. 906–932. [Google Scholar]
  20. Roland-Holst, D.W.; Sancho, F. Relative Income Determination in the US: A Social Accounting Perspective. Rev. Income Wealth 1992, 38, 311–327. [Google Scholar] [CrossRef]
  21. Pyatt, G.; Round, J. Accounting and Fixed Price Multipliers in a Social Accounting Matrix. Econ. J. 1979, 89, 850–873. [Google Scholar] [CrossRef]
  22. Defourny, J.; Thorbecke, E. Structural Path Analysis and Multiplier Decomposition within a Social Accounting Matrix. Econ. J. 1984, 94, 111–136. [Google Scholar] [CrossRef]
  23. Robinson, S.; Roland-Holst, D.W. Macroeconomic Structure and Computable General Equilibrium Models. J. Policy Model. 1988, 10, 353–375. [Google Scholar] [CrossRef]
  24. Roland-Holst, D.W.; Sancho, F. Modeling Prices in a SAM Structure. Rev. Econ. Stat. 1995, 77, 361–371. [Google Scholar] [CrossRef]
  25. Rocchi, B. The CAP Reform Between targeting and Equity: A Structural Policy Analysis for Italy. Eur. Rev. Agric. Econ. 2009, 36, 175–202. [Google Scholar] [CrossRef]
  26. Arndt, C.; Jones, S.; Tarp, F. Structural characteristic of the economy of Mozambique: A SAM-based analysis. Rev. Dev. Econ. 2000, 4, 292–306. [Google Scholar] [CrossRef]
  27. De Miguel-Velez, F.J.; Perez-Mayo, J. Poverty Reduction and SAM Multipliers: An Evaluation of Public Policies in a Regional Framework. Eur. Plan. Stud. 2010, 18, 449–466. [Google Scholar] [CrossRef]
  28. Eurostat. Non-Financial Transactions (nasa_10_nf_tr). 2016. Available online: http://ec.europa.eu/eurostat/data/database (accessed on 15 November 2016).
  29. Eurostat. Supply, Use and Input-Output Tables (naio_10_cp). 2016. Available online: http://ec.europa.eu/eurostat/data/database (accessed on 15 November 2016).
  30. Aguiar, A.; Narayanan, B.; McDougall, R. An Overview of the GTAP 9 Data Base. J. Glob. Econ. Anal. 2000, 1, 181–208. [Google Scholar] [CrossRef]
  31. Britz, W.; Witzke, P. CAPRI Model Documentation. 2014. Available online: http://www.capri-model.org/docs/capri_documentation.pdf (accessed on 6 November 2017).
  32. Joint Research Centre. Jobs and Ministry of Economy and Competitiveness Turnover in the European Union Bioeconomy. 2017. Available online: http://datam.jrc.ec.europa.eu/datam/public/pages/datasets.xhtml (accessed on 15 November 2016).
  33. Byron, R.P. The Estimation of Large Social Account Matrices. J. R. Stat. Soc. Ser. A 1978, 141, 359–367. [Google Scholar] [CrossRef]
  34. Günlük-Senesen, G.; Bates, J.M. Some Experiments with Methods of Adjusting Unbalanced Data Matrices. J. R. Stat. Soc. Ser. A 1988, 141, 473–490. [Google Scholar] [CrossRef]
  35. McDougall, R. Entropy Theory and RAS Are Friends; GTAP Working Paper; Department of Agricultural Economics, Purdue University: West Lafayette, IN, USA, 1999. [Google Scholar]
  36. Robinson, S.; Cattaneo, A.; El-Said, M. Updating and Estimating a Social Accounting Matrix Using Cross Entropy Methods. Econ. Syst. Res. 2001, 13, 47–64. [Google Scholar] [CrossRef]
  37. Eurostat. Labour Force Survey (lfs_egan22d). 2016. Available online: http://ec.europa.eu/eurostat/data/database (accessed on 15 November 2016).
  38. Eurostat. Economic Accounts for Agriculture (aact_eaa01). 2016. Available online: http://ec.europa.eu/eurostat/data/database (accessed on 15 November 2016).
  39. Wiedmann, T. On the decomposition of total impact multipliers in a supply and use framework. J. Econ. Struct. 2017, 6, 11. [Google Scholar] [CrossRef]
Figure 1. Output and employment multipliers of the bioeconomy’s broad subsectors, and the bioeconomy and nonbioeconomy aggregates. EU28, 2010.
Sustainability 09 02383 g001
Figure 2. Distribution of employment impact generated by the broad subsectors of the bioeconomy. EU28, 2010.
Sustainability 09 02383 g002
Figure 3. Output multipliers of the bioeconomy aggregate sector. European Union member states, 2010.
Sustainability 09 02383 g003
Figure 4. Employment multipliers of the bioeconomy aggregate sector of the European Union member states, 2010.
Sustainability 09 02383 g004
Table 1. Description of the bioeconomy sectors 1.
Broad Sector CodeAggregated Sector CodeDescription
Primary agriculture (Agric)CerealCereals (paddy rice, wheat, barley, maize, other cereals)
VegVegetables (tomatoes, potatoes, other vegetables)
FruitFruits (grapes, other fruits)
OilseedsOilseeds (rape, sunflower, and soya seeds)
OilPlantOil plants (olives, other oil plants)
IndCropIndustrial Crops (sugar beet, fiber plants, tobacco)
OCropOther crops (live plants, other crops)
ExtLiveProdExtensive livestock production (live bovine; sheep, goats, horses, asses, mules…)
IntLiveProdIntensive livestock production (live swine, poultry)
OliveProdOther live animals and animal products
RawMilkRaw milk
FishingFishing
Food processing (Food)AnFeedAnimal feed, fodder crops 1, biodiesel by-product oilcake
RedMeatRed meat (meat of bovine; meat of sheep, goats)
WhMeatWhite meat (meat of swine, poultry)
VegOilVegetable oils
DairyDairy
RiceRice, processed
SugarSugar, processed
OliveOilOlive oil
WineWine
BevTobBeverages and Tobacco
OFoodProdOther food products
Bio-mass supply (BioMass)EnergyCropsEnergy crops
PelletPellets
ForestryForestry, logging, and related service activities
Bioenergy (BioEne)BioElectricityBioelectricity
Biofuel1Biofuel 1st generation (bioethanol, biodiesel)
Biofuel2Biofuel 2nd generation (biochemical and thermal technology biofuel)
Bio-industry (BioInd)WoodWood products
TextileTextiles, wearing apparel and leather
BioChemBiochemicals
Nonbio-based activity (NonBio)NatResNatural resources (coal mining, petroleum, and coal, raw minerals)
EnergyEnergy (electricity and gas)
ManuManufactures
ServiceServices
1 Adapted from Mainar et al. (2017).
Table 2. Output and employment multipliers of the bioeconomy sectors of the EU28 aggregate, 2010.
Output MultipliersEmployment Multipliers Output MultipliersEmployment Multipliers
AgricCereal1.9119.20FoodAnFeed2.0924.59
Veg1.5823.19RedMeat2.1323.08
Fruit0.9617.28WhMeat2.2018.73
Oilseeds1.7016.33VegOil1.4210.29
OilPlant1.0418.50Dairy1.9714.53
IndCrop1.1828.92Rice1.8722.23
OCrop2.3627.68Sugar1.5913.39
ExtLiveProd2.6751.26OliveOil1.5910.81
IntLiveProd2.6225.81Wine1.5111.16
OliveProd2.1720.38BevTob1.9113.88
RawMilk2.5331.52OFoodProd1.8516.97
Fishing1.6415.55BioEneBiofuel11.7112.29
BioMassForestry2.1524.37Biofuel22.1115.37
EnergyCrops1.8910.74BioElectricity1.9711.72
Pellet1.8016.69BioIndTextile1.4013.11
Wood2.0918.49
BioChem1.6912.19
Table 3. Output multipliers of the broad subsectors of the bioeconomy and the bioeconomy and nonbioeconomy aggregates of the European Union member states, 2010 1.
AgricFoodBioMassBioEneBioIndBioEconNonBio
Austria1.931.631.841.821.711.721.86
Belgium1.661.581.501.231.271.521.72
Bulgaria2.571.932.551.451.762.152.12
Croatia2.371.632.011.451.481.851.89
Cyprus1.721.471.710.481.401.541.82
Czech Rep.2.391.802.331.671.871.962.08
Denmark1.961.591.851.271.271.651.71
Estonia2.191.422.212.611.871.811.76
Finland2.641.742.011.872.132.041.98
France2.422.122.572.141.642.142.16
Germany1.971.901.971.791.661.852.06
Greece2.441.972.011.581.522.082.20
Hungary2.131.571.981.491.191.731.60
Ireland1.751.511.861.721.621.581.39
Italy2.372.351.862.312.212.302.43
Latvia2.151.652.671.672.462.172.26
Lithuania2.011.471.931.341.381.611.75
Luxembourg1.400.700.741.410.960.901.40
Malta1.490.990.810.910.761.121.39
Netherlands1.911.611.111.721.061.641.69
Poland2.742.242.542.262.012.342.28
Portugal2.361.972.222.031.902.022.26
Romania1.262.132.732.302.061.862.50
Slovakia2.181.442.501.891.611.791.97
Slovenia1.911.551.801.751.321.541.86
Spain2.432.432.242.161.882.331.93
Sweden1.891.491.711.571.951.711.81
United Kingdom2.451.842.842.241.621.922.32
EU282.091.932.151.841.671.912.09
1 Shaded cells: value greater than EU28 value.
Table 4. Employment multipliers of the broad subsectors of the bioeconomy and the bioeconomy and nonbioeconomy aggregates of the European Union member states, 2010 1.
AgricFoodBioMassBioEneBioIndBioEconNonBio
Austria21.1312.1211.149.5010.6312.948.81
Belgium10.588.139.755.056.598.146.32
Bulgaria70.6941.7671.5927.1245.9253.7733.16
Croatia62.9932.4055.0824.6732.0542.6824.78
Cyprus24.2811.9241.745.3016.4116.7011.80
Czech Rep.32.3520.7934.0017.3927.2625.4018.85
Denmark11.027.9511.105.727.758.786.85
Estonia46.4825.3940.7733.4932.9733.6417.18
Finland23.2311.1812.208.1912.2313.579.46
France18.3314.1617.5112.5411.3214.9110.73
Germany18.1314.9317.7011.9612.4114.8111.95
Greece34.5721.5335.3513.4215.5925.4119.71
Hungary52.9832.0956.1522.7823.4338.9622.29
Ireland30.017.9711.506.296.1410.964.94
Italy21.0715.3330.3211.5114.9616.2213.35
Latvia57.2438.2057.4930.8949.8548.3625.37
Lithuania57.1635.4051.6521.9132.0241.0422.06
Luxembourg10.872.211.372.812.433.372.89
Malta17.078.074.256.067.6010.947.40
Netherlands12.609.118.068.176.619.886.30
Poland70.8846.4159.5335.6337.9451.4430.35
Portugal46.8928.3830.2020.7927.9331.5820.63
Romania50.7358.2277.0443.1551.4955.0839.85
Slovakia22.1911.5513.0110.339.9314.117.04
Slovenia51.4038.0152.1629.8930.2338.3924.75
Spain25.4917.3829.8114.7914.7118.6614.65
Sweden14.179.6110.208.0311.1810.697.27
United Kingdom20.9214.3532.2913.1413.0115.5212.04
EU2826.4817.0824.2612.6514.5218.5717.80
1 Shaded cells: value greater than EU28 value.

