Article

Decoupling Food from Land: The Evolution of Spanish Agriculture from 1960 to 2010

Agroecosystems History Laboratory, Universidad Pablo de Olavide, 41013 Sevilla, Spain
*
Author to whom correspondence should be addressed.
Sustainability 2017, 9(12), 2348; https://doi.org/10.3390/su9122348
Submission received: 16 November 2017 / Revised: 9 December 2017 / Accepted: 11 December 2017 / Published: 16 December 2017
(This article belongs to the Special Issue Natural Resources Economics)

Abstract

:
For a large extent of historiography, the history of Spanish agriculture during the twentieth century is a story of success. However, this narrative has been built on monetary analysis, and it does not usually take into account the effects on rural society and agroecosystems. The aim of this paper is to analyze what has happened from a biophysical perspective to ascertain whether transformations linked with industrialization of agriculture have also been positive. For this, we have integrated the results—some unpublished and others already published—of a broader research project about different aspects of food production from a biophysical perspective in Spain, applying methodologies pertaining to the Social Metabolism. Our research seeks to provide a new narrative, emerging through the consideration of environmental aspects of the process, providing a more complex vision of the process of industrialization in European agriculture. The results show that the industrialization of Spanish agriculture has brought about profound changes in land uses and in the functionality of the biomass produced, increasing pressure on croplands and, paradoxically, facilitating the abandonment of an important proportion of pasture and croplands. This has led to the subordination of a very significant portion of Spanish agroecosystems to the feed demands of intensive livestock farming. This process has been based on the injection of large quantities of external energy. Agricultural production has undergone significant growth since the 1960s, but this has been insufficient to deal with the growing demand created by the change in the Spanish diet and the increasing trend to focus on livestock farming. The process of globalization has allowed both roles to be reconciled, although in recent decades Spain has accentuated its role as a net importer of biomass from a biophysical perspective, with very significant impacts on third party countries, particularly in Latin America. From a biophysical perspective, the industrialization of Spanish agriculture has entailed negative consequences that threaten the sustainability of Spanish agroecosystems and also negatively affect the sustainability of other territories.

1. Introduction

Following decades of enquiry into the causes of the supposed “backwardness” of Spanish agriculture [1], historiography has in recent years focused on analyzing the contribution it makes to economic growth [2,3,4]. The Spanish transition to industrial metabolism has accelerated since the 1960s. The increase of Domestic Material Consumption of and Domestic Material Extraction rates has been much higher than the surrounding countries [5]. Spain’s agrarian production also grew at an annual rate of 2.3% during the period 1950–2000, higher than the average rate for the European Union (1.3%), and the total productivity of the different factors also grew at an annual rate of close to 2%, one of the highest levels on the continent. In the last decades, the trend has continued. While the EU’s agricultural production has not grown since the mid-1980s, Spain maintained an annual production growth of 1.29% to the beginning of the twentieth first century [6]. Even the contribution made by the agrarian sector to other economic sectors seems to have been similarly positive, expressed through the decline of the real exchange rate, at least from the mid-1960s onwards [6]. The agrarian sector has been integrated vertically into a broader economic structure that is responsible for the transformation and supply of foodstuffs, chiefly providing raw materials. This contribution is considered to be even more significant than the economic results achieved by the sector itself. The balance so far is, therefore, positive. However, this entire process of industrialization has brought about some very significant changes within the sector itself—economic, social and environmental—which cannot be considered in the same light [7,8].
The aim of this paper is to analyze what has happened from a biophysical perspective to ascertain whether such transformations have also been positive. The study is divided into the following sections: firstly, it examines the changes that have taken place with regard to eating habits, paying particularly close attention to diet. Secondly, it analyzes the way in which the agrarian sector has responded to these new demands, and the main transformations this has brought about in terms of agrarian production and inputs. To this end, we have integrated the results of a broader research project about different aspects of food production from a biophysical perspective in Spain, research conducted in recent years in the Agro-Ecosystems History Laboratory, applying methodologies pertaining to the Social Metabolism. These research findings have been published separately [5,9,10,11,12]. The paper concludes with a discussion and conclusions that supplement the monetary interpretation, venturing certain hypotheses regarding the main drivers of the process of food industrialization and globalization in Spain.

2. Sources and Methods

To ascertain the main orientations of food demand, we have analyzed the changes that have taken place in the Spanish diet since the 1960s. This has been achieved by estimating total flows of biomass produced, appropriated and consumed within Spain between 1960 and 2008. This has allowed us to reconstruct the apparent consumption of food. Apparent consumption alludes to the quantity of biomass, both plant and animal, produced within Spain and used for human consumption, adding imports and deducting exports. In this respect, the methodology employed shares some of the assumptions used by the FAO [13] to construct its food balance sheets. However, the metabolic methodology offers a biophysical perspective of changes that are not captured by the FAO methodology. For example, the metabolic methodology takes into account all the biomass produced in agro-ecosystems, both above and below ground, as well as dry matter, something that the FAO’s methodology does not, since it was constructed for a different purpose. We have deducted the proportion of production allocated to seeds and other uses (fundamentally animal feed but also industrial uses), and we have also deducted the inedible part of foods (pips, peels, and stones). Unlike the FAO food balances, which provide annual food consumption data, our data represent five-year averages and do not take into account variations in stock.
Furthermore, our data reflect apparent food consumption, rather than “real consumption”, which is given in the “Survey of Family Budgets” published by Spain’s National Institute of Statistics (INE) from 1958 onwards. In addition, these surveys do not always include consumption outside the home, which accounted for 32.3% of aggregated food consumption in Spain in 2015 [14]. This and other factors (accountability of consumption in public institutions, evaluation of losses in the food chain, etc.) might explain the significant difference that exists between these sources and our apparent consumption data in terms of the annual per capita consumption figures. Since our aim is not to assess the nutritional content of diet, but rather the transformation experienced by the agrarian sector, we are particularly interested in “gross” quantities of foods destined to human consumption directly or indirectly, through livestock. Consequently, the metabolic methodology is the most suitable and coherent approach to take when working towards this goal, bearing in mind that it ensures the required coherence in the data and in their elaboration.
The food balance series published annually by the FAO since 1961 offer percentages of losses per product throughout the food chain, but not for those losses produced within the home and in other food consumption activities outside the home. For these types of losses, we only have current information. The most recent and complete study about this subject was carried out for the FAO by the Swedish Food and Biotechnology Institute [15]. It compiles information about losses for the five major processes (production, handling and storage post-harvest, processing and packaging, distribution and consumption), and seven geographical areas. The results show a percentage of losses in consumption that is much greater in industrialized than non-industrialized countries. These types of losses are difficult to estimate for the past. Consequently, when calculating losses in consumption, we have assumed the current European value for the years 2000 and 2008, whereas for the previous years, we have extrapolated values taking a linear approach up to 1960, assuming that in that year the percentages of losses would be similar to those found today in Southeast Asia.
Data on apparent consumption have been taken from a much broader study conducted into the metabolism of Spanish agriculture [11] based on Economy-Wide Material Flow Accounting (EW-MFA). This is a well-known methodology that has, however, had to be adapted to the specificities of the agrarian sector. For example, the standard methodology considers part of the products in terms of fresh matter and another part (fundamentally fodder and forage plants) in terms of dry matter [16], adding different weights together. We have chosen to consider all the types of biomass in terms of dry matter, an approach usually taken in specific studies about biomass to avoid the distortions produced by the varying water content values of the different types of biomass, above all, pasture and crops (between 15% and 95%) [17,18].
The EW-MFA methodology provides high quality information about all the biomass extracted in the country, but we also included all the biomass produced, in other words, the actual Net Primary Productivity (NPPact) of Spanish agroecosystems and the different categories they encompass, as described below. Among these are the proportions of biomass that are destined for human consumption, either directly or indirectly, through livestock. This methodology distinguishes between the domestic extraction (DE) and domestic consumption (DC) of biomass. This latter element is the result of adding imports from third party countries and subtracting exports from DE. Consequently, DC enables the apparent consumption of human food and the cost of animal feed in terms of biomass to be reconstructed, taking into account the net foreign trade balance.
The sources used to calculate biomass extraction were the statistics provided by the Spanish government, with different degrees of quality and regularity between 1960 and 2008 (most of these publications are available online: http://www.magrama.gob.es/es/estadistica/temas/publicaciones/anuario-de-estadistica/). We have reconstructed the evolution of actual Net Primary Productivity (NPPact) based on the construction of six points in time between 1960 and 2008, employing five-year averages. The methodology utilized for these calculations is set out in Guzmán et al. [19] and explained in Guzmán Casado and González de Molina [12] and Soto et al. [11]. For the calculation of livestock production, we have used data about meat and milk productions available in Spain’s Agrarian Statistics Yearbooks [20]. As for inputs, we have mainly used the same Yearbooks, which offer data about the consumption of each type of fertilizer in terms of nutrients, the installed power of farming machinery, the land area covered by greenhouses and other protected crops, and the consumption of pesticides. For electricity and fuel, the data from the yearbooks have been supplemented with figures from FAOSTAT. Land area data for each type of irrigation have been taken from Calatayud and Martínez-Carrión [21], MAPA [7] and MAGRAMA [22].

3. Results

3.1. Changes in Demand: The Shift Away from the Mediterranean Diet

Table 1 shows the fresh plant and animal biomass allocated to satisfying the endosomatic metabolism of the Spanish population. The total quantity of biomass consumed almost doubled, from 18.4 to 35.1 Tg, pushing up consumption per capita by around 30%. However, plant biomass rose during this period by just 12.2%. Growth was intense between 1960 and 1990, but declined by 10.2% between 1990 and 2008. The contribution made by plant biomass to the Spanish diet contrasts with the spectacular growth of animal biomass: between 1960 and 2000, consumption more than doubled, up to 827 g/capita/day, although it moderated over the past decade. Currently, plant biomass accounts for close to 35% of total fresh biomass consumed. The same table breaks down the previous data according to the different food groups, showing a significant decline in the consumption of cereals, legumes, root vegetables, and in contrast, a significant increase in the consumption of meat, dairy, fish, oil, and alcoholic beverages.
Table 2 shows the energy value (gross energy of the edible portion), expressed in calories per person per day, of the foodstuffs consumed between 1960 and 2008. There is a 20% increase in the number of calories ingested, between 1960 and 2000, substantially surpassing basic needs, situated between 2314 (1960) and 2434 kcal (2011) [23,24]. However, perhaps the most significant aspect is that this increase has been sustained above all by the ingestion of animal origin foodstuffs. The group of cereals, legumes and potatoes, which constitutes the basis of the diet, dropped from 40% of the energy ingested in 1970 to just over 23% today. In 2000, both groups of foodstuffs provided a similar proportion of energy: 24% and 25%, respectively. The consumption of oil has also increased, supplying almost a quarter of calorie intake in 2008. If we add in oil, fundamentally olive oil, these two groups of foodstuffs, representing 47% of calorie intake, constitute the basis of the Spanish diet [25].
Table 2 also shows a sustained and prolonged tendency to replace plant proteins with animal proteins. Currently, two thirds of protein intake are provided by animal biomass. Table 3 shows the composition of foodstuffs consumed in terms of carbohydrates and lipids or fats. A very high percentage of carbohydrate intake has been provided by plant foodstuffs, and a much smaller percentage comes from animal origin foodstuffs, although the latter has grown in recent decades. As for fats, a distinctive sign of Mediterranean consumption patterns has been the intake of plant fats, particularly olive oil. However, the intake of animal origin fats has gradually increased to represent over a third in the present day. Today, fat is provided chiefly by olive oil, meat, and dairy.
At the start of that decade, carbohydrates provided practically 60% of the total calorie intake. Currently, they provide just 39.2% of the total, substantially below WHO recommendations. In parallel, the percentage of fats in the Spanish diet has increased, and these fats are increasingly taken from animal sources. In the 1960s, the intake of fats was within WHO recommended guidelines, but, by the start of the 1990s, the percentage of fats and carbohydrates was practically the same. Today, the intake of fats provides 43.3% of total kcal. They have increased from 77 g per person per day to 156. Meat, milk and other dairy products are directly responsible for the majority of this increase, but they are not the only foodstuffs. The percentages offered by the nutritional assessment of the Spanish diet, conducted in relation to the official data provided by the Food Consumption Panel (Panel de Consumo Alimentario [27]] are fairly similar. The consumption of meat has more than quadrupled, from 56 g/capita/day in the 1960s to 243 g/capita/day today, with pork and chicken registering the greatest increases. The consumption of milk increased from 291 g/capita/day to 488 g/capita/day, and the consumption of eggs increased from 15 to 25 g/capita/day.

3.2. Changes in the Domestic Food Supply

These changes in diet have been mirrored by the agrarian sector, which has undergone profound transformations to meet the new demands. Table 4 shows the changes that have taken place in land uses. Cropland area, which has been constantly growing since the early 20th Century (16.5 millions of hectares (Mha)), reached its highest level, above 20.8 Mha, in the early 1970s [11]. Since then, it has gradually declined, to the current land area of 17.2 Mha, a loss of 3.6 Mha for crops. In contrast, land uses that could be grouped under the category of “forestry” have increased by 12%. Of particular note is the increase in lands classed as monte alto (high forest), populated by more or less homogeneous forest masses, the surface area of which has increased by 68.5% since 1960. This is due to the reduction in pastureland (−10%) and cropland (−15.4%). This reduction is closely related with the cessation of agricultural and livestock activity, which has seen a reduction of around 4.4 million hectares of pasture and cropland since then [28].
Actual Net Primary Productivity grew moderately between 1960 and 2008 (17.3%), owing to the growth of Accumulated Biomass (39%), Socialized Biomass (23%) and Unharvested Biomass (18%). It was the result of two opposing tendencies: on the one hand, the abandonment of “marginal” croplands and pasturelands, which were gained by the forest and which raised the quantity of unharvested and accumulated biomass; but on the other, by the increase in cropland productivity. The increase in Domestic Extraction (+5 Tg) made it possible for Socialized Biomass to grow at a similar rate, especially plant biomass destined for human consumption and raw materials for industry. Meanwhile, Reutilized Biomass, in other words biomass destined for livestock feed and the replenishment of seed, remained at practically the same levels as in the 1970s. This does not correspond with the spectacular growth in livestock numbers.
Table 5 shows the different categories that make up domestic extraction (DE). Its increase (7.9%) also conceals several opposing phenomena. In line with the growth in forests and forestry policy, which combines conservation with timber extraction, the extractions of wood for industry tripled, from 2399 to 8160 Gg of dry matter. Extractions of biomass on cropland also increased, by 88.5%, concentrated in cereals (12,635 Gg), olive groves (2327 Gg) and industrial crops (1056 Gg). All crops saw an increase in extracted biomass, with the exception of leguminous vegetables (−467 Gg), which lost over 70% of their production, and vegetables and tubers did not undergo any significant changes. On the other hand, extractions of biomass due to harvest by-products decreased (−7.8%) in line with the introduction of new seed varieties that increased yield coefficients. This decrease was partially compensated for by the increase in pruning by-products from olive groves, vineyards, and fruit trees, but also by the burning of part of them. In line with the energy transition that took place in Spain (Infante et al. 2015) and the country’s forestry policy, extractions of timber decreased significantly to just 14% of those registered in 1960. Pastured biomass also fell, by 60%, from 18,837 to 7596 Gg dry matter, a decrease (−60%) due not so much to the decrease in pastured land area (−10%) as to the abandonment or underuse of pastureland. This result seems contradictory at first bearing in mind the increase in livestock numbers we will see below.
In short, cereals, olive groves, fruit trees, industrial crops and artificial meadows and forage have been the crop groups that have grown the most during the period studied. This corresponds only partially to the specialization in horticultural production and olive oil that, from a monetary perspective, is observed in the evolution of the sector [29,30]. However, the evolution of crops makes sense when analyzing, from a biophysical perspective, the growing livestock specialization seen in the sector in recent decades. A very significant change in the use of biomass has taken place.
In effect, the production of cereals has almost trebled since 1960, even surpassing the levels attained at the start of the century, accounting for 54% of biomass extracted from cropland, an unprecedented proportion. However, the percentage represented by cereals in the Spanish diet fell by half between 1964 and 2006 [27]. This means that the production of cereals has been increasingly orientated towards animal feed. If we add fodder, which grew by 10% from the start of that decade, harvest by-products (straw, leaves, etc.) and grazed biomass, the total quantity of biomass allocated to animal feed accounts for 57.5% of domestic extraction (Table 6). The quantity is practically the same as in 1960 (40,480 Gg in 1960 vs. 39,367 Gg today), but with significant differences. At the start of the 1960s, a very important proportion of DE was used to feed work animals, which is now practically inexistent. On the other hand, the bulk of livestock back then grazed on pasture or were fed harvest by-products, and to a lesser extent grains, which were destined for human consumption. The size, composition and functionality of livestock numbers today are completely different.
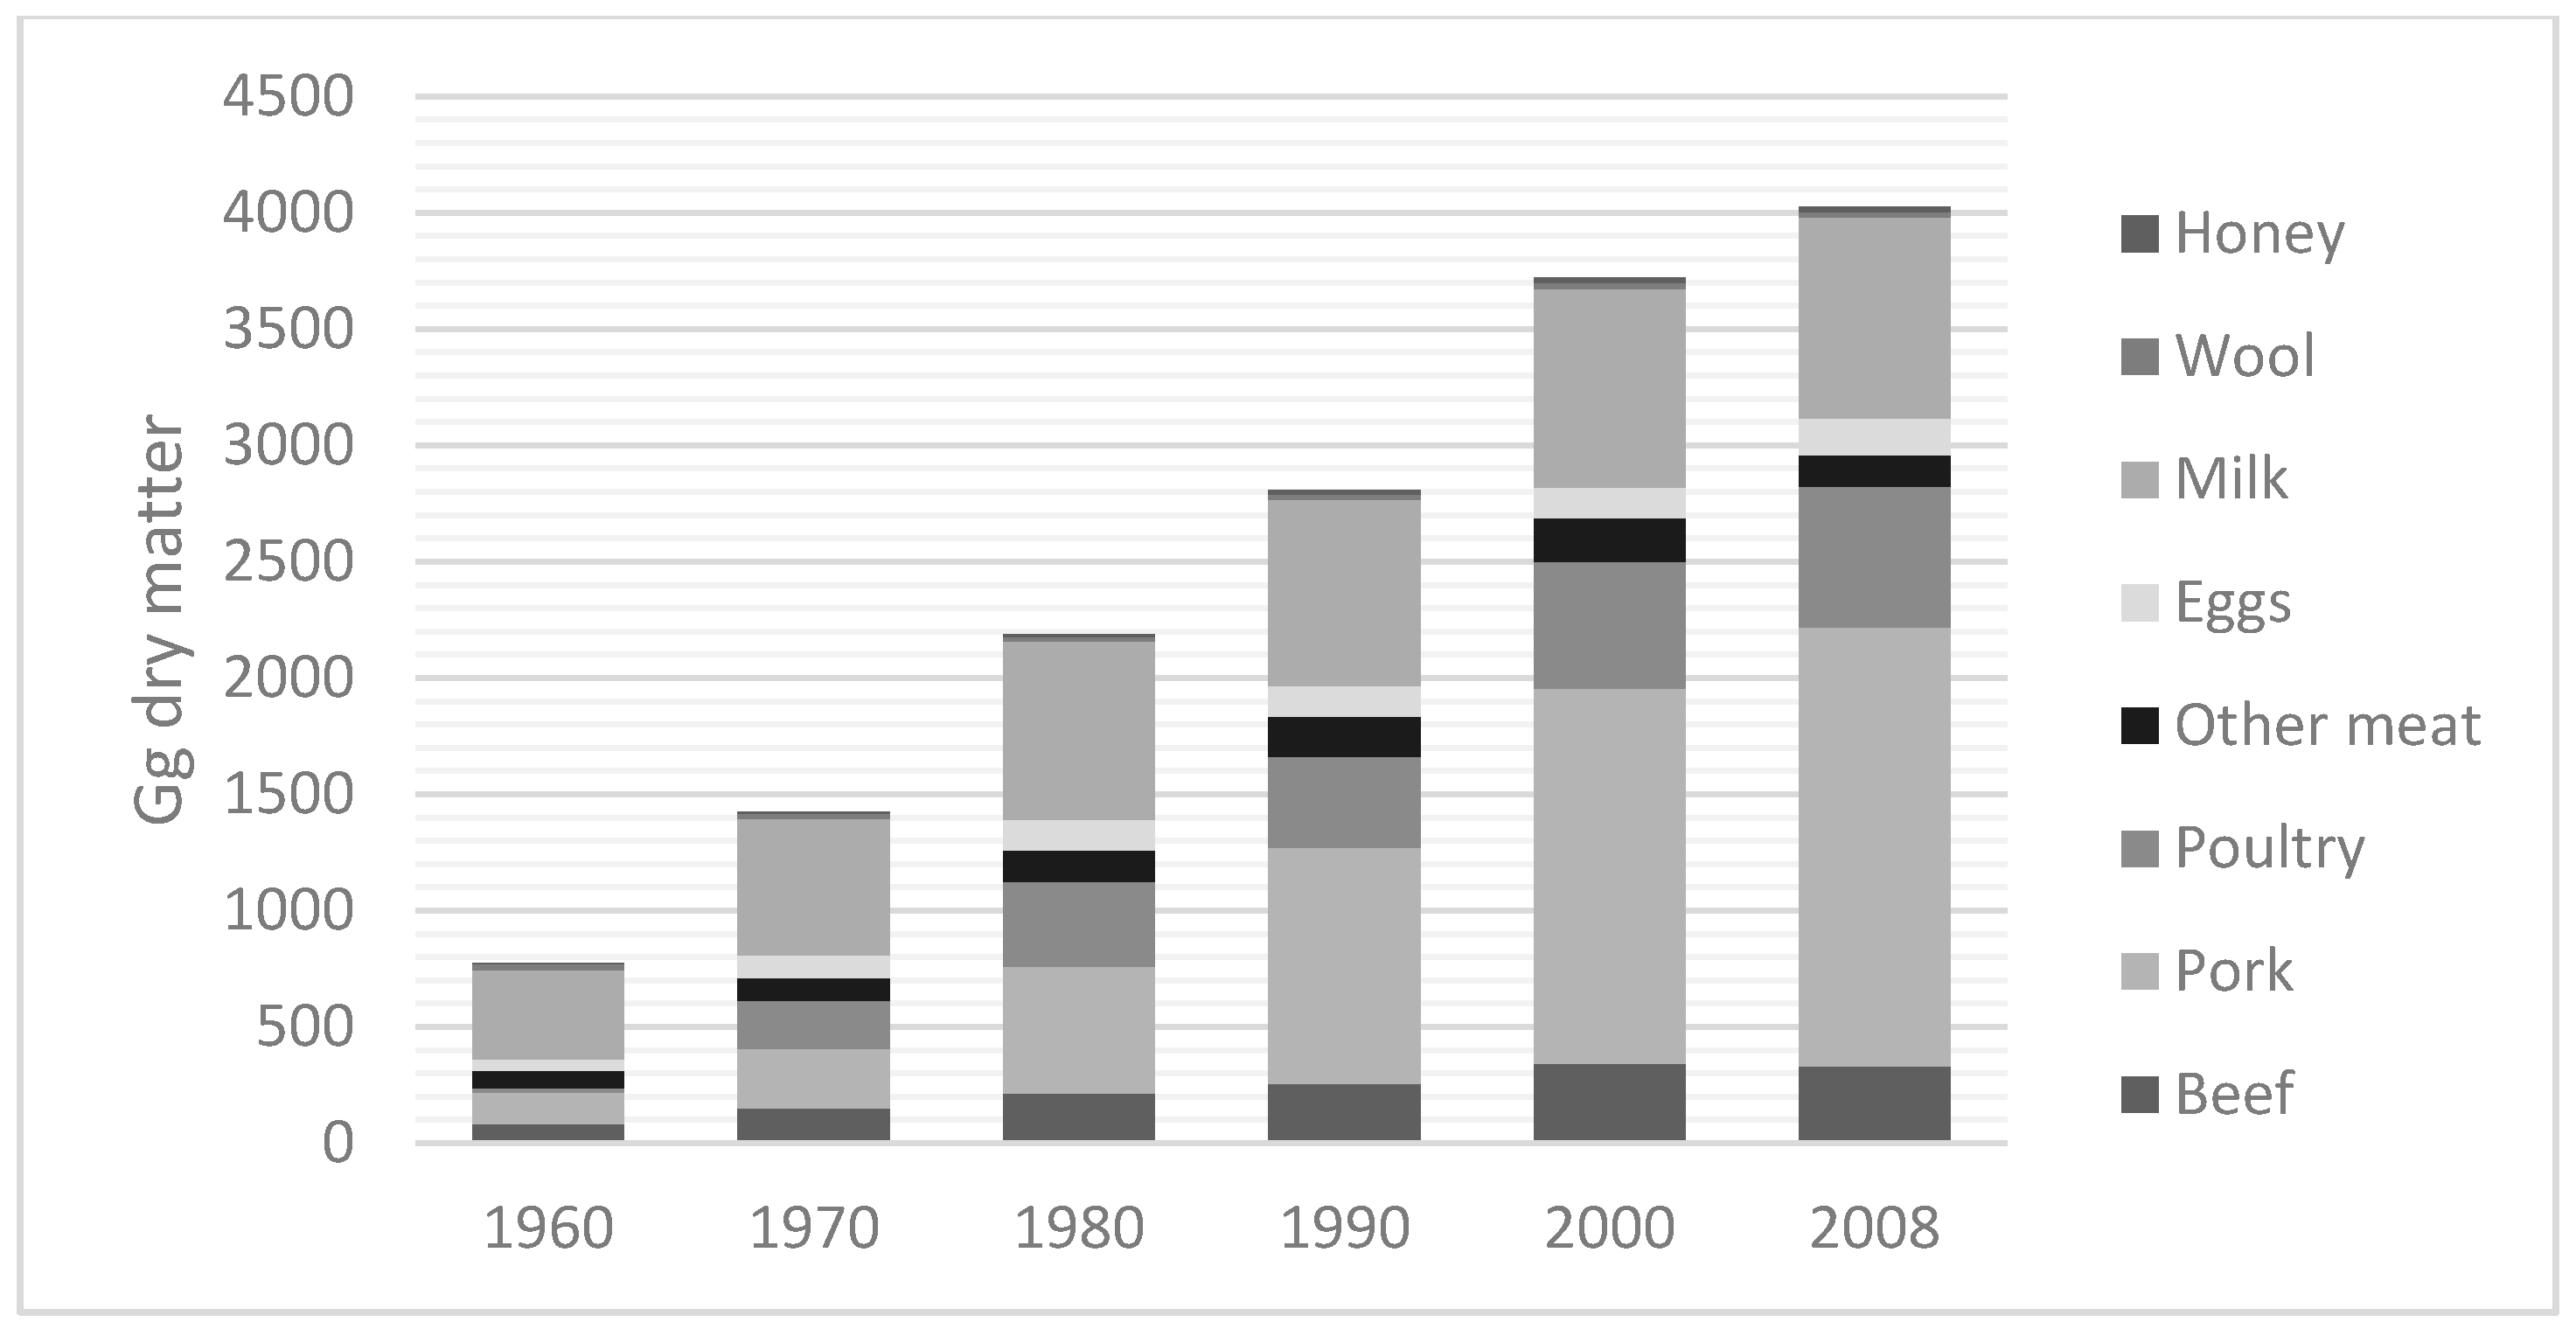
Indeed, the changes observed (Figure 1 and Figure 2) reflect the growing importance of the production of meat and dairy products. Livestock numbers and their live weight has more than doubled. Work animals has disappeared, and horses are now largely dedicated to recreational or sporting activities, whereas pigs and poultry currently represent 53.1% of livestock numbers. Cattle livestock has the same weight in 2008 as the start of the 20th Century, when it was a mixed purpose species (food and labor). However, today, cattle breeds are used solely for the production of meat and milk.
These changes have had a significant impact on livestock feed, since the species at the forefront of growth after 1970 were monogastric animals. This has meant that livestock has become more dependent on quality animal feed (chiefly grains) than on pasture, for which traditional livestock species such as extensively farmed sheep, goats, and cattle are better adapted. Whereas, in the 1960s, livestock feed still depended largely on pasture and on crop by-products (45% and 25%, respectively), since that time, livestock feed has become increasingly dependent on quality livestock feed from crops and industrial transformation (Figure 1b). Hence, in 2008, 48% of animal feed came from crops, and only 29.6% continued to be provided by pasture and crop by-products. These data are congruent with the abandonment of a significant part of the agrarian land area utilized and the underuse of pasture, as shown by domestic extraction figures in Table 5.

3.3. Foreign Trade and Domestic Consumption of Biomass

Turning to the international market has made it possible to reconcile all these opposing trends. Until the 1960s, the weight of foreign trade in the economy was still very low, but from that date onwards, growth began to accelerate and it has not yet slowed down. Imports increased from 2206 Gg to 31,929 Gg, while exports rose 637 Gg to 12,672 Gg. There has also been a significant change in its composition: until the 1960s, the majority of biomass flows from foreign trade were concentrated in the category of food for human consumption, but tended to diversify after that date. In 2008, Spain mainly exported wood and food in biophysical terms, and to a lesser extent animal feed. The biggest import, on the other hand, has been feed, which has grown since 1960 to account for almost half of all imported biomass (42%).
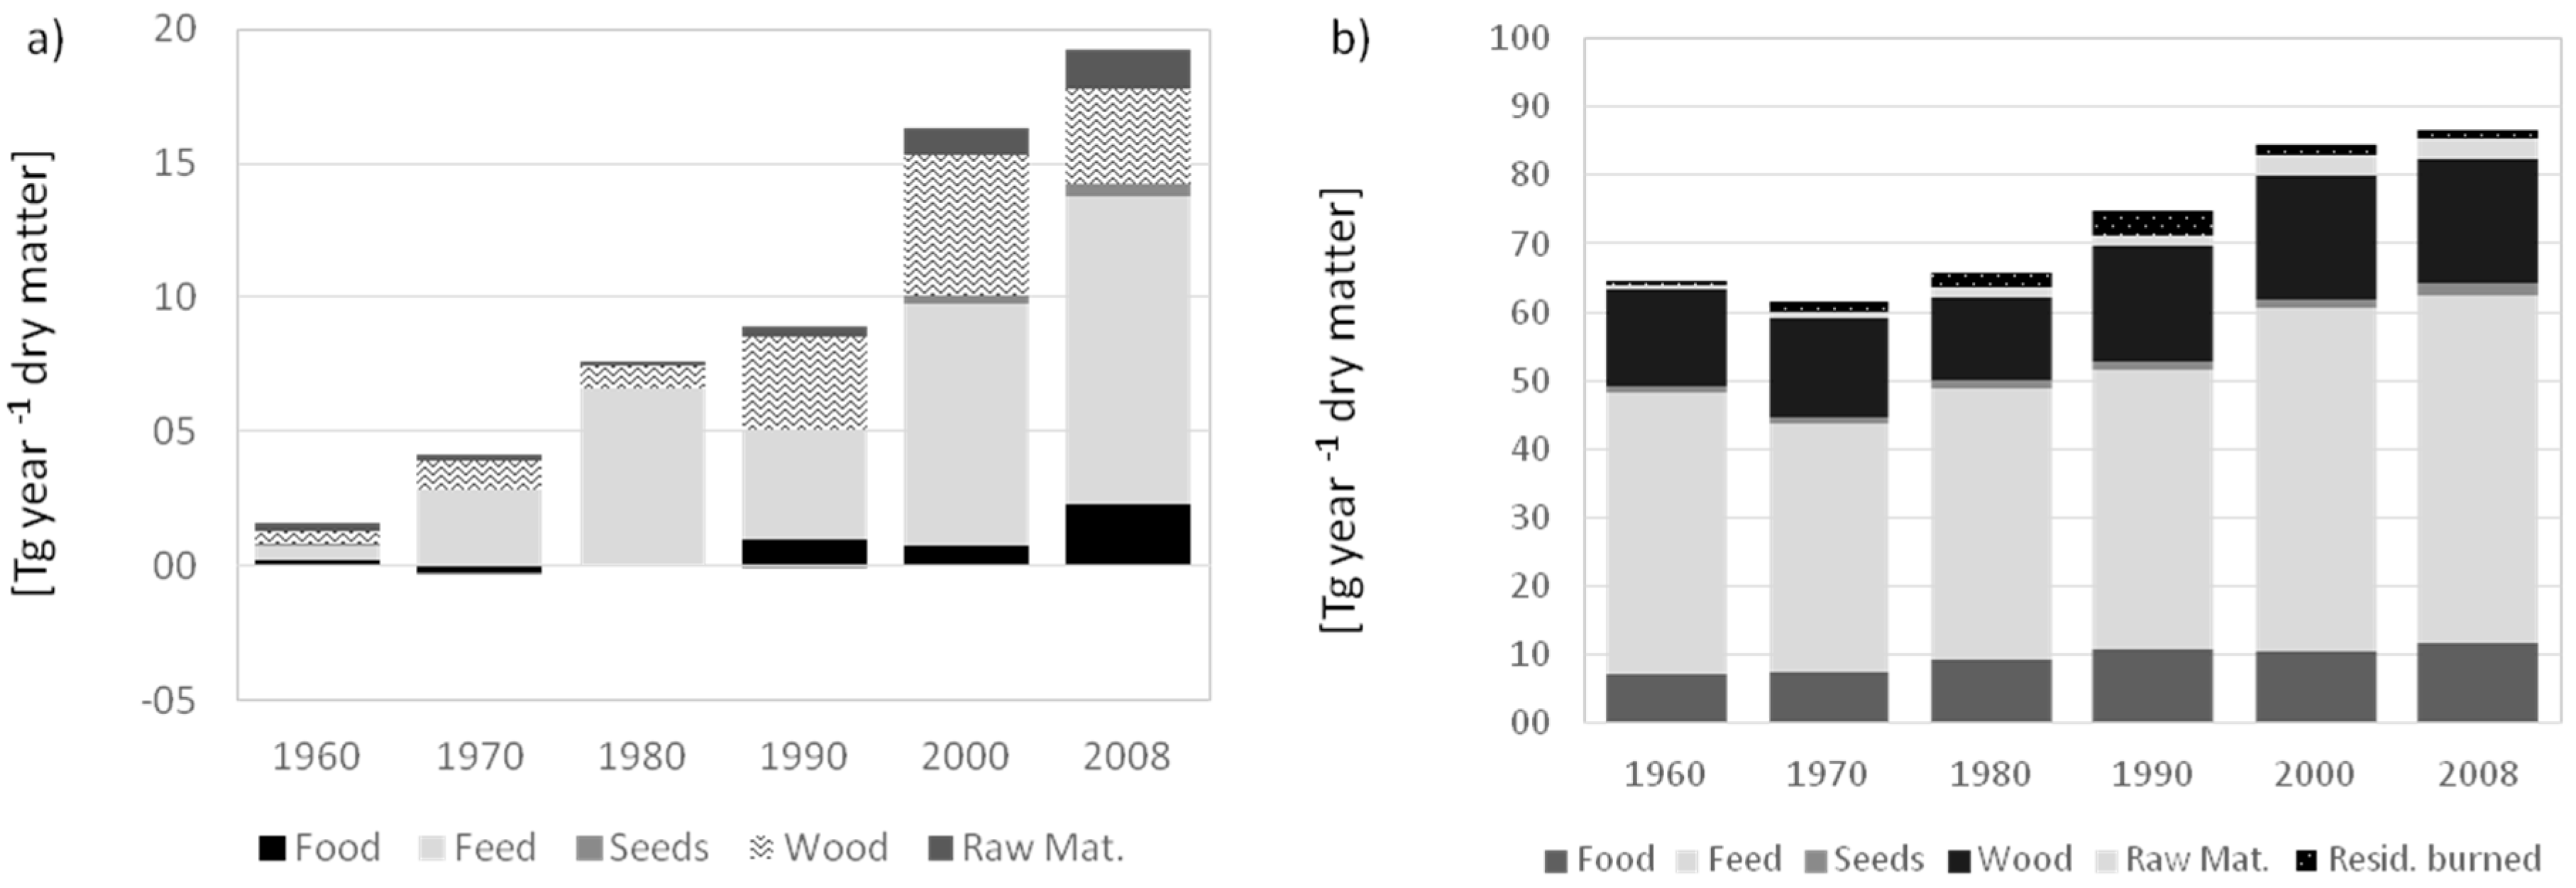
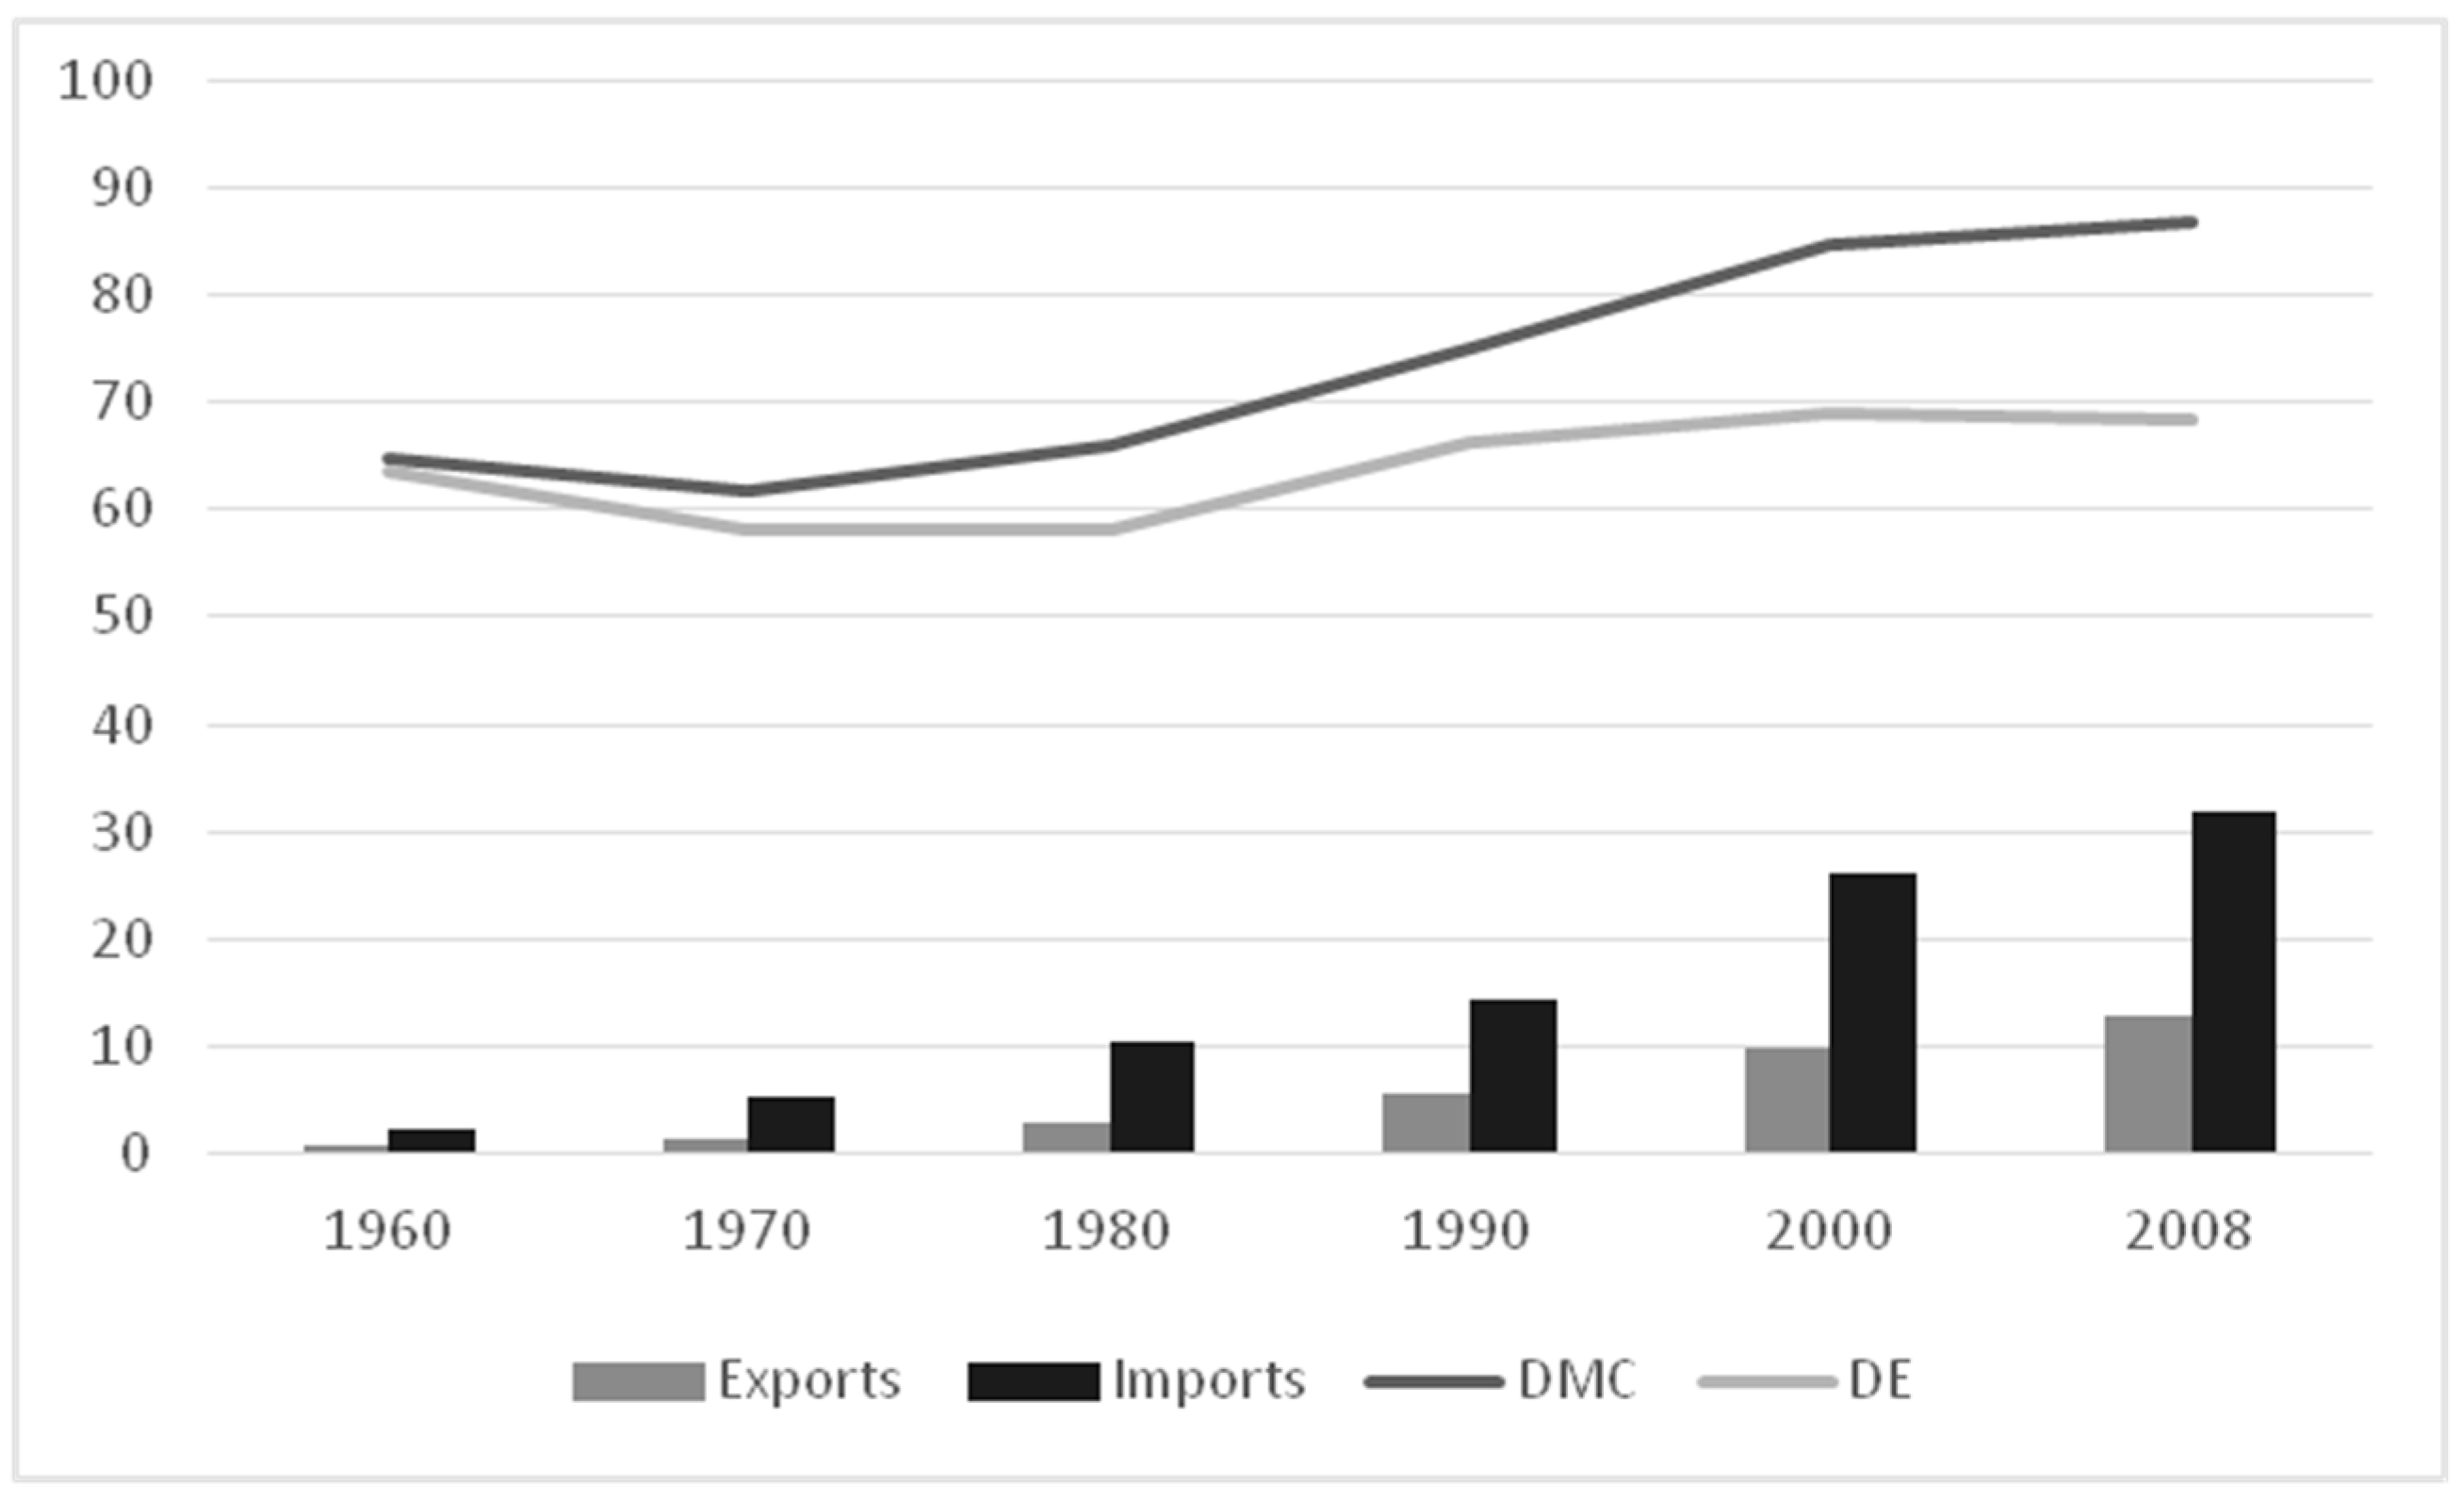
Figure 3a shows the net biophysical balance of Spanish biomass trade and highlights two very important phenomena. Firstly, that Spain, despite what the monetary commercial balance indicates, which is positive by over 9500 M€ in 2015 [31], is in reality a net importer of biomass (Figure 3a), as are the majority of European countries [32,33]. Secondly, the data show the progressive integration of the Spanish agrarian sector into the global markets and the growing weight of biomass imports in the functioning of an agri-food system that increasingly demands raw materials. This is shown by the growing distance in metabolic terms between domestic extraction (DE) and domestic consumption (DC). These two indicators evolved on a par up until the 1970s (Figure 4). However, from the 1970s onwards, consumption grew more and at a greater speed than DE, thanks to net imports of biomass for animal feed. Hence, the production of animal feed has become decoupled from Spanish agro-ecosystems. Spain’s greater commercial integration over the past 50 years explains, therefore, how the DC of biomass has grown at a much more significant rate (34%) than DE (7.9%). In fact, foreign trade has risen from representing 2.5% of DC in 1960 to 22.3% in 2008.

3.4. The Energy and Material Costs of Food Production

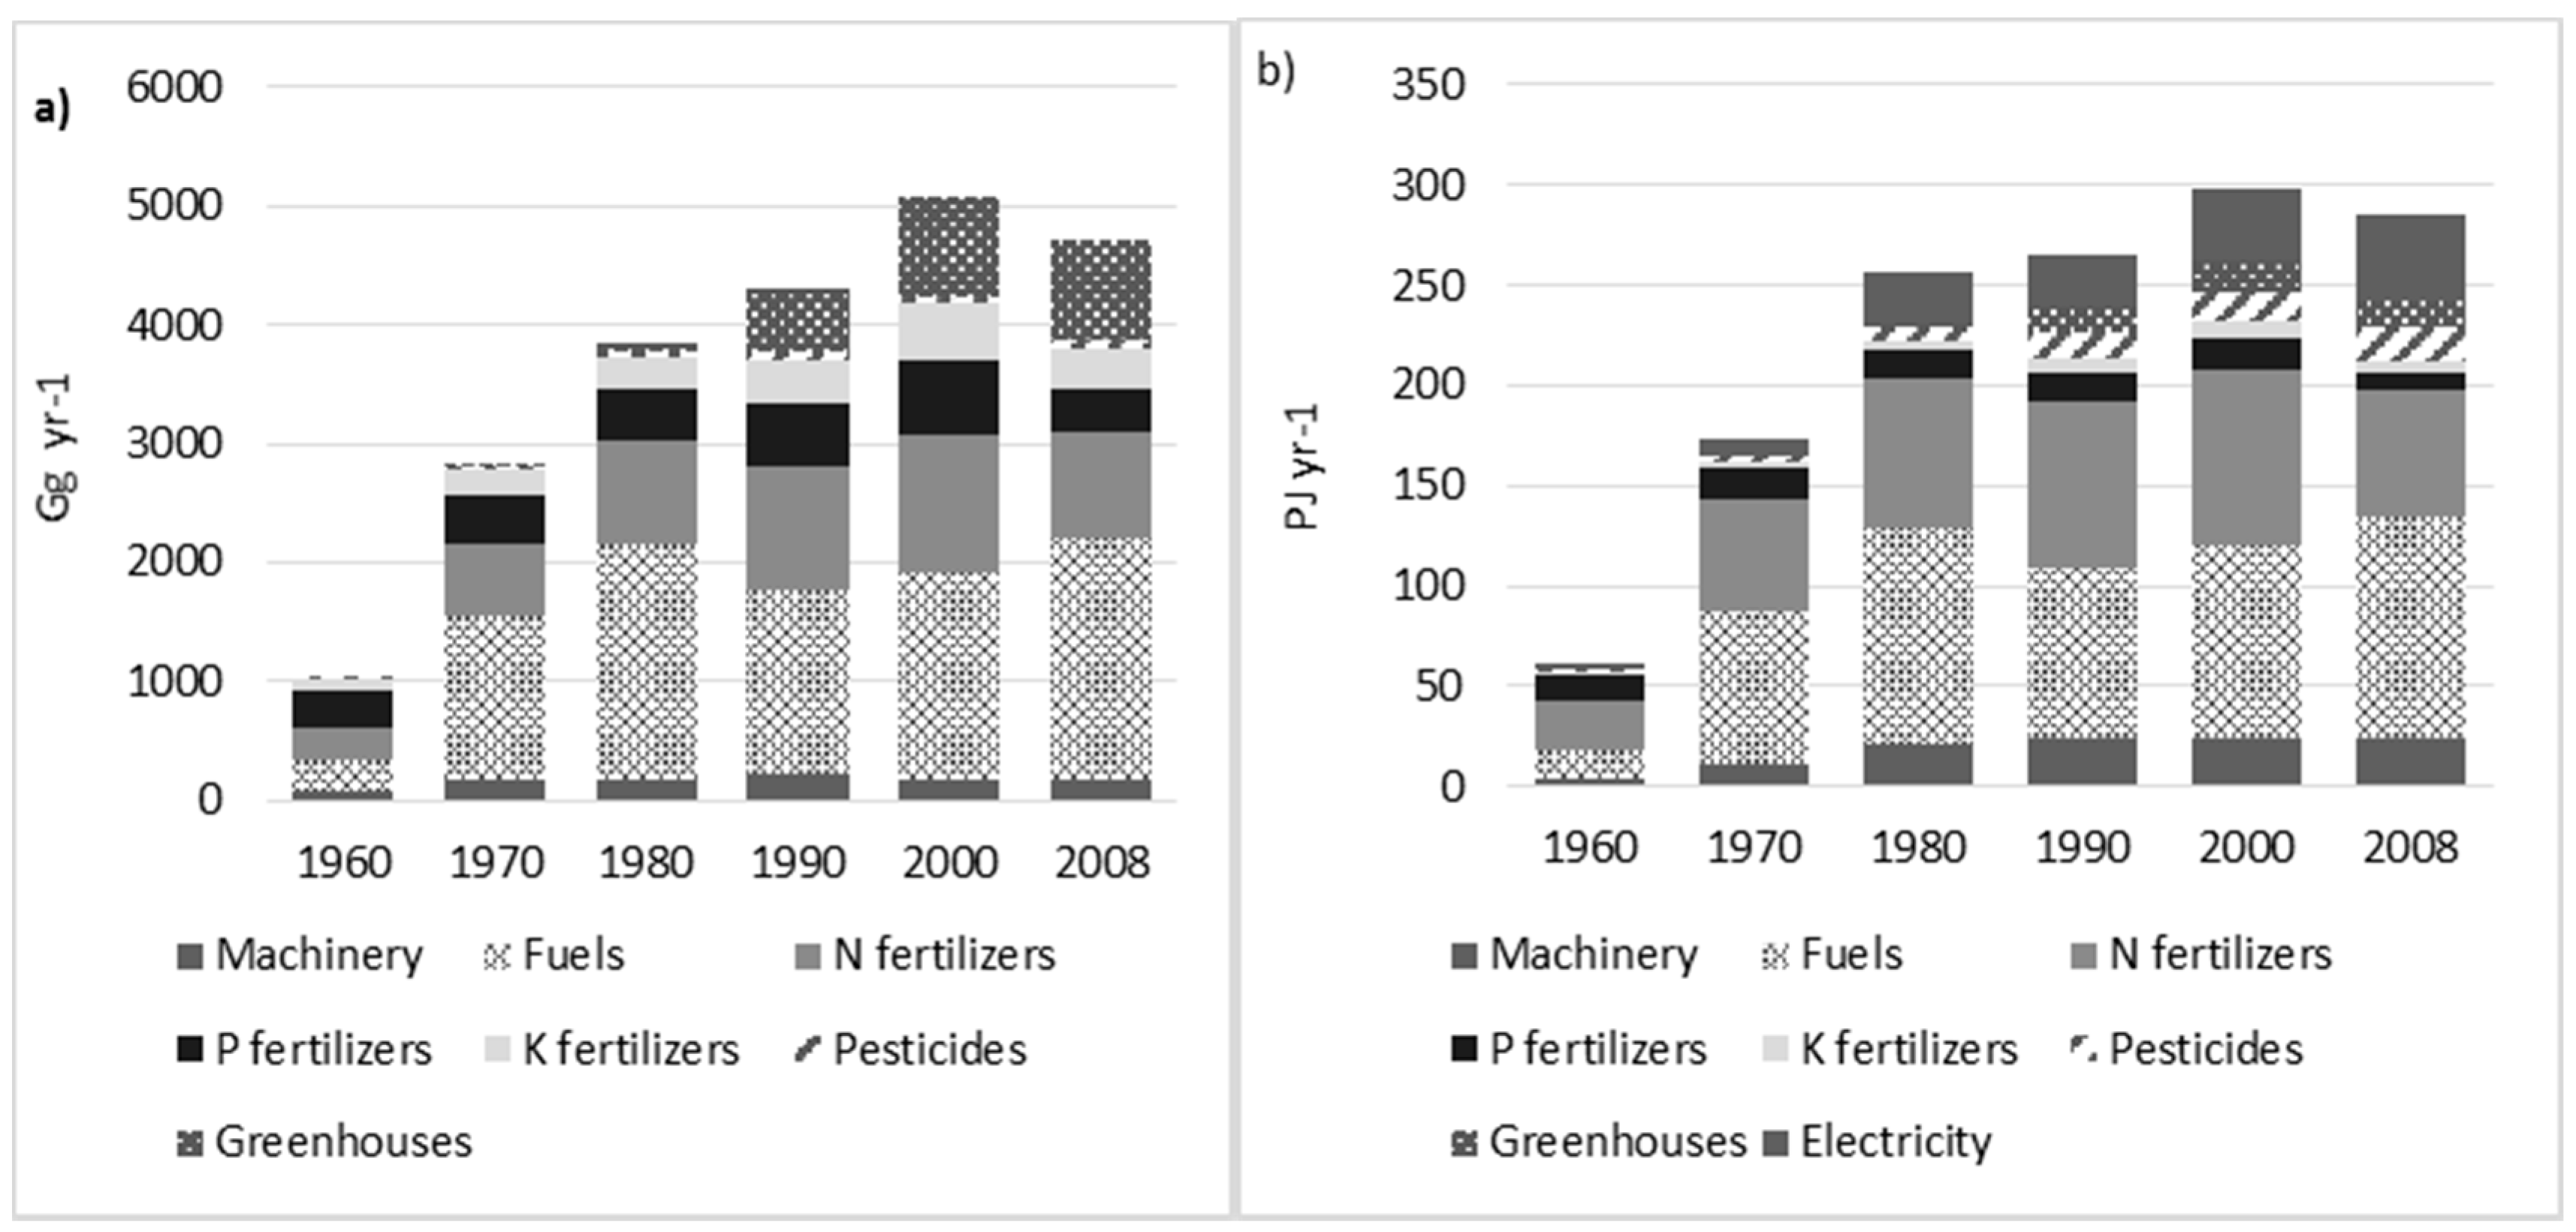
In biophysical terms, the growth in DE, especially the DE of crops, has been made possible by the use of a large quantity of inputs moved or manufactured using fossil fuels. Mechanization has skyrocketed, from 160,000 units of harvesters, tractors, and cultivators to 1.4 million. In turn, the average power of the machinery increased from 12.7 to 39.2 KW/unit between 1960 and 2008. As a result, the total installed power increased from 2 to 56 GW. The total number of machinery units in circulation continued to grow throughout the entire period even though the number of new units registered every year levelled off, since few units are retired or taken out of circulation. Hence, even though the specific weight of machinery (in kg per KW) decreased during the period studied [33], Spanish agriculture consumed 72 Gg a year in agricultural machinery in 1960, a figure that increased to 187 in 2008 (Figure 5a). The increase in the numbers of machinery units in circulation sparked an astonishing increase in fuel consumption between 1960 and 1980, from 275 to 1967 Gg a year, oscillating close to this latter value up to 2008.
The consumption of nitrogen increased four-fold, from 274 Gg in 1960 to 1153 in 2000, falling to 883 in 2008. The consumption of phosphorous fertilizers doubled, from 299 to 613 Gg P2O5 between 1960 and 2000, falling to 376 Gg in 2008. The growing area of land taken up by greenhouses and protected crops has also contributed to the increase in the consumption of materials, in which plastic, steel and concrete are largely consumed. This consumption was inexistent in 1960, reaching 835 Gg a year in 2008, when there were 49,000 ha of greenhouses, 13,000 ha of tunnels and 50,000 ha of plastic padding. Spanish agriculture today is highly dependent on external inputs, just as food depends on imported biomass.
In energy terms, the growing use of industrial inputs has led to a spectacular increase in the consumption of embodied energy, from 61 PJ in 1960 to 290 PJ in 2008 (Figure 5b). Within agriculture, the most relevant cost in 1960 was due to fertilization, which required large quantities of energy to manufacture, principally in the process of synthesizing ammonium to obtain nitrogen. Nitrogenous fertilizers represented 40% of the embodied energy of industrial inputs in 1960, excluding animal feeds. Currently, owing to the stabilization in the use of fertilizers and the development of more efficient methods to synthesize the product, this has fallen to 22% of embodied energy. Furthermore, many other inputs have increased substantially: firstly, fuels, which accounted for 17% of embodied energy in 1960, a figure that rose to 40% in 1970–1980, then falling to 29% in 2008. Meanwhile, electricity increased from 5% in 1970 to 15% in 2008. Imported animal feed has been responsible for the sustained growth in the total embodied energy of Spanish agriculture during the 21st Century, when the other inputs decreased slightly. The large quantity of animal feeds imported from other countries carries a deal of baggage in energy terms, on account of their transportation and their methods of production at source [34].

4. Discussion

In the 1960s, the Spanish population still largely consumed a Mediterranean diet, which was the result of adapting production to the conditions and dynamics of Spain’s agro-ecosystems [25]. However, from that decade onwards, the country gradually adopted food consumption patterns typical of developed countries [35], increasingly removed from WHO recommendations [36,37], a phenomenon known as diet “Westernization” [38]. Del Pozo de la Calle et al. [39] calculated the Mediterranean Diet Score (MDS), noting that in 2008 Spain obtained a score of 4, on a scale from 0 to 9, where this latter value signifies maximum adherence to the Mediterranean diet. These habits are responsible for the fact that 60.9% of the Spanish population is overweight (39.3%) or obese (21.6%) [40] and are associated with degenerative diseases [41] such as colon-rectal cancer [42]. A diet based on the high consumption of livestock products, on the excessive intake of animal proteins and fats, and on the increasing absence of carbohydrates.
This has increased above all the demand for meat, dairy products and eggs, which in turn have sparked a fundamental change in the productive orientation of the agrarian sector: since the 1960s, and markedly in recent decades, production has been largely geared towards animal feed, in other words, towards livestock uses. In effect, the Spanish agrarian sector reacted between 1960 and 2008 by means of a spectacular growth of livestock numbers, the mass introduction of inputs, focusing the extraction of biomass in cropland areas, and paradoxically, through the relative abandonment of pasture and scrublands. However, these changes in food demand have only been partially met through domestic production. The increase in livestock numbers and changes in their composition, where monogastric animals have become extremely important, has been made possible by growing imports of biomass for animal feed from other countries in the European Union and Latin America [9]. Foreign trade is, therefore, a key element in Spain’s agri-food system: on the one hand, it enables the productive specialization of Spanish agriculture (in oil and horticultural products) to have an outlet in international markets, especially European ones, while, on the other hand, it allows the growing consumption of meat and dairy observed in the Spanish population to be sustained, providing a very important percentage of animal feed (Figure 1a). This phenomenon is coherent with the data obtained from research about the evolution of the nitrogen cycle in Spain between 1961 and 2010, which has shown the growing dependence of Spanish livestock on imported protein, particularly from Latin America [43,44].
In short, today, the consumption of biomass in Spain largely depends on imports. It currently accounts for a considerable percentage, 27.6%, of NPP, much higher than the global average (12% [45]), but one part in reality is extracted in other countries, bearing in mind that DE accounts for 21.8% of NPP produced by Spanish agroecosystems [11]. The globalization of the Spanish agroecosystem has allowed the pressure on land caused by the increase in the domestic consumption of biomass to be outsourced to other countries. This does not mean that pressure on land has diminished absolute terms, or that the health of the country’s agroecosystems has improved. All of these transformations have had a serious impact on Spanish agro-ecosystems.
Firstly, the growing incorporation of external inputs alters the relationship between input and output flows of energy, decreasing the energy efficiency of Spanish agriculture [12,46]. Secondly, intensification and specialization has contributed to lowering the density of internal energy loops (biomass). The relative decline of un-harvested biomass in croplands has exacerbated the degradation of the soil and biodiversity [46,47]. The replenishment of organic carbon in the soil between 1960 and 1990 fell. Even between 1990 and 2008, the sharp increase in internal and external flows of biomass for animal feed barely contributed to increasing soil organic carbon (SOC) due to the fact that these flows had an increasingly lower C:N ratio for the largest proportion of monogastric and ruminant animals, as noted previously [47]. This helps to explain why half of all agricultural land in Spain currently has an organic carbon content of less than 1% [48]. Moreover, the availability of phytomass is necessary to sustain complex food chains of heterotrophic species. The relative decrease in unharvested biomass on cropland negatively affects biodiversity [46,47]. Other factors, such as the use of biocides and the destruction of the diverse territorial matrix, typical of traditional agriculture, are also responsible for the decline of biodiversity in Spanish agroecosystems [49,50]. Thirdly, the massive importation of N in feed and mineral fertilizers (553 and 1150 Gg in 2000, respectively) increased the surplus and the losses of N, which in turn pollute water resources and could have a negative impact on biodiversity [43,46]. Finally, the increase in erosion rates [51,52] and the salinization and overexploitation of water resources [53] have gone hand in hand with the intensification and specialization of Spanish agriculture from 1960 to the present day.
Our provisional results for the GHG emissions balance of food production in Spain [54] indicate that GHG emissions have risen considerably, increasing four-fold between 1960 and 2008. This growth is associated with the increase in industrial inputs and animal feed, the production of which generates changes in land uses in the countries of origin, as well as emissions derived from the cultivation of soy or corn, for example, both directly and indirectly. Furthermore, the increase in livestock numbers has pushed up emissions of enteric methane and manure management. In any case, emissions in the agricultural sector, and above all the livestock sector, have become one of the most relevant sources of emissions in the Spanish economy [54].
The drivers behind this “major transformation” of the agro-ecosystem have been very diverse. In terms of supply, the struggle against declining agrarian revenues [55], through the increase in land and labor productivity [4], have led to productive specialization and intensification on croplands, and to the abandonment of non-irrigated lands further inland, with low productivity levels, and extensive livestock farming, on account of low profitability. Indeed, between 1960 and 2009, the number of farms in existence fell by two-thirds, and the rural population declined from 14.89 million to 5.97 million, from almost half the Spanish population to just 12.76% [56,57]. The active agrarian population has fallen from 4.70 million to just over 800,000, representing just over 4% of employed workers. Agricultural land area dropped from 20.4 million to 17.2 (Table 4). Similarly, livestock has undergone an acute process of concentration of farms, the industrialization of its production processes [30,58,59,60] and the vertical integration of the agri-food industry, increasing supply and reducing the final product price. Pigs and poultry are a good example of this fundamental transformation [61,62,63,64,65].
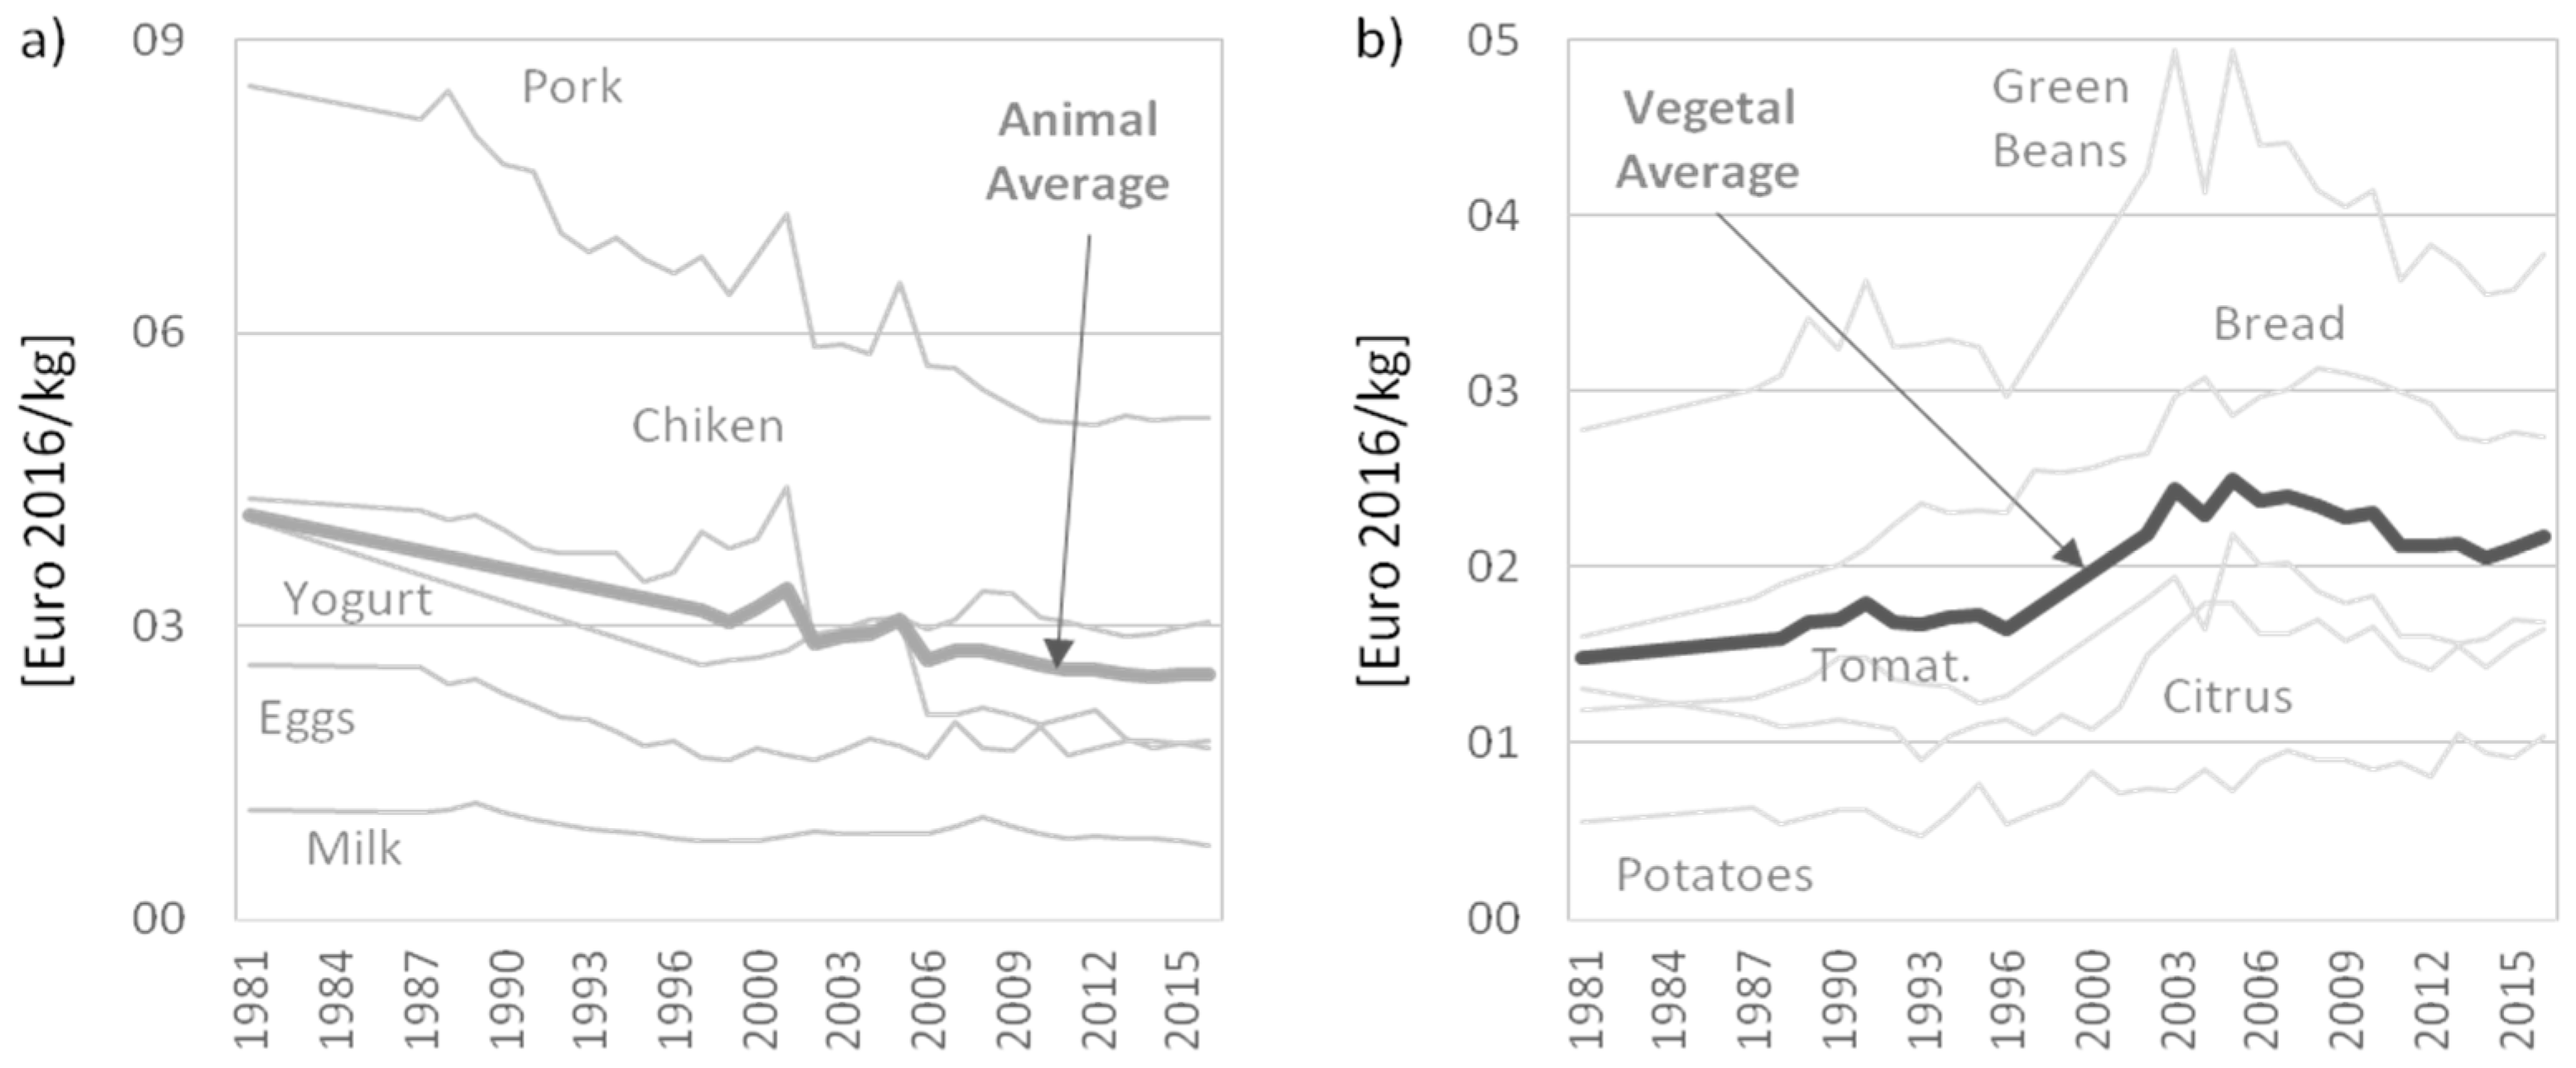
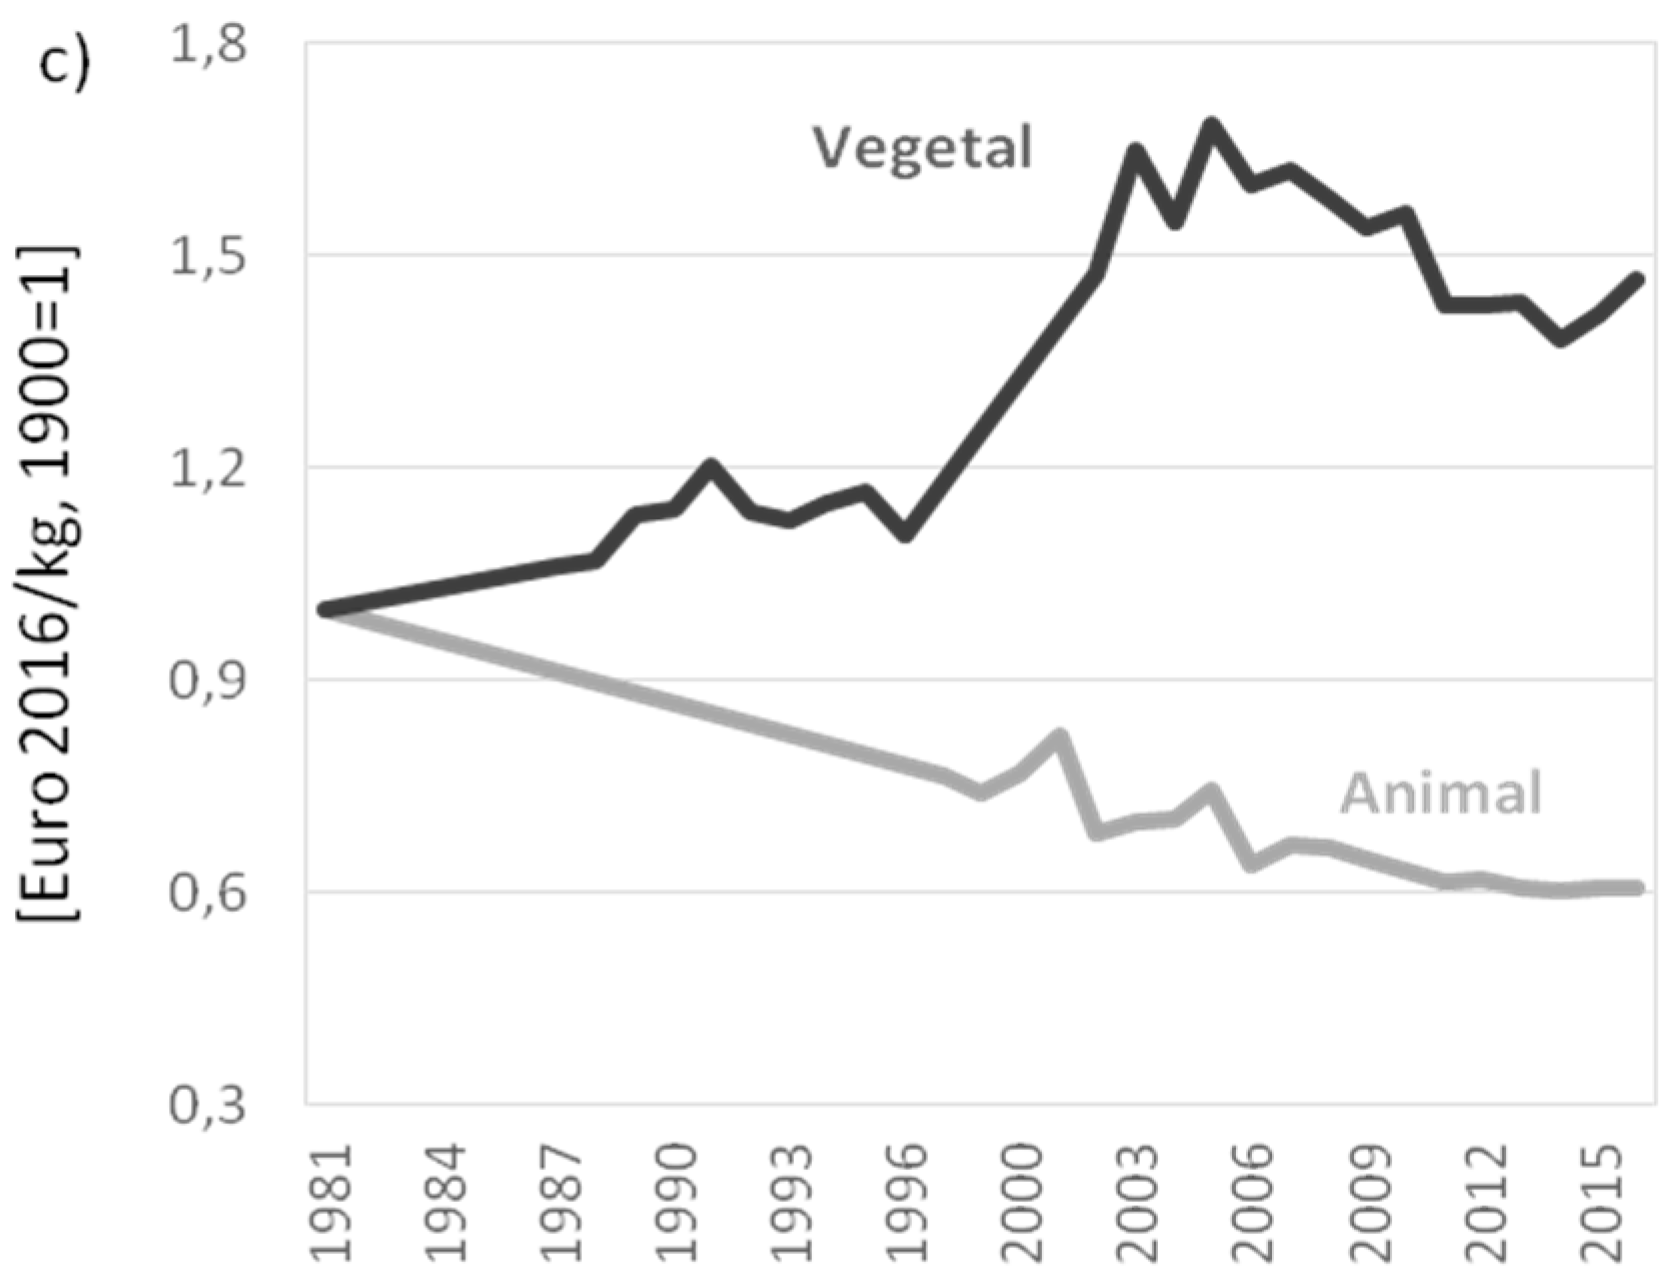
In terms of demand, the relationship between an increase in per capita income and an increase in the energy and animal protein content of the diet has been well documented [35] (for a review, see [41]). This has certainly occurred in Spain, facilitated by falling food prices [38] and the declining importance of food expenses in family budgets, which fell from 48.7% in 1960 to 16.8% in 2015 [66]. However, the increase in income only explains the increase in the consumption of meat and dairy products and the progressive distancing from the Mediterranean diet. It does not explain, however, why this increase in meat has been based on monogastric livestock, depending on imported quality grains and not on pasture or harvest by-products. Figure 6 compares changes in the prices paid by consumers for pork and chicken and other animal origin foodstuffs, with changes in a selected group of basic vegetable foodstuffs. It shows how animal origin foods have become progressively cheaper, whereas vegetables have become increasingly more expensive. This explains how pork and chicken, eggs, milk and yoghurts have become as affordable for consumers as bread, cereals, legumes, fruit and vegetables. Of particular note has been the declining price of pork, owing to the economies of scale of intensive farms that are increasingly concentrated, and the importation of cheap grain (corn and soy), which has brought down the end price of this type of meat. In 2015, Spain even became the EU’s leading exporter of pork [67].
As we have seen, the globalization of food markets has turned Spain into a net importer of biomass, favored by comparatively lower prices of agricultural commodities (soy, corn, etc.) in international markets, which are the bases of intensively farmed livestock feed [69,70]. What has actually occurred has been an outsourcing of part of the land consumed by the Spanish agri-food system to third party countries, with lower production costs. Imports of soybeans and corn for feed amounted to almost 2 million hectares in 2008, i.e. 11.6% of Spanish Cropland, using the average yields of the main countries of origin (Brazil, Argentina, and USA). In 1960, it was only 0.6%.

5. Conclusions

According to economic historiography, the Spanish agrarian sector has contributed positively to Spain’s economic development. However, the industrialization of Spanish agriculture has brought about profound changes in land uses and in the functionality of the biomass produced, increasing pressure on croplands and, paradoxically, facilitating the abandonment of an important proportion of pasture and croplands. This has led to an orientation towards livestock in Spain’s agrarian sector, in other words, the subordination of a very significant portion of Spanish agroecosystems to the food demands of intensive livestock farming. The industrialization of agriculture and livestock farming is leading to the deterioration of the environmental quality of agro-ecosystems. As we have seen, this process has been based on the injection of large quantities of external energy, on the destruction of employment and on the declining profitability of agrarian activity.
Agricultural production has indeed undergone significant growth since the 1960s, increasing food supply and even turning Spain into a major exporter of agri-food products, but this has been insufficient to deal with the growing demand created by the change in the Spanish diet and the increasing trend to focus on livestock farming. The process of globalization has allowed both roles to be reconciled, although in recent decades Spain has accentuated its role as a net importer of biomass from a biophysical perspective, with very significant impacts on third party countries, particularly in Latin America. Consequently, it cannot be said that the industrialization of Spanish agriculture has been an entirely successful process, without taking into account the social and environmental costs it has brought to bear.

Acknowledgments

This research was supported by the Canadian Social Sciences and Humanities Research Council, Partnership Grant 895-2011-1020 (Sustainable Farm Systems: Long-Term Socio-Ecological Metabolism in Western Agriculture); and Spanish Minister of Economy, Industry and Competitiveness, Rf. HAR2015-69620-C2-2-P (Sistemas Agrarios Sustentables? Una interpretación histórica de la agricultura en España desde la perspectiva biofísica).

Author Contributions

This has been a collective research that has benefited from the different specialization in different fields of knowledge of each of its authors. It is, therefore, an interdisciplinary research, in which the contributions of each author cannot be distinguished.

Conflicts of Interest

The authors declare no conflict of interest.

References

  1. Pujol, J.; González de Molina, M.; Fernández Prieto, L.; Gallego, D.; Garrabou, R. El Pozo de Todos Los Males: Sobre el Atraso de la Agricultura Española Contemporánea; Crítica: Barcelona, Spain, 2001. [Google Scholar]
  2. Gallego, D.; Germán, L.; Pinilla, V. (Eds.) Estudios Sobre el Desarrollo Económico Español: Dedicados al Profesor Eloy Fernández Clemente; Prensas de la Universidad de Zaragoza: Zaragoza, Spain, 2016. [Google Scholar]
  3. Maluquer de Motes, J. España en la Economía Mundial: Series Largas Para la Economía Española (1850–2015); Instituto de Estudios Económicos: Madrid, Spain, 2016. [Google Scholar]
  4. Prados de la Escosura, L. Spanish Economic Growth, 1850–2015; Palgrave Studies in Economic History; Plagrave Macmillan: Cham, Switzerland, 2017. [Google Scholar]
  5. Infante-Amate, J.; Soto, D.; Aguilera, E.; García-Ruiz, R.; Guzmán, G.I.; Cid, A.; González de Molina, M. The Spanish Transition to Industrial Metabolism. J. Ind. Ecol. 2015, 19, 866–876. [Google Scholar] [CrossRef]
  6. Clar, E.; Martín-Retortillo, M.; Pinilla, V. The Spanish path of agrarian change, 1950–2005: From authoritarian to export-oriented productivism. J. Agrar. Chang. 2017. [Google Scholar] [CrossRef]
  7. MAPA. Encuesta Sobre Superficies y Rendimientos de Cultivos Del Año 2002: Memoria; Ministerio de Agricultura Pesca y Alimentación: Madrid, Spain, 2003. [Google Scholar]
  8. Tello, E.; Iriarte, I. El Crecimiento Económico Moderno en España en Perspectiva Ambiental: Un Estado de la Cuestión; DT-AEHE N° 1516: Madrid, Spain, 2015. [Google Scholar]
  9. Infante Amate, J.; González de Molina, M. ‘Sustainable de-growth’ in agriculture and food: An agro-ecological perspective on Spain’s agri-food system (year 2000). J. Clean. Prod. 2013, 38, 27–35. [Google Scholar] [CrossRef]
  10. González de Molina, M.; García-Ruiz, R.; Soto Fernández, D.; Guzmán, G.I.; Cid, A.; Infante-Amate, J. Nutrient Balances and Management of Soil Fertility Prior to the Arrival of Chemical Fertilizers in Andalusia, Southern Spain. Hum. Ecol. Rev. 2015, 21, 23–48. [Google Scholar]
  11. Soto, D.; Infante-Amate, J.; Guzmán, G.I.; Cid, A.; Aguilera, E.; García-Ruiz, R.; González de Molina, M. The social metabolism of biomass in Spain, 1900–2008: From food to feed-oriented changes in the agro-ecosystems. Ecol. Econ. 2016, 128, 130–138. [Google Scholar]
  12. Guzmán, G.I.; González de Molina, M. Energy in Agroecosystems: A Tool for Assessing Sustainability; CRC Press: New York, NY, USA, 2017. [Google Scholar]
  13. FAO. Food Balance Sheets: A Handbook; FAO: Rome, Italy, 2001. [Google Scholar]
  14. MAPAMA. Informe del Consumo de Alimentación en España, 2015; MAPAMA: Madrid, Spain, 2016. [Google Scholar]
  15. Gustavsson, J.; Cederberg, C.; Sonesson, U. Global Food Looses and Food Waste: Extent, Causes and Prevention; FAO: Rome, Italy, 2011. [Google Scholar]
  16. EUROSTAT. Economy-Wide Material Flow Accounts (EW-MFA): Compilation Guide 2013; European Statistical Office: Luxembourg, 2015. [Google Scholar]
  17. Krausmann, F.; Erb, K.-E.; Gringrich, S.; Lauk, C.; Haberl, H. Global patterns of socioeconomic biomass flows in the year 2000: A comprehensive assessment of supply, consumption and constraints. Ecol. Econ. 2008, 65, 471–487. [Google Scholar] [CrossRef]
  18. Smil, V. Harvesting the Biosphere What We Have Taken from Nature; The MIT Press: London, UK; Cambridge, MA, USA, 2013. [Google Scholar]
  19. Guzmán, G.I.; Aguilera, E.; Soto, D.; Cid, A.; Infante-Amate, J.; García Ruiz, R.; Herrera, A.; Villa, I.; González de Molina, M. Methodology and Conversion Factors to Estimate the Net Primary Productivity of Historical and Contemporary Agroecosystems (I); Sociedad Española de Historia Agraria: Madrid, Spain, 2014. [Google Scholar]
  20. MAPAMA. Anuario de Estadística Agraria; Ministerio de Agricultura, Pesca, Alimentación y Medio Ambiente: Madrid, Spain, 2017. [Google Scholar]
  21. Calatayud, S.; Martínez-Carrión, J.M. El cambio tecnológico en el uso de las aguas subterráneas en la España del siglo XX. Un enfoque regional. Rev. Hist. Ind. 2005, 28, 81–114. [Google Scholar]
  22. MAGRAMA. Encuesta Sobre Superficies y Rendimientos de Cultivos: Informe Sobre Regadíos en España 2012; Ministerio de Agricultura, Alimentación y Medio Ambiente: Madrid, Spain, 2013. [Google Scholar]
  23. Cussó, X. El estado nutritivo de la población española 1900-1970. Análisis de las necesidades y las disponibilidades de nutrientes. Hist. Agrar. 2005, 36, 329–358. [Google Scholar]
  24. Cussó, X.; Gamboa, G.; Pujol-Andreu, P. El estado nutritivo de la población española, 1860–2010, Diferencias de género y generacionales. In Proceedings of the XII International Conference of Spanish Association of Economic History, Salamanca, Spain, 5–9 September 2017. [Google Scholar]
  25. González de Molina, M.; Soto, E.; Aguilera, E.; Infante, J. Crecimiento agrario en España y cambios en la oferta alimentaria, 1900–1933. Hist. Soc. 2014, 80, 157–183. [Google Scholar]
  26. Moreiras, O.; Carbajal, A.; Cabrera, L.; Cuadrado, C. Tabla de Composición de Alimentos, 15th ed.; Ediciones Pirámide: Madrid, Spain, 2011. [Google Scholar]
  27. Varela Moreiras, G.; Ávila Torres, J.M.; Cuadrado Vives, C.; del Pozo de la Calle, S.; Ruiz Moreno, E.; Moreiras Tuny, O. Valoración de la Dieta Española de Acuerdo al Panel de Consumo Alimentario; Ministerio de Agricultura, Alimentación y Medio Ambiente: Madrid, Spain, 2008. [Google Scholar]
  28. Infante-Amate, J.; Soto Fernández, D.; Cid Escudero, A.; Guzmán Casado, G.I.; Aguilera Fernández, E.; García Ruiz, R.; González de Molina, M. Producción y Consumo de Madera y Leña en España: Una Serie Provincial de Los Aprovechamientos Forestales y Cultivados (1900–2000); Working Paper SEHA: Madrid, Spain, 2014. [Google Scholar]
  29. Pinilla Pinilla, V. El comercio exterior en el desarrollo agrario de la España contemporánea: Un balance. Hist. Agrar. 2001, 23, 13–37. [Google Scholar]
  30. Clar, E.; Pinilla, V.; Serrano, R. El comercio agroalimentario español en la segunda globalización, 1951–2011. Hist. Agrar. 2015, 65, 149–186. [Google Scholar]
  31. Instituto Nacional de Estadística. Anuario Estadístico de España, 2017. Available online: http://www.ine.es/prodyser/pubweb/anuario17/anu17_11comer.pdf (accessed on 20 October 2017).
  32. Von Witzke, H.; Noleppa, S. EU Agricultural Production and Trade: Can More Efficiency Prevent Increasing ‘Land-Grabbing’ Outside of Europe; Humboldt Universität zu Berlin: Berlin, Germany, 2010. [Google Scholar]
  33. Aguilera, E.; Guzmán, G.I.; Infante-Amate, J.; Soto, D.; García-Ruiz, R.; Herrera, A.; Villa, I.; Torremocha, E.; Carranza, G.; González de Molina, M. Embodied Energy in Agricultural Inputs: Incorporating a Historical Perspective; Documentos de Trabajo de la SEHA: Madrid, Spain, 2015. [Google Scholar]
  34. Muller, A.; Bautze, L. Agriculture and Deforestation: The EU Common Agricultural Policy, Soy, and Forest Destruction Proposals for Reform; Fern: Brussels, Belgium, 2017. [Google Scholar]
  35. European Commission. World Food Consumption Patterns, Trend and Drivers. 2015. Available online: https://ec.europa.eu/agriculture/sites/agriculture/files/markets-and-prices/market-briefs/pdf/06_en.pdf (accessed on 13 December 2017).
  36. Rodríguez Artalejo, F.J.R.; Banegas, M.A.; Graciani, R.; Hernández Vecino, J.R.C. El consumo de alimentos y nutrientes en España en el período 1940–1988. Análisis de su consistencia con la dieta mediterránea. Med. Clin. 1996, 106, 161–168. [Google Scholar]
  37. Nicolau, R.; Pujol, J. Aspectos Políticos y Científicos del Modelo de la Transición Nutricional Nutricional: Evaluación Crítica y Nuevas Perspectivas. En Bernabeu, j. y Barona, (Eds), Nutrición, salud y sociedad. España y Europa en los siglos XIX y XX; Seminari d’Estudis sobre la Ciència: Valencia, Spain, 2011; pp. 19–57. [Google Scholar]
  38. Kearney, J. Food consumption trends and drivers. Philos. Trans. R. Soc. B 2010, 365, 2793–2807. [Google Scholar] [CrossRef] [PubMed]
  39. Del Pozo de la Calle, S.; Cuadrado Vives, C.; Ruiz Moreno, E.; Valero Gaspar, T.; Ávila Torres, J.M.; Varela, M. Valoración Nutricional de la Dieta Española de Acuerdo al Panel de Consumo Alimentario; MAPAMA: Madrid, Spain, 2012. [Google Scholar]
  40. Aranceta-Bartrina, J.; Pérez-Rodrigo, C.; Alberdi-Aresti, G.; Ramos-Carrera, N.; Lázaro-Masedo, S. Prevalencia de obesidad general y obesidad abdominal en la población adulta española (25–64 años) 2014–2015, Estudio ENPE. Rev. Esp. Cardiol. 2016, 69, 579–587. [Google Scholar] [CrossRef] [PubMed]
  41. Tilman, D.; Clark, M. Global diets link environmental sustainability and human health. Nature 2014, 515, 518–522. [Google Scholar] [CrossRef] [PubMed]
  42. De Marco, A.; Velardi, M.; Camporeale, C.; Screpanti, A.; Vitale, M. The Adherence of the Diet to Mediterranean Principle and Its Impacts on Human and Environmental Health. Int. J. Environ. Prot. Policy 2014, 2, 64–75. [Google Scholar]
  43. Bouwman, L.; Klein Goldewijk, K.; Van Der Hoekc, K.W.; Beusen, A.; Van Vuuren, D.P.; Willems, J.; Rufino, M.C.; Stehfest, E. Exploring global changes in nitrogen and phosphorus cycles in agriculture induced by livestock production over the 1900–2050 period. Proc. Natl. Acad. Sci. USA 2013, 110, 20882–20887. [Google Scholar] [CrossRef] [PubMed]
  44. Lassaletta, L.; Billen, G.; Romero, E.; Garnier, J.; Aguilera, E. How changes in diet and trade patterns have shaped the N cycle at the national scale: Spain (1961–2009). Reg. Environ. Chang. 2013, 14, 785–797. [Google Scholar] [CrossRef]
  45. Krausmann, F.; Fischer-Kowalski, M.; Schandl, H.; Eisenmenger, N. The global sociometabolic transition. J. Ind. Ecol. 2008, 12, 637–656. [Google Scholar] [CrossRef]
  46. Guzmán, G.I.; González de Molina, M.; Soto Fernández, D.; Infante Amate, J.; Aguilera Fernández, E. Spanish agriculture from 1900 to 2008: A long-term perspective on agroecosystem energy from an agroecological approach. Reg. Environ. Chang. 2017. [Google Scholar] [CrossRef]
  47. Guzmán, G.I.; Aguilera, E.; García-Ruiz, R.; Torremocha, E.; Soto, D.; Infante-Amate, J.; González de Molina, M. The Agrarian Metabolism as a tool for assessing agrarian sustainability, and its application to Spanish Agriculture (1960–2008). Ecol. Soc. 2017, in press. [Google Scholar]
  48. Rodríguez-Martín, J.A.; Álvaro-Fuentes, J.; Gonzalo, J.; Gil, C.; Ramos-Miras, J.J.; Grau Corbí, J.M.; Boluda, R. Assessment of the soil organic carbon stock in Spain. Geoderma 2016, 264, 117–125. [Google Scholar] [CrossRef]
  49. Guzmán, G.I.; González de Molina, M. Preindustrial agriculture versus organic agriculture. The land cost of sustainability. Land Use Policy 2009, 26, 502–510. [Google Scholar] [CrossRef]
  50. Marull, J.; Tello, E.; Fullana, N.; Murray, I.; Jover, G.; Font, C.; Coll, F.; Domene, E.; Leoni, V.; Decolli, T. Long-term bio-cultural heritage: Exploring the intermediate disturbance hypothesis in agroecological landscapes (Mallorca, c. 1850–2012). Biodivers. Conserv. 2015, 24, 3217–3251. [Google Scholar] [CrossRef] [Green Version]
  51. Gómez, J.A.; Giráldez, J.V. Erosión y Degradación de Suelos; Consejería de Agricultura y Pesca Junta de Andalucía: Sevilla, Spain, 2008. [Google Scholar]
  52. Vanwalleghem, T.; Infante-Amate, J.; González de Molina, M.; Soto Fernández, D.; Gómez, J.A. Quantifying the effect of historical soil management on soil erosion rates in Mediterranean olive orchards. Agric. Ecosyst. Environ. 2011, 142, 341–351. [Google Scholar] [CrossRef]
  53. European Commission. Report from the Commission to the Council and the European Parliament on the Implementation of Council Directive 91/676/EEC Concerning the Protection of Waters Against Pollution Caused by Nitrates from Agricultural Sources Based on Member State Reports for the Period 2008–2011; European Commission: Bruselas, Bélgium, 2013. [Google Scholar]
  54. Aguilera, E.; Guzmán, G.I.; Infante-Amate, J.; García-Ruiz, R.; Soto, D.; Cid, A.; González de Molina, M. Evolución Histórica de Las Emisiones de GEI y Almacenamiento de C en el Sector Agroforestal Español, 1900–2008; Remedia Workshop, I.V.: Madrid, Spain, 2015. [Google Scholar]
  55. MAPA. Libro Blanco de la Agricultura y el Desarrollo Rural; Ministerio de Agricultura Pesca y Alimentación: Madrid, Spain, 2003. [Google Scholar]
  56. Instituto Nacional de Estadística. Primer Censo Agrario de España, Octubre de 1962; INE: Madrid, Spain, 1966. [Google Scholar]
  57. Instituto Nacional de Estadística. Censo Agrario, 2009; INE: Madrid, Spain, 2011. [Google Scholar]
  58. Domínguez Martín, R. La ganadería española: Del franquismo a la CEE. Balance de un sector olvidado. Hist. Agrar. 2001, 23, 39–53. [Google Scholar]
  59. Clar, E. Del cereal alimento al cereal pienso. Historia y balance de un intento de autosuficiencia ganadera, 1967–1972. Hist. Agrar. 2005, 37, 513–544. [Google Scholar]
  60. Clar, E. La soberanía industrial: Industrias del complejo pienso-ganadero e implantación del modelo de consumo fordista en España: 1960–1975. Rev. Hist. Ind. 2008, 36, 133–165. [Google Scholar]
  61. Segrelles Serrano, J.A. La Ganadería Industrial en España: Cabaña Porcina y Avicultura de Carne; Universidad de Alicante: Alicante, Spain, 1993. [Google Scholar]
  62. Clar, E. A world of entrepreneurs: The establishment of agribusiness during the Spanish pork and poultry boom, 1950–2000. Agric. Hist. 2010, 84, 176–194. [Google Scholar] [CrossRef] [PubMed]
  63. Fundación Cajamar. El Sector del Porcino en España; Fundación Cajamar: Almería, Spain, 2011. [Google Scholar]
  64. MAPAMA. Caracterización del Sector Porcino Español. Año 2012; MAPAMA: Madrid, Spain, 2013. [Google Scholar]
  65. MAPAMA. Caracterización del Sector Porcino Español Año 2015; MAPAMA: Madrid, Spain, 2016. [Google Scholar]
  66. Martín Cerdeño, V. Cincuenta Años de Alimentación en España; Mercasa: Madrid, Spain, 2016. [Google Scholar]
  67. Rousseau, O. Denmark loses place as top EU pork exporter. Global Meat News, 24 March 2016. [Google Scholar]
  68. Instituto Nacional de Estadística. Encuesta de Presupuestos Familiares; INE: Madrid, Spain, 2015. [Google Scholar]
  69. Mayer, A.; Schaffartzik, A.; Haas, W.; Rojas-Sepúlveda, A. Patterns of Global Biomass Trade: Implications for Food Sovereignty and Socio-Environmental Conflicts; EJOLT Report: Barcelona, Spain, 2015. [Google Scholar]
  70. Falconí, F.; Ramos-Martín, R.; Cango, P. Caloric Unequal Exchange in Latin America and the Caribbean; Working Paper Facultad Latinoamericana de Ciencias Sociales (FLACSO): Quito, Ecuador, 2016. [Google Scholar]
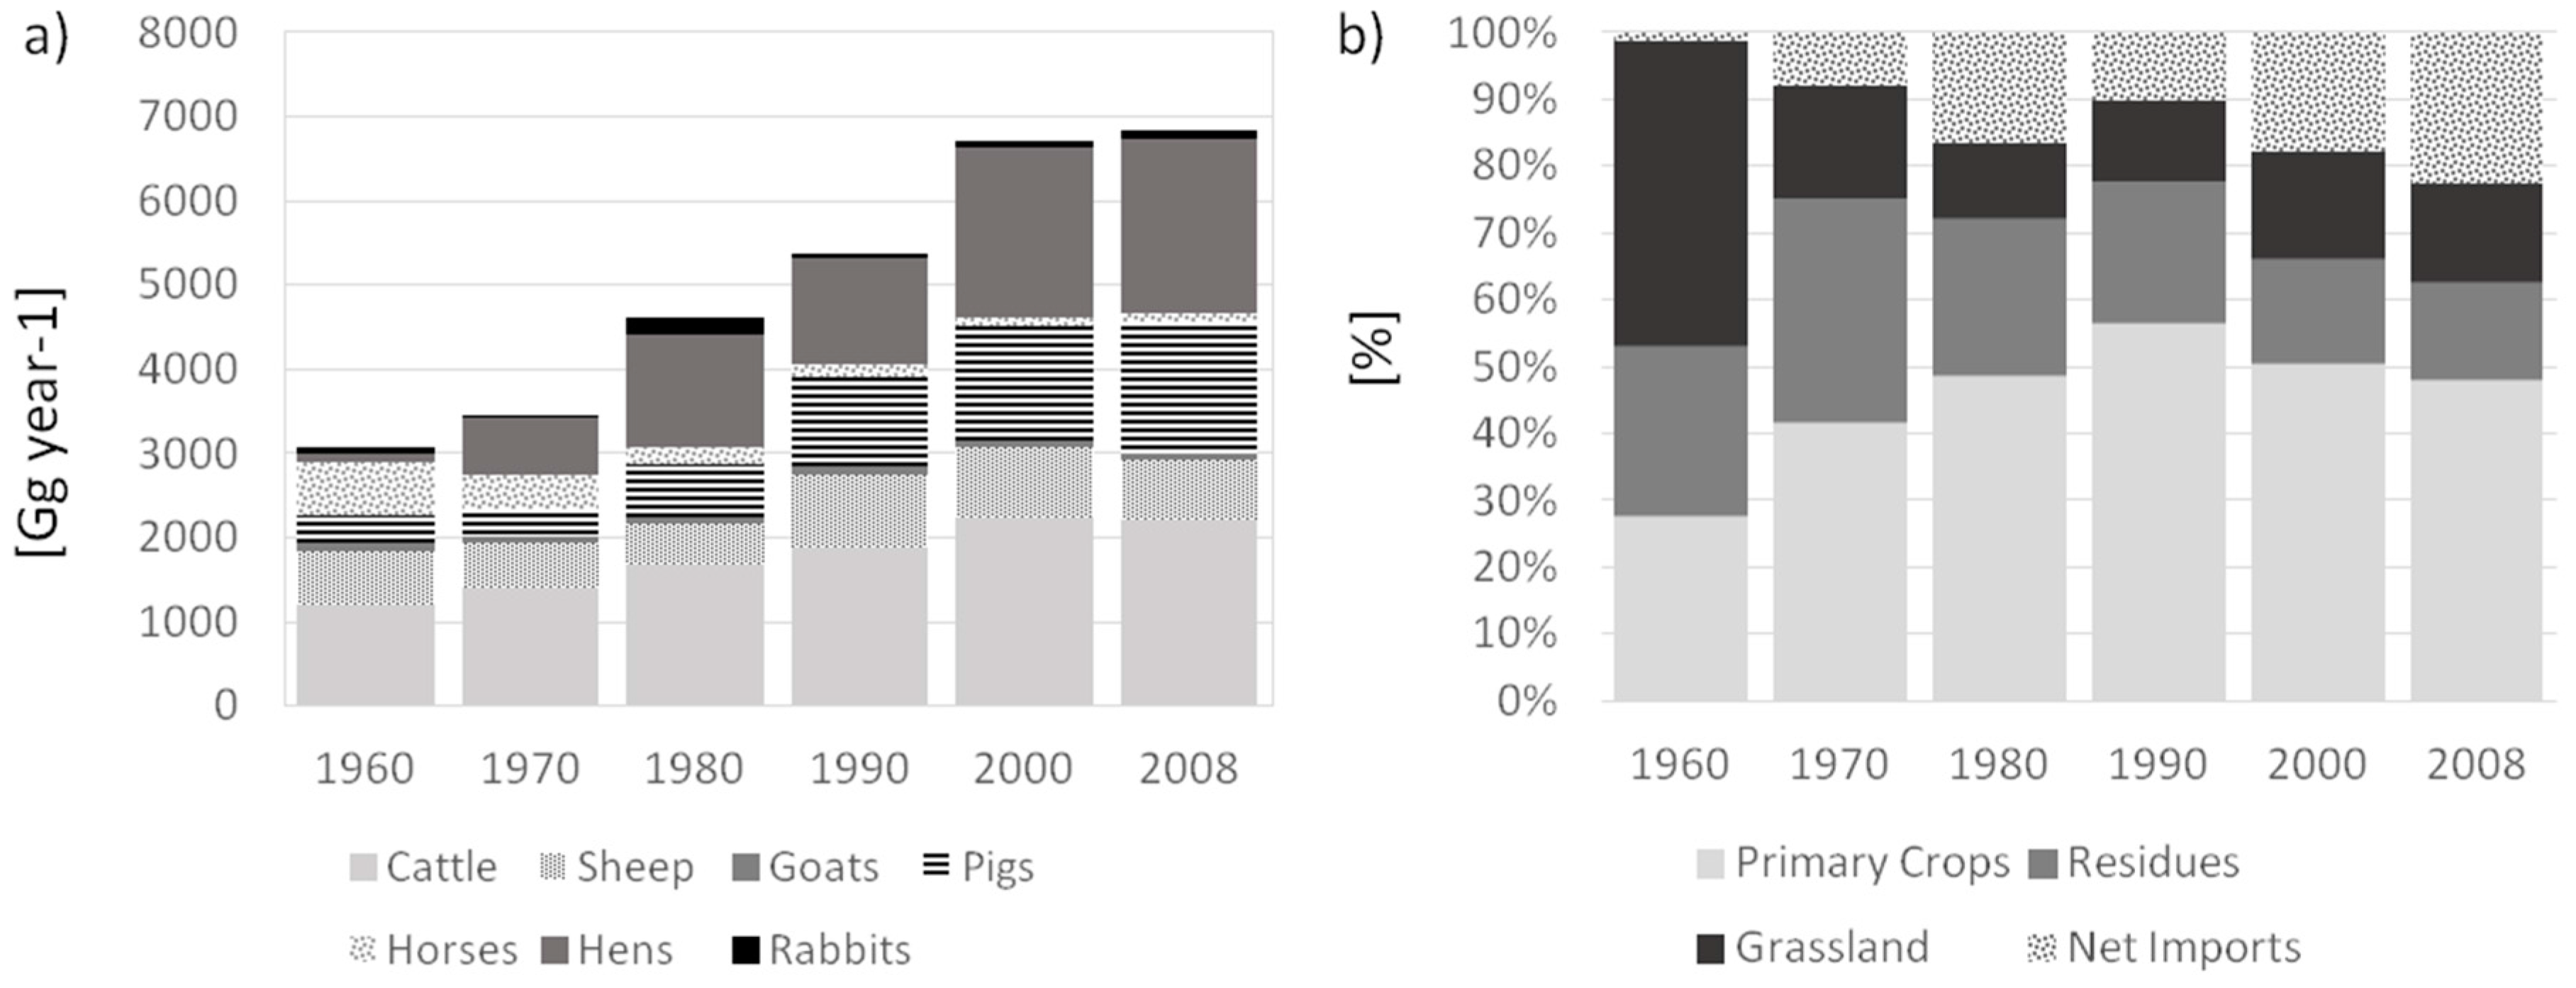
Figure 1. (a) Changes in Livestock Numbers in Gg live weight; and (b) origin of animal feed (%). Source: Soto et al. [11].
Sustainability 09 02348 g001
Figure 2. Spain. Livestock production (Gg dry matter). Source: Own calculations based on agricultural statistics.
Sustainability 09 02348 g002
Figure 3. Trade and consumption of biomass in Spain: (a) physical trade balance in Tg dry matter; and (b) domestic consumption in Tg dry matter. Source: Soto et al. [11].
Sustainability 09 02348 g003
Figure 4. Decoupling Domestic Material Consumption (DC) from Domestic Extraction (DE), and the role of Trade (Imports/Exports), 1960–2008. Source: Own calculations based on agricultural statistics.
Sustainability 09 02348 g004
Figure 5. Materials use (a); and embodied energy (b) from industrial inputs production in Spanish agriculture (1960–2008). Source: Own calculations based on agricultural statistics and Aguilera et al. [33].
Sustainability 09 02348 g005
Figure 6. Comparison between the prices paid by consumers for certain animal and vegetable products. Source: Encuesta de Presupuestos Familiares and Encuesta Continua de Presupuestos Familiares [Survey of Family Budgets] [68]. (a) Selected animal food prices; (b) selected vegetal food prices; (c) animal and vegetal prices.
Sustainability 09 02348 g006aSustainability 09 02348 g006b
Table 1. Apparent consumption per food group (g/per capita/day in edible fresh matter).
196019701980199020002008
Cereals280217186161159182
Legumes363418171216
Roots and tubers287264256236161131
Vegetables281292306407377344
Fruit118173233265249220
Dried fruits and nuts8611789
Oleaginous plants787142121
Alcoholic drinks141255310316324329
Oil404873799187
Sugar598363718070
Meat + fat56108157224273243
Eggs152732322825
Dairy291393453449458418
Fish495154567067
Honey111222
Plant Biomass125713811466157314821411
Animal Biomass411578696761827753
Total166919602161233423102164
Source: Authors’ own data based on agrarian statistics.
Table 2. Apparent consumption of food in units per capita per day (1960–2008).
Plant BiomassAnimal BiomassTotal Biomass
YearCalories%Calories%Calories%
1960240086.637413.42774100.0
1970240681.753818.32944100.0
1980240978.565921.53069100.0
1990239874.681625.43214100.0
2000243472.890827.23342100.0
2008240174.184125.93242100.0
Proteins *
Plant BiomassAnimal BiomassTotal Biomass
YearG%g%g%
19604964273676100.0
19704352394882100.0
19803643485784100.0
19903539556190100.0
20003133626793100.0
20083236576489100.0
Source: Authors’ own data based on agrarian statistics. * These figures reflect the availability of proteins. Therefore, the coefficients of digestibility have not been applied.
Table 3. Content in carbohydrates and lipids in apparent consumption according to the origin of the foodstuffs, in grams per capita per day (1960–2008).
Carbohydrates
YearPlantAnimalTotalkcal% *
g%g%g
196039096154405162058.4
197036595205385154052.3
198031593237338135244.1
199030693237330132041.1
200029192248315126037.7
200829693227318127239.2
Lipids
YearPlantAnimalTotalkcal% *
g%g%g
1960536923307769325.0
1970616434369585529.0
198085674233127114337.2
199091635538146131440.9
2000104636036165148544.4
2008100645636156140443.3
* Percentage of annual consumption per capita in kcal. Source: Authors’ own data. Grams of proteins and carbohydrates have been multiplied by 4 kcal and lipids by 9 kcal, in accordance with Moreiras et al. [26] (p. 231).
Table 4. Changes in land uses and actual net primary productivity (NPPact).
Area, in Thousands of Hectares
Land uses196019701980199020002008
Crop land20,41320,88520,49920,17218,30417,271
High Forest492962406741718974608307
Coppice507646404824497950555146
Open Forest (Dehesa)332038354033363638934342
Pasture and scrubland12,59411,19010,69110,74611,64511,294
Non-productive416937103712377741434139
Total50,50050,50050,50050,50050,50050,500
Actual Net Primary Productivity (NPPact) in Gg of Dry Matter per Year
Accumulated biomass16,99921,68325,43723,44724,36223,661
Unharvested biomass 187,468203,534196,652202,860217,449222,057
Reutilized biomass (1)41,89935,83936,58141,33543,58341,891
Socialized biomass (2)21,59722,23321,54124,92025,30026,592
Domestic extraction (1 + 2)63,49658,07258,12266,25568,88368,483
Total NPPact267,962283,288280,211292,561310,694314,201
Source: Authors’ own data based on agrarian statistics.
Table 5. Composition of biomass extracted from agroecosystems in Spain, 1960–2008, in Gg of dry matter per year.
196019701980199020002008
Primary Crops
Cereals755610,67413,11016,54318,63220,191
Leguminous Vegetables674607342226296207
Vineyards76511921774155117861572
Olive groves105011171400157828203377
Vegetables and tubers143416791911206116361407
Fruit trees109411461358157617041773
Industrial Crops130019022437352032492359
Forage607864968464852185326660
Total19,95024,81330,79535,57538,65537,547
Residues
Cereals953011,3468755833275027243
Leguminous vegetables769685332163128068
Vineyards162420932239205415241777
Olive groves148020241869171616541648
Vegetables and tubers127168190234213193
Fruit trees132715891803209422201995
Burned by-products56115412282362214371255
Total15,41719,44617,47118,21414,67814,179
Pasture and forest
Grazed biomass18,83760994613488380937596
Wood239946714135654363338160
Timber from forests689330421108104011231001
Total Domestic Extraction63,49658,07158,12266,25568,88268,483
Source: Authors’ own data based on agrarian statistics.
Table 6. Spain, Destination of Domestic Extraction of Biomass, Gg dry matter.
Biomass196019701980199020002008
Food710879799277996098659418
Feed40,48033,20133,20036,55341,13439,367
Seeds85810971098115910121269
Wood and fuel wood13,72313,42011,15513,44612,85414,581
Raw materials7668341110151425812592
By-products burned56115412282362214371255
Total63,49658,07158,12266,25568,88268,483
Source: Authors’ own data based on agrarian statistics.