A Real-Time Energy Consumption Simulation and Comparison of Buildings in Different Construction Years in the Olympic Central Area in Beijing


Abstract
:1. Introduction
2. Data and Methods
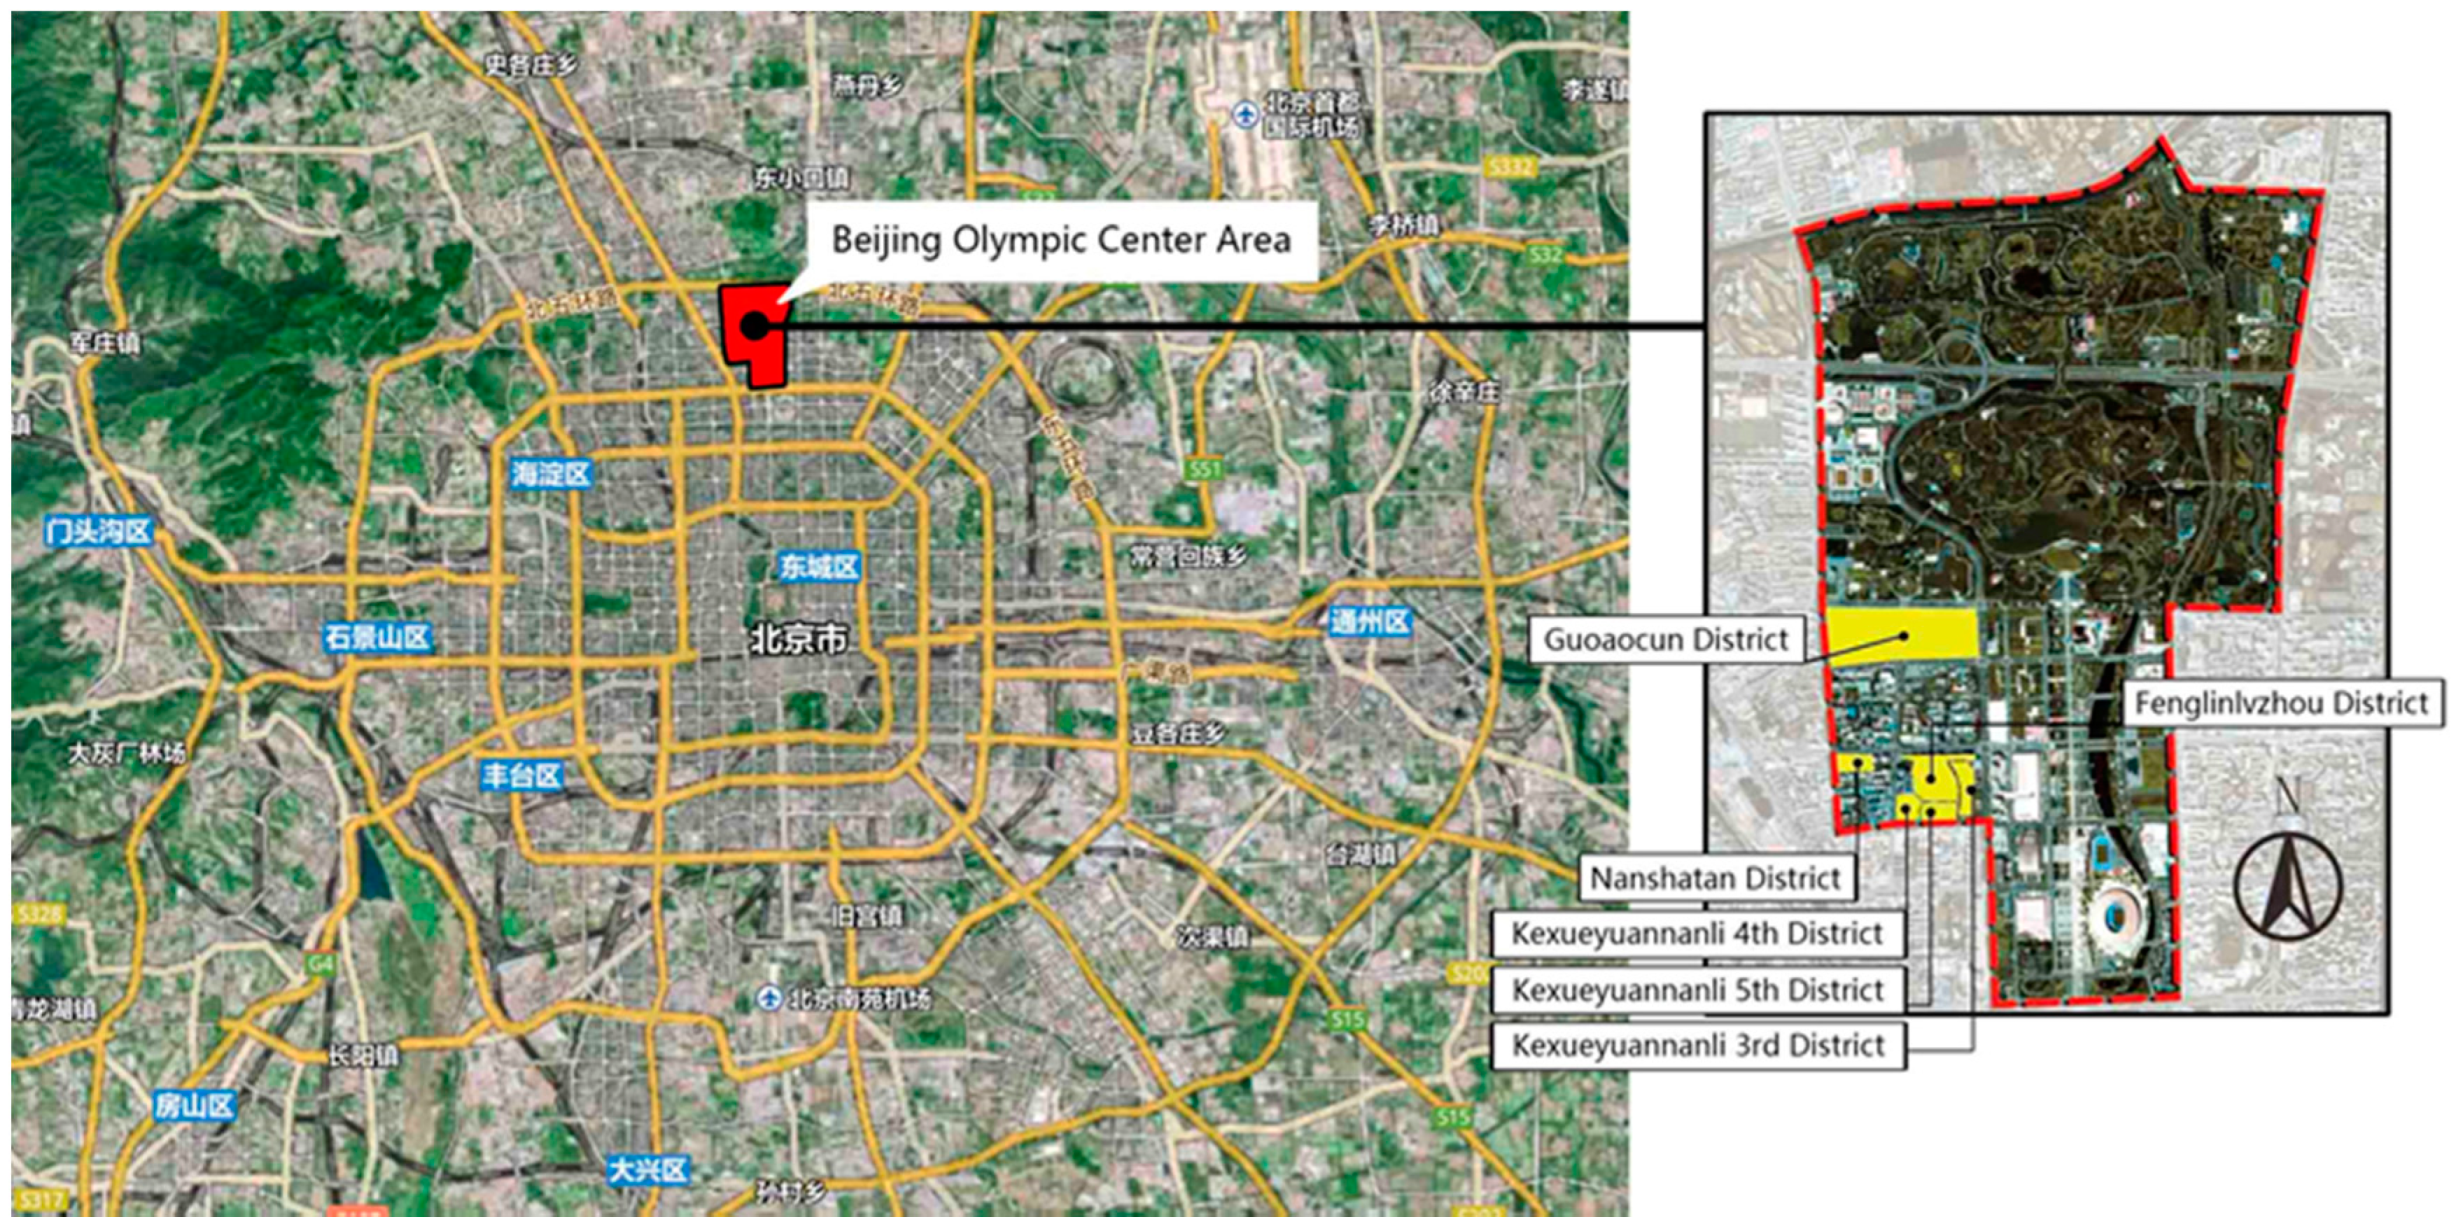
2.1. Source of Data
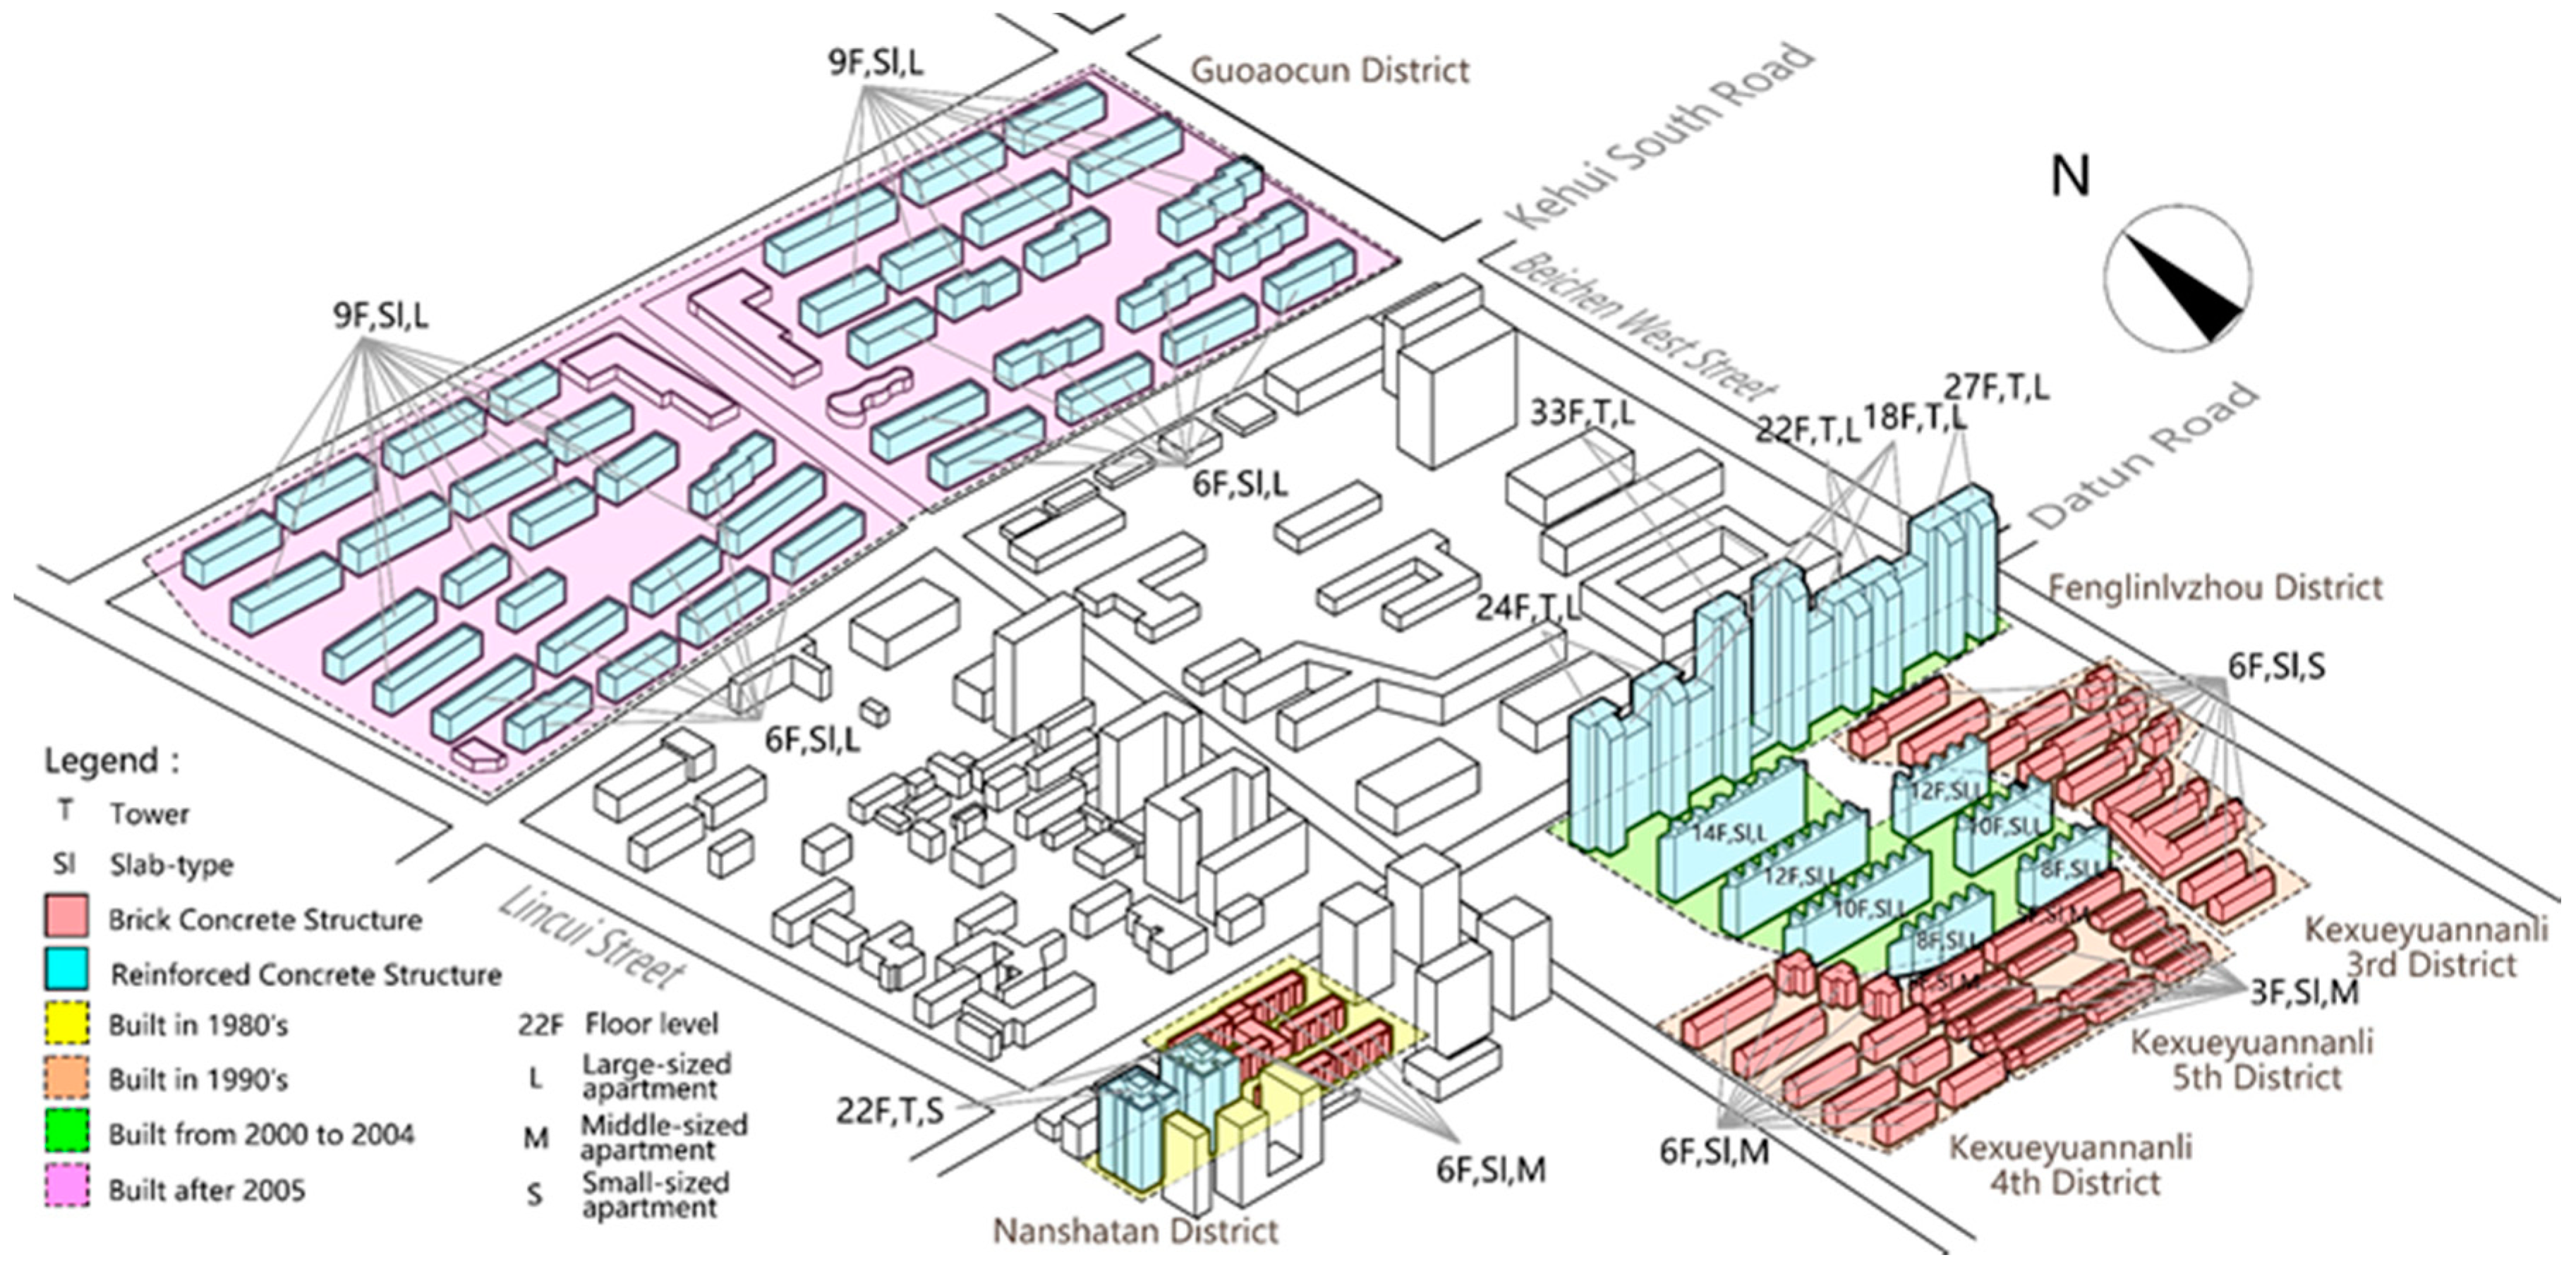
2.2. Building Classification Method
2.3. Model Refinement
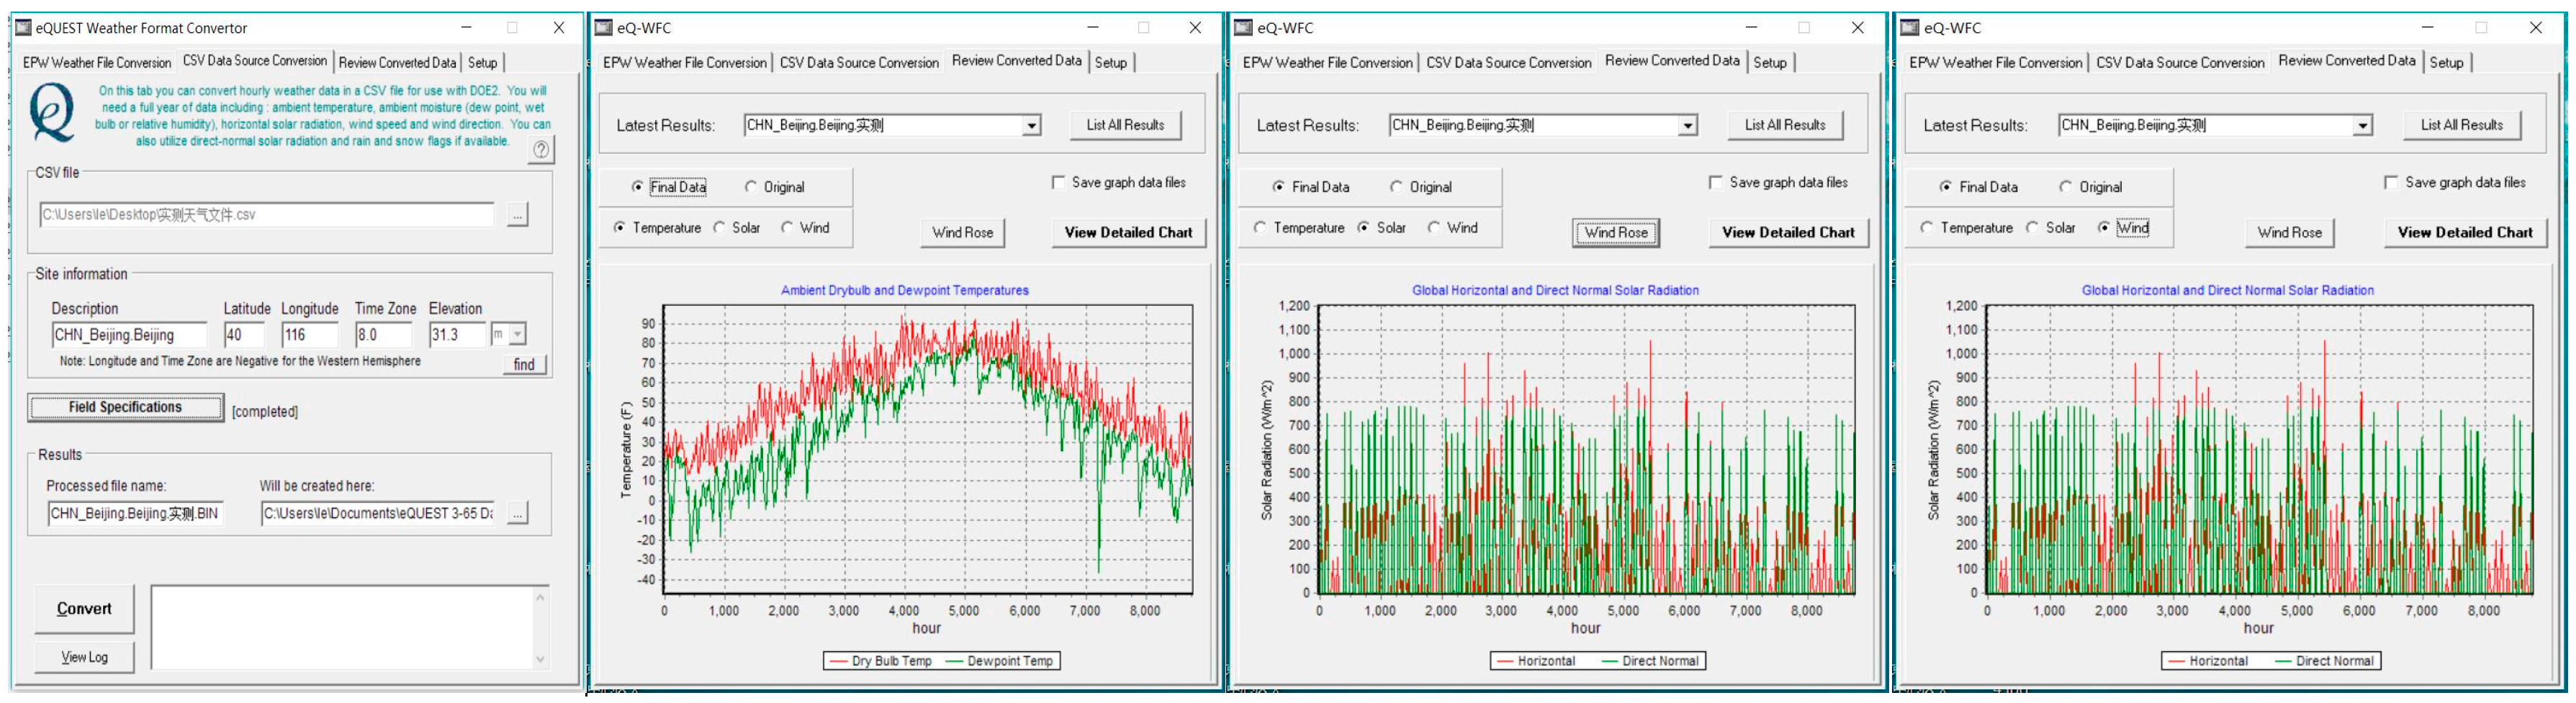
2.3.1. Real-Time Meteorological Data Conversion
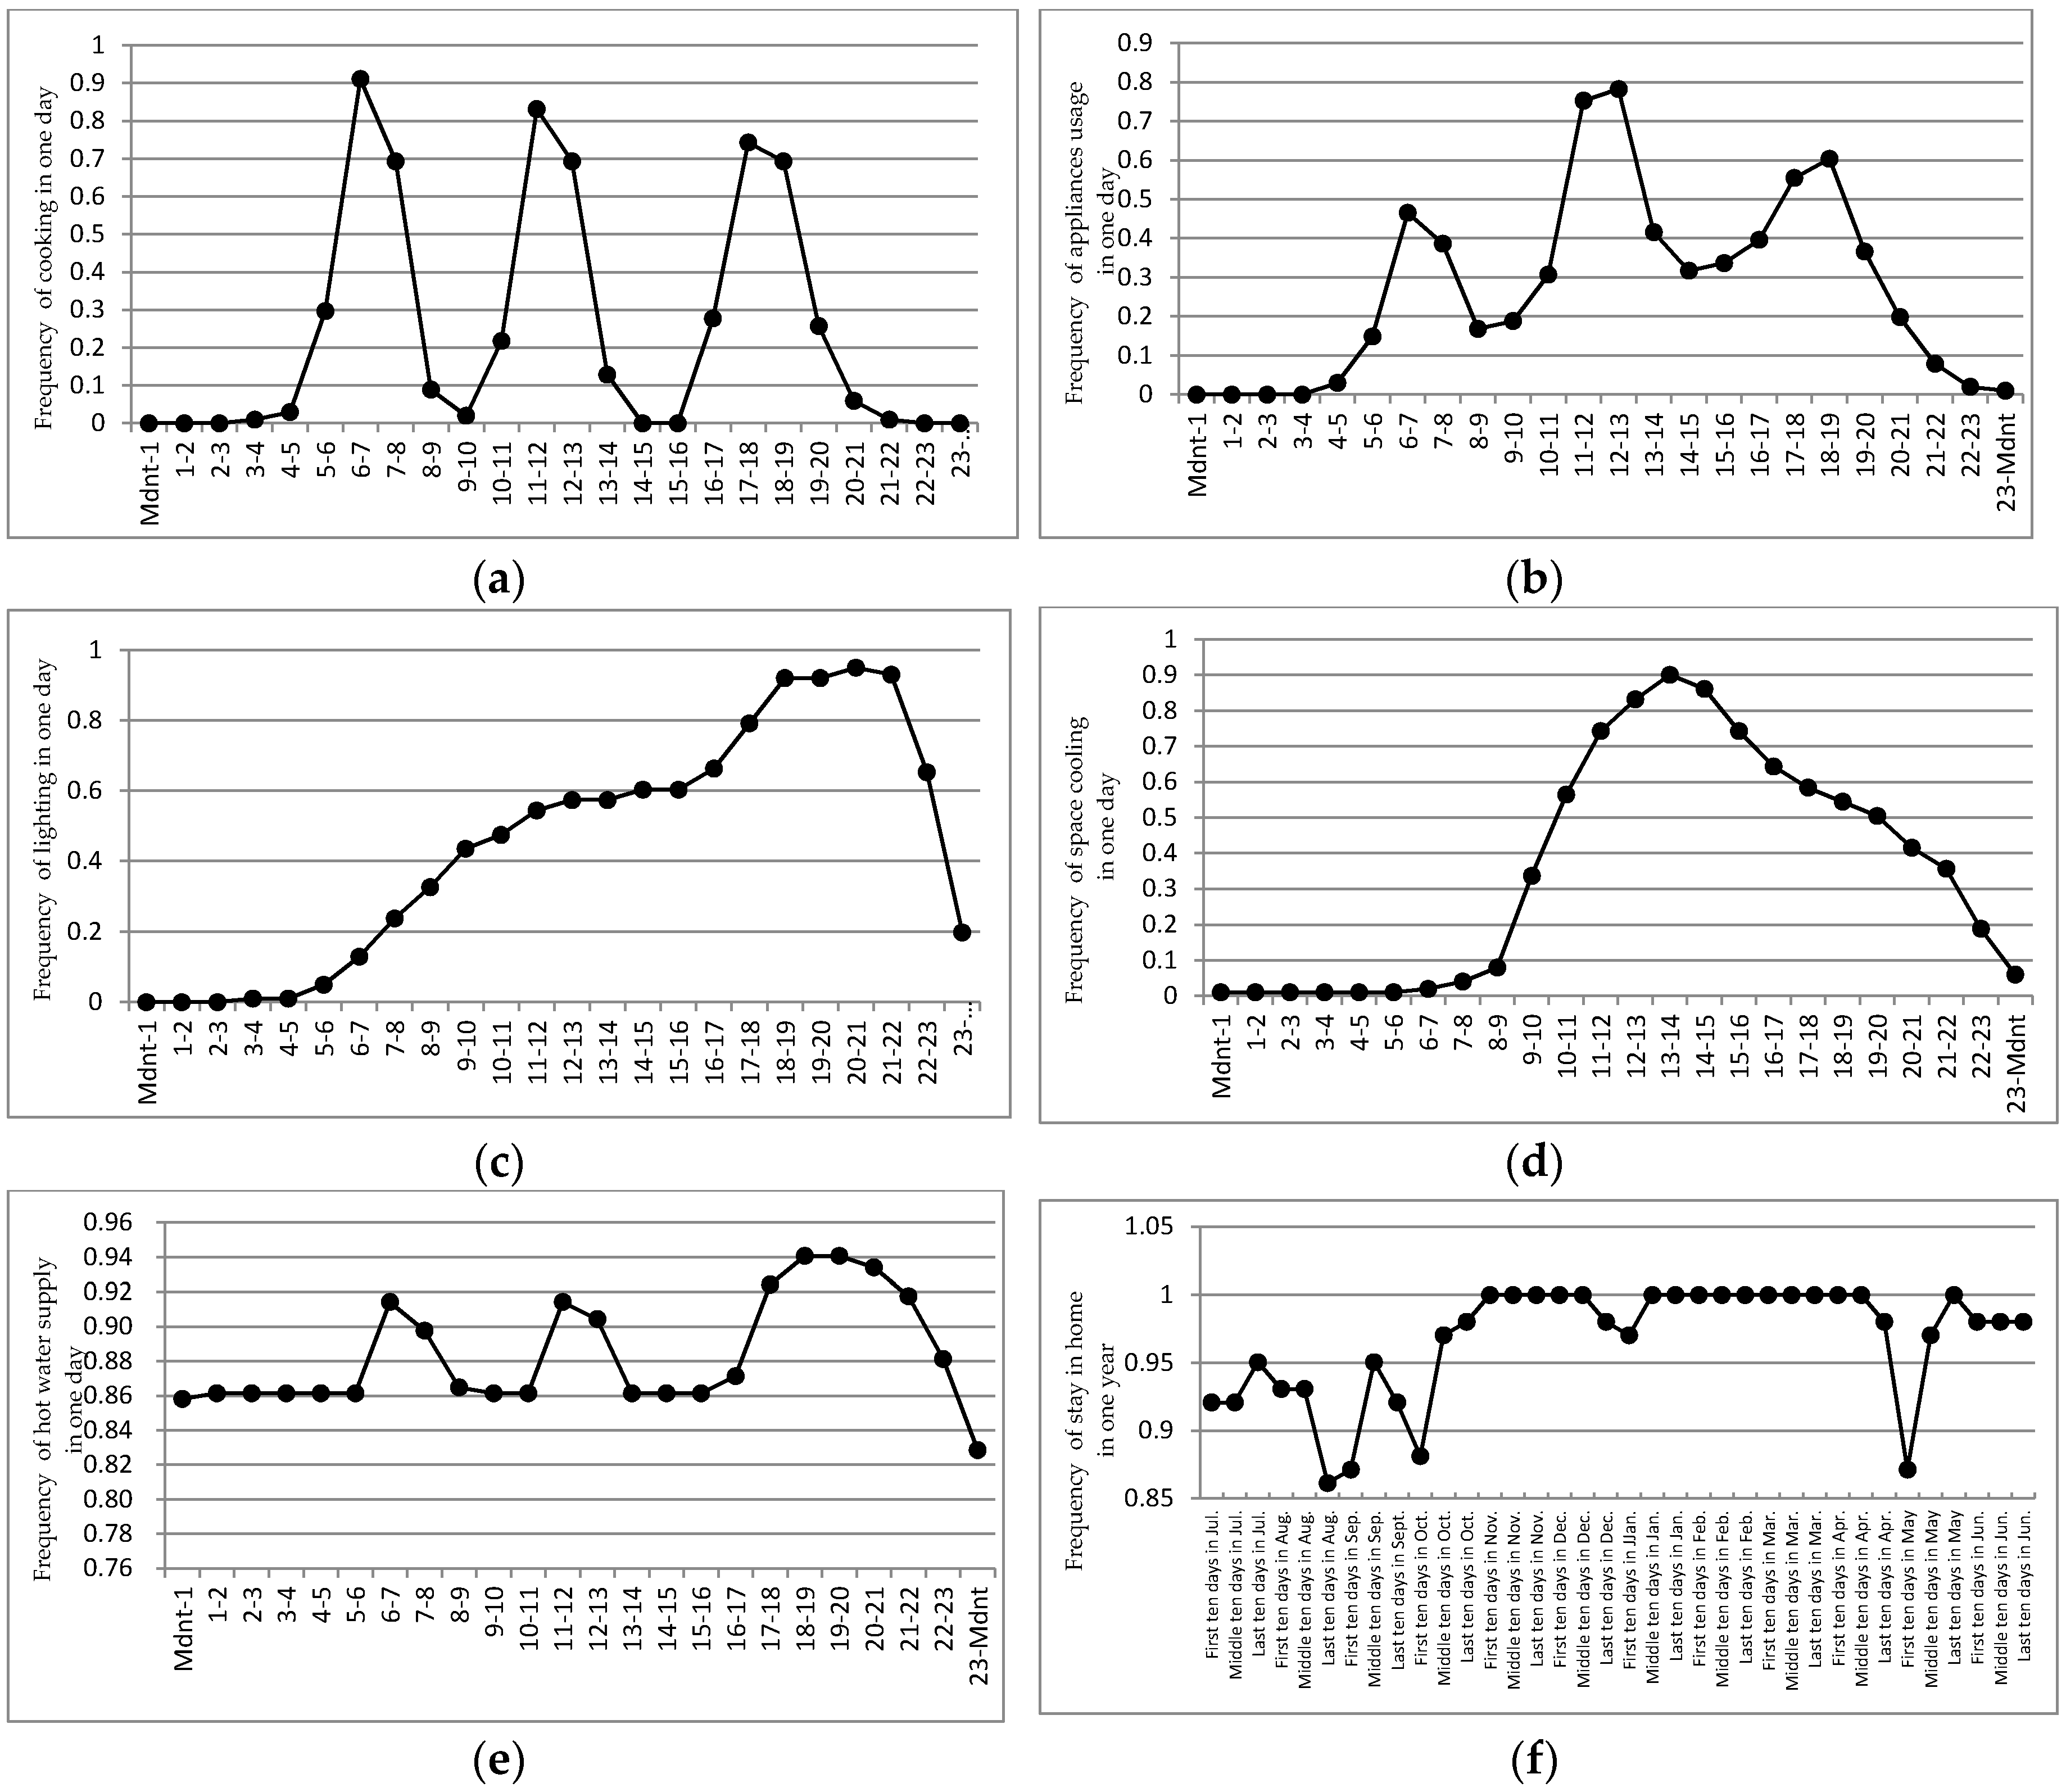
2.3.2. Actual Energy Consumption Behaviour Schedule
2.4. Simulation and Calculation
2.4.1. eQUEST Modelling
2.4.2. Elevator Energy Consumption Calculation
2.4.3. The Standard Coal Conversion
3. Results
3.1. Questionnaires
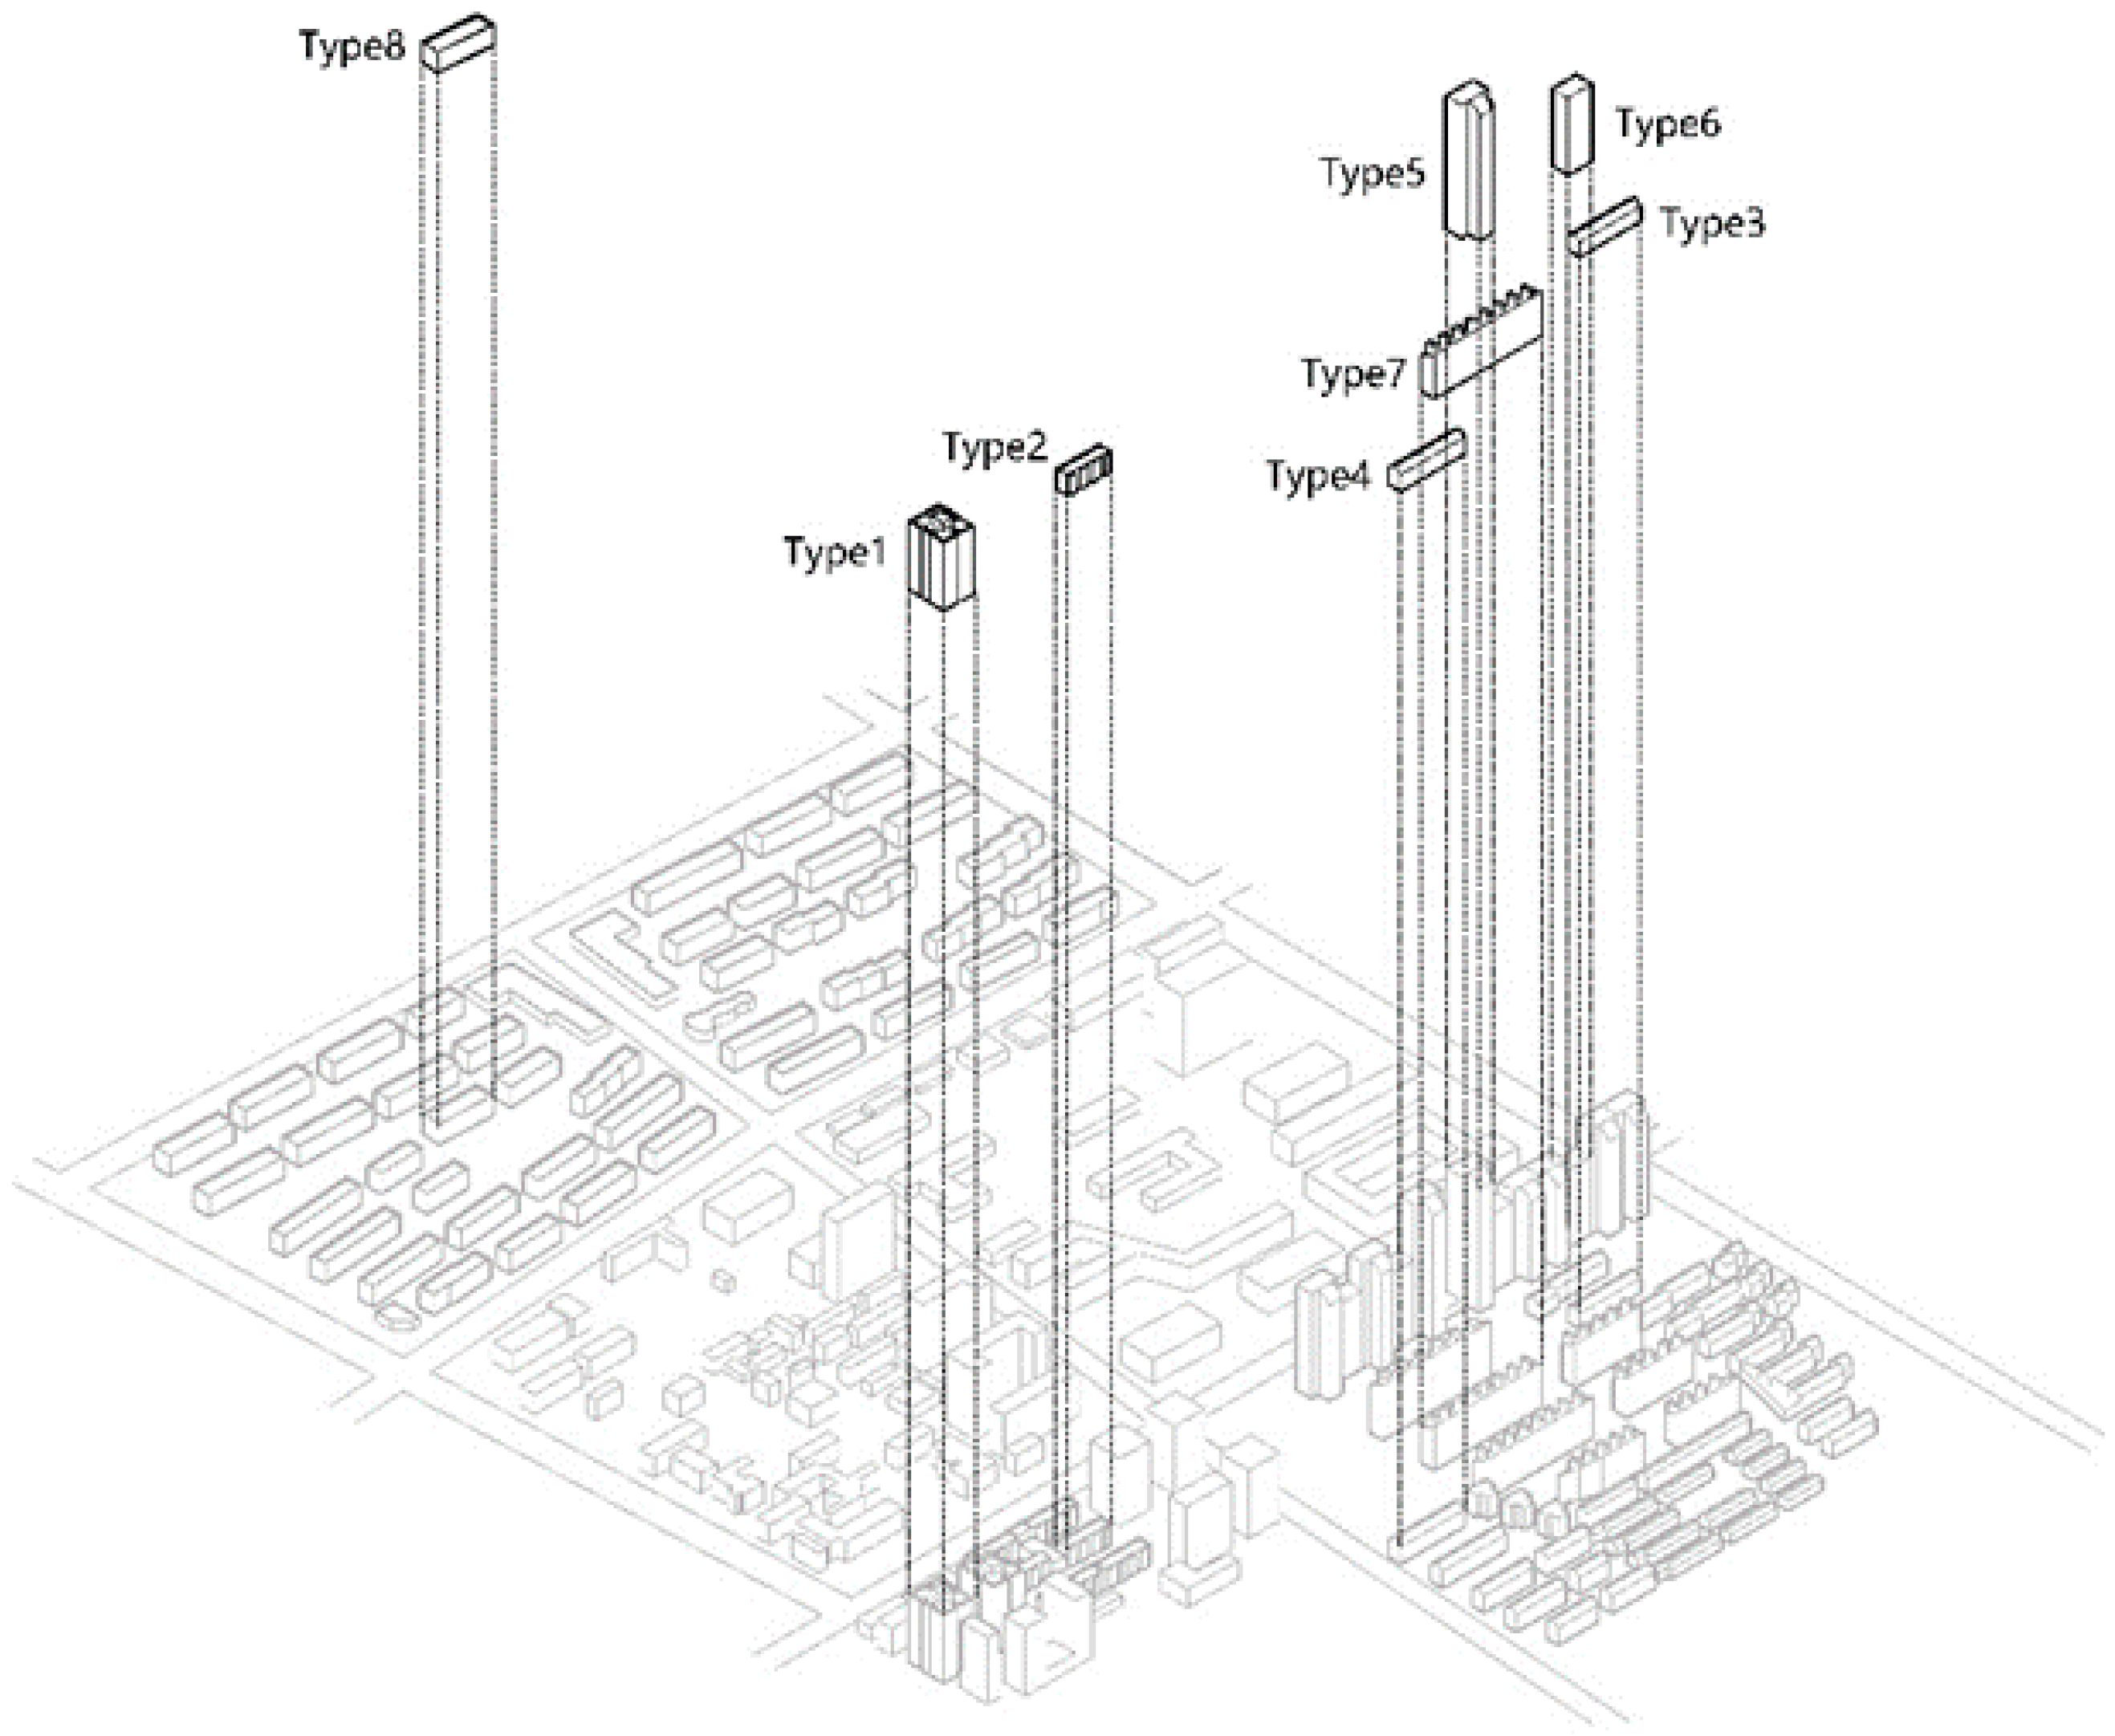
3.2. Building Classification and Typical Building Selection
3.3. Real-Time Meteorological File
3.4. Actual Energy Consumption Behaviour Schedule
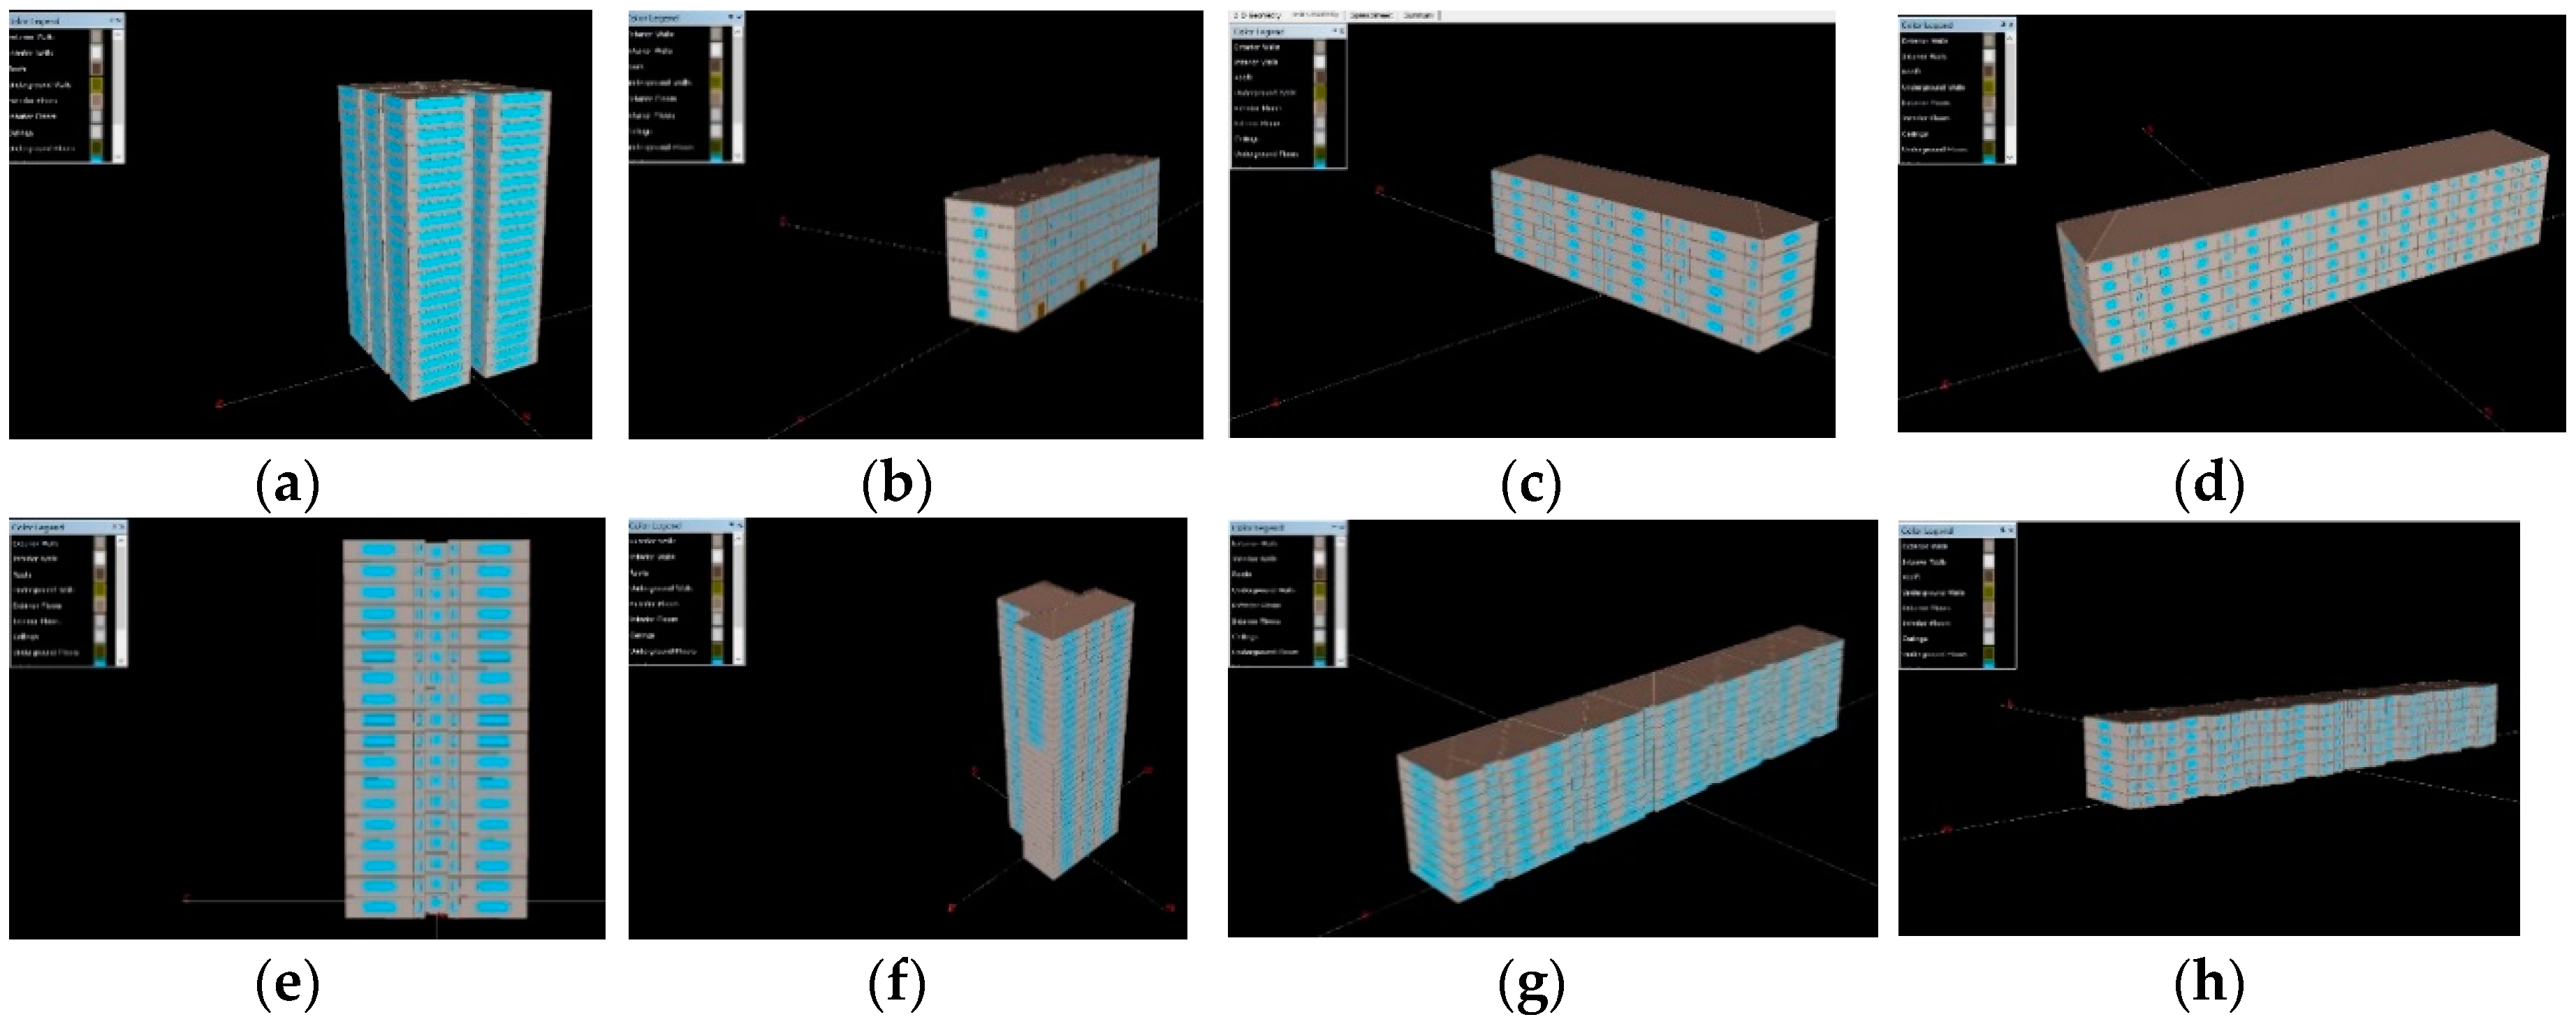
3.5. eQUEST Models
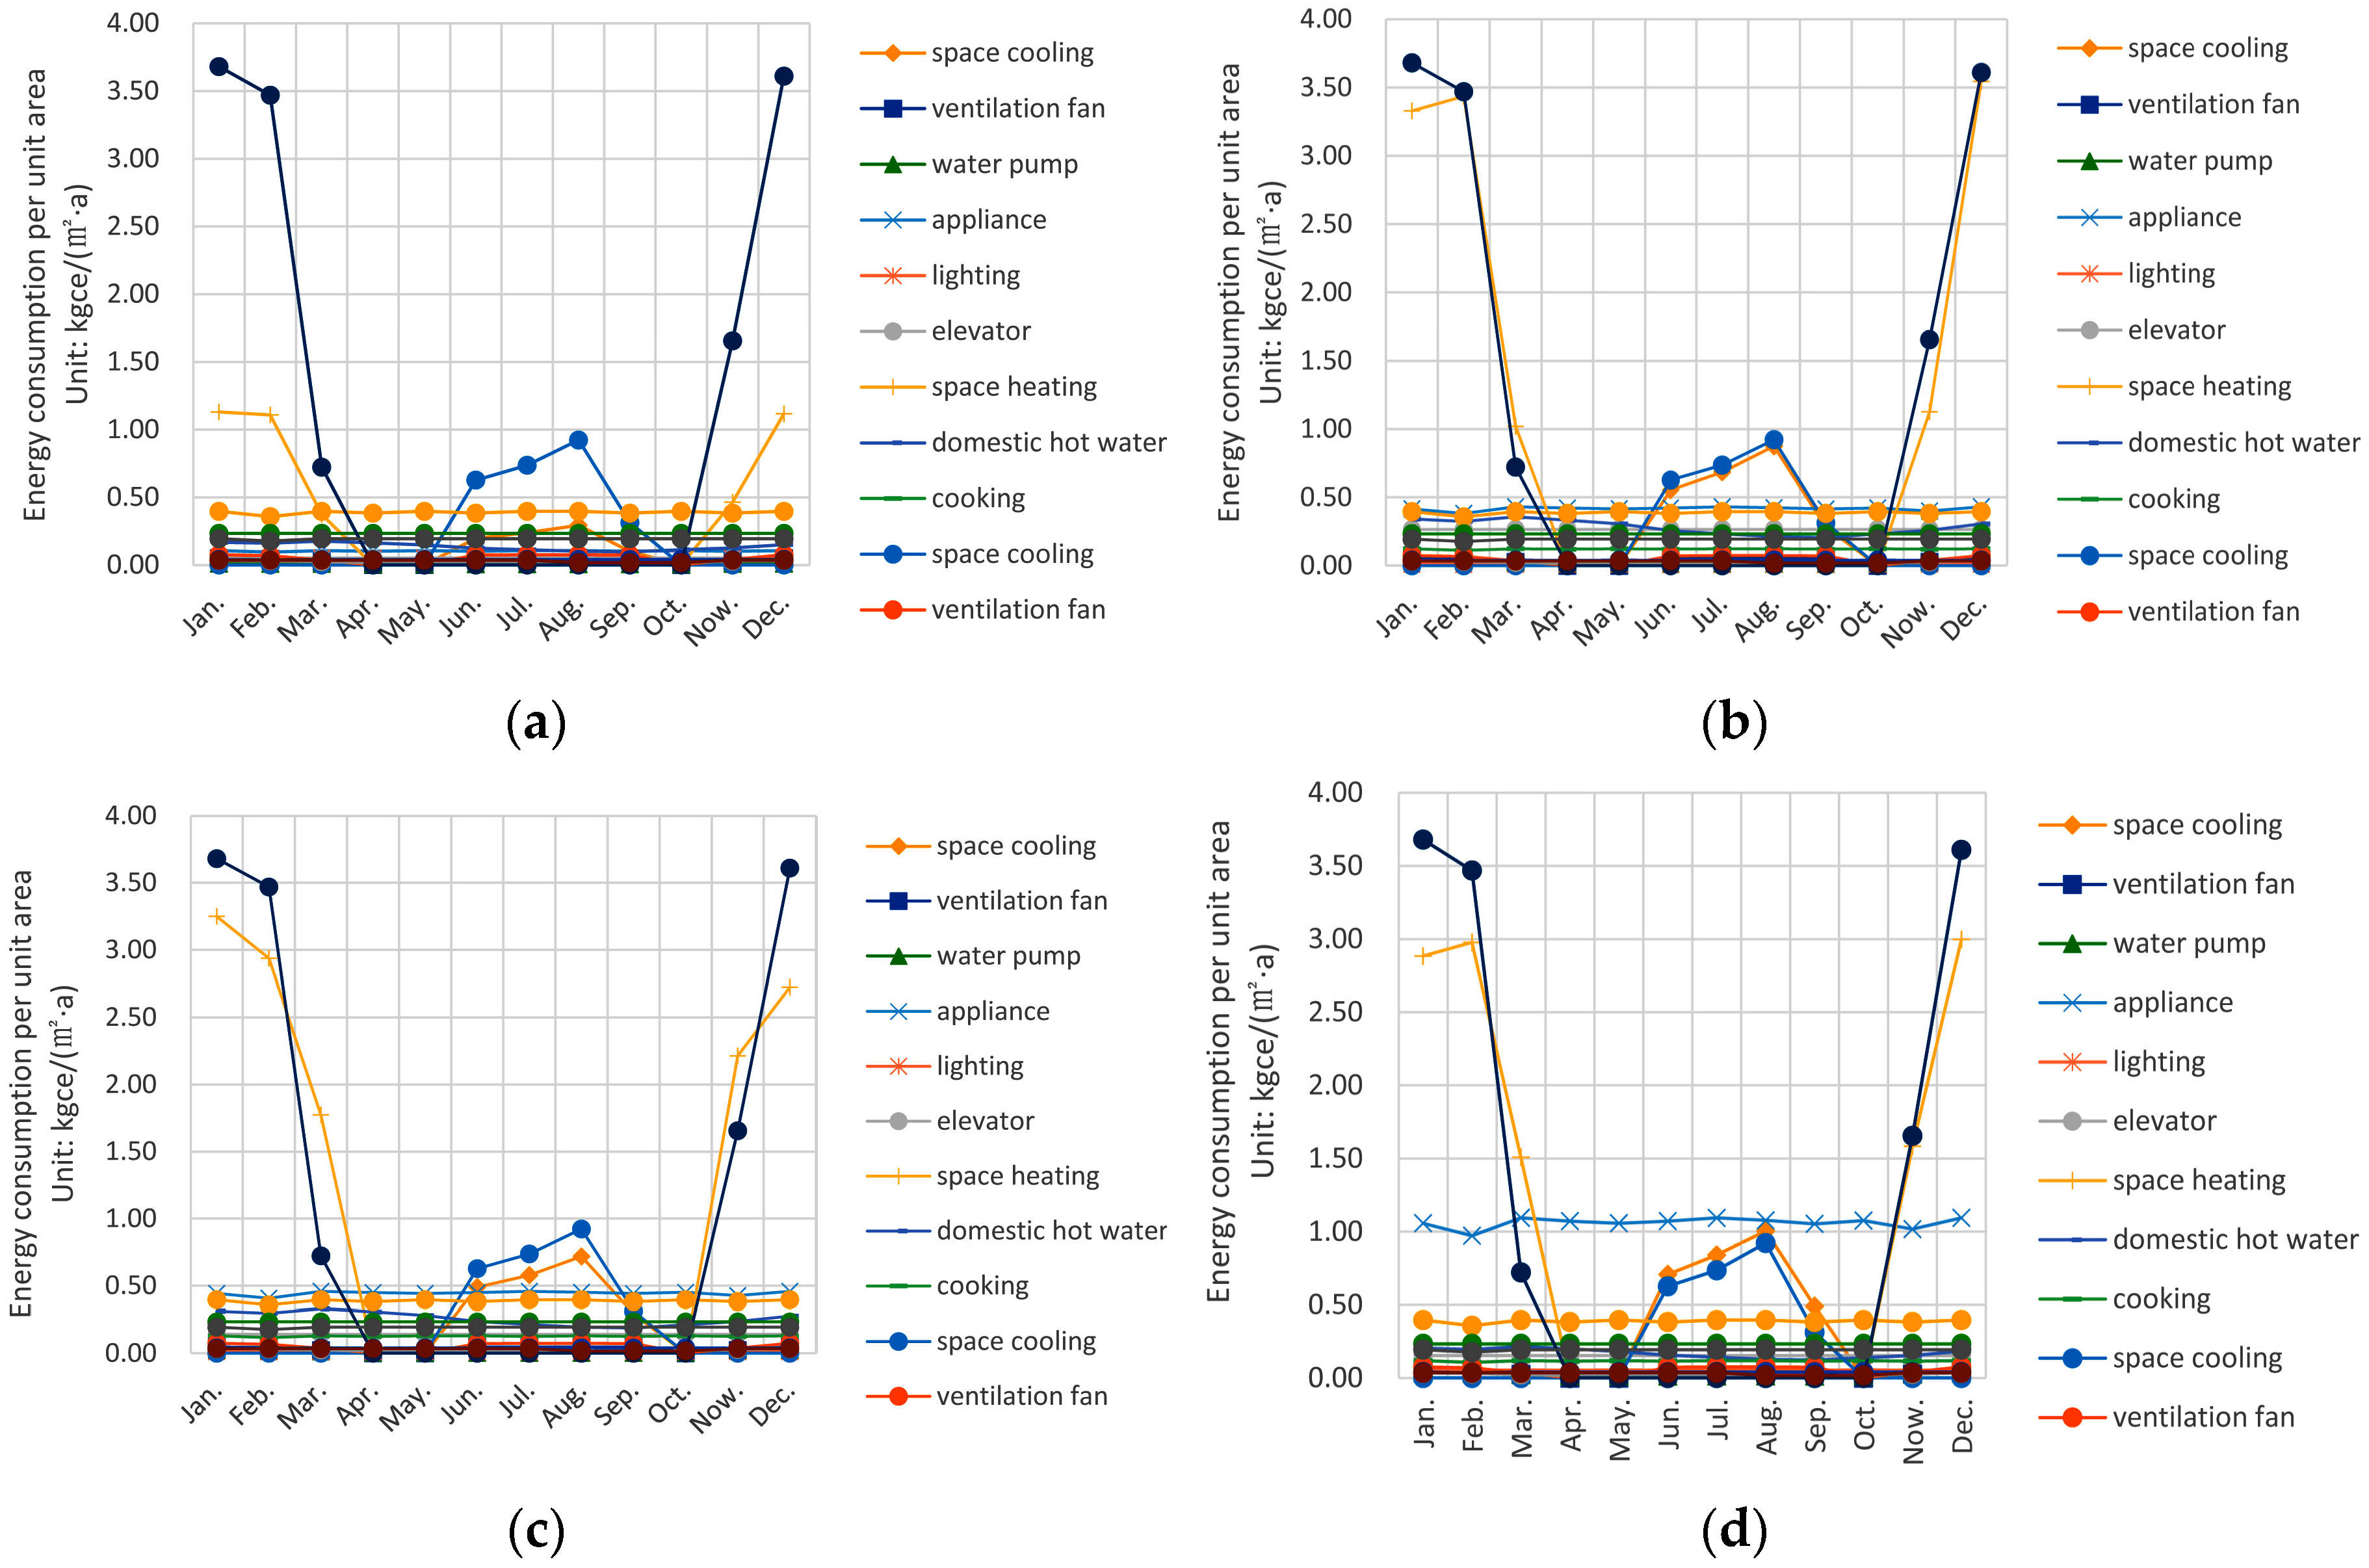
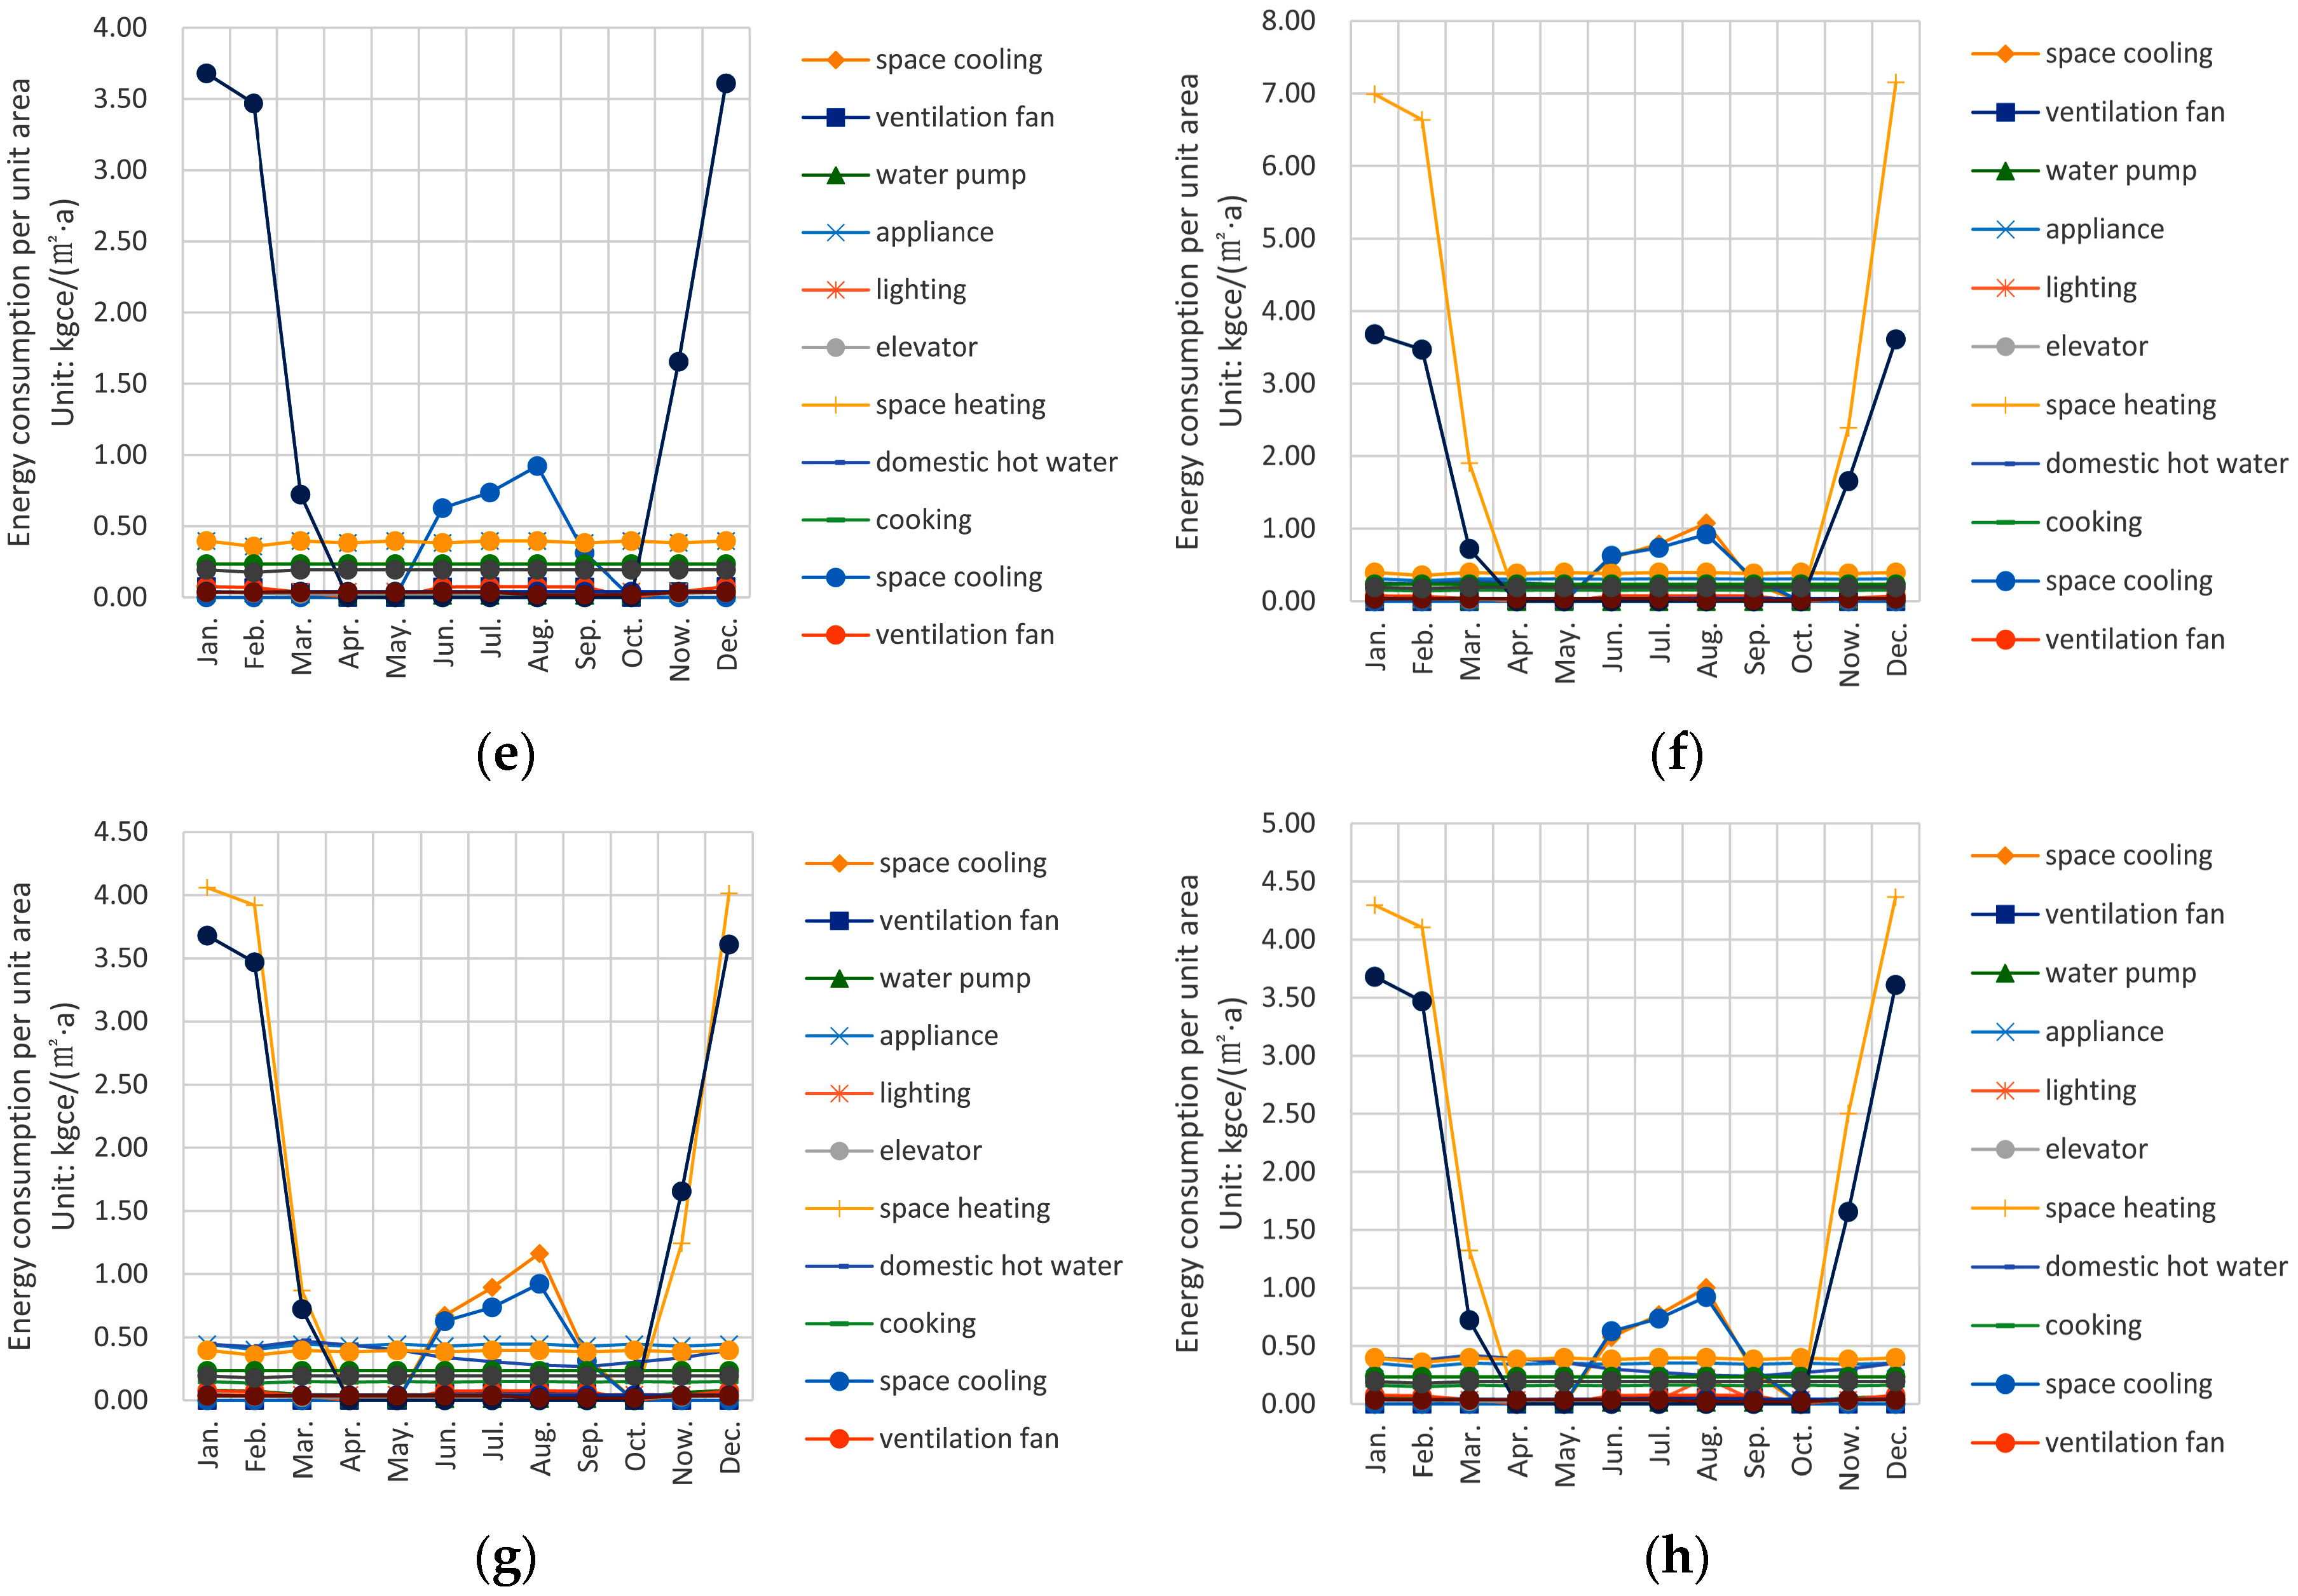
3.6. Standard Coal Conversion Result
4. Discussion
4.1. Composition and Variance Analysis of Total Energy Consumption
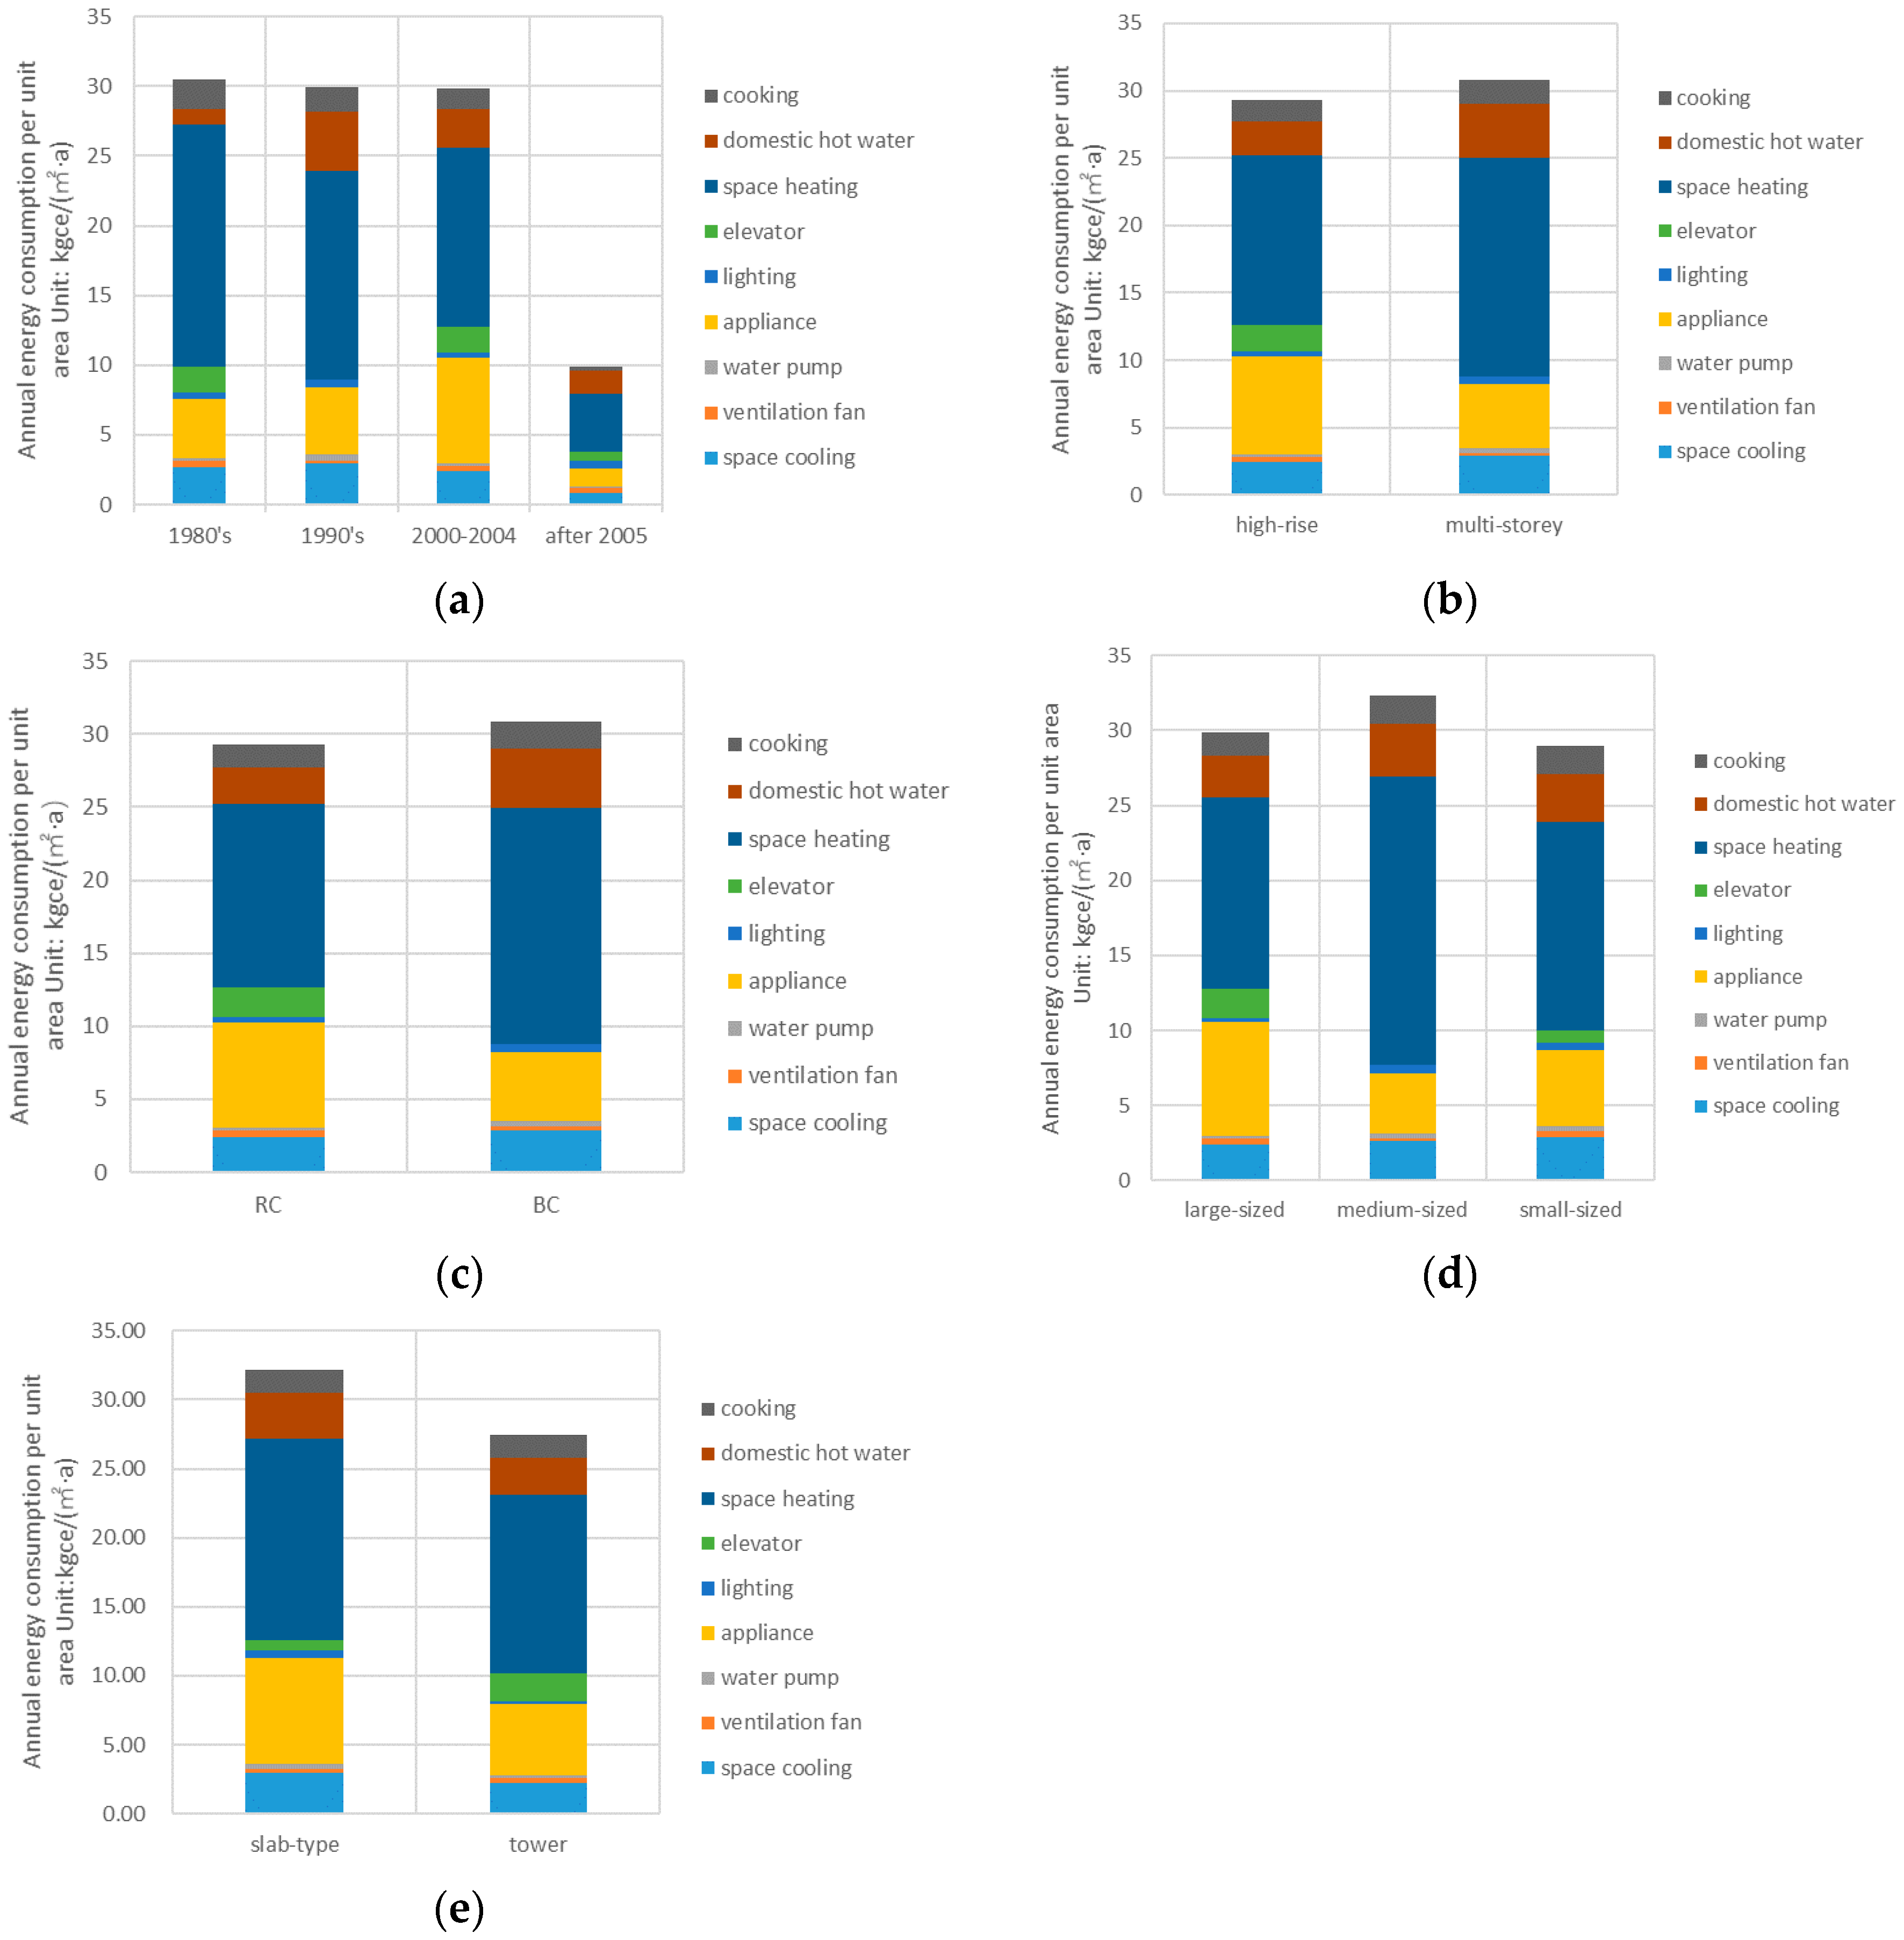
4.2. Comparison of Energy Consumption in Different Types of Buildings
4.2.1. Comparison of Energy Consumption of Residential Buildings in Different Ages
4.2.2. Comparison of Energy Consumption of Residential Buildings with Different Heights
4.2.3. Comparison of Energy Consumption of Residential Buildings with Different Apartment sizes
4.2.4. Comparison of Energy Consumption of Residential Buildings with Different Construction Forms
4.3. Analysis of Household Energy Impact Variables in Residential Buildings in Case Area
5. Conclusions
Acknowledgments
Author Contributions
Conflicts of Interest
References
- Doman, L.E.; Arora, V.; Hojjati, B.; Peterson, D. International Energy Outlook 2016; U.S. Energy Information Administration, Office of Energy Analysis, U.S. Department of Energy: Washington, DC, USA, 2016.
- BP. Bp Statistical Review of World Energy 2015; BP: London, UK, 2016. [Google Scholar]
- Fan, J.-L.; Liao, H.; Liang, Q.-M.; Tatano, H.; Liu, C.-F.; Wei, Y.-M. Residential carbon emission evolutions in urban–rural divided China: An end-use and behavior analysis. Appl. Energy 2013, 101, 323–332. [Google Scholar] [CrossRef]
- Dall’O’, G.; Galante, A.; Torri, M. A methodology for the energy performance classification of residential building stock on an urban scale. Energy Build. 2012, 48, 211–219. [Google Scholar] [CrossRef]
- Swan, L.G.; Ugursal, V.I. Modeling of end-use energy consumption in the residential sector: A review of modeling techniques. Renew. Sustain. Energy Rev. 2009, 13, 1819–1835. [Google Scholar] [CrossRef]
- Fan, J.-L.; Zhang, Y.-J.; Wang, B. The impact of urbanization on residential energy consumption in China: An aggregated and disaggregated analysis. Renew. Sustain. Energy Rev. 2017, 75, 220–233. [Google Scholar] [CrossRef]
- Miao, L. Examining the impact factors of urban residential energy consumption and CO2 emissions in China—Evidence from city-level data. Ecol. Indic. 2017, 73, 29–37. [Google Scholar] [CrossRef]
- Hu, S.; Yan, D.; Guo, S.; Cui, Y.; Dong, B. A survey on energy consumption and energy usage behavior of households and residential building in urban China. Energy Build. 2017, 148, 366–378. [Google Scholar] [CrossRef]
- Sukarno, I.; Matsumoto, H.; Susanti, L. Household lifestyle effect on residential electrical energy consumption in Indonesia: On-site measurement methods. Urban Clim. 2017, 20, 20–32. [Google Scholar] [CrossRef]
- Abanda, F.H.; Byers, L. An investigation of the impact of building orientation on energy consumption in a domestic building using emerging bim (building information modelling). Energy 2016, 97, 517–527. [Google Scholar] [CrossRef]
- Sadeghifam, A.N.; Zahraee, S.M.; Meynagh, M.M.; Kiani, I. Combined use of design of experiment and dynamic building simulation in assessment of energy efficiency in tropical residential buildings. Energy Build. 2015, 86, 525–533. [Google Scholar] [CrossRef]
- La Fleur, L.; Moshfegh, B.; Rohdin, P. Measured and predicted energy use and indoor climate before and after a major renovation of an apartment building in Sweden. Energy Build. 2017, 146, 98–110. [Google Scholar] [CrossRef]
- Mastouri, H.; Benhamou, B.; Hamdi, H.; Mouyal, E. Thermal performance assessment of passive techniques integrated into a residential building in semi-arid climate. Energy Build. 2017, 143, 1–16. [Google Scholar] [CrossRef]
- Fuertes, G.; Schiavon, S. Plug load energy analysis: The role of plug loads in leed certification and energy modeling. Energy Build. 2014, 76, 328–335. [Google Scholar] [CrossRef]
- Zhu, Y. Applying computer-based simulation to energy auditing: A case study. Energy Build. 2006, 38, 421–428. [Google Scholar] [CrossRef]
- Richman, R.; Simpson, R. Towards quantifying energy saving strategies in big-box retail stores: A case study in Ontario (Canada). Sustain. Cities Soc. 2016, 20, 61–70. [Google Scholar] [CrossRef]
- Kim, B. Improvement of indoor thermal environment through solar heat gain loads reduction for an office building. J. Archit. Inst. Korea Plan. Des. 2010, 26, 313–320. [Google Scholar]
- Yu, J.; Yang, C.; Tian, L. Low-energy envelope design of residential building in hot summer and cold winter zone in China. Energy Build. 2008, 40, 1536–1546. [Google Scholar] [CrossRef]
- Wang, W.; Wu, J. Energy consumption analysis method of airport terminal buildings based on equest. J. Civ. Aviat. Univ. China 2013, 31, 34–37. [Google Scholar]
- Wu, C.L.; Zhou, H.Z.; Yin, B.; Yan, J.J. Energy saving analysis of air conditioning system for one office building based on equest simulation. Build. Energy Environ. 2013, 32, 56–58. [Google Scholar]
- Yin, R.; Xu, P.; Shen, P. Case study: Energy savings from solar window film in two commercial buildings in Shanghai. Energy Build. 2012, 45, 132–140. [Google Scholar] [CrossRef]
- Yuan, L.; Li, Y. The Study of Large-Scale Public Buildings’ Carbon Dioxide Emission of Olympic Central Area in Beijing; The University of Chinese Academy of Sciences: Beijing, China, 2015. [Google Scholar]
- Cui, Y.; Yan, D.; Hong, T.; Xiao, C.; Luo, X.; Zhang, Q. Comparison of typical year and multiyear building simulations using a 55-year actual weather data set from China. Appl. Energy 2017, 195, 890–904. [Google Scholar] [CrossRef]
- Kwak, Y.; Huh, J.-H. Development of a method of real-time building energy simulation for efficient predictive control. Energy Convers. Manag. 2016, 113, 220–229. [Google Scholar] [CrossRef]
- Emery, A.F.; Kippenhan, C.J. A long term study of residential home heating consumption and the effect of occupant behavior on homes in the pacific northwest constructed according to improved thermal standards. Energy 2006, 31, 677–693. [Google Scholar] [CrossRef]
- Iwashita, G.; Akasaka, H. The effects of human behavior on natural ventilation rate and indoor air environment in summer—A field study in southern Japan. Energy Build. 1997, 25, 195–205. [Google Scholar] [CrossRef]
- Pettersen, T.D. Variation of energy consumption in dwellings due to climate, building and inhabitants. Energy Build. 1994, 21, 209–218. [Google Scholar] [CrossRef]
- Aksoezen, M.; Daniel, M.; Hassler, U.; Kohler, N. Building age as an indicator for energy consumption. Energy Build. 2015, 87, 74–86. [Google Scholar] [CrossRef]
- Brounen, D.; Kok, N.; Quigley, J.M. Residential energy use and conservation: Economics and demographics. Eur. Econ. Rev. 2012, 56, 931–945. [Google Scholar] [CrossRef]
- Beijing “12th five-year” building energy efficiency standards will be increased by 15%. Build. Energy Effic. 2013, 41, 62.
- Caputo, P.; Costa, G.; Ferrari, S. A supporting method for defining energy strategies in the building sector at urban scale. Energy Policy 2013, 55, 261–270. [Google Scholar] [CrossRef]
- Mastrucci, A.; Baume, O.; Stazi, F.; Leopold, U. Estimating energy savings for the residential building stock of an entire city: A gis-based statistical downscaling approach applied to rotterdam. Energy Build. 2014, 75, 358–367. [Google Scholar] [CrossRef]
- Liu, X.; Sweeney, J. Modelling the impact of urban form on household energy demand and related CO2 emissions in the greater Dublin region. Energy Policy 2012, 46, 359–369. [Google Scholar] [CrossRef]
- Yang, T.; Chen, H.; Zhang, Y.; Zhang, S.; Feng, F. Towards low-carbon urban forms: A comparative study on energy efficiencies of residential neighborhoods in Chongming eco-island. Energy Procedia 2016, 88, 321–324. [Google Scholar] [CrossRef]
- Estiri, H. Building and household x-factors and energy consumption at the residential sector: A structural equation analysis of the effects of household and building characteristics on the annual energy consumption of us residential buildings. Energy Econ. 2014, 43, 178–184. [Google Scholar] [CrossRef]
- Yan, F.; Li, H.; Zheng, H. Research on factors of Beijing’s building carbon emissions. Ecol. Econ. 2016, 72–75. [Google Scholar]
- Pu, Q. Research on Prediction Model and Influencing Factors of Urban Residential Building Energy Consumption. Ph.D. Thesis, Chongqing University, Chongqing, China, 2012. [Google Scholar]
- National Development and Reform Commission. Notifications of the Pilot Work of the Second Batch of Low Carbon Provinces and Low Carbon Cities by the National Development and Reform Commission; National Development and Reform Commission: Beijing, China, 2010.
- Duan, K.; Ren, J.; Zhang, J.; Wang, Z.; Cui, X.; Li, J.; Li, J. Effectiveness test and economic energy efficiency analysis of energy saving renovation of residential buildings in Beijing. Constr. Technol. 2012, 41, 35–38. [Google Scholar]
- Opinions on the Implementation of Comprehensive Rehabilitation of Old Residential District in Beijing; Beijing Municipal People’s Government: Beijing, China, 2012.
- Li, Z.W. Beijing Plans to Expand the Scope of the Old District Transformation 5 Types of Old District Were Added; Beijing Youth Daily: Beijing, China, 2016. [Google Scholar]
- Energy Performance of Lifts and Escalators—Part 1: Energy Measurement and Conformance; ISO/DIS 25745-1:2008; International Organization for Standardization: Geneva, Switzerland, 2008; Available online: https://infostore.saiglobal.com/en-au/Standards/NEN-EN-ISO-25745-1-2008-1074753/ (accessed on 3 December 2017).
- Beijing City “13th Five-Year” Period Civil Building Energy Development Planning Beijing Municipal Committee of Housing and Urban Rural Development; Beijing Municipal Development and Reform Commission: Beijing, China, 2016.


| Type | 1 | 2 | 3 | 4 | 5 | 6 | 7 | 8 |
|---|---|---|---|---|---|---|---|---|
| Construction Time | 1980s | 1980s | 1990s | 1990s | 2000–2004 | 2000–2004 | 2000–2004 | After 2005 |
| construction form | T | SL | SL | SL | T | T | SL | SL |
| building structure | RC | BC | BC | BC | RC | RC | RC | RC |
| floor level | 22 | 6 | 6 | 6 | 33 | 18 | 10 | 6 |
| elevator | √ | - | - | - | √ | √ | √ | √ |
| number of households | 308 | 48 | 72 | 72 | 132 | 36 | 120 | 48 |
| number of occupants | 921 | 129 | 256 | 236 | 413 | 113 | 385 | 173 |
| apartment size | S | M | S | M | L | L | L | L |
| space heating | DH/NG | DH/NG | DH/NG | DH/NG | DH/NG | DH/NG | DH/NG | WSHP |
| space cooling | DCS | DCS | DCS | DCS | DCS | DCS | DCS | WSHP |
| Domestic hot water | NG | NG | NG | NG | NG | NG | NG | NG |
| Type of Energy Consumption | Buildings of Case Area | Buildings with Elevators | ||
|---|---|---|---|---|
| Annual Energy Consumption/kgce | Proportion/% | Annual Energy Consumption/kgce | Proportion/% | |
| Space cooling | 1,851,379 | 9 | 1,341,474 | 8 |
| Ventilation fan | 393,530 | 2 | 354,078.9 | 2 |
| Water pump | 186,186.2 | 1 | 117,400.8 | 1 |
| Appliance | 4,227,628 | 20 | 3,395,449 | 21 |
| Lighting | 505,866.7 | 2 | 413,266.5 | 2 |
| Elevator | 1,069,895 | 5 | 1,069,895 | 7 |
| Space heating | 9,782,272 | 46 | 7,001,752 | 43 |
| Domestic hot water | 2,491,761 | 12 | 1,783,222 | 11 |
| Cooking | 1,093,551 | 5 | 774,240.3 | 5 |
| Total | 21,262,282 | 100 | 16,250,779 | 100 |
| Space Heating | Space Cooling | Ventilation Fan | Pump | Appliance | Lighting | Domestic Hot Water | Cooking | Total Energy Consumption | |
|---|---|---|---|---|---|---|---|---|---|
| SSA | 55.880 | 0.723 | 0.010 | 0.090 | 6.356 | 0.023 | 1.002 | 0.192 | 12.944 |
| SSE | 0.378 | 4.178 | 0.057 | 0.020 | 0.024 | 0.033 | 0.195 | 0.001 | 37.443 |
| sig. | 0.000 | 0.600 | 0.043 | 0.000 | 0.000 | 0.000 | 0.000 | 0.000 | 0.000 |
| Item | Variable | Symbol | Variable Declaration | Unit |
|---|---|---|---|---|
| Household income | Per capita income | PCI | Resident per capita net income | Yuan per capita |
| Household condition | Number of residents | NR | Number of family residents | person |
| Building condition | Building height | BH | Height of the buildings | Semi-parametric |
| Building structure | BS | The structure of the building | Semi-parametric | |
| Architectural form | AF | The form of the building | Semi-parametric | |
| Internal Unit | IU | The size of internal unit | Semi-parametric | |
| Construction age | CA | The construction age of the building | Semi-parametric | |
| Per capita building area | PCA | Per capita possession of the building area | Square meter | |
| Floor number | FN | Living floor number | Floor | |
| Lifestyle | Summer air conditioning strategy | SAC | Summer air conditioning daily cooling time | Hour |
| The number of weekly cooking | NWC | Weekly cooking times | Time | |
| Hot water supply strategy in winter | HWW | Hot water daily supply time in winter | Hour | |
| Hot water supply strategy in summer | HWS | Hot water daily supply time in summer | Hour | |
| Hot water supply strategy in spring and autumn | HWSA | Hot water daily supply time in spring and autumn | Hour | |
| Household appliance | Number of air conditioners | NAC | Number of air conditioners | Unit |
| Number of televisions | NT | Number of televisions | Unit | |
| Number of computers | NC | Number of computers | Unit | |
| Energy-saving concept | Energy saving lamp ratio | ESL | The proportion of energy saving lamp out of total lamp | Percentage |
| Length of power use | PU | The amount of time spent on power use each day | Hour |
| R | R2 | Adjusted R2 | Std. Error of the Estimate | Change Statistics | Durbin Watson | ||||
|---|---|---|---|---|---|---|---|---|---|
| R2 Change | F Change | df1 | df2 | Sig. F Change | |||||
| 0.974 | 0.949 | 0.948 | 1301.62688 | 0.002 | 13.846 | 1 | 421 | 0.000 | 1.317 |
| Variable | Unstandardized Coefficients | Standardized Coefficients | t | Sig. | Correlations | Collinearity Statistics | ||||
|---|---|---|---|---|---|---|---|---|---|---|
| B | Std. Error | Beta | Zero−Order | Partial | Part | Tolerance | VIF | |||
| IU | −4433.415 | 167.628 | −0.737 | −26.448 | 0.000 | −0.954 | −0.790 | −0.292 | 0.157 | 6.384 |
| BH | −1927.197 | 174.641 | −0.152 | −11.035 | 0.000 | 0.219 | −0.474 | −0.122 | 0.644 | 1.553 |
| PCA | 72.552 | 6.682 | 0.308 | 10.857 | 0.000 | 0.827 | 0.468 | 0.120 | 0.151 | 6.611 |
| NR | 853.120 | 107.631 | 0.140 | 7.926 | 0.000 | 0.162 | 0.360 | 0.087 | 0.389 | 2.574 |
| PU | 40.809 | 10.967 | 0.047 | 3.721 | 0.000 | 0.042 | 0.178 | 0.041 | 0.776 | 1.289 |
| (Constant) | 17,061.611 | 944.149 | 18.071 | 0.000 | ||||||
© 2017 by the authors. Licensee MDPI, Basel, Switzerland. This article is an open access article distributed under the terms and conditions of the Creative Commons Attribution (CC BY) license (http://creativecommons.org/licenses/by/4.0/).
Share and Cite
Xu, C.; Li, Y.; Jin, X.; Yuan, L.; Cheng, H. A Real-Time Energy Consumption Simulation and Comparison of Buildings in Different Construction Years in the Olympic Central Area in Beijing. Sustainability 2017, 9, 2245. https://doi.org/10.3390/su9122245
Xu C, Li Y, Jin X, Yuan L, Cheng H. A Real-Time Energy Consumption Simulation and Comparison of Buildings in Different Construction Years in the Olympic Central Area in Beijing. Sustainability. 2017; 9(12):2245. https://doi.org/10.3390/su9122245
Chicago/Turabian StyleXu, Chen, Yu Li, Xueting Jin, Liang Yuan, and Hao Cheng. 2017. "A Real-Time Energy Consumption Simulation and Comparison of Buildings in Different Construction Years in the Olympic Central Area in Beijing" Sustainability 9, no. 12: 2245. https://doi.org/10.3390/su9122245
APA StyleXu, C., Li, Y., Jin, X., Yuan, L., & Cheng, H. (2017). A Real-Time Energy Consumption Simulation and Comparison of Buildings in Different Construction Years in the Olympic Central Area in Beijing. Sustainability, 9(12), 2245. https://doi.org/10.3390/su9122245