Article

The Relationship between the Efficiency, Service Quality and Customer Satisfaction for State-Owned Commercial Banks in China

1
Department of Hospitality and Tourism Management, Sejong University, Seoul 05006, Korea
2
School of Business, Hanyang University, Seoul 04763, Korea
*
Author to whom correspondence should be addressed.
Sustainability 2017, 9(12), 2163; https://doi.org/10.3390/su9122163
Submission received: 10 October 2017 / Revised: 10 November 2017 / Accepted: 22 November 2017 / Published: 23 November 2017

Abstract

:
In 2006, China fully opened up its financial markets. This means that the banking industry is facing a more severe competitive environment, which requires not only the operational efficiency of the bank but also customer satisfaction for the quality of service. As the reform and opening up policy started from the eastern costal areas in China, there are differences in economic development levels by the region, and so are the levels of financial development. Therefore, it is necessary to study the effect of regional differences on bank efficiency. Prior studies also showed a lot of limitations about using data envelopment analysis, in that the efficiencies of the bank are only measured without consideration of other managerial aspects of the service and customer satisfaction. Thus, this study aims to analyze the efficiencies of twenty state-owned commercial banks in five provinces of China. The relationships between bank efficiency, service quality, and customer satisfaction are analyzed. The data used for the analysis was obtained from the 2015 Chinese Banking Statistics. As a result, the average technical efficiency of twenty state-owned banks is as high as 81.9%. It is also found that the bank’s service quality has a positive impact on efficiency and customer satisfaction. In the case of banks that are located in areas with high economic levels, customer satisfaction is lower than that of banks in lower regions. This is because customers in high economic level regions have higher expectations for service quality and it leads to lower customer satisfaction.

1. Introduction

Opening up China’s financial market was fully done in 2006. The decision to open up the financial market was affected by its joining the WTO (World Trade Organization) in 2001. As a result, domestic banks are fiercely competing with more advanced foreign banks for the Chinese financial market. Therefore, it is becoming more important to enhance competitiveness of Chinese banks. In particular, securing the competitiveness of state-owned commercial banks is a prerequisite for the successful reform of the Chinese banking system since they are the most important players in terms of asset size and credit share in the Chinese financial industry. The state-owned commercial banks account for 54% of the total assets of the financial institutions in China, and thus they occupy an exclusive position in the financial industry [1,2,3]. Therefore, the government is mainly engaged in state-owned commercial banks to intervene and reform the banking system [4].
In addition, in this competitive environment, the profitability of most banks is reduced, so cost reduction through efficiency improvement is a critical task. In order to improve efficiency, the efficiency of each bank should be measured. It is then necessary to identify the ineffective banks and figure out how much improvement is needed in what areas. It is also necessary to identify the factors that influence the efficiency gap between banks. China has a regional disparity in economic development [5]. Therefore, the difference in economic development between these regions may have affected the development of the financial industry [6,7]. Based on these facts, the efficiency of banks is expected to vary depending on regional economic differences. If the economic level of the region affects the efficiency, it means that the policy for efficiency improvement should be applied differently by region.
Duncan and Elliot [8] emphasized that the service quality of bank has a significant impact on the bank’s short-term profitability and ultimately on its financial performance. In addition, they argued that service quality has a great influence on customer satisfaction and customer loyalty, and that this effect becomes even bigger as competition intensifies. Based on this argument, it can be seen that Chinese commercial banks have to make great efforts to improve service quality [9].
However, the problem with state-owned Chinese commercial banks at this point is that their operational efficiency is low and the service system is not well established [10]. Rust et al. [11] addressed that efficiency and quality are closely related. That is, improving quality increases efficiency, because it reduces costs and time for rework, testing, and service failures, which in turn increases sales and market share [12,13,14]. Therefore, it is necessary to study the efficiency, service quality, and customer satisfaction in order for the state-owned Chinese commercial banks to take a competitive advantage in an environment of intensifying competition. However, there are few studies suggesting a comprehensive approach to improving bank efficiency and service quality. Therefore, in this study, we will examine the relative efficiency of the 20 state-owned commercial banks in China by using the DEA-SBM (Slacks-based measure) methodology and propose suggestions for efficiency improvement of each bank. In addition, we measure the service quality of banks and customer satisfaction, and analyze the relationships between efficiency, service quality, and customer satisfaction.

2. Theoretical Background
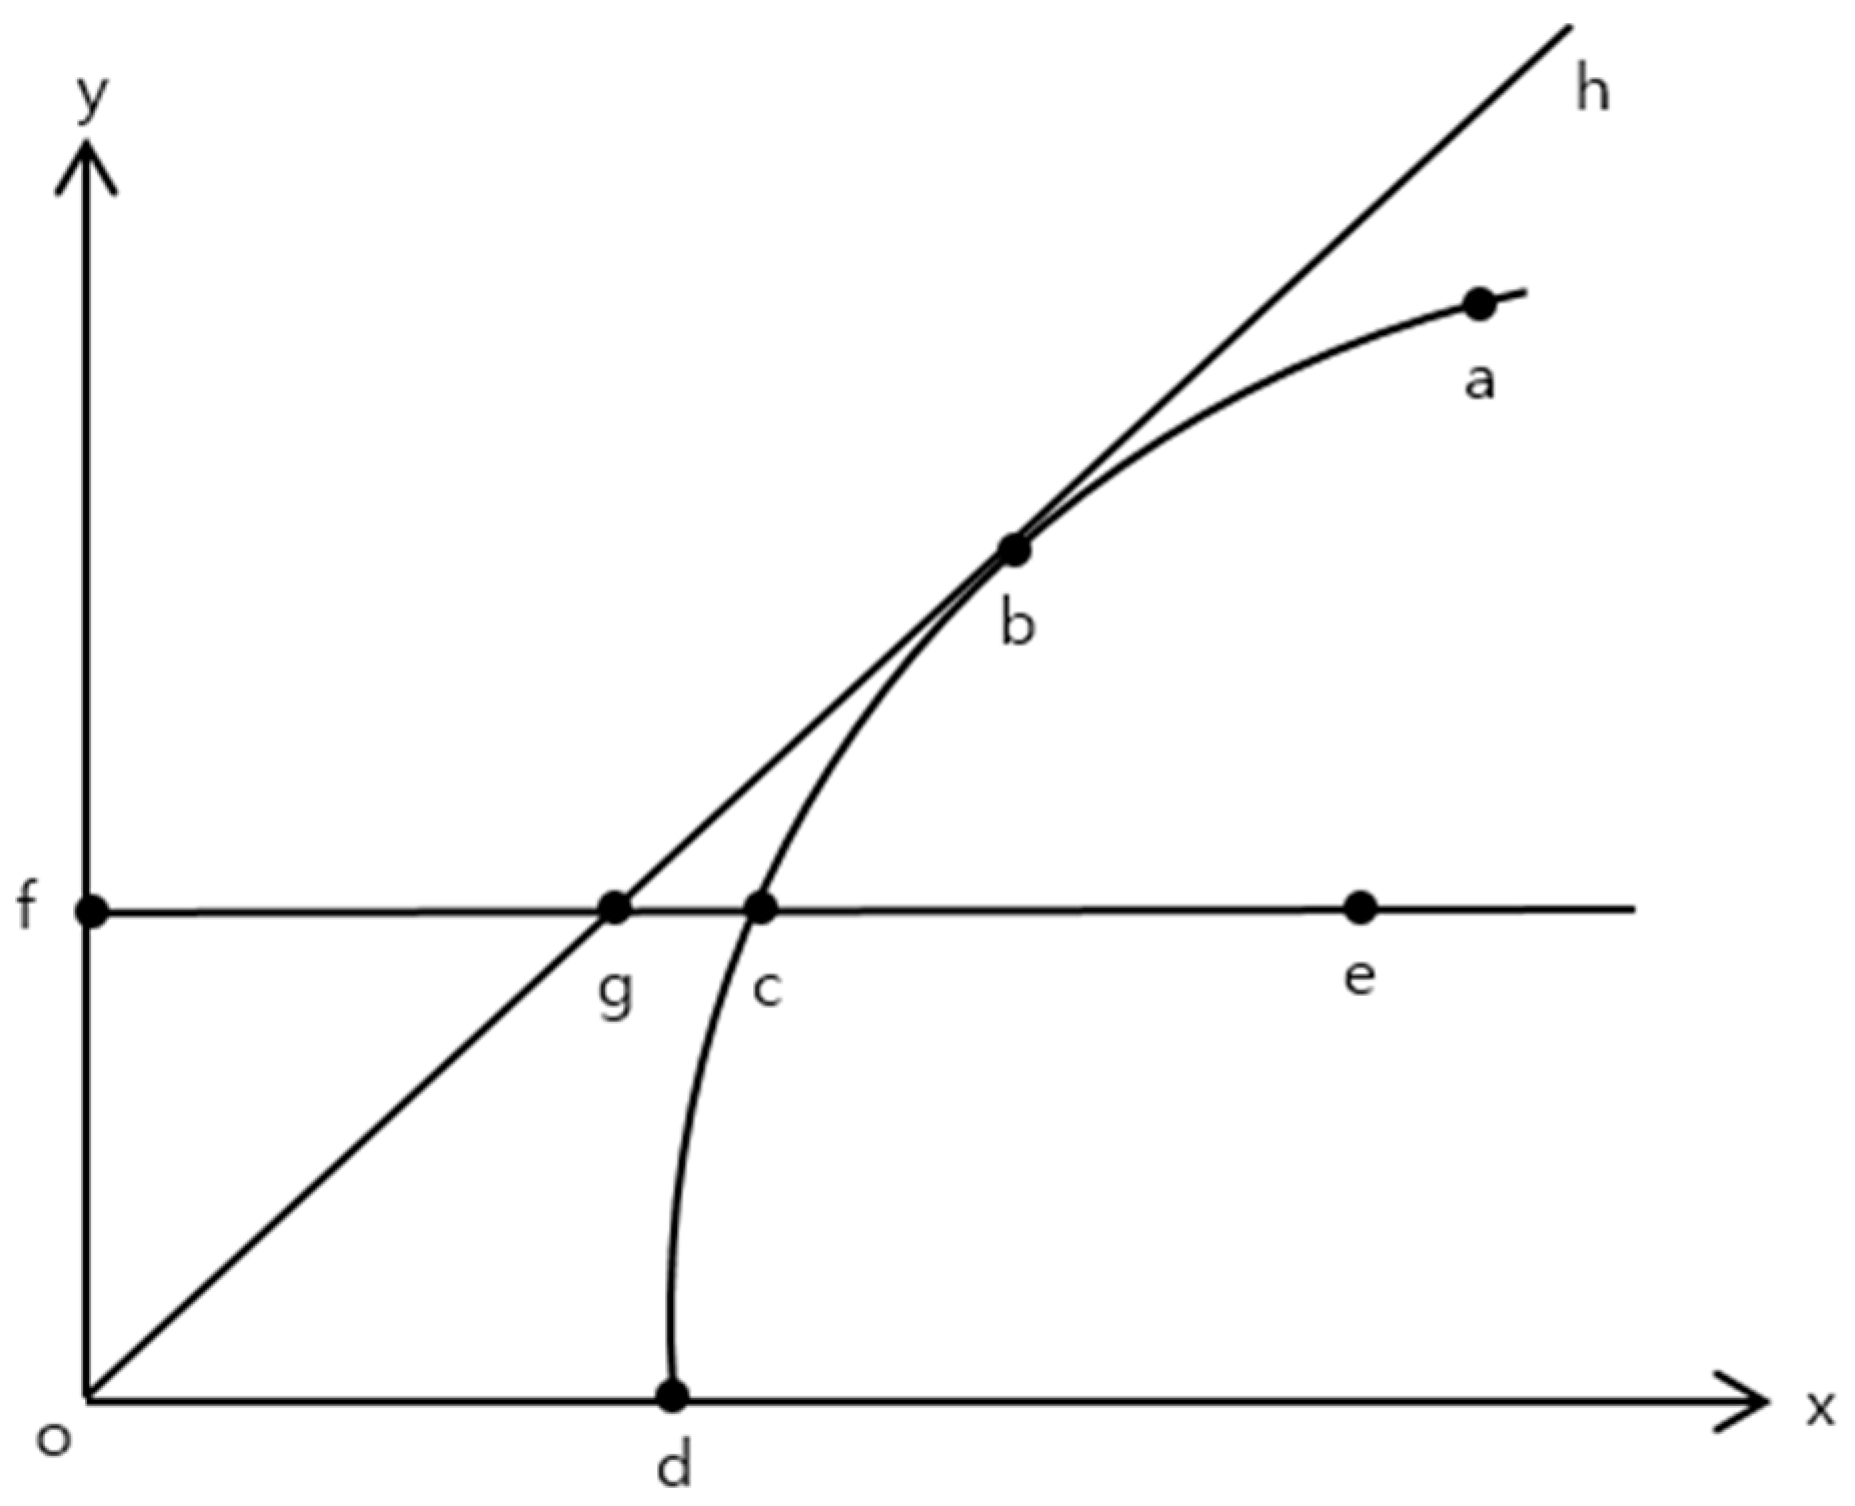
2.1. Concept of DEA

As a nonparametric technique, DEA (Data Envelopment Analysis) was developed for the relative efficiency evaluation of decision making units (DMUs) with multiple inputs and outputs [15]. This approach uses linear programming to determine an “efficient frontier” composed of a collection of DMUs that show the best performance in terms of efficiency. Then, the efficiency scores of the other non-frontier DMUs are determined by the distance to the DMUs on the frontier.
There are various types of DEA models, but two models, including constant returns-to-scale (CRS) model and variable returns-to-scale (VRS) model, are among the most commonly used models. The CRS model is also called as CCR model after the name of three authors Charnes, Cooper, and Rhodes. [15]. In the CCR model, there is an assumption that the ratio of output to input is constant over any interval. The VRS model assumes that the ratios of output to input varies with size, and is also called as BCC after the first letters of three authors of Banker, Charnes, and Cooper [16].
The following equation shows the output-oriented CCR model. Assuming that there are a total of J DMUs, m inputs x i j ( i = 1 , , m ) , and n outputs y r j ( r = 1 , , n ) ,
m a x   ϕ k + ϵ ( i = 1 m s i + r = 1 n s r + ) s . t .   j = 1 J x i j λ j + s i = x i k ,   i = 1 ,   ,   m j = 1 J y r j λ j s r + = ϕ k y r k ,   r = 1 ,   , n λ j ,   s i ,   s r + 0 ,     i ,   j ,   r
Here, ϕ k ( k = 1 , , J ) is the efficiency value of the kth DMUk, and s i and s r + represent input and output slack variables, respectively.
The equation below shows the output-oriented BCC model. It has a constraint on the sum of λ in the CCR model of equation to have convexity constraints.
m a x   ϕ k + ϵ ( i = 1 m s i + r = 1 n s r + ) s . t .   j = 1 J x i j λ j + s i = x i k ,   i = 1 ,   ,   m j = 1 J y r j λ j s r + = ϕ k y r k ,   r = 1 ,   , n j = 1 J λ j = 1 λ j ,   s i ,   s r + 0 ,     i ,   j ,   r
The efficiency of DEA is based on technical efficiency (TE). Technical efficiency can be obtained when a DMU produces at a technically efficient level of output. Technical efficiency is a multiple of Pure Technical Efficiency (PTE) and Scale Efficiency (SE), which are indicators for evaluating the ability to convert input into output in the production process.
The relationships between TE, PTE, and SE can be shown in Figure 1. As in Figure 1, given the five DMUs (a, b, c, d, and e), the area below o h ¯ represents the set of producibility under the assumption of constant returns to scale (CRS), and the area below d c a ^ represents the set of manufacturability under the assumption of variable returns to scale (VRS). The technical efficiency of DMU e can be evaluated as TE = fg ¯ / fe ¯ . Since fg ¯ is smaller than fe ¯ , the TE of DMU e becomes smaller than 1. Thus, DMU e is inefficient under the assumption of CRS. The PTE of DMU e can be measured as the ratio of fc ¯ to fe ¯ , where c is on the frontier under VRS. Thus, the scale efficiency, SE can be obtained as SE = TE/PTE = fg ¯ / fc ¯ . If SE is 1, DMU e can be evaluated as efficient in scale, whereas when it is smaller than 1, DMU e is uneconomical in scale.
The CRS and VRS models that are mentioned above are one of the most basic and widely used models in DEA. These models are radial because they reduce the input or output at the same rate when searching for efficiency frontiers. However, this model does not include the slack in the efficiency calculation, thereby distorting the measured value. The DEA-SBM (Slacks-based measure) is the model to overcome this problem [17]. The DEA-SBM finds efficiency points that maximize the output, while reducing input from the DMU to be monitored and obtains efficiency as an improved rate that is relative to the original input or output. Therefore, there is a feature that does not have specific directionality, such as input or output orientation. Also, the DMU with an efficiency score of 1 in the SBM has 1 in the VRS model, but the inverse is not always established. In the VRS model, the efficiency score is 1, even for the weakly efficient DMU, but it appears to be inefficient in the SBM.
Assuming that there are J DMUs, M input resources, and N output variables, the formula of SBM model is as follows [18].
θ k * = m i n ( 1 M m = 1 M x m k s m x m k ) / ( 1 N n = 1 N y n k s n + y n k )
Subject to
x m k = j = 1 J x m j λ j + s m   ( m = 1 , 2 , , M ) y n k = j = 1 J y n j λ j s n +   ( n = 1 , 2 , , N ) j = 1 J λ j = 1 λ j 0   ( j = 1 , 2 , , J ) s m 0   ( m = 1 , 2 , , M ) s n + 0   ( n = 1 , 2 , , N )
Here, θ k * has a value between 0 and 1, and the closer to 1, the more efficient it can be.

2.2. Bank Efficiency Using DEA

Sherman and Gold [19] used the DEA model to evaluate the relative efficiency of banks. As a result of analyzing 14 branches of the United States (US) savings bank, it is found that the evaluation of bank efficiency by DEA method can provide more information than by the simple financial figures. Wei and Wang [20] studied the efficiency of banks in China. In their study, the TE, PTE, and SE of four state-owned commercial banks and eight private commercial banks of China using the statistical data of 1997 were measured. A comparison of the efficiency of state-owned commercial banks and commercial banks shows that the efficiency of private commercial banks is higher. Unlike Wei and Wang [20], who analyzed the efficiency of Chinese commercial banks in 1997, Huang [21] analyzed the efficiency of 15 commercial banks in China, including 11 private commercial banks and four state-owned commercial banks for 11 years from 1990. As a result of the measure of efficiency, the efficiency of most state-owned commercial banks is usually distributed in the middle level, while the efficiency of private commercial banks is highly polarized. As a result, it is concluded that either the state-owned commercial banks or the private commercial banks are not absolutely superior in terms of efficiency. Li [22] evaluated the efficiency of the last four years from 2000 to 2003, with 14 commercial banks in China. The results show that the average efficiency of state-owned commercial banks is lower than that of private commercial banks, and that the main reason is the lack of operational capability.
Hwang [23] attempted to grasp the efficiency of four state-owned commercial banks and ten private commercial banks according to the periods from 2002 to 2006. As a result of DEA analysis, the efficiency of commercial banks was higher than that of state-owned commercial banks until 2003. After 2004, the efficiency of state-owned commercial banks exceeded the efficiency of private commercial banks. These results suggest that the restructuring of Chinese state-owned commercial banks has some positive effects on bank efficiency. Oh [24] evaluated the relative efficiency of the 14 commercial banks in China from 1998 to 2006. As a result of the evaluation, He found that profit efficiency is higher than growth efficiency, and that efficiency in creating interest income as compared to input cost between leading bank and rest of bank is not significantly different. Bao and Jiang [25] evaluated the relative efficiency of the year 2008 for 14 Chinese commercial banks. As a result of the analysis using DEA method, most of the branches of commercial banks have almost a similar degree of efficiency. The other prior research is summarized in Table 1.

2.3. Bank Service Quality and Customer Satisfaction

As the definition of service varies, the quality of service is also defined in various ways according to research perspectives. Gronroos [37] argued that service quality is a combination of outcome quality and process quality, and the process of evaluating service quality depends on how the services are delivered. In 1985, Parasuraman, Zeithaml and Berry (PZB) [38] proposed SERVQUAL model that defines service quality as the difference between expected and perceived performance. The SERVQUAL model assesses service quality as a difference between customer expectations and perceptions of 22 items in five dimensions including tangibility, reliability, responsiveness, certainty, and empathy, and is most widely used for measuring service quality in service industries, including banking. Cowling and Newman [39] found that the SERVQUAL model was the most reliable, responsive, and empathic in evaluating the service quality of banks. Wang et al. [40] studied the distinction between service quality and product quality in the Chinese banking context. They conducted a survey to analyze the five antecedents of service quality and product quality, as well as their different impacts on the establishment of a positive reputation of bank. As a result, they suggested that managers can benefit by acknowledging the distinction between services and products, as well as the different impacts on the establishment of bank reputation.
In addition, with the increasingly importance of service quality, the specific roles of service quality in customers’ visiting and revisiting decisions should be investigated. Zhou [6] used the SERVQUAL model to examine the relationship between service quality and customer satisfaction in retail banking in China. As a result of the study, it is concluded that customer satisfaction is most influenced by reliability, tangibility, and empathy. In addition, he argued for the necessity of in-depth study on the service quality of the Chinese banking industry. Kim [41] used SERVQUAL model to evaluate the service quality of banks in Korea and China and compare the factors affecting customer satisfaction. As a result of the analysis, it is found that there are some differences in the factors of service quality that are affecting customer satisfaction. China has become more influential in customer satisfaction in the order of responsiveness, tangibility, reliability, and empathy, while Korea has been in the order of reliability, empathy, and assurance.
As we have seen in the preceding studies, the research on efficiency and service quality of commercial banks in China has been tried from various angles. However, there is little research on an integrated framework of the relationship between efficiency, service quality, and customer satisfaction. Therefore, it is of great significance to study the relationship between the efficiency and service quality of commercial banks in China.

3. Research Method

3.1. Input and Output Selection

The choice of input and output variables in the DEA study has a significant effect on the efficiency results [42]. Therefore, it is important to select the appropriate variables to better reflect the business purpose and banking system of Chinese commercial bank. In previous studies measuring bank efficiency, it is found that there is consensus on the use of variables, except for deposits [36,43]. In other words, the number of employees and fixed assets are commonly used as input variables, and interest income and non-interest income are used as output variables. There is a debate in the literature about whether deposits should be used as input or as output variables of banking system [43]. In measuring the efficiency of a bank, deposits are considered as output when production efficiency is considered as a critical dimension of performance. That is to say, from this point of view, banks are seen as service producers using employees or other physical resources. If intermediation efficiency is considered, then the bank’s lending ability is emphasized. In this case, deposits are considered as an input variable. That is, the bank’s intermediation efficiency can be measured by how efficient the bank is in encouraging deposits and other forms of funds from customers, and then lending them in forms of loans and other assets. Since this study is intended to examine the bank’s intermediary role, deposits are considered as an input variable. Therefore, in this study, three input variables and two output variables that are commonly used in previous studies measuring bank efficiency are finally selected as in Table 2. The three input variables are the number of employees, fixed assets, and deposits. The two output variables are composed of interest income and non-interest income. The number of employees refers to employed full-time employees. Fixed asset represents the asset value of physical capital. On the other hand, as the output variable, interest income mainly refers to income from loans. Non-interest income refers to commissions, fees, investments or other business income.

3.2. Data Collection

The purpose of this study is to measure and analyze the efficiency of 20 state-owned commercial banks in China. We also examine the relationship between bank efficiency, service quality, and customer satisfaction. To this end, we used data of 12 state-owned commercial banks of five regions in China in 2015 Annual Report [44]. As shown in Table 3, DMU1, DMU2, DMU3, and DMU4 are the state-owned commercial banks of Shanghai and four DMUs including DMU5, DMU6, DMU7, and DMU8 are from Hebei Province. DMU9, DMU10, DMU11, and DMU12 are located in Beijing City. DMU13 to DMU 16 belong to the Henan Province and DMU17 to DMU20 are located in Shandong Province. Among them, Shanghai and Shandong are in the eastern part, Hebei and Henan are in the central area, and Beijing is in the northern part of China.
The service quality and customer satisfaction of the bank were surveyed. The service quality was measured by the SERVQUAL model with five dimensions, including tangibility, reliability, reactivity, certainty, and empathy. The survey was conducted from 1 April 2016 to 30 April 2016 for customers who have experienced the services of one of the 12 state-owned commercial banks, and a total of 300 respondents were answered. Of the collected responses, 286 were used for the final analysis, except for 32 responses, which were not responded in a satisfactory manner. The results of the survey are shown in Table 4.

4. Results

4.1. Relative Efficiencies of the Banks

The results of the analysis of the efficiency of 20 branches of state-owned commercial banks in China using the DEA-SBM are shown in Table 5. CRS in the second column shows technical efficiency, VRS in the third column is pure technology efficiency, and SE in the fourth column represents scale efficiency. The fifth column shows the profitability of the scale. SBM CRS and SBM VRS in the sixth and seventh columns are obtained from DEA-SBM, respectively. The IRS stands for the increasing return to scale and the CRS in the fifth column means the constant return to scale. A DMU is considered to be in IRS if a greater proportionate increase in its outputs is generated than a proportionate increase in all of its inputs. Therefore, in the case of a DMU in IRS, it is better to increase the scale. CRS means that a proportionate increase in all of its inputs results in the same proportionate increase in its outputs. If a DMU is in CRS, no gain or loss is expected by increasing or decreasing the scale.
From the results of the DEA-SBM, it is known that efficient banks with 100% technical efficiency account for 30% of the 20 bank branches and the average efficiency score of 20 banks is 0.75. In the SBM VRS model, we can see that seven banks are efficient in terms of pure technical efficiency and account for 35% of the total 20 banks. The average efficiency score of the 20 banks is as high as 0.82. From these results, the scale efficiency can be obtained. That is, SE = CRS/VRS. Based on this relationship, it is possible to determine whether the ineffective cause of the decision unit is from the technical side or from the scale side, and can provide a direction for improving the efficiency.
From the results, it is known that six banks, including DMU1, DMU2, DMU9, DMU12, DMU18, and DMU20 are efficient from the technical and scale perspectives and are in SBM CRS. Among them, DMU1 and DMU2 belong to Shanghai. DMU9 and DMU12 are located in Beijing. DMU18 and DMU20 belong to Shandong. DMU7 in Hebei has 100% pure technical efficiency, but it is inefficient in terms of scale. The remaining banks are not efficient from the technical and scale perspectives, and therefore there is a need to improve the efficiency on both sides.

4.2. Efficiency and Service Quality

This study aims to improve the competitiveness and maintain high profitability through the enhancement of bank efficiency. Thus, it is important to identify the factors affecting efficiency of DMUs. For this, regression analysis was conducted to analyze the cause of efficiency, measured by DEA. In this study, hypothesis H1 is established that the service quality of bank will affect the efficiency based on the prior research that efficiency can be improved through quality improvement [11].
Hypothesis 1 (H1).
The bank’s service quality will have a positive (+) effect on efficiency.
Regression analysis was conducted to verify the hypothesis. The results of the analysis are shown in Table 6. Hypothesis H1 that bank service quality has a positive effect on efficiency is statistically significant at the 6% significance level. As a result, hypothesis H1 is accepted. This means that the higher the service quality of the bank, the higher the efficiency.

4.3. Customer Satisfaction Analysis

The financial industry recognizes the importance of the customer, sees the customer service as the core competence of the industry, and recognizes the customer satisfaction as the highest value of management [45,46]. Parasuraman et al. [47] reported that the higher the perceived quality of service, the higher the customer satisfaction. Heskett et al. [48] also argued that high service quality affects customer value and customer satisfaction, and, moreover, customer satisfaction directly affects customer loyalty. Thus, based on these, the hypothesis H2 is established as follows.
Hypothesis 2 (H2).
The bank’s service quality will have a positive effect on customer satisfaction.
As a second variable, the technical efficiency measured by DEA can be considered. The higher the efficiency of the lending and depositing business, the lower the service processing time and costs, and the higher the satisfaction of the customer. Therefore, the hypothesis H3 is set as follows.
Hypothesis 3 (H3).
Bank efficiency will have a positive effect on customer satisfaction.
Regression analysis is conducted to verify these hypotheses. As shown in Table 7, service quality gives a statistically significant impact on customer satisfaction at the 1% significance level, and, therefore, hypothesis H2 is accepted. In addition, the efficiency of banks has a statistically significant effect on customer satisfaction at the significance level of 5%. Hypothesis H3 is also accepted. This implies that the higher the service quality and efficiency of the bank, the higher the customer’s satisfaction with the bank [49,50,51,52].

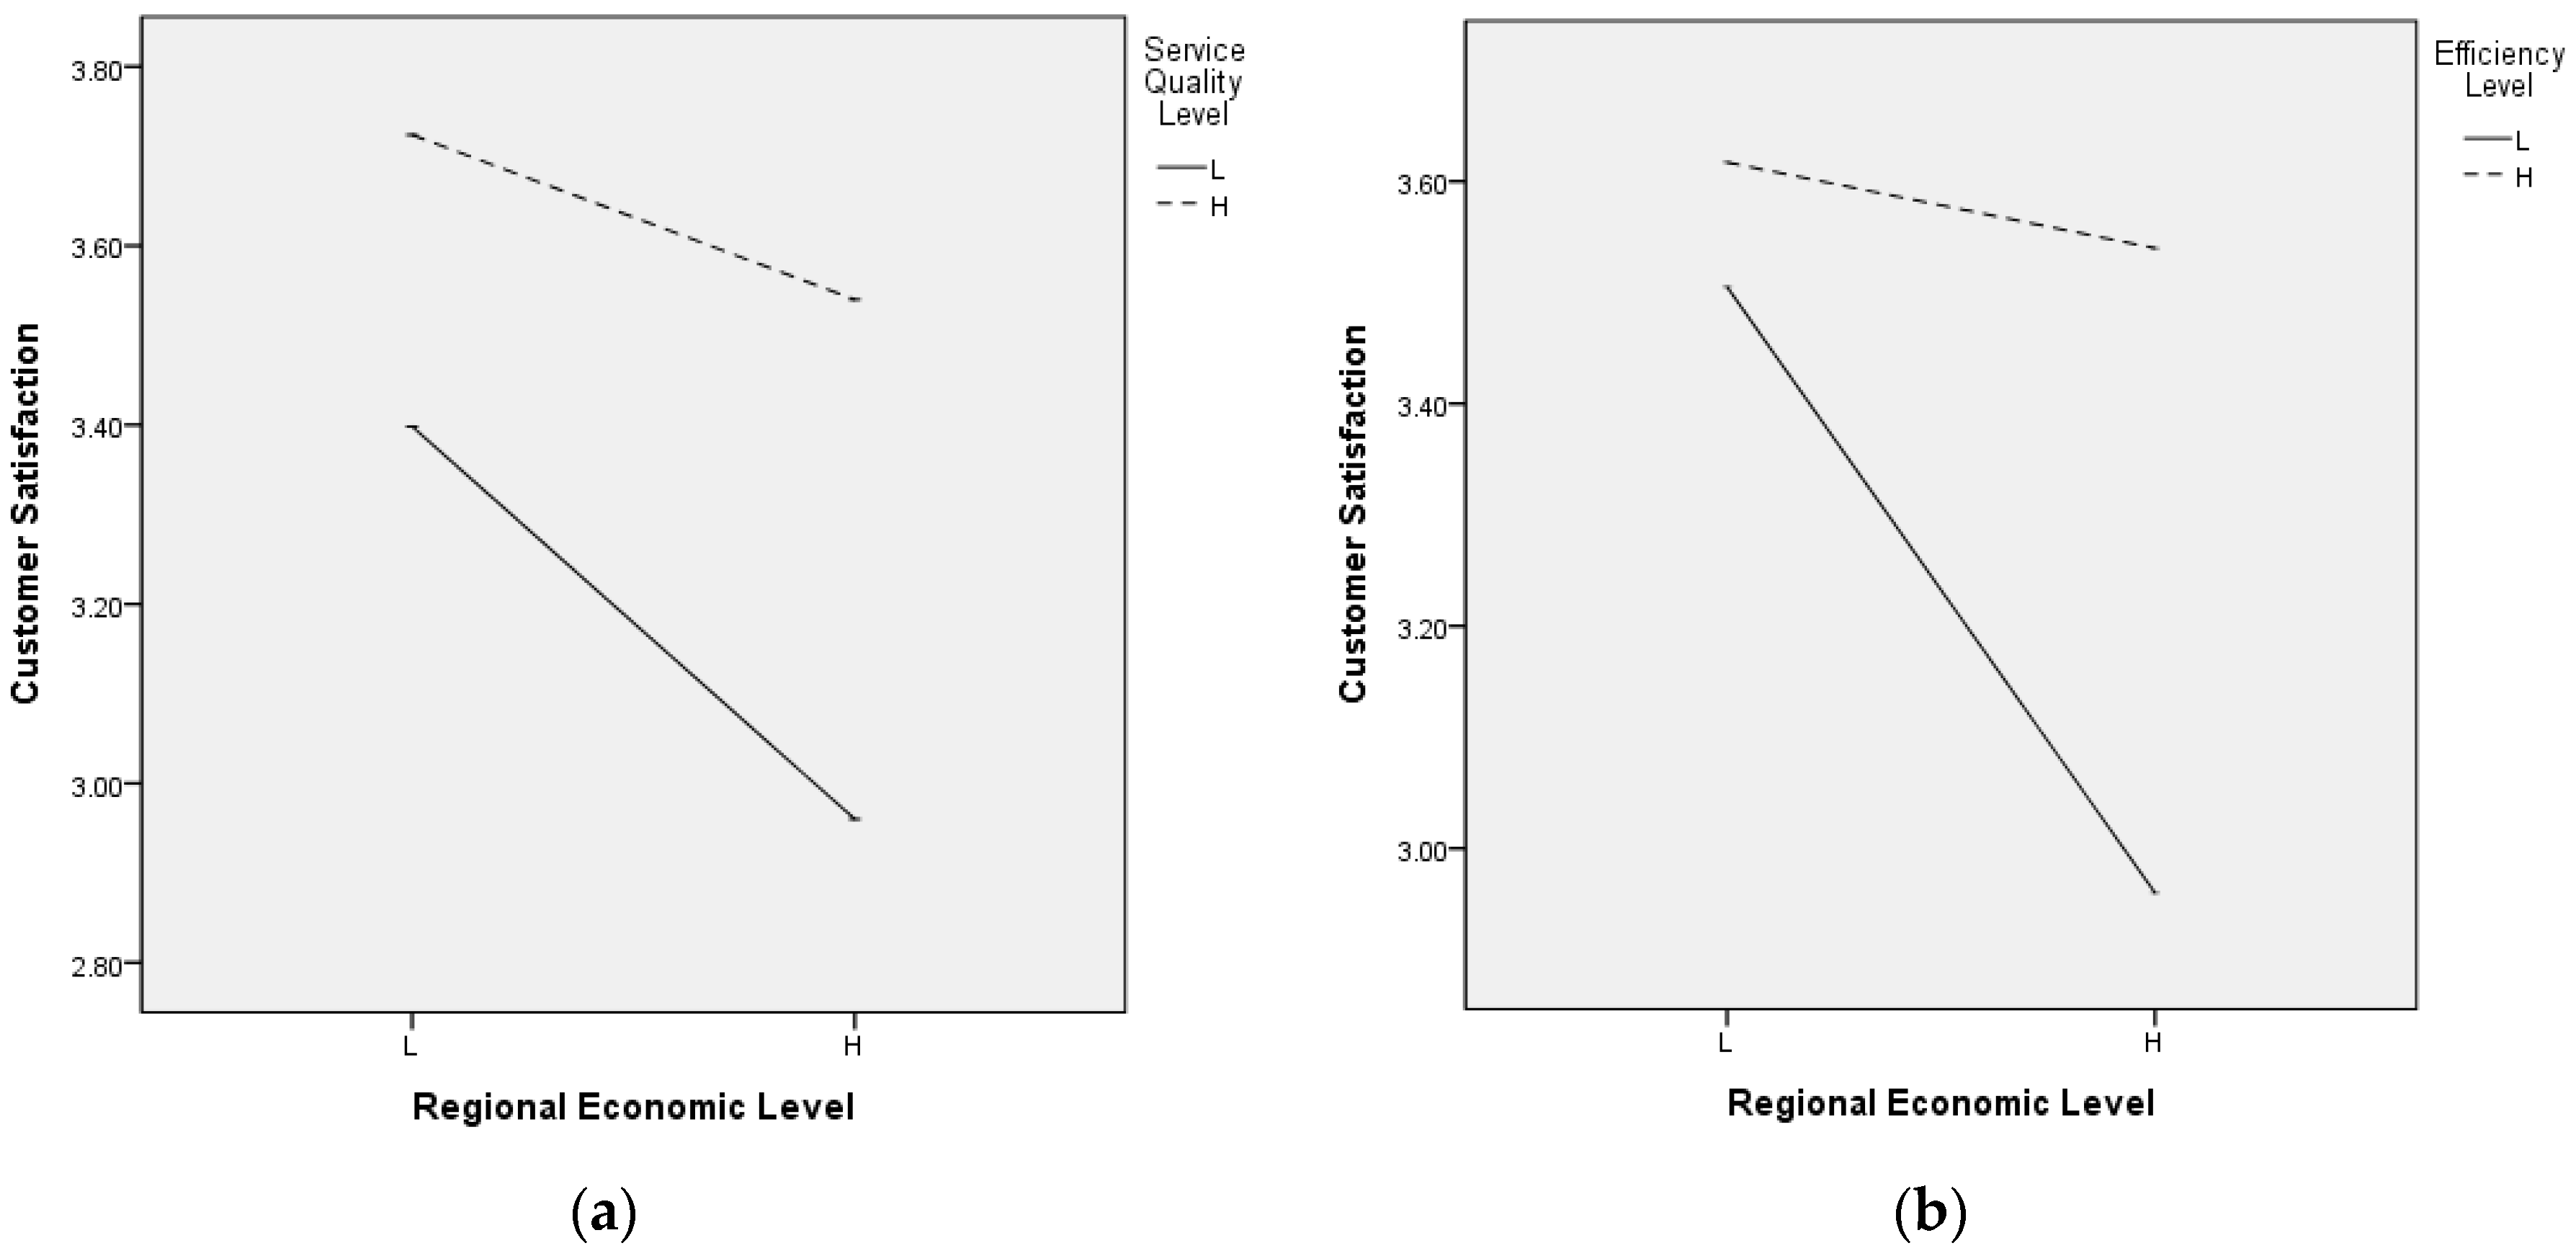
4.4. Relationship between Service Quality, Efficiency and Customer Satisfaction with Respect to Regional Economic Level

Based on previous study of Zhou [6], that the local financial development is influenced by regional economic development level, we examine the relationship between service quality and efficiency and customer satisfaction according to the level of economic development in the region where banks are located. For the analysis, the economic level of the region was classified into two groups (H, L). The criterion that as used for classification is Gross Regional Domestic Product (GRDP) of five regions in 2015, as extracted from the National Bureau of Statistics of China, as shown in Table 8. Based on this, two banks of DMU11 and DMU12 in Henan and Shandong belong to high economic development group (H), and the remaining ten banks in Shanghai, Hebei, and Beijing belong to low economic development group (L).
The effects of service quality and efficiency according to economic development level of region on customer satisfaction are analyzed. The result of the analysis is shown in Figure 2. Figure 2a shows the effect of the service quality on customer satisfaction according to the regional economy level. In Figure 2b, the effect of the efficiency on customer satisfaction according to the regional economic level.
In the case of banks that are located in the areas of high economic levels, customer satisfaction is lower than that of banks in lower economic level regions. Customers in high economic level regions have higher expectations for service quality, leading to lower customer satisfaction. According to Anderson et al. [53] who studied customer characteristics on service satisfaction, high-income customers have high expectations for service quality because they value service quality very seriously. Therefore, they are not easily satisfied with the services.
In addition, from Figure 2a, it can be seen that the difference of customer satisfaction between bank with high service quality level and low bank is higher in regions with a high level of regional economic development. As in Figure 2a, Figure 2b also shows that the difference in customer satisfaction between banks with higher efficiency levels and those with lower efficiency are greater in regions with high levels of regional economic development. From these results, it can be seen that it is much more difficult to satisfy customers in high economic level regions than in lower level regions because the service expectation level of customers in high economic level regions is higher than that of low level regions. Especially, when the bank’s service quality and efficiency are low, customer satisfaction is much lower in regions with high economic development level than in regions where regional economic development level is low.
As a result of analyzing customer satisfaction according to local economy level, it can be seen that customers of banks located in a region with higher economic development level are more sensitive to the level of service quality and efficiency than customers in a lower economic level region. In other words, banking customers in high-level regions are more likely and more careful to evaluate the service quality and efficiency of the bank than those in the low-end region. Therefore, if the local economy level is high, banks need to make much efforts to raise the level of service quality and efficiency for customer satisfaction.

5. Conclusions

In this study, we used the DEA-SBM to measure the relative efficiency of twenty state-owned commercial banks in five regions of China and analyzed the relationship between bank efficiency, service quality, and customer satisfaction. The summary and implications of the analysis are as follows.
First, the average technical efficiency of 20 state-owned commercial banks is 0.75. Six banks are efficient with TE = 1, and the rest of the banks are inefficient as the loan amount is insufficient when compared to the amount of deposit received. In addition, inefficiency was found due to an excessive number of employees. Therefore, inefficient banks can be improved by reducing the amount of input, such as excessive manpower. However, due to the nature of state-owned banks, it is difficult to flexibly adjust the input factors, which may result in distorting the functions and roles of banks. Therefore, it is more desirable to seek ways to improve the output by increasing the loan size. The lending business is the most important means of generating bank profits. However, the lending business of state-owned commercial banks in China is limited to real estate loans. This deteriorates the quality of credit loans and increases risk, which can lead to an accumulation of bad debts by banks. Therefore, it is necessary to expand the scope of lending and loans to various areas, and introduce a risk management system.
Second, as a result of analyzing the factors affecting efficiency, service quality has a statistically positive (+) effect on the efficiency at the 6% significance level, which means that the higher the service quality, the higher the efficiency. In addition, the results of customer satisfaction analysis showed that service quality had a positive effect on customer satisfaction at the 1% significance level and on efficiency at the 5% significance level. That is, the higher the service quality and the efficiency, the higher the customer satisfaction. In this context, in an environment where competition is highly intensifying, banks should improve service quality and efficiency in order to gain competitive advantage.
Third, we examined the effect of regional economic development on customer satisfaction. As a result, the satisfaction level of regions with high economic development level was lower than that of low level regions. Also, where the level of regional economic development is high, there is a big difference in customer satisfaction with between banks with low service quality and efficiency level and the banks with high service quality and efficiency. As a result, it can be seen that customers in regions with high economic level are more sensitive to the level of service quality and efficiency. Therefore, banks located in areas with high economic development level need to strive to raise the level of service quality and efficiency in order to satisfy customers.
The major contribution of this study is to examine the efficiency and service quality of state-owned commercial banks in five regions of China and to examine the factors that affect the efficiency and customer satisfaction through empirical analysis. This suggests a substantial implication for the importance of improving the efficiency and service quality of banks in China. However, since the data samples that were used for the analysis are small, there is a limitation in that they may not fully reflect the situation and the characteristics of banks in each region. Therefore, in the next study, it is desirable to obtain more comprehensive and generalized results based on sufficient data in each region. Another possible future contribution is the implementation of advanced methodologies of DEA to further develop this proposed area of research.

Author Contributions

M.C., Y.L. and D.K. developed the concept and wrote the paper. H.J. and Y.L. mainly designed and performed the in-depth analysis of significant variables.

Conflicts of Interest

The authors declare no conflict of interest.

References

  1. Cho, G.W. A Study on the Reform of the Stocks of State-Owned Commercial Banks in China. Master’s Thesis, Pukyong National University, Busan, Korea, 2007. [Google Scholar]
  2. Gupta, A.; Dey, A.; Singh, G. Commenting corporations and communities: Towards a theory of social inclusive open innovation. J. Open Innov. Technol. Market Complex. 2017, 3, 17. [Google Scholar] [CrossRef]
  3. Han, J. Exploitation of architectural knowledge and innovation. J. Open Innov. Technol. Market Complex. 2017, 3, 15. [Google Scholar]
  4. Park, C.I. Development of China’s financial system in response to economic growth. Foreign Econ. Stud. 2003, 7, 29–63. [Google Scholar]
  5. Cooke, P. Complex spaces: Global innovation networks & territorial innovation systems in Fl formation & communication technologies. J. Open Innov. Technol. Market Complex. 2017, 3, 9. [Google Scholar]
  6. Zhou, L.X. A Dimension-specific Analysis of Performance-only Measurement of Service Quality and Satisfaction in China’s Retail Banking. J. Serv. Mark. 2004, 18, 534–546. [Google Scholar]
  7. Durusu-Ciftci, D.; Ispir, M.S.; Yetkiner, H. Financial development and economic growth: Some theory and more evidence. J. Policy Model. 2017, 39, 290–306. [Google Scholar] [CrossRef]
  8. Duncan, E.; Elliot, G. Customer Service Quality and Financial Performance among Australian Retail Financial Institutions. J. Financ. Serv. Mark. 2002, 7, 25–41. [Google Scholar]
  9. Levesque, T.; McDougall, G.H.G. Determinants of Customer Satisfaction on Retail Banking. Int. J. Bank. Mark. 1996, 14, 12–20. [Google Scholar] [CrossRef]
  10. Je, H.G.; Cho, D.W. A comparative analysis of the efficiency of Chinese commercial banks before and after joining the WTO. Int. Manag. Stud. 2007, 18, 27–52. [Google Scholar]
  11. Rust, R.T.; Zahorik, A.J.; Keiningham, T.L. Return on Quality: Measuring the Financial Impact of Your Company’s Quest for Quality; Probus Professional Pub.: Chicago, IL, USA, 1994. [Google Scholar]
  12. Gummesson, E. Productivity, Quality and Relationship Marketing in Service Operations. Int. J. Contemp. Hosp. Manag. 1998, 10, 4–15. [Google Scholar] [CrossRef]
  13. Yun, J.; Won, D.; Park, K. Dynamics from open innovation to evolutionary change. J. Open Innov. Technol. Market Complex. 2016, 2, 1–22. [Google Scholar] [CrossRef]
  14. Yun, J. How do we conquer the growth limits of capitalism? Schumpeterian dynamics of open innovation? J. Open Innov. Technol. Market Complex. 2015, 1, 1–20. [Google Scholar] [CrossRef]
  15. Charnes, A.; Cooper, W.W.; Rhodes, E. Measuring the efficiency of decision making units. Eur. J. Oper. Res. 1978, 2, 429–444. [Google Scholar] [CrossRef]
  16. Banker, R.D.; Charnes, A.; Cooper, W.W. Some Models for Estimation Technical and Scale Inefficiencies in Data Envelopment Analysis. Manag. Sci. 1984, 30, 1078–1092. [Google Scholar] [CrossRef]
  17. Tone, K. A slack-based measure of efficiency in data envelopment analysis. Eur. J. Oper. Res. 2001, 130, 498–509. [Google Scholar] [CrossRef]
  18. Park, C.M.; Kim, T.S. A Study on the Efficiency of Logistics Industry in Korea using DEA-SBM. Korean J. Logist. 2014, 22, 26–46. [Google Scholar]
  19. Sherman, H.D.; Gold, F. Bank Branch Operating Efficiency: Evaluation with Data Envelopment Analysis. J. Bank. Financ. 1985, 9, 297–315. [Google Scholar] [CrossRef]
  20. Wèi, Y.; Wáng, L. A Study on the Efficiency of Chinese Commercial Banks: A Non-Participatory Analysis. Financ. Res. 2000, 3, 88–96. [Google Scholar]
  21. Huáng, Q. A Study on the Effectiveness and Differentiation of Chinese Commercial Banks; Jinqing Economic Research Institute, Xi’an Jiaotong University: Xi’an, China, 2004. [Google Scholar]
  22. Lĭ, N. Research on Performance Evaluation of China’s Commercial Banks Based on DEA; Dalian Maritime University: Dalian, China, 2006. [Google Scholar]
  23. Hwang, R.H. Analysis of Commercial Bank Efficiency in China Using Directional Production Distance Function. Master’s Thesis, Inha University, Nam-gu, Korea, 2008. [Google Scholar]
  24. Oh, D.W. China’s Financial Reform and Changes in Banking Productivity. Bank Korea 2008, 14, 101–137. [Google Scholar]
  25. Bao, J.H.; Jiang, T. An Analysis of the Efficiency of China’s Listed Commercial Banks. Theor. Res. 2010, 405, 22–25. [Google Scholar]
  26. Soteriou, A.C.; Zenios, S.A. Using data envelopment analysis for costing bank products. Eur. J. Oper. Res. 1999, 114, 234–248. [Google Scholar] [CrossRef]
  27. Weill, L. Measuring cost efficiency in European banking: A comparison of frontier techniques. J. Product. Anal. 2004, 21, 133–152. [Google Scholar] [CrossRef]
  28. Xiaogang, C.; Skully, M.; Brown, K. Banking efficiency in China: Application of DEA to pre-and post-deregulation eras: 1993–2000. China Econ. Rev. 2005, 16, 229–245. [Google Scholar]
  29. Camanho, A.S.; Dyson, R.G. Data envelopment analysis and Malmquist indices for measuring group performance. J. Product. Anal. 2006, 26, 35–49. [Google Scholar] [CrossRef]
  30. Wu, D.D.; Yang, Z.; Liang, L. Efficiency analysis of cross-region bank branches using fuzzy data envelopment analysis. Appl. Math. Comput. 2006, 181, 271–281. [Google Scholar] [CrossRef]
  31. Ariff, M.; Luc, C. Cost and profit efficiency of Chinese banks: A non-parametric analysis. China Econ. Rev. 2008, 19, 260–273. [Google Scholar] [CrossRef]
  32. Yao, S.; Han, Z.; Feng, G. Ownership Reform, Foreign Competition and Efficiency of Chinese Commercial Banks: A Non-parametric Approach. World Econ. 2008, 31, 1310–1326. [Google Scholar] [CrossRef]
  33. Thoraneenitiyan, N.; Avkiran, N.K. Measuring the impact of restructuring and country-specific factors on the efficiency of post-crisis East Asian banking systems: Integrating DEA with SFA. Socio-Econ. Plan. Sci. 2009, 43, 240–252. [Google Scholar] [CrossRef]
  34. Matthews, K.; Zhang, N.X. Bank productivity in China 1997–2007: Measurement and convergence. China Econ. Rev. 2010, 21, 617–628. [Google Scholar] [CrossRef]
  35. Fung, M.K.; Leung, M.K. X-Efficiency and Convergence of Productivity among the National Commercial Banks in China. 2011. Available online: www.ceauk.org.uk/2008-conference-papers/X-efficiency-MK_Leung%26Mike_Fung_HKPolyU.doc (accessed on 22 November 2017).
  36. Wang, K.; Huang, W.; Wu, J.; Liu, Y.N. Efficiency measures of the Chinese commercial banking system using an additive two-stage DEA. Omega 2014, 44, 5–20. [Google Scholar] [CrossRef]
  37. Gronroos, C. A Service Quality Model and its Marketing Implications. Eur. J. Mark. 1984, 18, 36–44. [Google Scholar] [CrossRef]
  38. Parasuraman, A.; Zeithaml, V.A.; Berry, L.L. A Conceptual Model of Service Quality and Its Implications for Future Research. J. Mark. 1985, 49, 41–50. [Google Scholar] [CrossRef]
  39. Cowling, A.; Newman, K. Banking on People: TQM, Service Quality and Human Resources. Pers. Rev. 1995, 24, 25–40. [Google Scholar] [CrossRef]
  40. Wang, Y.G.; Lo, H.P.; Hui, Y.V. The antecedents of service quality and product quality and their influences on bank reputation: Evidence from the banking industry in China. Manag. Serv. Qual. Int. J. 2003, 13, 72–83. [Google Scholar] [CrossRef]
  41. Kim, M.H. A Comparative Study on the Banking Service Quality between Korea and China: Based on the Traditional Banking Service and the Internet Banking Service. Ph.D. Thesis, Keimyung University, Daegu, Korea, 2005. [Google Scholar]
  42. Fethi, M.D.; Pasiouras, F. Assessing bank efficiency and performance with operational research and artificial intelligence techniques: A survey. Eur. J. Oper. Res. 2010, 204, 189–198. [Google Scholar] [CrossRef]
  43. Paradi, J.C.; Zhu, H. A survey on bank branch efficiency and performance research with data envelopment analysis. Omega 2013, 41, 61–79. [Google Scholar] [CrossRef]
  44. CBRC. China Banking Regulatory Commission Annual Report 2015; China Financial Publishing House: Beijing, China, 2015. [Google Scholar]
  45. Lee, S.S. A Study on the Relationship between Service Quality, Customer Satisfaction and Cross-purchase Intention in Bank Service; Korea and China. J. Bus. Manag. 2012, 41, 83–106. [Google Scholar]
  46. Witt, U. Capitalism as a complex adaptive system and its growth. J. Open Innov. Technol. Market Complex. 2017, 3, 1–15. [Google Scholar] [CrossRef]
  47. Parasuraman, A.; Zeithaml, V.A.; Berry, L.L. Servqual. J. Retail. 1988, 64, 12–37. [Google Scholar]
  48. Heskett, J.L.; Sasser, W.E., Jr.; Schlesinger, L.A. The Service Profit Chain: How Leading Companies Link Profit to Loyalty, Satisfaction, and Value; Free Press: New York, NY, USA, 1997. [Google Scholar]
  49. Leydesdorff, L.; Ivanova, I. Open Innovation and triple helix models of innovation: Can synergy in innovation systems be measured? J. Open Innov. Technol. Market Complex. 2016, 2, 11. [Google Scholar] [CrossRef]
  50. Schiuma, G.; Lerro, A. The business model prism: managing and innovating business models of arts and cultural organization. J. Open Innov. Technol. Market Complex. 2017, 3, 1–13. [Google Scholar] [CrossRef]
  51. Hwang, B.Y.; Jun, H.J.; Chang, M.H.; Kim, D.C. A case study on the improvement of institution of high-risk high return R&D in Korea. J. Open Innov. Technol. Market Complex. 2017, 3, 19. [Google Scholar]
  52. Schiuma, G. Arts catalyst of creative organizations for the fourth industrial revolution. J. Open Innov. Technol. Market Complex. 2017, 3, 20. [Google Scholar] [CrossRef]
  53. Anderson, S.; Pearo, S.K.; Widener, S.K. Drivers of Service Satisfaction: Linking Customer Satisfaction to the Service Concept and Customer Characteristics. J. Serv. Res. 2008, 10, 365–381. [Google Scholar] [CrossRef]
Figure 1. Measurement of technical efficiency, pure technical efficiency, and scale efficiency.
Sustainability 09 02163 g001
Figure 2. Customer satisfaction according to regional economic level. (a) The effect of the service quality on customer satisfaction; (b) The effect of the efficiency on customer satisfaction.
Sustainability 09 02163 g002
Table 1. Summary of prior research on banks.
AuthorDMUInputOutputModelObjectives
Soteriou and Zenios [26]67 Cyprian bankstotal branch costforeign currency accounts, interbranch transactions, current and saving accounts, credit accounts, loan initializations, loan renewalsDEAPresent a method for providing efficient and reliable cost estimates of bank products at the branch level, based on the non-parametric benchmarking technique
Weill [27]688 European bankspersonnel expenses, other non-interest expenses, interest paidloans, investment assetsDEA
SFA
DFA
Analyze the robustness of the frontier approaches applied in banking on five European banking sectors
Xiaogang et al. [28]43 Chinese banksinterest expenses, non-interest expenses, price of capitalloans, deposits, non-interest incomeDEAIdentify the change in Chinese banks’ efficiency following the program of deregulation initiate by the government in 1995
Camanho and Dyson [29]144 Portuguses banksnumber of employees, operational costsdeposits, loans, total value of off balance sheet business, number of general service transactionsDEA MalmquistIdentify the best performing schemes for bank branch business, both in terms of managerial strategies and environmental conditions
Wu et al. [30]808 bank branches
(Ontario, Quebec, and Alberta)
financial inputs: personnel, equipment, occupancy, other expenses
environmental inputs: income level, population, density, economy
mortgage, non-term deposit, term deposit, personal loans, small business loan, SLOCDEAAccess the performance of bank branches from different regions using the fuzzy logic into DEA to deal with the environment variables
Je and Cho [10]75 Chinese banksnumber of employees, fixed assets, stockholder’s equityloans, operating profitDEACompare efficiency of Chinese banks before and after joining the WTO
Ariff and Luc [31]28 Chinese bankstotal loanable funds, number of employees, physical capitaltotal loans, investmentsDEAInvestigate the cost and profit efficiency of Chinese banks using a non-parametric approach and sources of bank efficiency using tobit regressions
Yao et al. [32]15 Chinese banksinterest expenses, non-interest expenses, asset qualityinterest income, non-interest incomeDEAAnalyze whether ownership reform and foreign competition improve efficiency of Chinese banks during 1998–2005
Thoraneen-itiyan and Avkiran [33]110 Asian banks (Indonesia, South Korea, Thailand, Malaysia, and Philippines)total deposits, labor capital, physical capitalloans, investments and other earning assets, fee income, off-balance sheet itemsSBM-DEA
SFA
Investigate the relationship between post-crisis bank restructuring, country-specific conditions and bank efficiency in Asian Countries from 1997 to 2001
Matthews and Zhang [34]314 Chinese banksm1: deposits, overheads, fixed assets
m2: deposits, overheads, fixed assets
m3: overheads, fixed assets
m4: overheads, fixed assets
m5: overheads, fixed assets
m1: loans, other earning assets, net free income
m2: loans less NPLs, other earning assets, net free income, RNPLs as undesirable output
m3: Loans, other earning assets, net free income, deposits
m4: loans less RNPLs, other earning assets, net free income, RNPLs as undesirable output, deposits
m5: net interest earnings, net free income
DEA
Malmquist
Examine the productivity growth of the nationwide banks of China and a sample of city commercial banks for the ten years to 2007
Fung and Leung [35]17 Chinese banksdeposits, labor input, fixed capitalinterest income, non-interest incomeDEAEstimate and compare the productivity of the national commercial banks in China during the period of 1996–2005
Wang et al. [36]16 Chinese banksfixed assets, labor intermediate measures: depositsnon-interest incomes, interest incomes, non-performing loans or bad loanstwo-stage network DEADetect Chinese banking system’s weak areas to ascertain how to devote an appropriate effort to improve the performance
Table 2. Input and output variables used.
Input VariablesOutput Variables
Number of employeesInterest income
Fixed assets
Deposits
Non-interest income
Table 3. Inputs and outputs of the 20 state-owned commercial banks in China in 2015 (Unit: persons, billion/yuan).
RegionsDMUsInput
Number of Employees
Variables
Fixed Assets
DepositsOutput
Interest
Income
Variables
Non-Interest
Income
ShanghaiDMU114,55312,899.6310,698.355246.59151.95
DMU284245385.694194.93126.8877.09
DMU310,3559241.667567.23702.94103.21
DMU495597684.156003.263120.1697.77
HebeiDMU517,7914395.064063.742563.454.51
DMU620,0194417.164199.791988.1981.76
DMU795612239.762058.511309.6830.17
DMU812,7393896.024231.972401.8166
BeijingDMU916,03823,90021,748.494205.24340.51
DMU10973810,152.295116.751907.1865.06
DMU1111,83112,243.829046.93576.98110.18
DMU12824263925590.872323.55107
HenanDMU1324,57411,057.353763.771392.8953.25
DMU1420,0744357.263985.252531.1960.32
DMU1515,3023669.013297.42076.3948.84
DMU1617,5724290.574066.692250.0372.48
ShandongDMU1723,8867230.868013.965321.53155.94
DMU1821,0846906.57220.76396.13152.99
DMU1917,5055634.134869.823686.7588.76
DMU2019,8225907.616453.364385.48136.16
Table 4. Service Quality and Service Satisfaction Index of the State-owned Commercial Banks in China.
DMUsTangibleReliableResponsiveAssuranceEmpathySatisfaction
DMU13.413.452.913.33.143.51
DMU23.623.683.353.873.473.75
DMU33.983.913.673.903.703.87
DMU53.313.453.322.993.283.30
DMU63.553.322.803.523.133.37
DMU73.553.613.333.673.473.56
DMU83.463.503.113.433.163.52
DMU93.813.783.593.833.573.89
DMU103.263.182.893.433.123.36
DMU113.983.733.093.683.383.68
DMU133.043.082.713.382.942.96
DMU173.783.653.123.733.233.54
Table 5. Efficiency analysis results of branches of the stated-owned commercial banks in China.
DMUsCRSVRSSERTSSBM CRSSBM VRS
DMU1111CRS11
DMU2111CRS11
DMU30.9850.9850.999IRS0.8350.876
DMU40.9270.9330.994DRS0.8770.880
DMU50.7120.7800.869IRS0.570.667
DMU60.9190.9990.919IRS0.5680.723
DMU70.71810.718IRS0.5891
DMU80.7480.9140.791IRS0.6870.840
DMU9111CRS11
DMU100.6480.6630.753IRS0.4970.518
DMU110.8500.8500.999IRS0.6870.695
DMU12111CRS11
DMU130.6680.7470.833IRS0.3040.362
DMU140.7170.7930.860IRS0.5860.687
DMU150.7110.8210.825IRS0.5850.744
DMU160.8410.9220.897IRS0.6170.721
DMU170.9430.9960.951DRS0.8360.851
DMU18111CRS11
DMU190.8600.9140.927IRS0.7540.834
DMU20111CRS11
Table 6. The results of the regression analysis.
VariablesEstimateStd. Errort Valuep-Values
intercept−0.94430.8106−1.1650.2711
Service quality 0.52380.23622.2170.0509 .
Note: p-value followed by is a significant level of 6%.
Table 7. The results of the regression analysis.
VariablesEstimateStd. Errort Valuep-Values
intercept−0.008180.435172−0.0190.985
service quality1.032080.1268138.1391.01 × 10−5 **
efficiency0.82660.28102.9410.0148 *
Note: p-value followed by * and ** are significant levels of 5% and 1%, respectively.
Table 8. GRDP (Gross Regional Domestic Product) of five regions (2015).
ShanghaiHebeiBeijingHenanShandong
GRDP25,123.4529,806.1123,014.5937,00263,002
mean 35,589.73
Unit: billion yuan.

