Safety-Culture Exploration in Taiwan’s Metal Industries: Identifying the Workers’ Background Influence on Safety Climate

Abstract
1. Introduction
2. Theoretical Background
2.1. Safety Culture and Safety Climate Assessment
2.2. Workers’ Backgrounds Influence Identification of Safety-Climate Factors
2.3. Purposes and Hypotheses
3. Materials and Methods
3.1. Questionnaire
3.2. Participants and Procedure
3.3. Statistical Analysis
4. Results
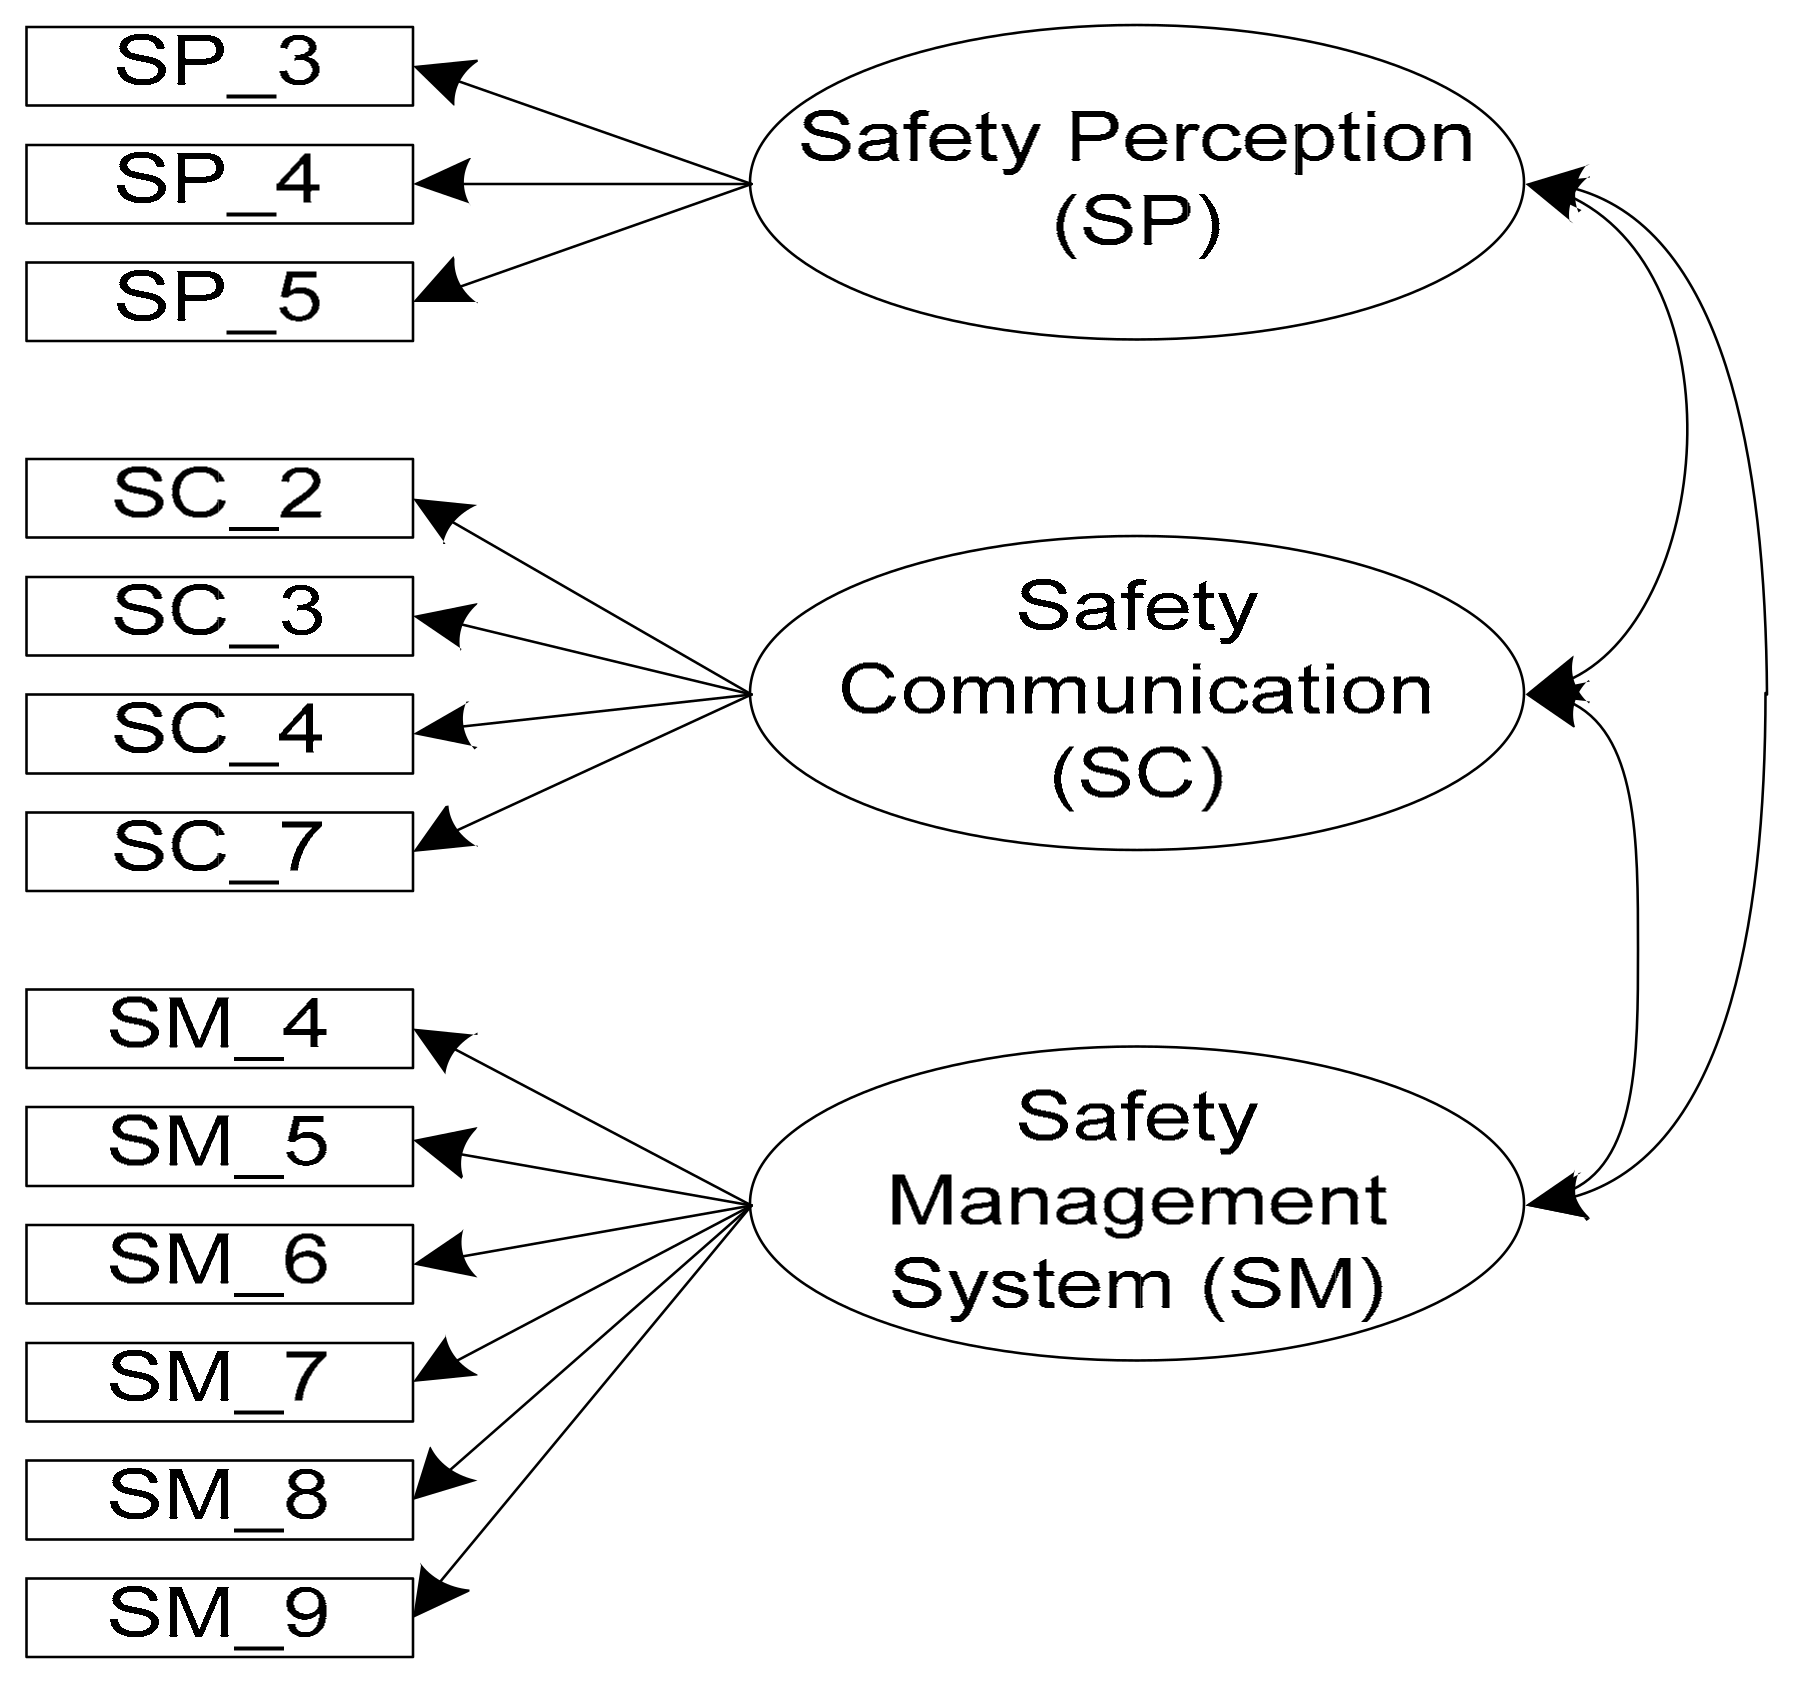
4.1. Questionnaire Validation and Safety-Climate Assessment
4.2. Identifying Workers’ Background Influence on Safety Climate
5. Discussion
5.1. Questionnaire Validity and Reliability Investigation
5.2. The Evaluation of the Safety-Climate Questionnaire-Development Process
- Step one:
- information gathering (literature and accident inquiries review, experts’ input, in-depth interviews with workers and supervisors, and field observation);
- Step two:
- development of questionnaire items;
- Step three:
- questionnaire testing (interviews with workers, questionnaire revision, pre-test survey, pilot test);
- Step four:
- analysis (pilot-test data analysis and questionnaire finalization);
- Step five:
- questionnaire implementation; and
- Step six:
- further analysis (reliability and validity analysis and safety-climate examination).
5.3. Safety-Climate Level in Taiwan’s Metal Industries
5.4. The Influence of Workers’ Backgrounds on the Safety Climate
6. Conclusions
Acknowledgments
Author Contributions
Conflicts of Interest
References
- Ministry of Labor Republic of China. Occupational Injury Incidence Rate under Labor Insurance. Available online: http://statdb.mol.gov.tw/html/mon/c6080.htm (accessed on 1 September 2016).
- Strauch, B. Can We Examine Safety Culture in Accident Investigations, or Should We? Saf. Sci. 2015, 77, 102–111. [Google Scholar] [CrossRef]
- Leitão, S.; Greiner, B.A. Organisational safety climate and occupational accidents and injuries: An epidemiology-based systematic review. Work Stress 2016, 30, 71–90. [Google Scholar] [CrossRef]
- Wadsworth, E.; Smith, A. Safety culture, advice and performance. Policy Pract. Health Saf. 2009, 7, 5–31. [Google Scholar] [CrossRef]
- Vinodkumar, M.; Bhasi, M. Safety climate factors and its relationship with accidents and personal attributes in the chemical industry. Saf. Sci. 2009, 47, 659–667. [Google Scholar] [CrossRef]
- Olsen, E. Exploring the possibility of a common structural model measuring associations between safety climate factors and safety behaviour in health care and the petroleum sectors. Accid. Anal. Prev. 2010, 42, 1507–1516. [Google Scholar] [CrossRef] [PubMed]
- Glendon, A.I.; Stanton, N.A. Perspectives on safety culture. Saf. Sci. 2000, 34, 193–214. [Google Scholar] [CrossRef]
- Mearns, K.J.; Flin, R. Assessing the state of organizational safety—Culture or climate? Curr. Psychol. 1999, 18, 5–17. [Google Scholar] [CrossRef]
- Guldenmund, F.W. Understanding and Exploring Safety Culture; TU Delft, Delft University of Technology: Delft, The Netherlands, 2010. [Google Scholar]
- Kennedy, R.; Kirwan, B. Development of a hazard and operability-based method for identifying safety management vulnerabilities in high risk systems. Saf. Sci. 1998, 30, 249–274. [Google Scholar] [CrossRef]
- Guldenmund, F.W. The use of questionnaires in safety culture research—An evaluation. Saf. Sci. 2007, 45, 723–743. [Google Scholar] [CrossRef]
- Seo, D.-C.; Torabi, M.R.; Blair, E.H.; Ellis, N.T. A cross-validation of safety climate scale using confirmatory factor analytic approach. J. Saf. Res. 2004, 35, 427–445. [Google Scholar] [CrossRef] [PubMed]
- De Castro, B.L.; Gracia, F.J.; Peiró, J.M.; Pietrantoni, L.; Hernandez, A. Testing the validity of the international atomic energy agency (IAEA) safety culture model. Accid. Anal. Prev. 2013, 60, 231–244. [Google Scholar] [CrossRef] [PubMed]
- Høivik, D.; Tharaldsen, J.E.; Baste, V.; Moen, B.E. What is most important for safety climate: The company belonging or the local working environment—A study from the norwegian offshore industry. Saf. Sci. 2009, 47, 1324–1331. [Google Scholar] [CrossRef]
- Reiman, T.; Rollenhagen, C. Does the concept of safety culture help or hinder systems thinking in safety? Accid. Anal. Prev. 2014, 68, 5–15. [Google Scholar] [CrossRef] [PubMed]
- Myers, D.J.; Nyce, J.M.; Dekker, S.W. Setting culture apart: Distinguishing culture from behavior and social structure in safety and injury research. Accid. Anal. Prev. 2014, 68, 25–29. [Google Scholar] [CrossRef] [PubMed]
- Schein, E.H. Organizational Culture and Leadership; Jossey-Bass: San Francisco, CA, USA, 2004. [Google Scholar]
- Schein, E.H. Organizational Culture and Leadership, 2nd ed.; Jossey Bass: San Francisco, CA, USA, 1992. [Google Scholar]
- Burchell, N.; Kolb, D. Pattern matching organisational cultures. J. Manag. Org. 2003, 9, 50–61. [Google Scholar] [CrossRef]
- Frazier, C.B.; Ludwig, T.D.; Whitaker, B.; Roberts, D.S. A hierarchical factor analysis of a safety culture survey. J. Saf. Res. 2013, 45, 15–28. [Google Scholar] [CrossRef] [PubMed]
- Kjestveit, K.; Tharaldsen, J.; Holte, K.A. Young and strong: What influences injury rates within building and construction? Saf. Sci. Monit. 2011, 15, 1–15. [Google Scholar]
- Kapp, E. The influence of supervisor leadership practices and perceived group safety climate on employee safety performance. Saf. Sci. 2012, 50, 1119–1124. [Google Scholar] [CrossRef]
- Luria, G.; Yagil, D. Safety perception referents of permanent and temporary employees: Safety climate boundaries in the industrial workplace. Accid. Anal. Prev. 2010, 42, 1423–1430. [Google Scholar] [CrossRef] [PubMed]
- Zhou, Q.; Fang, D.; Wang, X. A method to identify strategies for the improvement of human safety behavior by considering safety climate and personal experience. Saf. Sci. 2008, 46, 1406–1419. [Google Scholar] [CrossRef]
- Kines, P.; Lappalainen, J.; Mikkelsen, K.L.; Olsen, E.; Pousette, A.; Tharaldsen, J.; Tómasson, K.; Törner, M. Nordic safety climate questionnaire (NOSACQ-50): A new tool for diagnosing occupational safety climate. Int. J. Ind. Ergon. 2011, 41, 634–646. [Google Scholar] [CrossRef]
- Zohar, D. Thirty years of safety climate research: Reflections and future directions. Accid. Anal. Prev. 2010, 42, 1517–1522. [Google Scholar] [CrossRef] [PubMed]
- Zohar, D. A group-level model of safety climate: Testing the effect of group climate on microaccidents in manufacturing jobs. J. Appl. Psychol. 2000, 85, 587. [Google Scholar] [CrossRef] [PubMed]
- Wu, T.-C.; Liu, C.-W.; Lu, M.-C. Safety climate in university and college laboratories: Impact of organizational and individual factors. J. Saf. Res. 2007, 38, 91–102. [Google Scholar] [CrossRef] [PubMed]
- Findley, M.; Smith, S.; Gorski, J.; O’neil, M. Safety climate differences among job positions in a nuclear decommissioning and demolition industry: Employees’ self-reported safety attitudes and perceptions. Saf. Sci. 2007, 45, 875–889. [Google Scholar] [CrossRef]
- Probst, T.M.; Brubaker, T.L.; Barsotti, A. Organizational injury rate underreporting: The moderating effect of organizational safety climate. J. Appl. Psychol. 2008, 93, 1147. [Google Scholar] [CrossRef] [PubMed]
- Beus, J.M.; Bergman, M.E.; Payne, S.C. The influence of organizational tenure on safety climate strength: A first look. Accid. Anal. Prev. 2010, 42, 1431–1437. [Google Scholar] [CrossRef] [PubMed]
- Milijic, N.; Mihajlovic, I.; Strbac, N.; Zivkovic, Z. Developing a questionnaire for measuring safety climate in the workplace in serbia. Int. J. Occup. Saf. Ergon. 2013, 19, 631–645. [Google Scholar] [CrossRef] [PubMed]
- Atchley, P.; Shi, J.; Yamamoto, T. Cultural foundations of safety culture: A comparison of traffic safety culture in china, japan and the united states. Transp. Res. Part F Traffic Psychol. Behav. 2014, 26, 317–325. [Google Scholar] [CrossRef]
- Listyowardojo, T.A.; Yan, X.; Leyshon, S.; Ray-Sannerud, B.; Yu, X.Y.; Zheng, K.; Duan, T. A safety culture assessment by mixed methods at a public maternity and infant hospital in China. J. Multidiscip. Healthc. 2017, 10, 253. [Google Scholar] [CrossRef] [PubMed]
- Østerås, N.; Gulbrandsen, P.; Garratt, A.; Benth, J.Š.; Dahl, F.A.; Natvig, B.; Brage, S. A randomised comparison of a four-and a five-point scale version of the norwegian function assessment scale. Health Qual. Life Outcomes 2008, 6, 14. [Google Scholar] [CrossRef] [PubMed]
- Yieh Phui. Yieh Phui Company Profile. Available online: https://www.yiehphui.com.tw/upload/myfiles/catalog/Company_Profile.pdf (accessed on 24 July 2017).
- Times, F. Yieh phui Enterprise Co. Ltd. Available online: http://markets.ft.com/data/equities/tearsheet/profile?s=2023:TAI (accessed on 24 July 2017).
- Fichman, M.; Cummings, J.N. Multiple imputation for missing data: Making the most of what you know. Org. Res. Methods 2003, 6, 282–308. [Google Scholar] [CrossRef]
- Huang, Y.-H.; Zohar, D.; Robertson, M.M.; Garabet, A.; Murphy, L.A.; Lee, J. Development and validation of safety climate scales for mobile remote workers using utility/electrical workers as exemplar. Accid. Anal. Prev. 2013, 59, 76–86. [Google Scholar] [CrossRef] [PubMed]
- Ullman, J.B. Structural equation modeling: Reviewing the basics and moving forward. J. Personal. Assess. 2006, 87, 35–50. [Google Scholar] [CrossRef] [PubMed]
- Hair, J.F.; Black, W.C.; Babin, B.J.; Anderson, R.E.; Tatham, R.L. Multivariate Data Analysis, 6th ed.; Pearson Prentice Hall: Upper Saddle River, NJ, USA, 2006. [Google Scholar]
- Afthanorhan, W.; Ahmad, S.; Mamat, I. Pooled confirmatory factor analysis (PCFA) using structural equation modeling on volunteerism program: A step by step approach. Int. J. Asian Soc. Sci. 2014, 4, 642–653. [Google Scholar]
- Fornell, C.; Larcker, D.F. Evaluating structural equation models with unobservable variables and measurement error. J. Mark. Res. 1981, 18, 39–50. [Google Scholar] [CrossRef]
- Nadlifatin, R.; Lin, S.-C.; Rachmaniati, Y.P.; Persada, S.F.; Razif, M. A pro-environmental reasoned action model for measuring citizens’ intentions regarding ecolabel product usage. Sustainability 2016, 8, 1165. [Google Scholar] [CrossRef]
- Nadlifatin, R.; Razif, M.; Lin, S.-C.; Persada, S.F.; Belgiawan, P.F. An assessment model of indonesian citizens’ intention to participate on environmental impact assessment (EIA): A behavioral perspective. Procedia Environ. Sci. 2015, 28, 3–10. [Google Scholar] [CrossRef]
- Lin, S.-C.; Nadlifatin, R.; Amna, A.R.; Persada, S.F.; Razif, M. Investigating citizen behavior intention on mandatory and voluntary pro-environmental programs through a pro-environmental planned behavior model. Sustainability 2017, 9, 1289. [Google Scholar] [CrossRef]
- Chin, J.; Lin, S.-C. Investigating users’ perspectives in building energy management system with an extension of technology acceptance model: A case study in indonesian manufacturing companies. Procedia Comput. Sci. 2015, 72, 31–39. [Google Scholar] [CrossRef]
- Chin, J.; Lin, S.-C. A behavioral model of managerial perspectives regarding technology acceptance in building energy management systems. Sustainability 2016, 8, 641. [Google Scholar] [CrossRef]
- Hammervold, R.; Olsson, U.H. Testing structural equation models: The impact of error variances in the data generating process. Qual. Quant. 2012, 46, 1547–1570. [Google Scholar] [CrossRef]
- Hox, J.; Bechger, T. An introduction to structural equation modelling. Fam. Sci. Rev. 1998, 11, 354–373. [Google Scholar]
- Hooper, D.; Coughlan, J.; Mullen, M. Structural equation modelling: Guidelines for determining model fit. Articles 2008, 2, 53–60. [Google Scholar]
- Wheaton, B.; Muthen, B.; Alwin, D.F.; Summers, G.F. Assessing reliability and stability in panel models. Sociol. Methodol. 1977, 8, 84–136. [Google Scholar] [CrossRef]
- Tabachnick, B.; Fidell, L. Using Multivariate Statistics, 5th ed.; Allyn and Bacon: Boston, MA, USA, 2007. [Google Scholar]
- Persada, S.; Lin, S.; Nadlifatin, R.; Razif, M. Investigating the citizens’ intention level in environmental impact assessment participation through an extended theory of planned behavior model. Glob. NEST J. 2015, 17, 847–857. [Google Scholar]
- Lin, S.-C.; Persada, S.F.; Nadlifatin, R. A study of student behavior in accepting the blackboard learning system: A technology acceptance model (TAM) approach. In Proceedings of the 2014 IEEE 18th International Conference on Computer Supported Cooperative Work in Design (CSCWD), Hsinchu, Taiwan, 21–23 May 2014; pp. 457–462. [Google Scholar]
- Hu, L.T.; Bentler, P.M. Cutoff criteria for fit indexes in covariance structure analysis: Conventional criteria versus new alternatives. Struct. Equ. Model. Multidiscip. J. 1999, 6, 1–55. [Google Scholar] [CrossRef]
- Jani, M.A.; Sari, G.I.P.; Pribadi, R.C.H.; Nadlifatin, R.; Persada, S.F. An investigation of the influential factors on digital text voting for commercial competition: A case of indonesia. Procedia Comput. Sci. 2015, 72, 285–291. [Google Scholar] [CrossRef]
- Lin, S.-C.; Persada, S.F.; Nadlifatin, R.; Tsai, H.-Y.; Chu, C.-H. Exploring the influential factors of manufacturers’ initial intention in applying for the green mark ecolabel in taiwan. Int. J. Precis. Eng. Manuf. Green Technol. 2015, 2, 359–364. [Google Scholar] [CrossRef]
- Lei, P.W.; Wu, Q. Introduction to structural equation modeling: Issues and practical considerations. Educ. Meas. Issues Pract. 2007, 26, 33–43. [Google Scholar] [CrossRef]
- Hicks, G.; Buttigieg, D.; De Cieri, H. Safety climate, strain and safety outcomes. J. Manag. Org. 2016, 22, 19. [Google Scholar] [CrossRef]


| Variable | N | % |
|---|---|---|
| Gender | ||
| Male | 792 | 94.4 |
| Female | 47 | 5.6 |
| Job position | ||
| Executive | 19 | 2.3 |
| Middle manager | 20 | 2.4 |
| Site supervisor | 140 | 16.7 |
| Frontline workers | 660 | 78.7 |
| Job attribute | ||
| Operational | 394 | 47.0 |
| Maintenance | 142 | 16.9 |
| Research and Development | 22 | 2.6 |
| Transport and storage | 59 | 7.0 |
| ndustrial safety and environmental protection | 19 | 2.3 |
| Administrative or management | 150 | 17.9 |
| Others | 53 | 6.3 |
| Organization | ||
| Main company | 609 | 72.6 |
| Satellite company 1 | 62 | 7.4 |
| Satellite company 2 | 17 | 2.0 |
| Satellite company 3 | 9 | 1.1 |
| Satellite company 4 | 61 | 7.3 |
| Satellite company 5 | 81 | 9.7 |
| Status | ||
| Main-company worker | 609 | 72.6 |
| Satellite-company worker | 230 | 27.4 |
| Number of training sessions | ||
| Never | 162 | 19.3 |
| Once | 230 | 27.4 |
| Twice | 227 | 27.1 |
| Three times | 74 | 8.8 |
| Four times or more | 146 | 17.4 |
| Factors | Measurement Items | |
|---|---|---|
| Safety Perception | SP_3 | I comply and fully understand the contents of operational procedure in my own work |
| SP_4 | Most supervisors will remind colleagues to be careful and strictly comply with written procedures | |
| SP_5 | I will remind my colleagues to take care if they do not follow safety rules or failure to comply with written procedures | |
| Safety Communication | SC_2 | When a ‘dangerous situation’ is reported out, the company can indeed find solutions (including the implementation of improvement projects and acceptable programs) |
| SC_3 | The management will understand the typical statistical data about safety | |
| SC_4 | I have been encouraged to put forward ‘suggestions for improvement’, and a good improvement recommendation would normally be adopted | |
| SC_7 | The assistance of safety matters combination can be given among various department | |
| Safety-Management System | SM_4 | * Company has already implemented automatic safety inspections, main inspections, round inspections and examinations |
| SM_5 | * The company has conducted safety posters, safety signs and safety banners | |
| SM_6 | * Company has already implemented Safety Week, Safety Month | |
| Factor | Item | Factor Loading (≥0.6) [42] | Cronbach’s Alpha (≥0.7) [41,45,46,47,48] | Construct Reliability (≥0.7) [41,45,46,47,48] | Average Variance Extracted (≥0.5) [41,45,46,47,48] |
|---|---|---|---|---|---|
| Safety Perception (SP) | SP_3 | 0.696 | 0.769 | 0.772 | 0.531 |
| SP_4 | 0.779 | ||||
| SP_5 | 0.708 | ||||
| Safety Communication (SC) | SC_2 | 0.745 | 0.847 | 0.848 | 0.582 |
| SC_3 | 0.786 | ||||
| SC_4 | 0.801 | ||||
| SC_7 | 0.718 | ||||
| Safety-Management System (SM) | SM_4 | 0.747 | 0.905 | 0.907 | 0.621 |
| SM_5 | 0.76 | ||||
| SM_6 | 0.751 | ||||
| SM_7 | 0.82 | ||||
| SM_8 | 0.803 | ||||
| SM_9 | 0.842 |
| Factors | IC | SIC |
|---|---|---|
| Safety Perception <--> Safety Communication | 0.70 | 0.50 |
| Safety Perception <--> Safety-Management System | 0.63 | 0.40 |
| Safety Communication <--> Safety-Management System | 0.72 | 0.52 |
| Goodness-of-Fit Model Index | Threshold | Result |
|---|---|---|
| χ2/df | 2 ≤ x ≤ 5 [51,52,53] | 3.853 |
| GFI | ≥0.9 [41,54] | 0.957 |
| AGFI | ≥0.9 [51,55] | 0.936 |
| SRMR | <0.08 [51,56] | 0.0030 |
| RMSEA | x ≤ 0.08 [51,57] | 0.058 |
| CFI | ≤0.90 [41,44,58] | 0.970 |
| TLI | ≤0.95 [51] | 0.962 |
| Factors | Item | Mean | Grand Mean |
|---|---|---|---|
| Safety Perception | SP_3 | 4.265 | 4.224 |
| SP_4 | 4.279 | ||
| SP_5 | 4.129 | ||
| Safety Communication | SC_2 | 3.957 | 3.970 |
| SC_3 | 3.995 | ||
| SC_4 | 3.938 | ||
| SC_7 | 3.988 | ||
| Safety-Management System | SM_4 | 4.280 | 4.231 |
| SM_5 | 4.321 | ||
| SM_6 | 4.172 | ||
| SM_7 | 4.244 | ||
| SM_8 | 4.098 | ||
| SM_9 | 4.269 |
| Factor | Workers’ Background: Gender | |||
|---|---|---|---|---|
| Mean | One-Way ANOVA (Significance) | |||
| 1. Male | 2. Female | |||
| Safety perception | 4.236 | 4.341 | 0.166 | n.s. |
| Safety communication | 4.051 | 4.215 | 0.048 | p < 0.05 |
| Safety-management system | 4.251 | 4.164 | 0.403 | n.s. |
| Factor | Workers’ Background: Job Position | |||||
|---|---|---|---|---|---|---|
| Mean | One-Way ANOVA (Significance) | |||||
| 1. Executive | 2. Middle Manager | 3. Site Supervisor | 4. Frontline Workers | |||
| Safety perception | 4.474 | 4.317 | 4.302 | 4.221 | 0.049 | p < 0.05 |
| Safety communication | 4.329 | 4.066 | 4.065 | 4.021 | 0.043 | p < 0.05 |
| Safety-management system | 4.735 | 4.409 | 4.321 | 4.224 | 0.000 | p < 0.01 |
| Factor | Workers’ Background: Job Attribute | ||||||||
|---|---|---|---|---|---|---|---|---|---|
| Mean | One-Way ANOVA (Significance) | ||||||||
| 1. Opr. | 2. Maint. | 3. R & D. | 4. Trans. & Stor. | 5. Industrial Safety and Env. Protection | 6. Adm. Man. | 7. Other | |||
| Safety perception | 4.260 | 4.218 | 4.185 | 4.301 | 4.114 | 4.232 | 4.208 | 0.217 | n.s. |
| Safety communication | 4.035 | 4.047 | 4.011 | 4.092 | 3.861 | 4.058 | 3.905 | 0.486 | n.s. |
| Safety-management system | 4.238 | 4.243 | 4.195 | 4.316 | 4.290 | 4.293 | 4.073 | 0.276 | n.s. |
| Factor | Workers‘ Background: Organization | |||||||
|---|---|---|---|---|---|---|---|---|
| Mean | One-Way ANOVA (Significance) | |||||||
| 1. Main Comp. | 2. Sat. Comp.1 | 3. Sat. Comp.2 | 4. Sat. Comp.3 | 5. Sat. Comp.4 | 6. Sat. Comp.5 | |||
| Safety perception | 4.2144 | 4.6605 | 3.9294 | 4.2386 | 4.3095 | 4.1103 | 0.000 | p < 0.01 |
| Safety communication | 4.0401 | 4.3911 | 3.4531 | 4.1071 | 4.1254 | 3.8585 | 0.000 | p < 0.01 |
| Safety-management system | 4.3015 | 4.5137 | 3.5529 | 3.6667 | 4.0692 | 3.8895 | 0.000 | p < 0.01 |
| Factor | Worker Background: Status | |||
|---|---|---|---|---|
| Mean | One-Way ANOVA (Significance) | |||
| 1. Main-Company Workers | 2. Satellite-Company Workers | |||
| Safety perception | 4.214 | 4.315 | 0.009 | p < 0.01 |
| Safety communication | 4.039 | 4.087 | 0.263 | n.s. |
| Safety-management system | 4.302 | 4.072 | 0.000 | p < 0.01 |
| Factor | Worker Background: Number of Trainings | ||||||
|---|---|---|---|---|---|---|---|
| Mean | One-Way ANOVA (Significance) | ||||||
| 1. Never | 2. Once | 3. Twice | 4. Three Times | 5. Four Times or More | |||
| Safety perception | 4.068 | 4.189 | 4.240 | 4.383 | 4.368 | 0.000 | p < 0.01 |
| Safety communication | 3.984 | 3.951 | 4.019 | 4.250 | 4.198 | 0.000 | p < 0.01 |
| Safety-management system | 4.0251 | 4.1888 | 4.2676 | 4.3601 | 4.4862 | 0.000 | p < 0.01 |
© 2017 by the authors. Licensee MDPI, Basel, Switzerland. This article is an open access article distributed under the terms and conditions of the Creative Commons Attribution (CC BY) license (http://creativecommons.org/licenses/by/4.0/).
Share and Cite
Lin, S.-C.; Mufidah, I.; Persada, S.F. Safety-Culture Exploration in Taiwan’s Metal Industries: Identifying the Workers’ Background Influence on Safety Climate. Sustainability 2017, 9, 1965. https://doi.org/10.3390/su9111965
Lin S-C, Mufidah I, Persada SF. Safety-Culture Exploration in Taiwan’s Metal Industries: Identifying the Workers’ Background Influence on Safety Climate. Sustainability. 2017; 9(11):1965. https://doi.org/10.3390/su9111965
Chicago/Turabian StyleLin, Shu-Chiang, Ilma Mufidah, and Satria Fadil Persada. 2017. "Safety-Culture Exploration in Taiwan’s Metal Industries: Identifying the Workers’ Background Influence on Safety Climate" Sustainability 9, no. 11: 1965. https://doi.org/10.3390/su9111965
APA StyleLin, S.-C., Mufidah, I., & Persada, S. F. (2017). Safety-Culture Exploration in Taiwan’s Metal Industries: Identifying the Workers’ Background Influence on Safety Climate. Sustainability, 9(11), 1965. https://doi.org/10.3390/su9111965