Exploring the Coupling and Decoupling Relationships between Urbanization Quality and Water Resources Constraint Intensity: Spatiotemporal Analysis for Northwest China

Abstract
1. Introduction
2. Materials and Methods
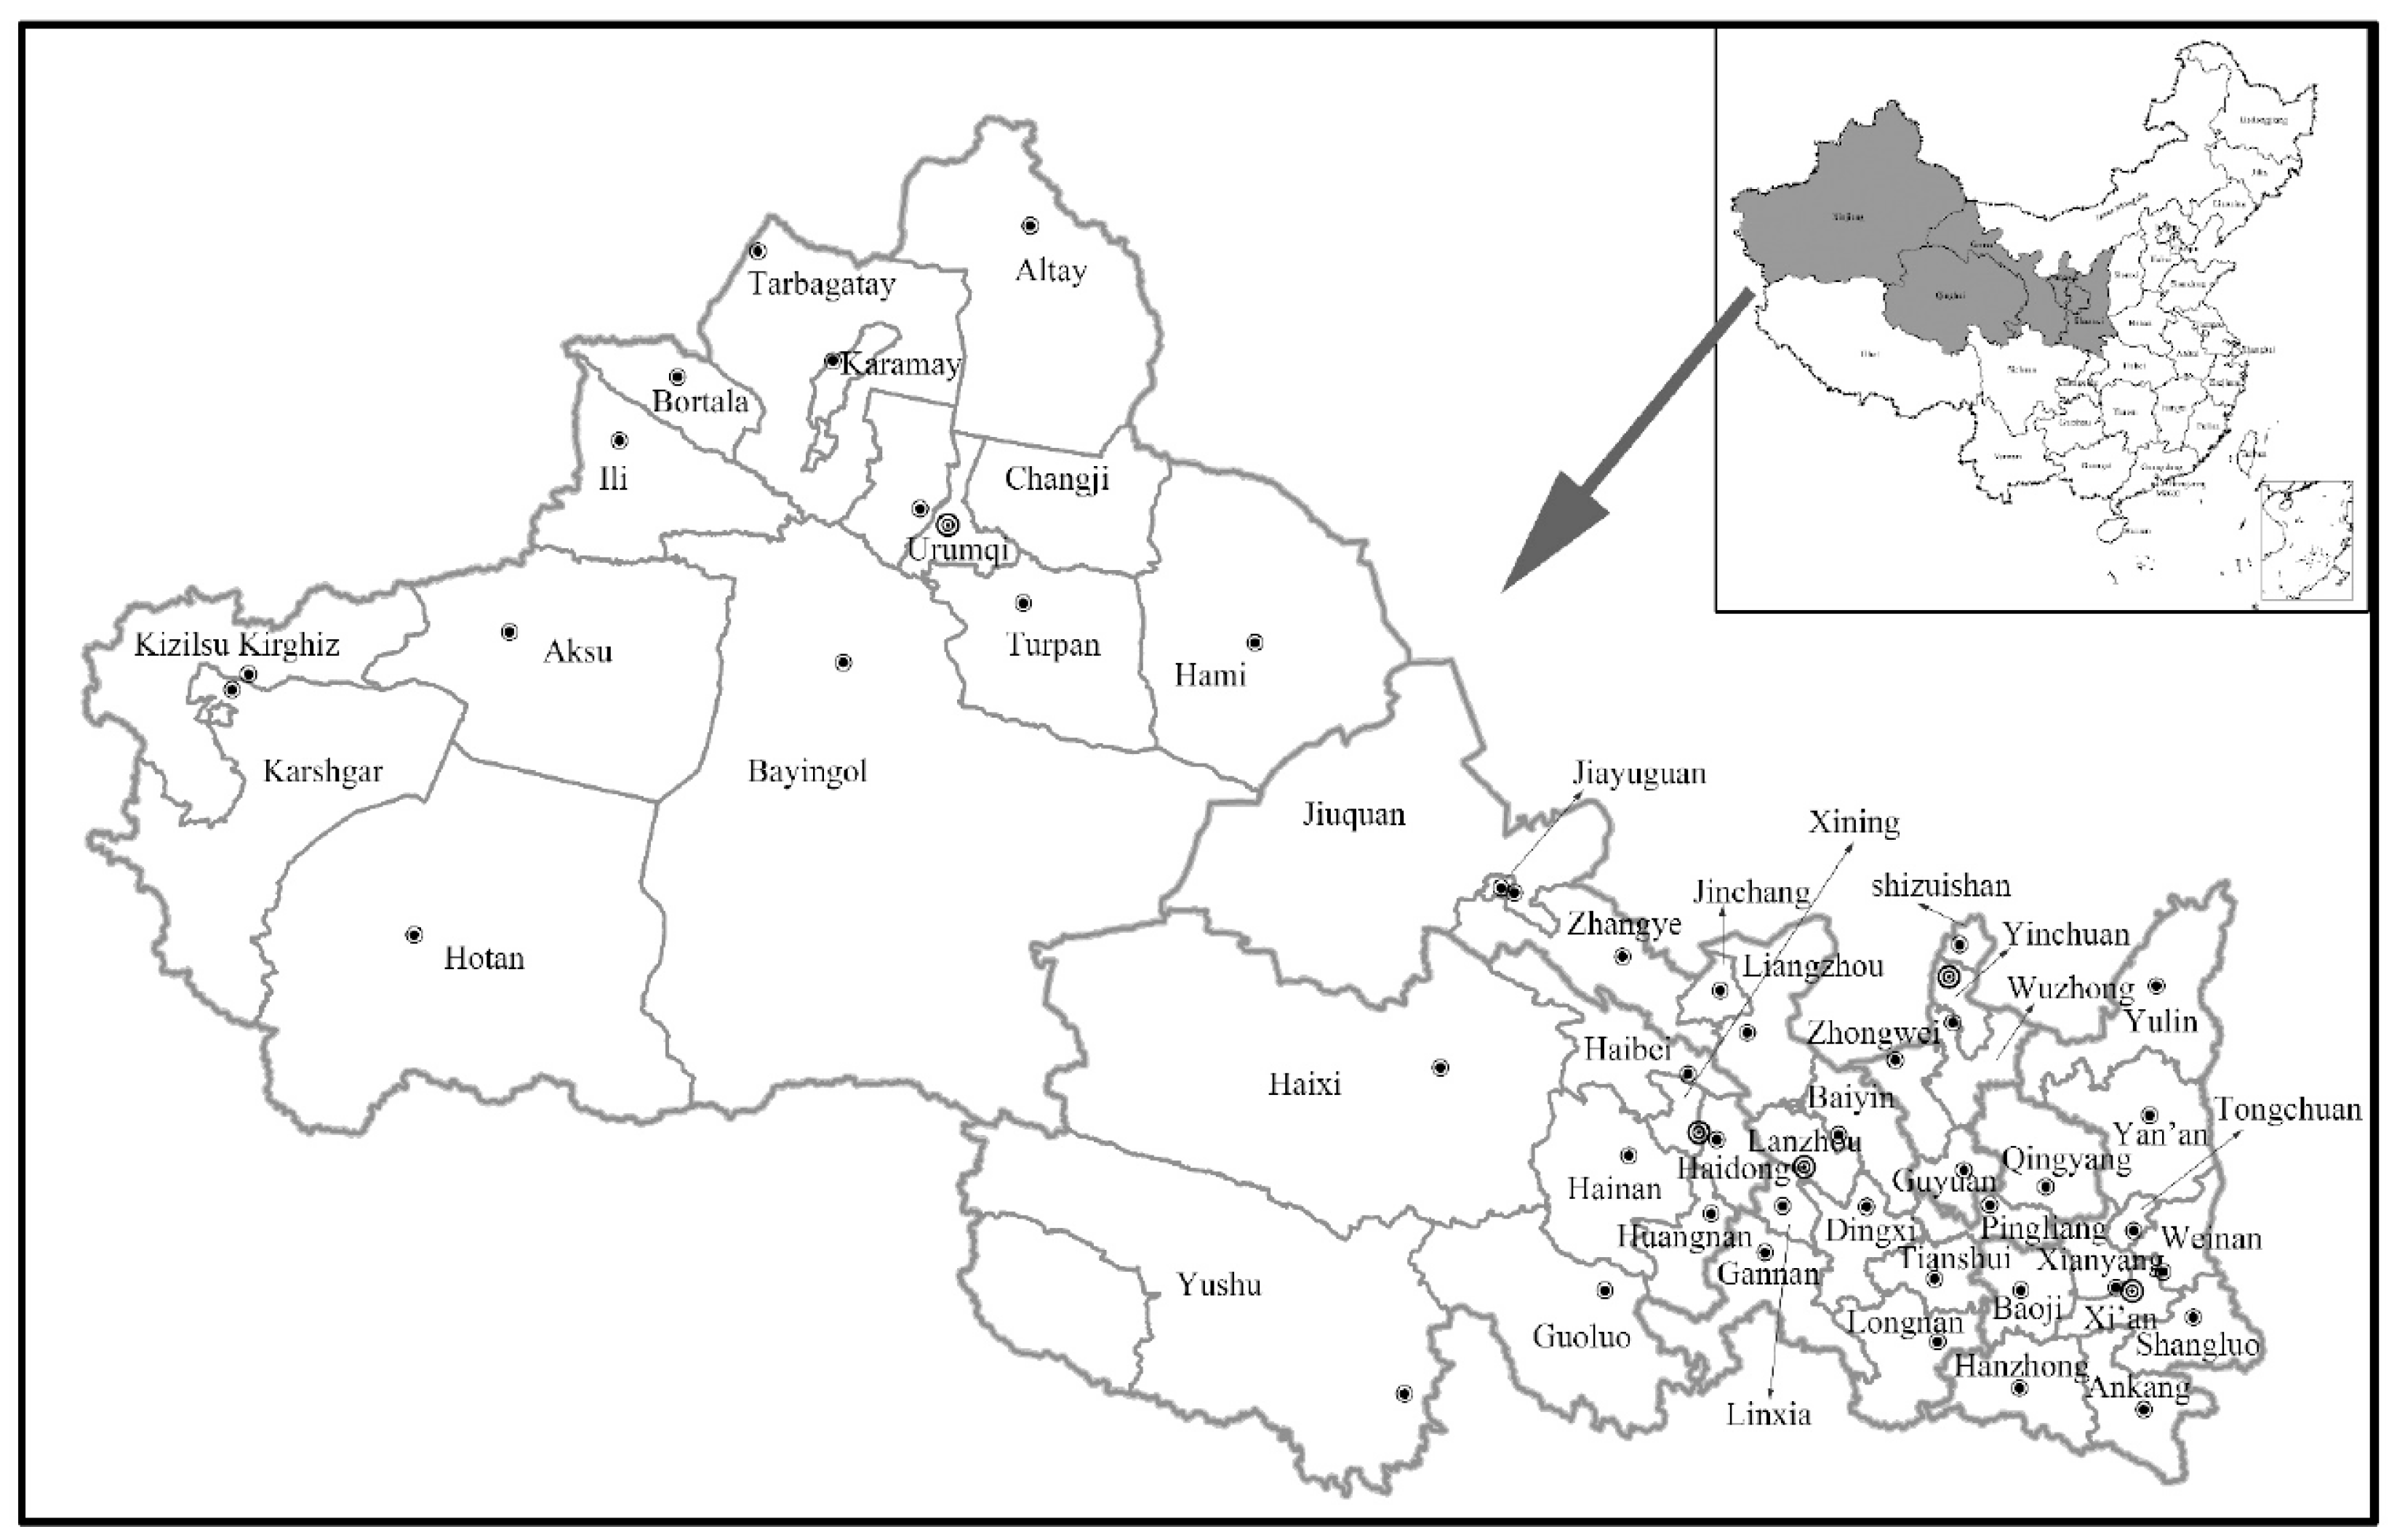
2.1. Study Area
2.2. Indicator System of UQI & WRCI and Data Sources
2.3. Fuzzy Comprehensive Evaluation Method with Multi-Objectives and Multi-Hierarchies
2.3.1. Evaluation Criterion and Multi-Objective Threshold Values
2.3.2. Normalization and Multi-Hierarchies Aggregation Method
2.4. Coupling and Decoupling Method from a Spatiotemporal Perspective
2.4.1. Spatial Coupling Classification Method
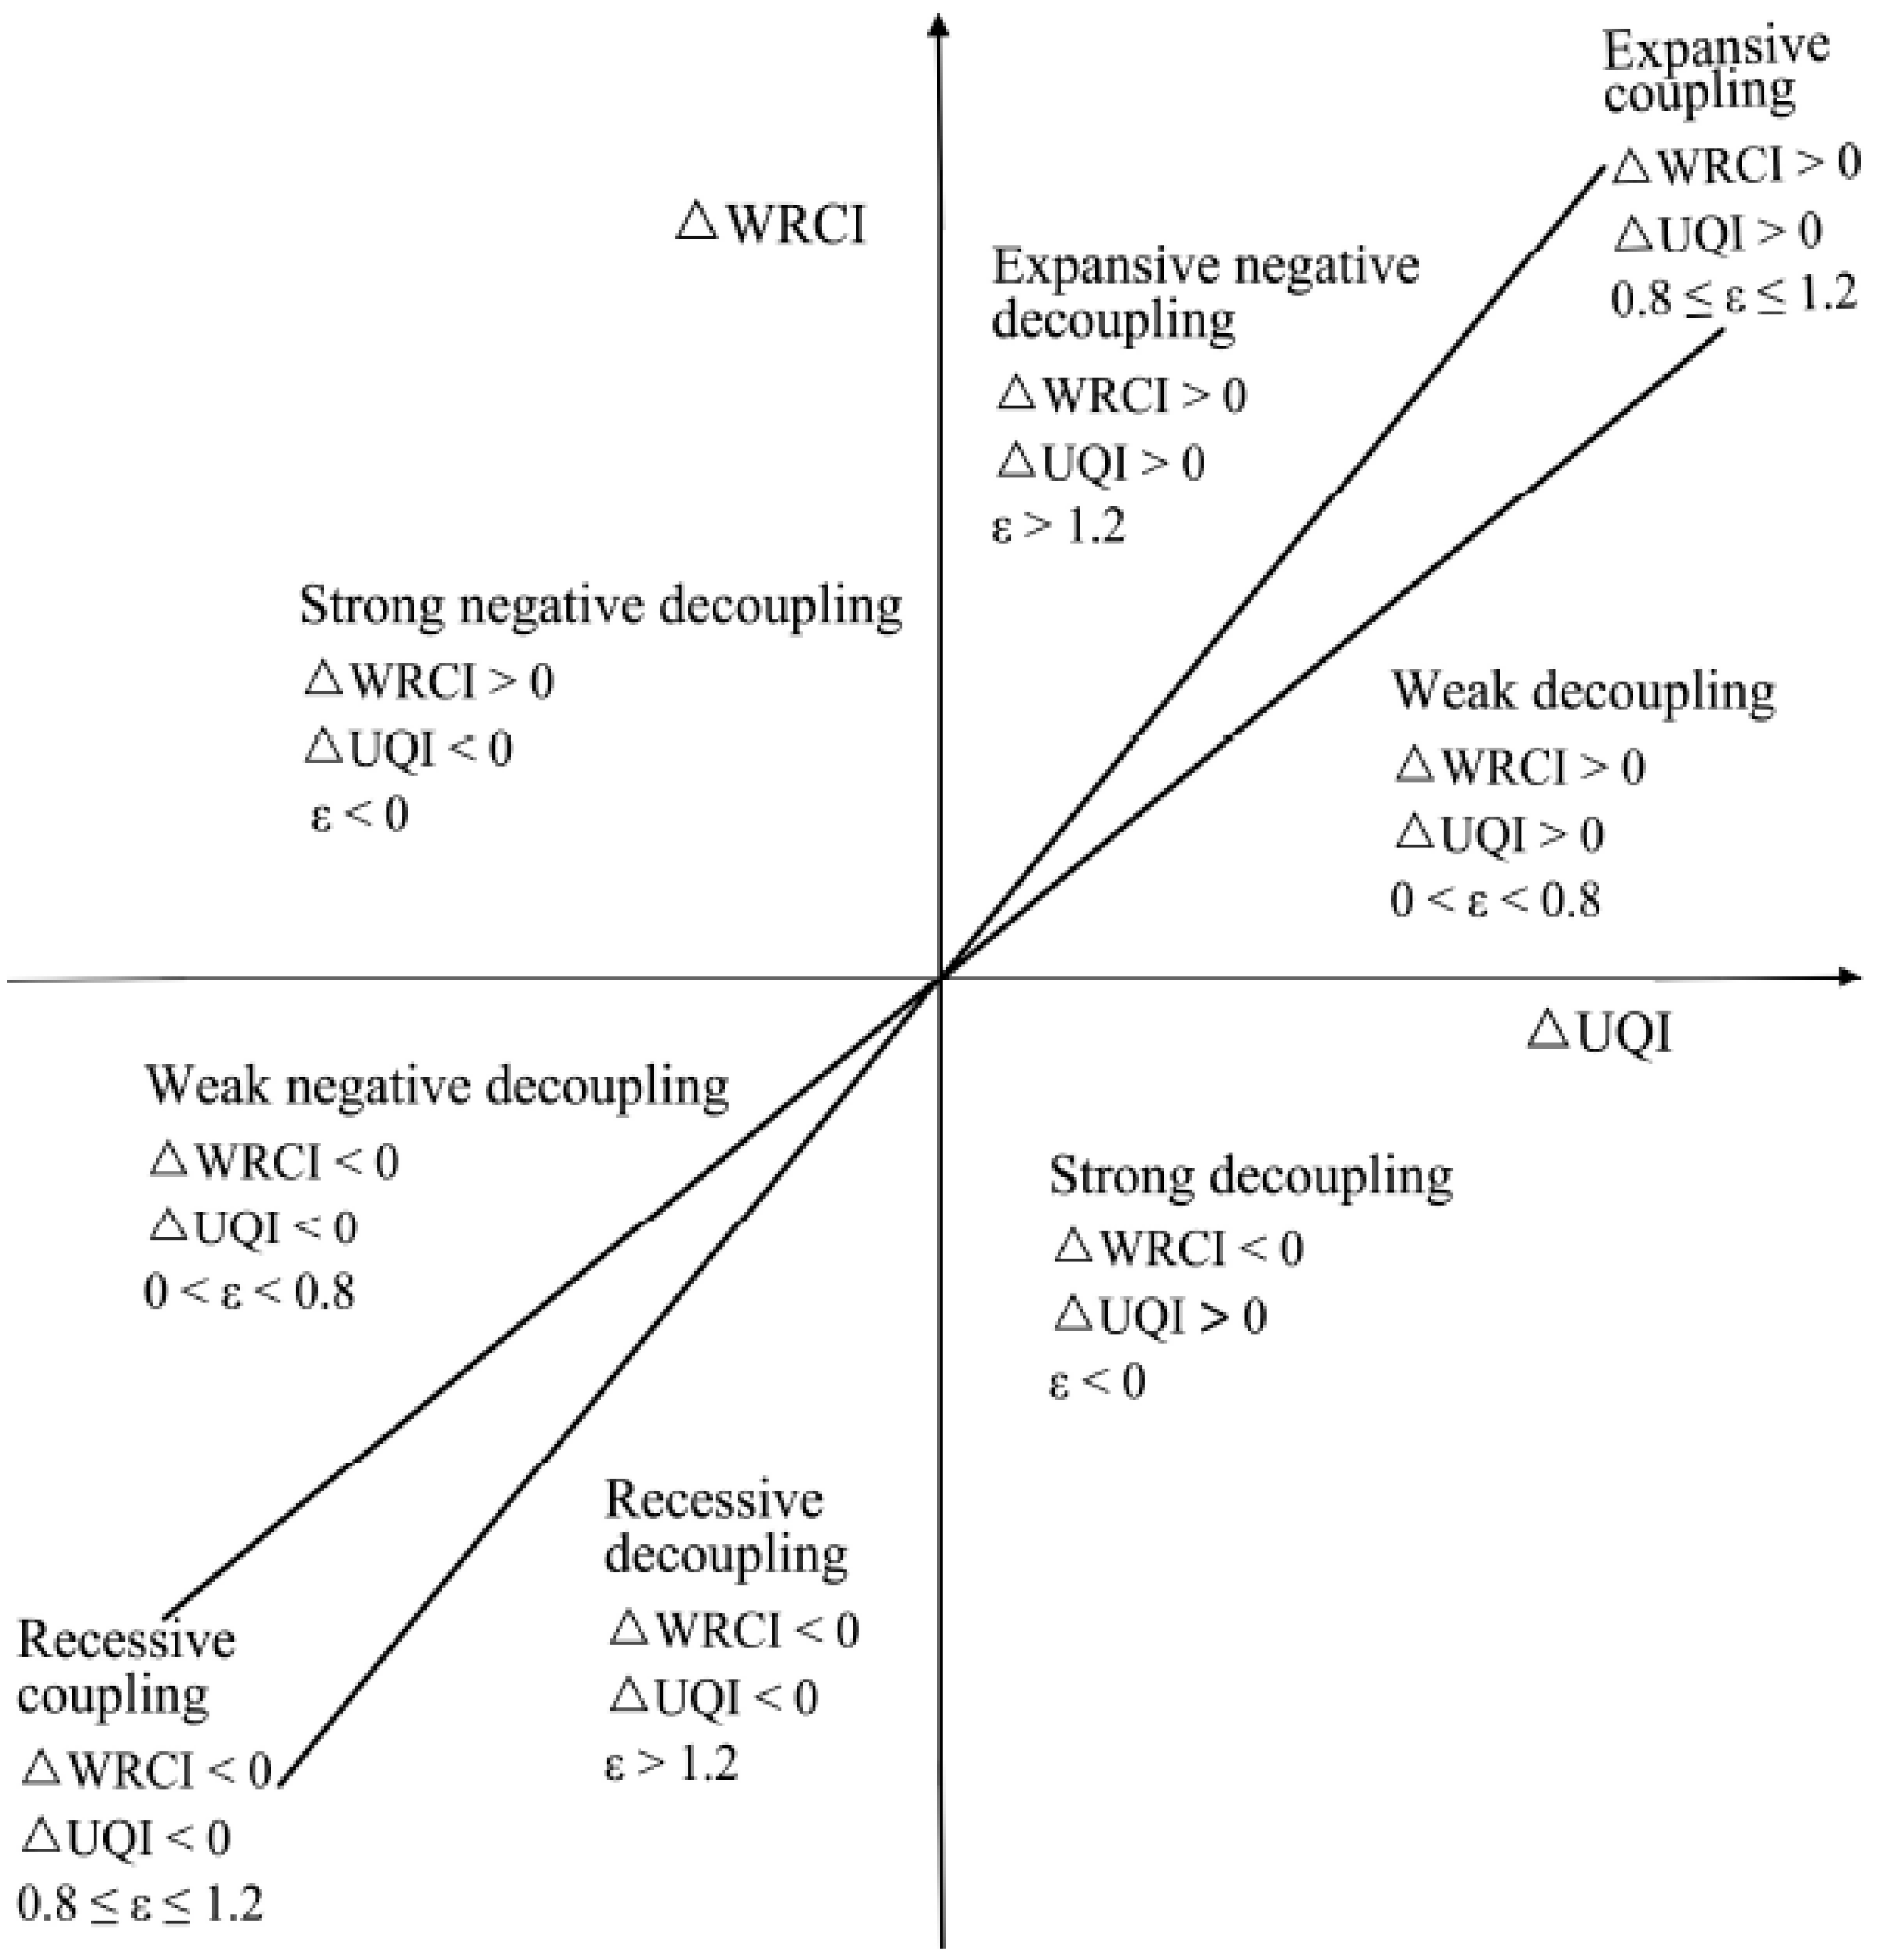
2.4.2. Temporal Decoupling Classification Method
3. Results
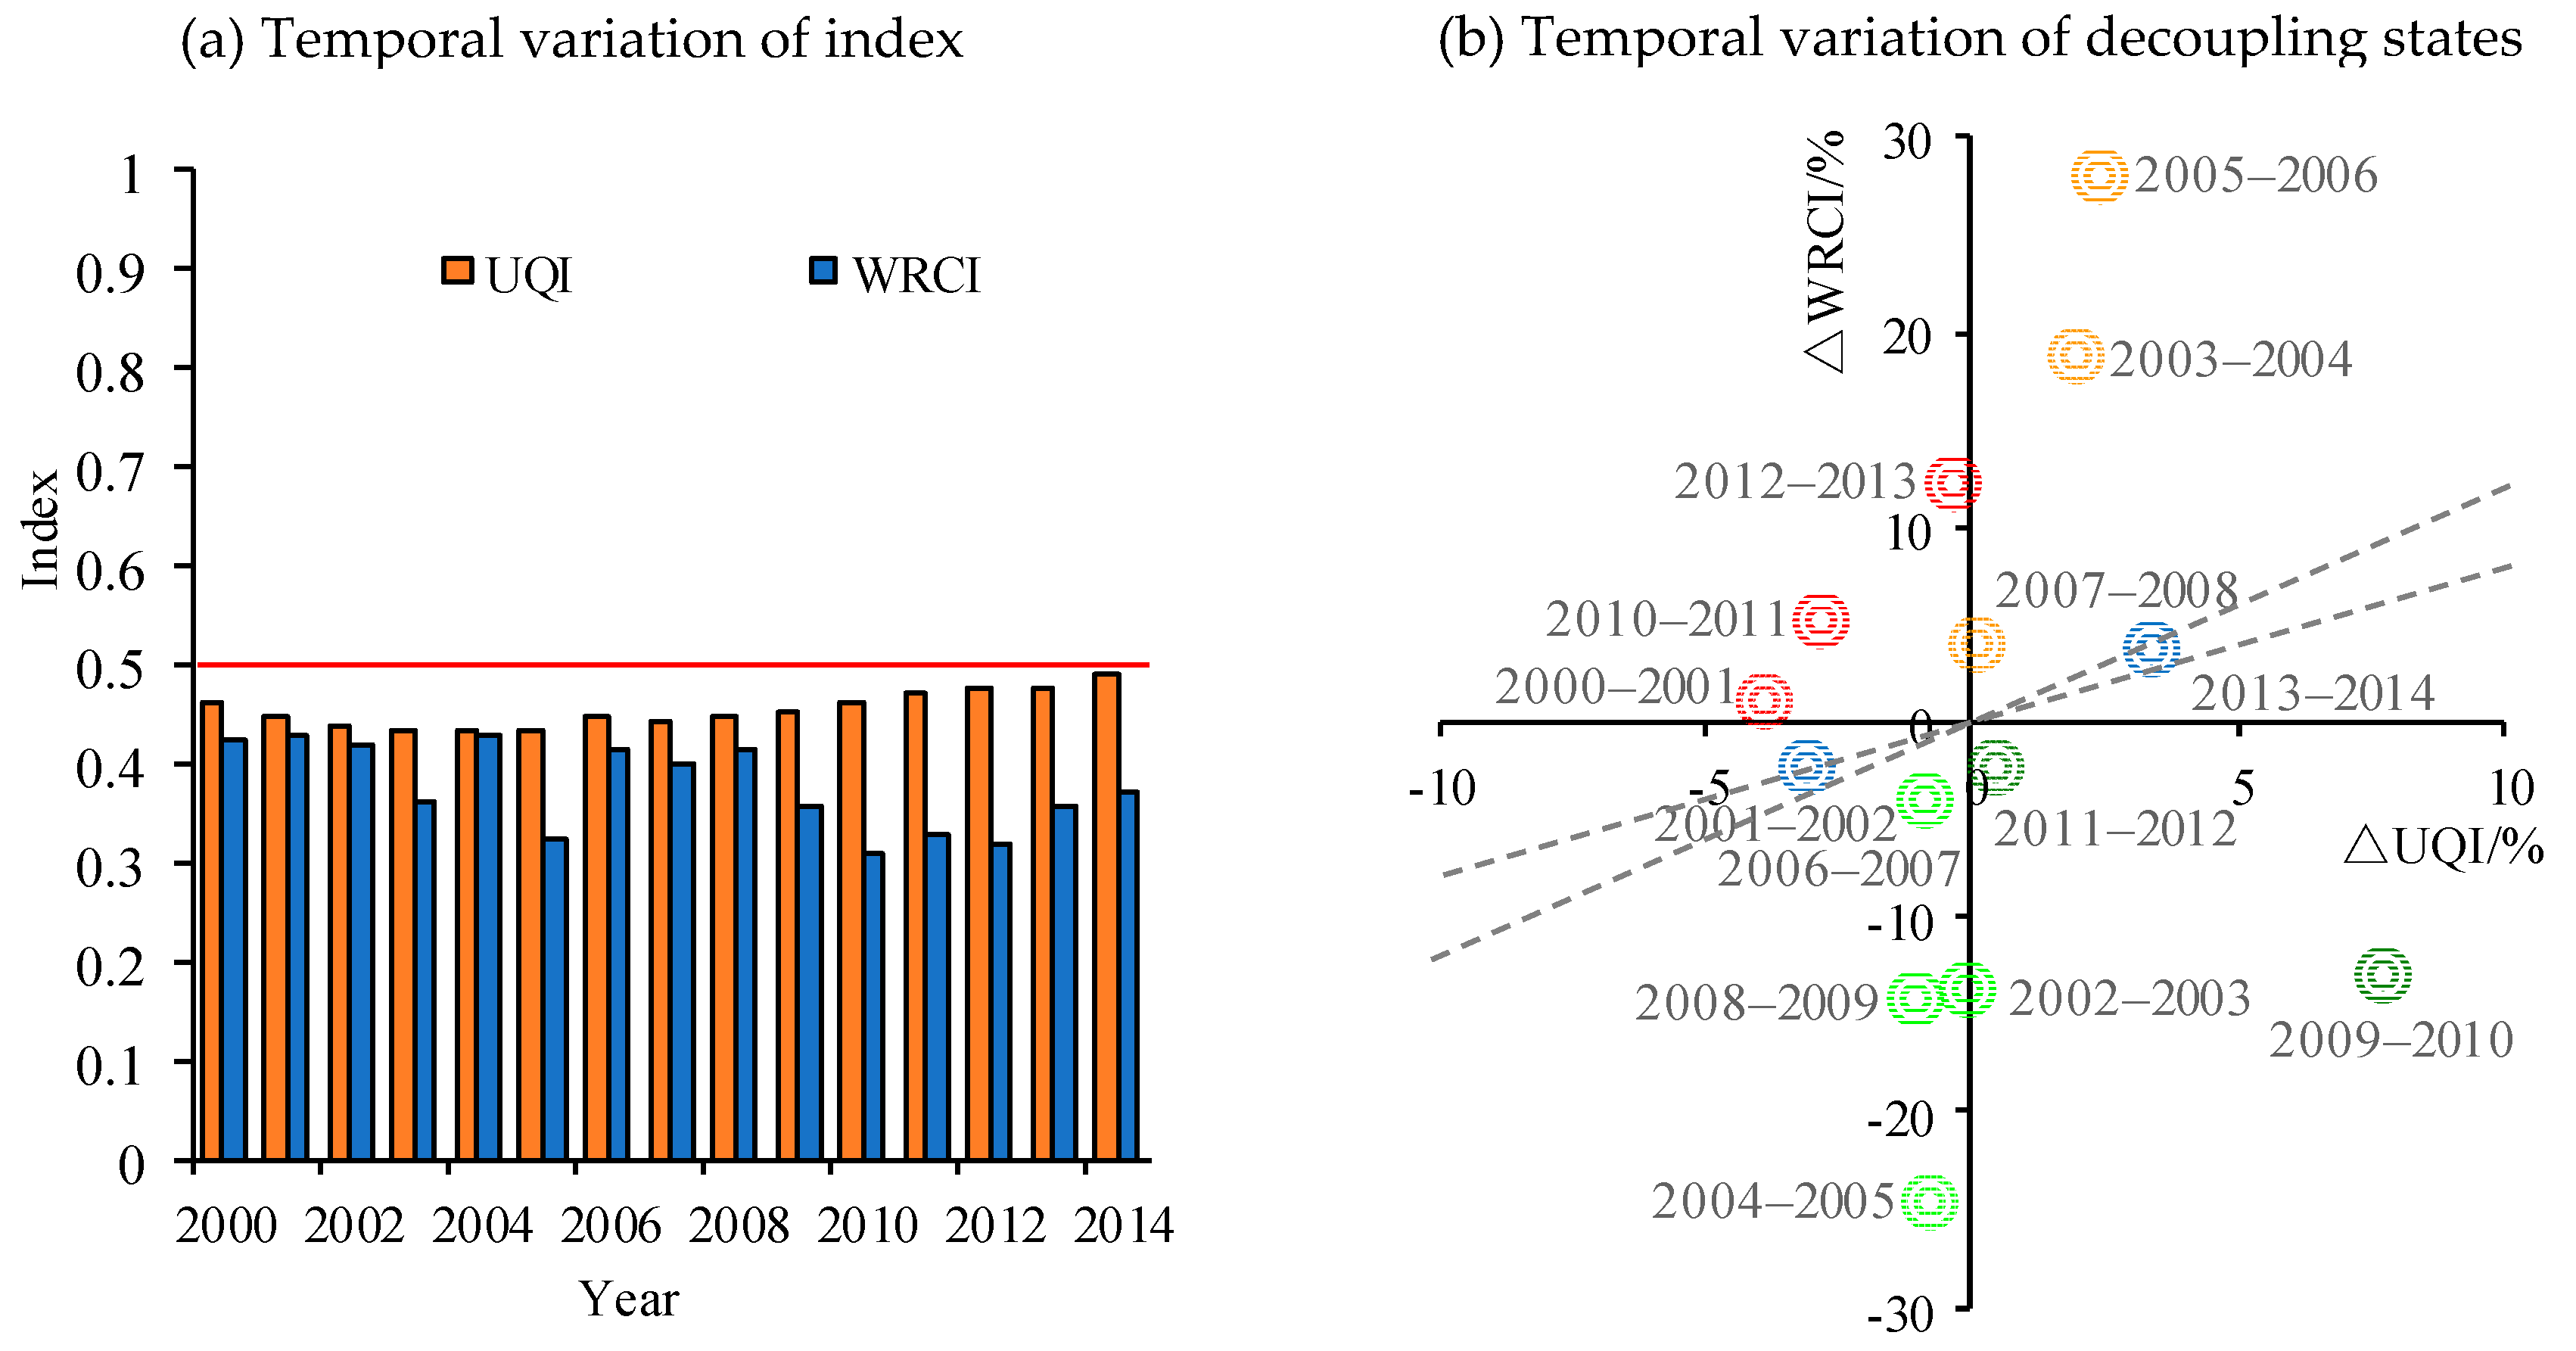
3.1. Temporal Variation of UQI and WRCI of the Whole Northwest China
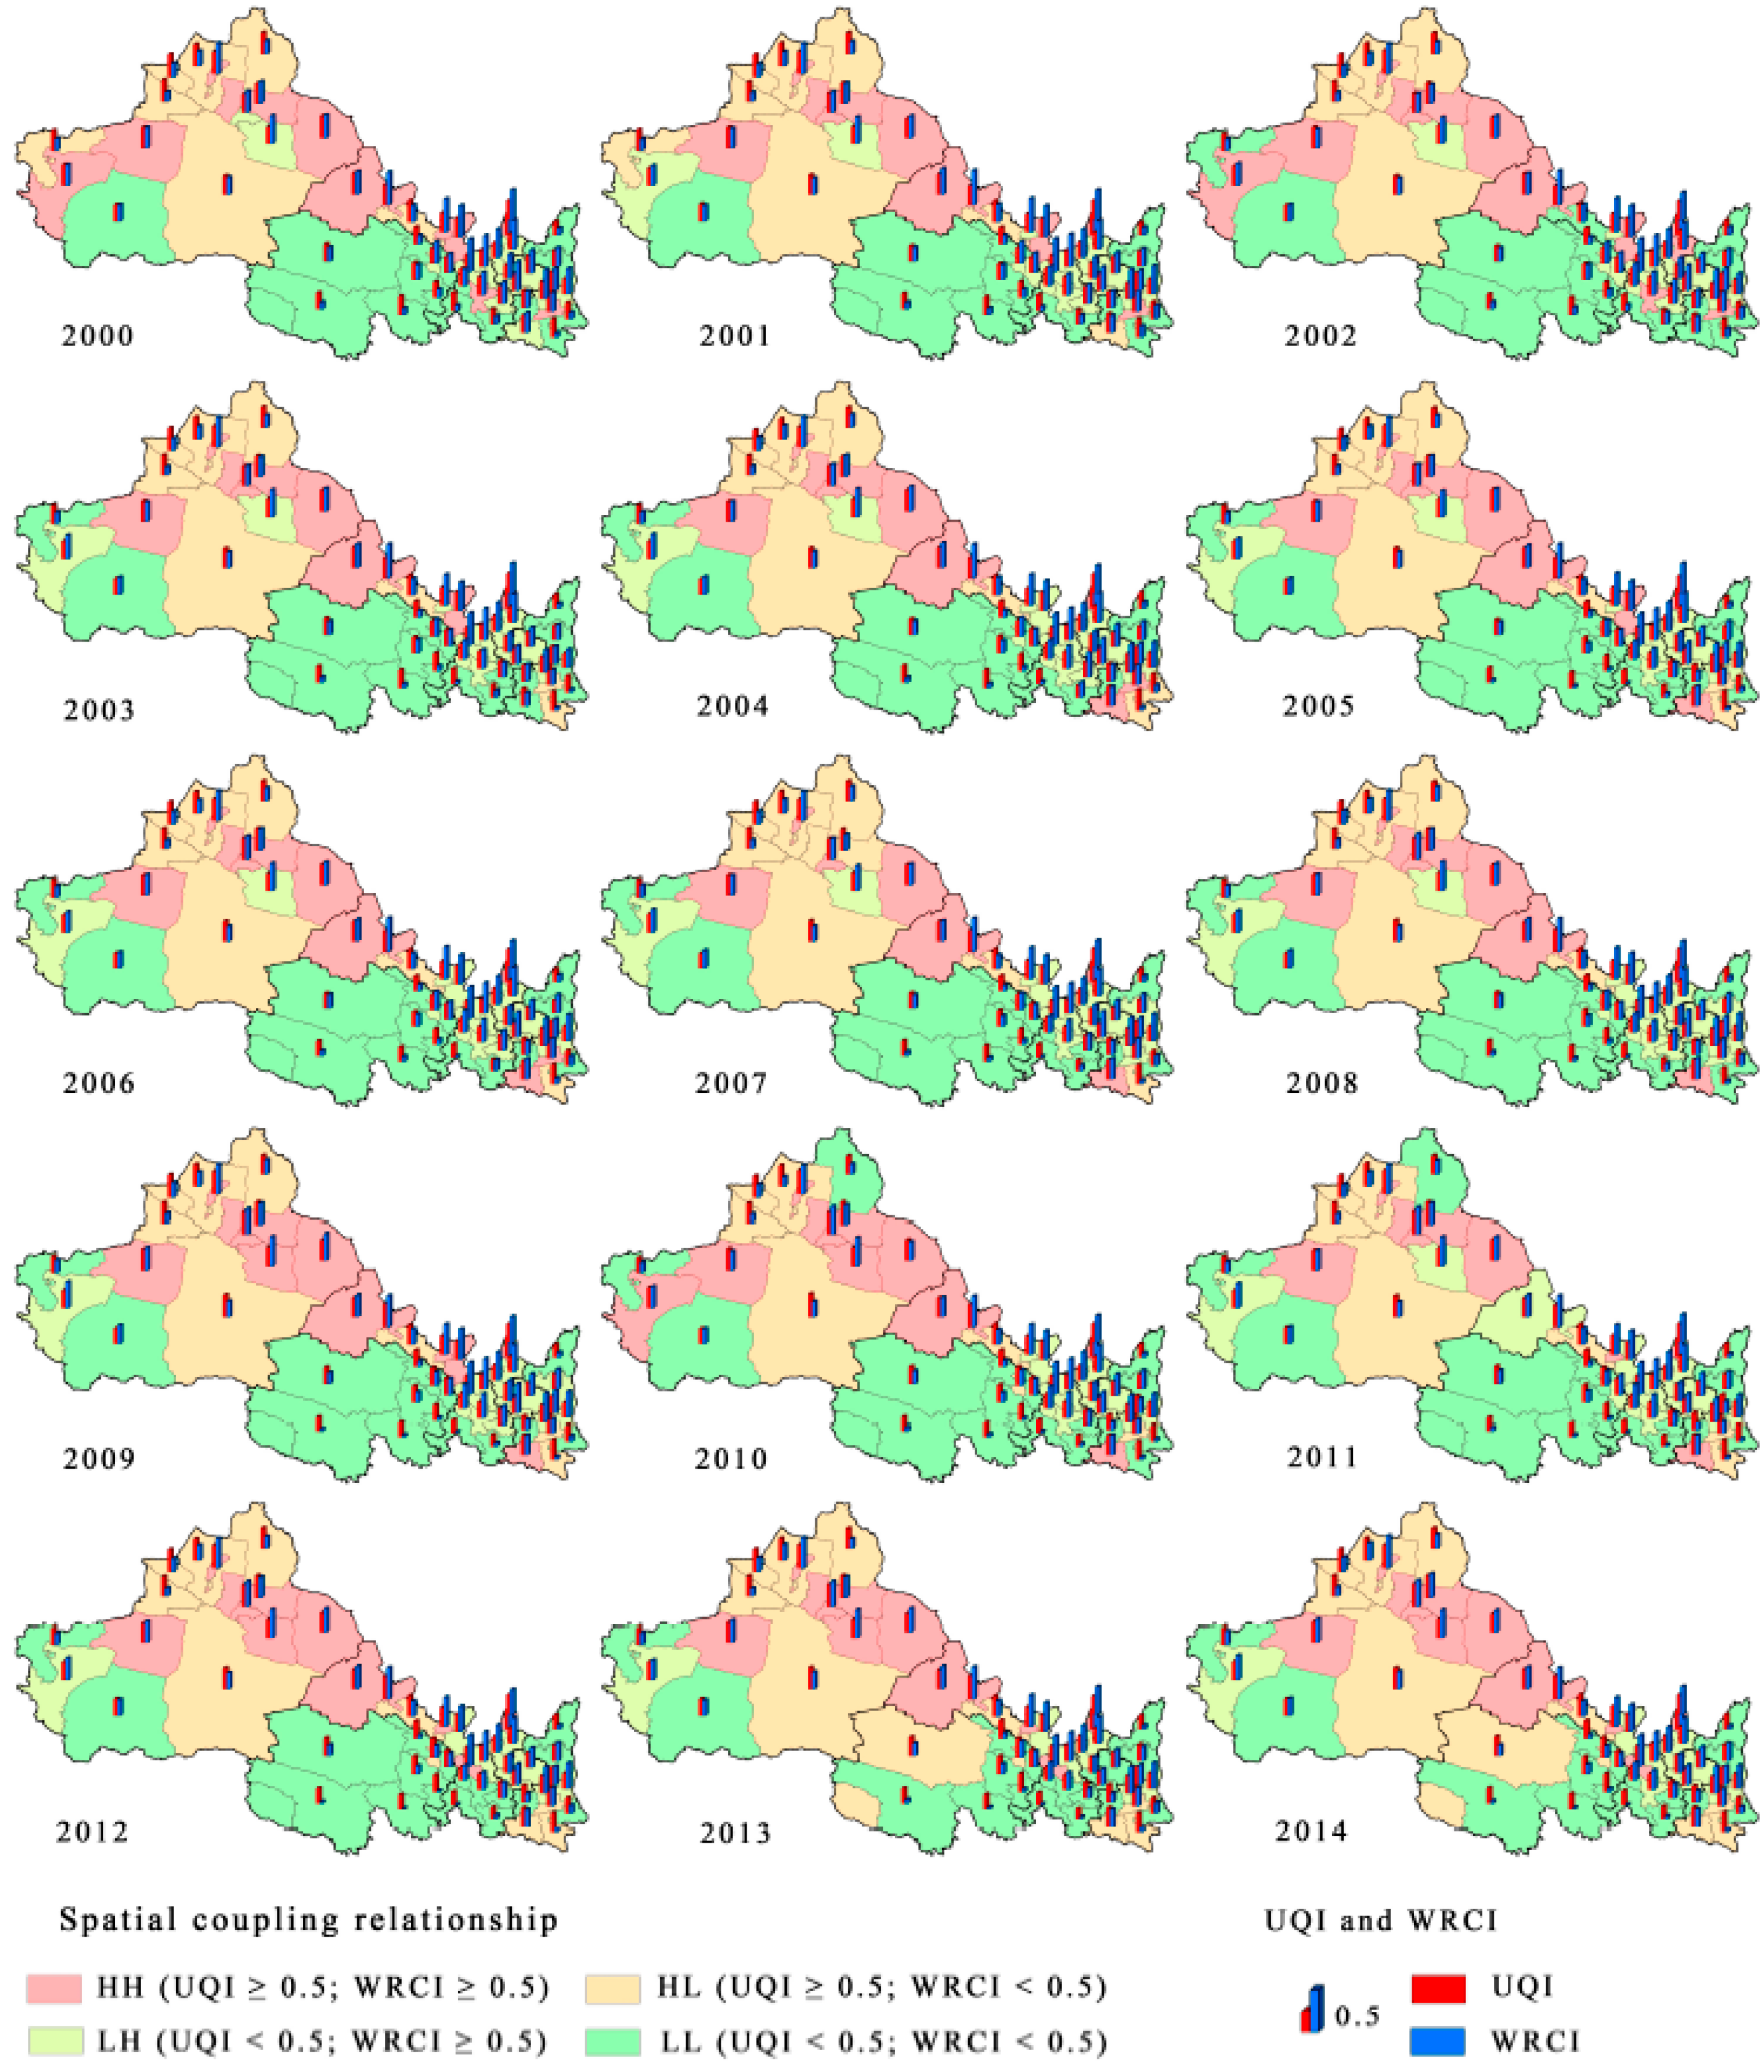
3.2. Spatiotemporal Variation of the Coupling Relationship between UQI and WRCI
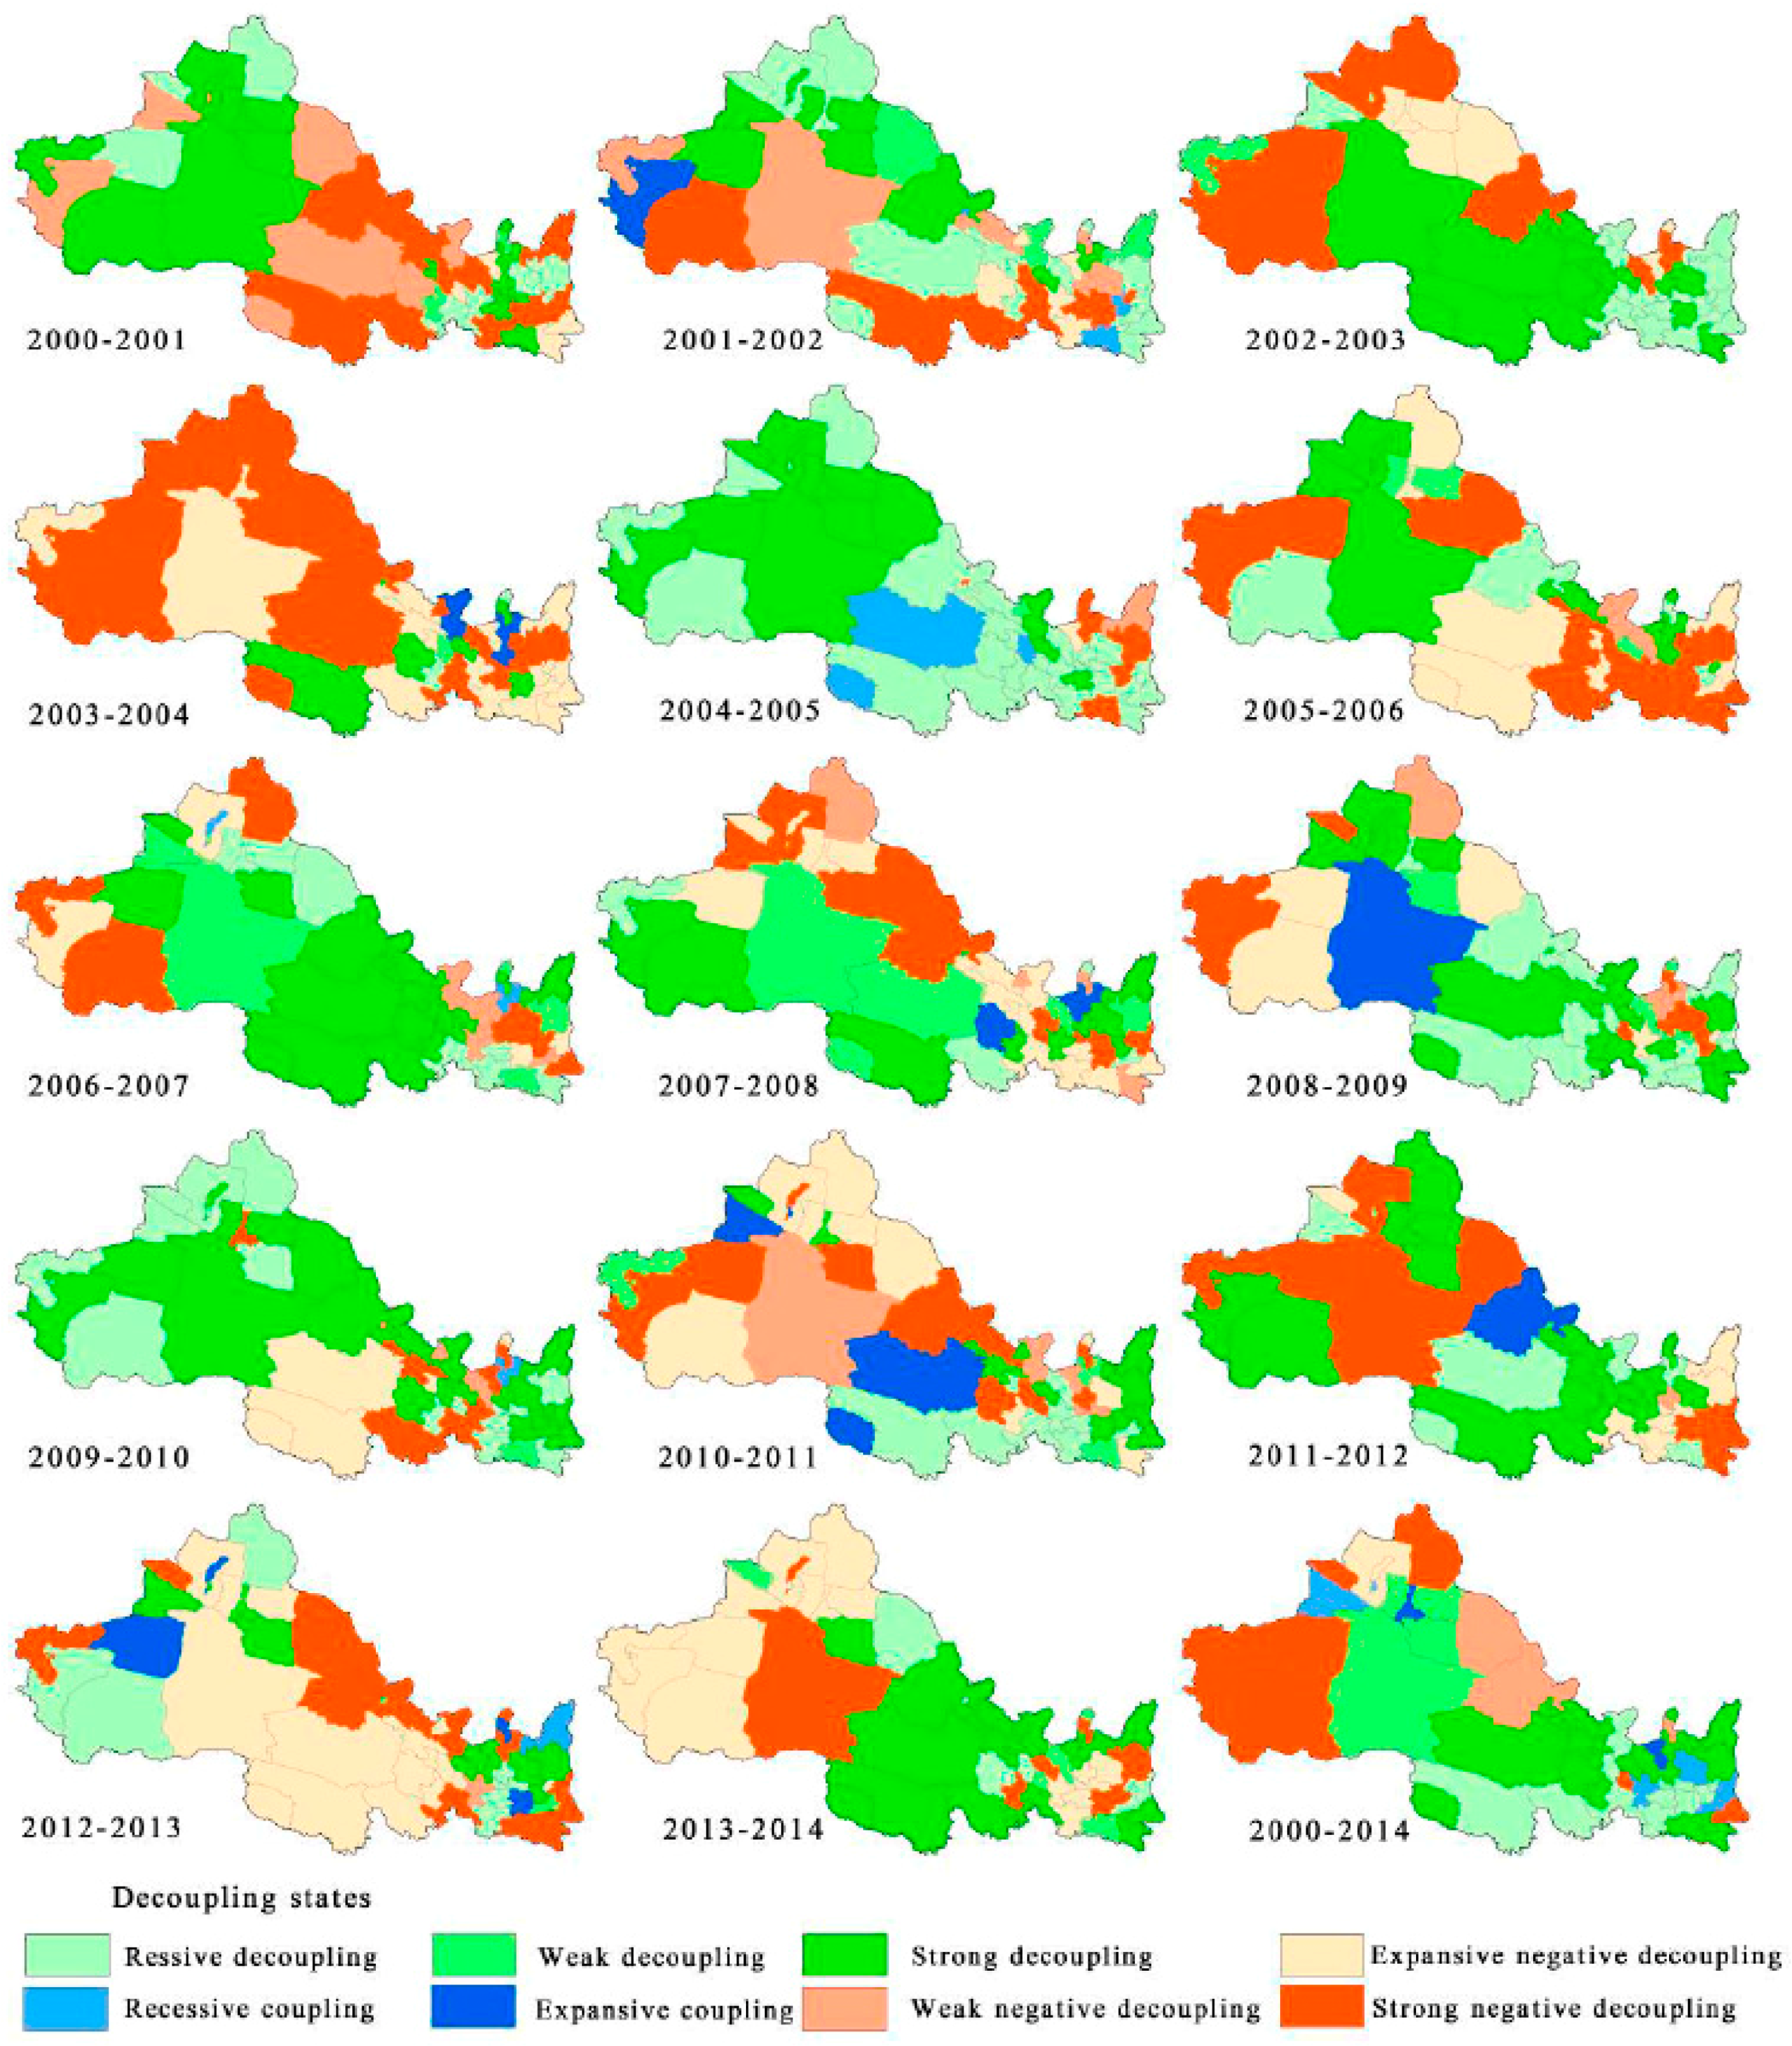
3.3. Spatiotemporal Variation of the Decoupling Relationship between UQI and WRCI
4. Conclusions
Acknowledgments
Author Contributions
Conflicts of Interest
References
- Vo, P.L. Urbanization and water management in Ho Chi Minh City, Vietnam-issues, challenges and perspectives. GeoJournal 2007, 70, 75–89. [Google Scholar] [CrossRef]
- Bao, C.; Fang, C.L. Water resources flows related to urbanization in China: Challenges and perspectives for water management and urban development. Water Resour. Manag. 2012, 26, 531–552. [Google Scholar] [CrossRef]
- Martin-Carrasco, F.; Garrote, L.; Iglesias, A.; Mediero, L. Diagnosing causes of water scarcity in complex water resources systems and identifying risk management actions. Water Resour Manag. 2013, 27, 1693–1705. [Google Scholar] [CrossRef]
- Peng, J.; Tian, L.; Liu, Y.; Zhao, M.; Hu, Y.; Wu, J. Ecosystem services response to urbanization in metropolitan areas: Thresholds identification. Sci. Total Environ. 2017, 607–608, 706–714. [Google Scholar] [CrossRef] [PubMed]
- Chitsaz, N.; Azarnivand, A. Water scarcity management in arid regions based on an extended multiple criteria technique. Water Resour. Manag. 2017, 31, 233–250. [Google Scholar] [CrossRef]
- Gleick, P.H. Global freshwater resources: Soft-path solutions for the 21st century. Science 2003, 302, 1524–1528. [Google Scholar] [CrossRef] [PubMed]
- Wan, G.H.; Wang, C. Unprecedented urbanization in Asia and its impacts on the environment. Aust. Econ. Rev. 2014, 47, 378–385. [Google Scholar] [CrossRef]
- Dos Santos, S.; Adams, E.A.; Neville, G.; Wada, Y.; de Sherbinin, A.; Mullin Bernhardt, E.; Adamo, S.B. Urban growth and water access in sub-Saharan Africa: Progress, challenges, and emerging research directions. Sci. Total Environ. 2017, 607–608, 497–508. [Google Scholar] [CrossRef] [PubMed]
- Bao, C.; Fang, C.L. Water resources constraint force on urbanization in water deficient regions: A case study of the Hexi Corridor, arid area of NW China. Ecol. Econ. 2007, 62, 508–517. [Google Scholar] [CrossRef]
- Yang, X.J. China’s rapid urbanization. Science 2013, 342. [Google Scholar] [CrossRef] [PubMed]
- Fang, C.L.; Bao, C.; Huang, J.C. Management implications to water resources constraint force on socio-economic system in rapid urbanization: A case study of Hexi Corridor, NW China. Water Resour. Manag. 2007, 21, 1613–1633. [Google Scholar] [CrossRef]
- Bao, C.; Fang, C.L. Interaction mechanism and control modes on urbanization and water resources exploitation and utilization. Urban Stud. 2010, 17, 19–23. (In Chinese) [Google Scholar]
- Fitzhugh, T.W.; Richter, B.D. Quenching urban thirst: Growing cities and their impacts on freshwater ecosystems. Bioscience 2004, 54, 741–754. [Google Scholar] [CrossRef]
- Braud, I.; Breil, P.; Thollet, F.; Lagouy, M.; Branger, F.; Jacqueminet, C.; Kermadi, S.; Michel, K. Evidence of the impact of urbanization on the hydrological regime of a medium-sized periurban catchment in France. J. Hydrol. 2013, 485, 5–23. [Google Scholar] [CrossRef]
- Bao, C.; Chen, X.J. The driving effects of urbanization on economic growth and water use change in China: A provincial-level analysis in 1997–2011. J. Geogr. Sci. 2015, 25, 530–544. [Google Scholar] [CrossRef]
- Jenerette, G.D.; Larsen, L. A global perspective on changing sustainable urban water supplies. Glob. Planet. Chang. 2006, 50, 202–211. [Google Scholar] [CrossRef]
- Bao, C.; Fang, C.L. Study on the quantitative relationship between urbanization and water resources utilization in the Hexi Corridor. J. Nat. Resour. 2006, 21, 301–310. (In Chinese) [Google Scholar]
- Fang, C.L.; Yu, D.L. China’s New Urbanization: Developmental Paths, Blueprints and Patterns; Science Press: Beijing, China, 2016. [Google Scholar]
- Ye, Y.M. Approach on China’s urbanization quality. China Soft Sci. 2001, 7, 27–31. (In Chinese) [Google Scholar]
- Fang, C.L.; Wang, D.L. Comprehensive measures and improvement of Chinese urbanization development quality. Geogr. Res. 2011, 30, 1931–1946. (In Chinese) [Google Scholar]
- Xu, S.; Yu, T.; Wu, Q. A study of urbanization quality assessment system of county-level cities in China under the regional perspective: Taking the Yangtze delta area as an example. Urban Plan. Int. 2011, 26, 53–58. (In Chinese) [Google Scholar]
- Zhang, C.; Zhang, X.; Wu, Q. Measures and improvement of urbanization development quality in the developed area: A case study of Jiangsu. Econ. Geogr. 2012, 32, 50–55. (In Chinese) [Google Scholar]
- Liang, Z.; Chen, C.; Liu, J.; Mei, L. Tiers features and comprehensive measures of urbanization development quality of Northeast China. Sci. Geogr. Sin. 2013, 33, 926–934. (In Chinese) [Google Scholar]
- Zhou, D.; Xu, J.; Li, W.; Tan, J. Assessing urbanization quality using structure and function analyses: A case study of the urban agglomeration around Hangzhou Bay (UAHB), China. Habitat Int. 2015, 49, 165–176. [Google Scholar] [CrossRef]
- Xue, D.S.; Zeng, X.J. Evaluation of China’s urbanization quality and analysis of its spatial pattern transformation based on the modern life index. Acta Geogr. Sin. 2016, 71, 194–204. (In Chinese) [Google Scholar]
- Bao, C.; Fang, C.L. Integrated assessment model of water resources constraint intensity on urbanization and its application in arid area. J. Geogr. Sci. 2009, 19, 273–286. [Google Scholar] [CrossRef]
- Ding, Y.F.; Tang, D.S.; Dai, H.C.; Wei, Y.H. Human-water harmony index: A new approach to assess the human water relationship. Water Resour. Manag. 2014, 28, 1061–1077. [Google Scholar] [CrossRef]
- Gain, A.K.; Giupponi, C. A dynamic assessment of water scarcity risk in the Lower Brahmaputra River Basin: An integrated approach. Ecol. Indic. 2015, 48, 120–131. [Google Scholar] [CrossRef]
- Pedro-Monzonís, M.; Solera, A.; Ferrer, J.; Estrela, T.; Paredes-Arquiola, J. A review of water scarcity and drought indexes in water resources planning and management. J. Hydrol. 2015, 527, 482–493. [Google Scholar] [CrossRef]
- Falkenmark, M.; Lundqvist, J.; Widstrand, C. Macro-scale water scarcity requires micro-scale approaches. Nat. Res. Forum 1989, 13, 258–267. [Google Scholar] [CrossRef]
- European Environment Agency (EEA). The European Environment—State and Outlook 2005; European Environmental Agency: Copenhagen, Denmark, 2005. [Google Scholar]
- Vörösmarty, C.J.; Douglas, E.M.; Green, P.A.; Revenga, C. Geospatial indicators of emerging water stress: An application to Africa. AMBIO J. Hum. Environ. 2005, 34, 230–236. [Google Scholar] [CrossRef]
- Sullivan, C.A. Calculating a water poverty index. World Dev. 2002, 30, 1195–1210. [Google Scholar] [CrossRef]
- Sullivan, C.A.; Meigh, J.R.; Giacomello, A.M.; Steyl, I. The water poverty index: Development and application at the community scale. Nat. Resour. Forum 2003, 27, 189–199. [Google Scholar] [CrossRef]
- Jia, S.F.; Zhang, J.Y.; Zhang, S.F. Regional water resources stress and water resources security appraisement indicators. Prog. Geogr. 2002, 21, 538–545. (In Chinese) [Google Scholar]
- Liu, M.; Wei, J.H.; Wang, G.Q.; Wang, F. Water resources stress assessment and risk early warning—Case of Hebei Province China. Ecol. Indic. 2017, 73, 358–368. [Google Scholar] [CrossRef]
- Zeng, Z.; Liu, J.; Savenije, H. A simple approach to assess water scarcity integrating water quantity and quality. Ecol. Indic. 2013, 34, 441–449. [Google Scholar] [CrossRef]
- Liang, Y.; Xu, X.Y.; Wang, H.R.; Pang, B.; Liu, X. Research on the degree of water shortage in Yunnan Province based on circulating correction mode. J. Nat. Resour. 2013, 28, 1146–1158. (In Chinese) [Google Scholar]
- Wang, Y.Z.; Shi, G.Q.; Wang, D.S. Study on evaluation indexes of regional water resources carrying capacity. J. Nat. Resour. 2005, 20, 597–604. (In Chinese) [Google Scholar]
- Gong, L.; Jin, C.L. Fuzzy comprehensive evaluation for carrying capacity of regional water resources. Water Resour. Manag. 2009, 23, 2505–2513. [Google Scholar] [CrossRef]
- Xia, J.; Zhu, Y.Z. The measurement of water resources security: A study and challenge on water resources carrying capacity. J. Nat. Resour. 2002, 17, 5–7. (In Chinese) [Google Scholar]
- Jia, X.; Li, C.; Cai, Y.; Wang, X.; Sun, L. An improved method for integrated water security assessment in the Yellow River basin, China. Stoch. Environ. Res. Risk Assess. 2015, 29, 2213–2227. [Google Scholar] [CrossRef]
- Huang, J.C.; Fang, C.L. Analysis of coupling mechanism and rules between urbanization and eco-environment. Geogr. Res. 2003, 22, 211–220. (In Chinese) [Google Scholar]
- Fang, C.L.; Wang, J. A theoretical analysis of interactive coercing effects between urbanization and eco-environment. Chin. Geogr. Sci. 2013, 23, 147–162. [Google Scholar] [CrossRef]
- Li, Y.F.; Li, Y.; Zhou, Y.; Shi, Y.; Zhu, X. Investigation of a coupling model of coordination between urbanization and the environment. J. Environ. Manag. 2012, 98, 127–133. [Google Scholar] [CrossRef] [PubMed]
- Wang, S.J.; Ma, H.T.; Zhao, Y.B. Exploring the relationship between urbanization and the eco-environment—A case study of Beijing-Tianjin-Hebei region. Ecol. Indic. 2014, 45, 171–183. [Google Scholar] [CrossRef]
- Ding, L.; Zhao, W.T.; Huang, Y.L.; Liu, C. Research on the coupling coordination relationship between urbanization and the air environment: A case study of the area of Wuhan. Atmosphere 2015, 6, 1539–1558. [Google Scholar] [CrossRef]
- Zhao, Y.; Wang, S.; Zhou, C. Understanding the relation between urbanization and the eco-environment in China’s Yangtze River Delta using an improved EKC model and coupling analysis. Sci. Total Environ. 2016, 571, 862–875. [Google Scholar] [CrossRef] [PubMed]
- He, J.Q.; Wang, S.J.; Liu, Y.Y.; Ma, H.T.; Liu, Q.Q. Examining the relationship between urbanization and the eco-environment using a coupling analysis: Case study of Shanghai, China. Ecol. Indic. 2017, 77, 185–193. [Google Scholar] [CrossRef]
- Organization for Economic Cooperation and Development (OECD). Indicators to Measure Decoupling of Environmental Pressure from Economic Growth; OECD Report; Organization for Economic Cooperation and Development: Paris, France, 2002. [Google Scholar]
- Zhu, H.; Li, W.; Yu, J.; Sun, W.; Yao, X. An analysis of decoupling relationships of water uses and economic development in the two provinces of Yunnan and Guizhou during the first ten years of implementing the Great Western Development Strategy. Procedia Environ. Sci. 2013, 18, 864–870. [Google Scholar] [CrossRef]
- Conrad, E.; Cassar, L.F. Decoupling economic growth and environmental degradation: Reviewing progress to date in the small island state of Malta. Sustainability 2014, 6, 6729–6750. [Google Scholar] [CrossRef]
- Yu, Y.; Zhou, L.; Zhou, W.; Ren, H.; Kharrazi, A.; Ma, T.; Zhu, B. Decoupling environmental pressure from economic growth on city level: The case study of Chongqing in China. Ecol. Indic. 2017, 75, 27–35. [Google Scholar] [CrossRef]
- Tapio, P. Towards a theory of decoupling: Degrees of decoupling in the EU and the case of road traffic in Finland between 1970 and 2001. J. Transp. Policy 2005, 12, 137–151. [Google Scholar] [CrossRef]
- Zhou, X.; Zhang, M.; Zhou, M.; Zhou, M. A comparative study on decoupling relationship and influence factors between China’s regional economic development and industrial energy-related carbon emissions. J. Clean. Prod. 2017, 142, 783–800. [Google Scholar] [CrossRef]
- Zhao, X.; Zhang, X.; Li, N.; Shao, S.; Geng, Y. Decoupling economic growth from carbon dioxide emissions in China: A sectoral factor decomposition analysis. J. Clean. Prod. 2017, 142, 3500–3516. [Google Scholar] [CrossRef]
- Wang, Y.; Xie, T.; Yang, S. Carbon emission and its decoupling research of transportation in Jiangsu Province. J. Clean. Prod. 2017, 142, 907–914. [Google Scholar] [CrossRef]
- Deng, H.; Chen, Y.; Shi, X.; Li, W.; Wang, H.; Zhang, S.; Fang, G. Dynamics of temperature and precipitation extremes and their spatial variation in the arid region of Northwest China. Atmos. Res. 2014, 138, 346–355. [Google Scholar] [CrossRef]
- Yang, Y.; Feng, Z.; Huang, H.Q.; Lin, Y. Climate-induced changes in crop water balance during 1960–2001 in Northwest China. Agric. Ecosyst. Environ. 2008, 127, 107–118. [Google Scholar] [CrossRef]
- Shi, C.; Zhan, J. An input-utput table based analysis on the virtual water by sectors with the five northwest provinces in China. Phys. Chem. Earth 2015, 79–82, 47–53. [Google Scholar] [CrossRef]
- Chen, C. Calculation of various Gini coefficients from different regions in China and analysis using the nonparametric model. J. Quant. Tech. Econ. 2007, 24, 133–142. (In Chinese) [Google Scholar]
- Mendoza, G.A.; Prabhu, R. Fuzzy methods for assessing criteria and indicators of sustainable forest management. Ecol. Indic. 2004, 3, 227–236. [Google Scholar] [CrossRef]
- Zhu, H.; Lei, G.; Wu, X.; Liu, Q. Urbanization quality evaluation based on early warning indicator system: Deepening of urbanization quality evaluation system in Shandong province. Urban Stud. 2011, 18, 7–12. (In Chinese) [Google Scholar]
- Hong, X.J. Acceptable range and security line of Gini coefficient. Stat. Res. 2007, 24, 84–87. (In Chinese) [Google Scholar]
- Wu, P.L. A quantificational and comparative analysis on the regional water resource pressure and water scarcity in China. J. Northwest Sci-Tech Univ. Agric. For. 2005, 33, 43–149. (In Chinese) [Google Scholar]
- Bao, C.; He, D.M. Spatiotemporal characteristics of water resources exploitation and policy implications in the Beijing-Tianjin-Hebei Urban Agglomeration. Prog. Geogr. 2017, 36, 58–67. (In Chinese) [Google Scholar]
- Saaty, T.L. How to make a decision: The analytic hierarchy process. Eur. J. Oper. Res. 1990, 48, 9–26. [Google Scholar] [CrossRef]
- Saaty, T.L. Fundamentals of Decision Making and Priority Theory with the Analytic Hierarchy Process; RWS Publications: Pittsburgh, PA, USA, 2000. [Google Scholar]
- Saaty, T.L. Decision making with the analytic hierarchy process. Int. J. Serv. Sci. 2008, 1, 83–98. [Google Scholar] [CrossRef]
- Ho, W. Integrated analytic hierarchy process and its applications—A literature review. Eur. J. Oper. Res. 2008, 186, 211–228. [Google Scholar] [CrossRef]
- Sutadian, A.D.; Muttil, N.; Yilmaz, A.G.; Perera, B.J.C. Using the Analytic Hierarchy Process to identify parameter weights for developing a water quality index. Ecol. Indic. 2017, 75, 220–233. [Google Scholar] [CrossRef]
- Fang, C.L.; Mao, H.Y. A system of indicators for regional development planning. Acta Geogr. Sin. 1999, 54, 410–419. (In Chinese) [Google Scholar]
- Zhang, Z.X. Decoupling China’s carbon emissions increase from economic growth: An economic analysis and policy implications. World Dev. 2000, 28, 739–752. [Google Scholar] [CrossRef]
- Zang, Z.; Zou, X.; Xi, X.; Zhang, Y.; Zheng, D.F.; Sun, C.Z. Quantitative characterization and comprehensive evaluation of regional water resources using the Three Red Lines method. J. Geogr. Sci. 2016, 26, 397–414. [Google Scholar] [CrossRef]
- Ge, M.; Wu, F.; Chen, X. A coupled allocation for regional initial water rights in Dalinghe Basin, China. Sustainability 2017, 9, 428–443. [Google Scholar] [CrossRef]


| Target | Primary Indicators | Secondary Indicators |
|---|---|---|
| UQI | Urban economic development quality (0.2986) | Per capita GDP (0.2052) |
| Ratio of tertiary industry value added to GDP (0.2596) | ||
| GDP per unit of total fixed asset investment (0.2638) | ||
| GDP per unit of land area (0.2714) | ||
| Urban social development quality (0.1762) | Per capita urban road area (0.2301) | |
| Per capita mobile phone number (0.2301) | ||
| Ratio of R&D expenditure to GDP (0.1877) | ||
| Ratio of education expenditure to fiscal expenditure (0.1790) | ||
| Medical beds per 10,000 persons (0.1730) | ||
| Urban eco-environmental quality (0.2132) | Green coverage rate of built-up area (0.3229) | |
| Excellent rate of urban air quality (0.2426) | ||
| Wastewater discharge per unit of land area (0.2172) | ||
| Waste gas emission per unit of land area (0.2172) | ||
| Rural-urban and regional integration quality (0.3120) | Urban-rural income gap (0.4481) | |
| Urban-rural labor productivity gap (0.2924) | ||
| Regional disparity of economic development (0.2595) | ||
| WRCI | Natural endowment of water resources (0.4830) | Per capita water resources (0.5000) |
| Water resources converted into the depth of surface runoff (0.5000) | ||
| Exploitation and utilization degree of water resources (0.3010) | Water resources utilization ratio (0.4481) | |
| Surface water resources exploitation ratio (0.2595) | ||
| Groundwater resources exploitation ratio (0.2924) | ||
| Exploitation and utilization efficiency of water resources (0.2160) | Water utilization per unit of GDP (0.3697) | |
| Water utilization per unit of agricultural value-added (0.2058) | ||
| Water utilization per unit of industrial value-added (0.2163) | ||
| Per capita domestic water consumption (0.2081) |
| Type or Level | Low Lower Medium Higher High | |||||
|---|---|---|---|---|---|---|
| UQI and its primary indicators | 0 | 0.2 | 0.4 | 0.6 | 0.8 | 1 |
| Per capita GDP (104 yuan) ① | 0 | 0.8 | 1.6 | 2.4 | 3.2 | 4.5 |
| Ratio of tertiary industry value-added to GDP (%) ② | 0 | 15 | 30 | 45 | 60 | 75 |
| GDP per unit of total fixed asset investment ③ | 0 | 0.6 | 1.2 | 1.8 | 2.4 | 3 |
| GDP per unit of land area (104 yuan/km2) ③ | 0 | 50 | 200 | 350 | 500 | 1500 |
| Per capita urban road area (m2) ④ | 0 | 5 | 10 | 15 | 20 | 25 |
| Per capita mobile phone number ③ | 0 | 0.3 | 0.5 | 1 | 1.5 | 2 |
| Ratio of R&D expenditure to GDP (%) ④ | 0 | 0.5 | 1 | 1.5 | 2 | 2.5 |
| Ratio of education expenditure to fiscal expenditure (%) ⑤ | 0 | 6 | 12 | 18 | 24 | 30 |
| Medical beds per 10,000 persons ③ | 0 | 20 | 40 | 60 | 80 | 100 |
| Green coverage rate of built-up area (%) ② | 0 | 15 | 25 | 35 | 45 | 55 |
| Excellent rate of urban air quality (%) ④ | 0 | 60 | 70 | 80 | 90 | 100 |
| Wastewater discharge per unit of land area (104 t/km2) ③ | 5 | 3 | 2 | 1 | 0.5 | 0 |
| Waste gas emission per unit of land area (108 m3/km2) ③ | 25 | 10 | 6 | 3 | 0.5 | 0 |
| Urban-rural income gap ② ④ | 4.8 | 4 | 3.2 | 2.4 | 1.6 | 1.2 |
| Urban-rural labor productivity gap ③ | 20 | 9.6 | 7.2 | 4.8 | 2.4 | 1 |
| Regional disparity of economic development ⑥ | 1 | 0.5 | 0.4 | 0.3 | 0.2 | 0 |
| WRCI | 0 | 0.2 | 0.4 | 0.6 | 0.8 | 1 |
| Natural endowment of water resources | 1 | 0.8 | 0.6 | 0.4 | 0.2 | 0 |
| Exploitation and utilization degree of water resources | 0 | 0.2 | 0.4 | 0.6 | 0.8 | 1 |
| Exploitation and utilization efficiency of water resources | 1 | 0.8 | 0.6 | 0.4 | 0.2 | 0 |
| Per capita water resources (m3) ⑦ | 3000 | 2200 | 1700 | 1000 | 500 | 0 |
| Water resources converted into the depth of surface runoff (mm) ⑧ | 200 | 150 | 100 | 70 | 40 | 0 |
| Water resources utilization ratio (%) ⑨ | 0 | 20 | 40 | 70 | 100 | 150 |
| Surface water resources exploitation ratio (%) ⑨ | 0 | 20 | 40 | 60 | 80 | 100 |
| Groundwater resources exploitation ratio (%) ⑨ | 0 | 20 | 40 | 60 | 80 | 100 |
| Water utilization per unit of GDP (m3/104 yuan) ③ | 0 | 250 | 500 | 1000 | 1500 | 2000 |
| Water utilization per unit of agricultural value-added (m3/104 yuan) ③ | 0 | 500 | 1000 | 2000 | 5000 | 10,000 |
| Water utilization per unit of industrial value-added (m3/104 yuan) ③ | 0 | 50 | 100 | 200 | 500 | 1000 |
| Per capita domestic water consumption (m3) ③ | 0 | 20 | 40 | 60 | 80 | 100 |
| n | 1 | 2 | 3 | 4 | 5 | 6 | 7 | 8 | 9 |
|---|---|---|---|---|---|---|---|---|---|
| RI | 0.00 | 0.00 | 0.58 | 0.96 | 1.12 | 1.24 | 1.32 | 1.41 | 1.45 |
| Type | Explanation |
|---|---|
| HH | UQI ≥ 0.5, WRCI ≥ 0.5; a uncoordinated relationship and a common problem area with high water stress |
| HL | UQI ≥ 0.5, WRCI < 0.5; a coordinated relationship and a key development area |
| LH | UQI < 0.5, WRCI ≥ 0.5; a very uncoordinated relationship and a key problem area |
| LL | UQI < 0.5, WRCI < 0.5; a uncoordinated relationship and a common problem area with low UQI |
© 2017 by the authors. Licensee MDPI, Basel, Switzerland. This article is an open access article distributed under the terms and conditions of the Creative Commons Attribution (CC BY) license (http://creativecommons.org/licenses/by/4.0/).
Share and Cite
Bao, C.; Zou, J. Exploring the Coupling and Decoupling Relationships between Urbanization Quality and Water Resources Constraint Intensity: Spatiotemporal Analysis for Northwest China. Sustainability 2017, 9, 1960. https://doi.org/10.3390/su9111960
Bao C, Zou J. Exploring the Coupling and Decoupling Relationships between Urbanization Quality and Water Resources Constraint Intensity: Spatiotemporal Analysis for Northwest China. Sustainability. 2017; 9(11):1960. https://doi.org/10.3390/su9111960
Chicago/Turabian StyleBao, Chao, and Jianjun Zou. 2017. "Exploring the Coupling and Decoupling Relationships between Urbanization Quality and Water Resources Constraint Intensity: Spatiotemporal Analysis for Northwest China" Sustainability 9, no. 11: 1960. https://doi.org/10.3390/su9111960
APA StyleBao, C., & Zou, J. (2017). Exploring the Coupling and Decoupling Relationships between Urbanization Quality and Water Resources Constraint Intensity: Spatiotemporal Analysis for Northwest China. Sustainability, 9(11), 1960. https://doi.org/10.3390/su9111960