Both the energy use and summer thermal comfort were calculated to assess the annual performance of a school building. For energy evaluation, the sum of heating, lighting, and other interior electrical equipment, etc. was calculated as the total annual energy consumption (E
t). Cooling energy consumption was not included since the school building models were not equipped with a cooling system in summer. Summer thermal comfort was evaluated using the percentage of discomfort hours averaged for all thermal zones of the school building (C
d). To facilitate comparison, both E
t and C
d were normalized relative to a reference building, which was the rectangular type of building with a room depth of 6 m and no rotation. The WWR was set at 40%, which is the maximum allowable window area prescribed by the energy standard [
50]. The annual energy consumption and percentage of discomfort time of the reference building (E
ref and C
ref) were 54.1 kWh/m
2 and 33.9%, respectively.
3.1. Energy Consumption and Thermal Comfort
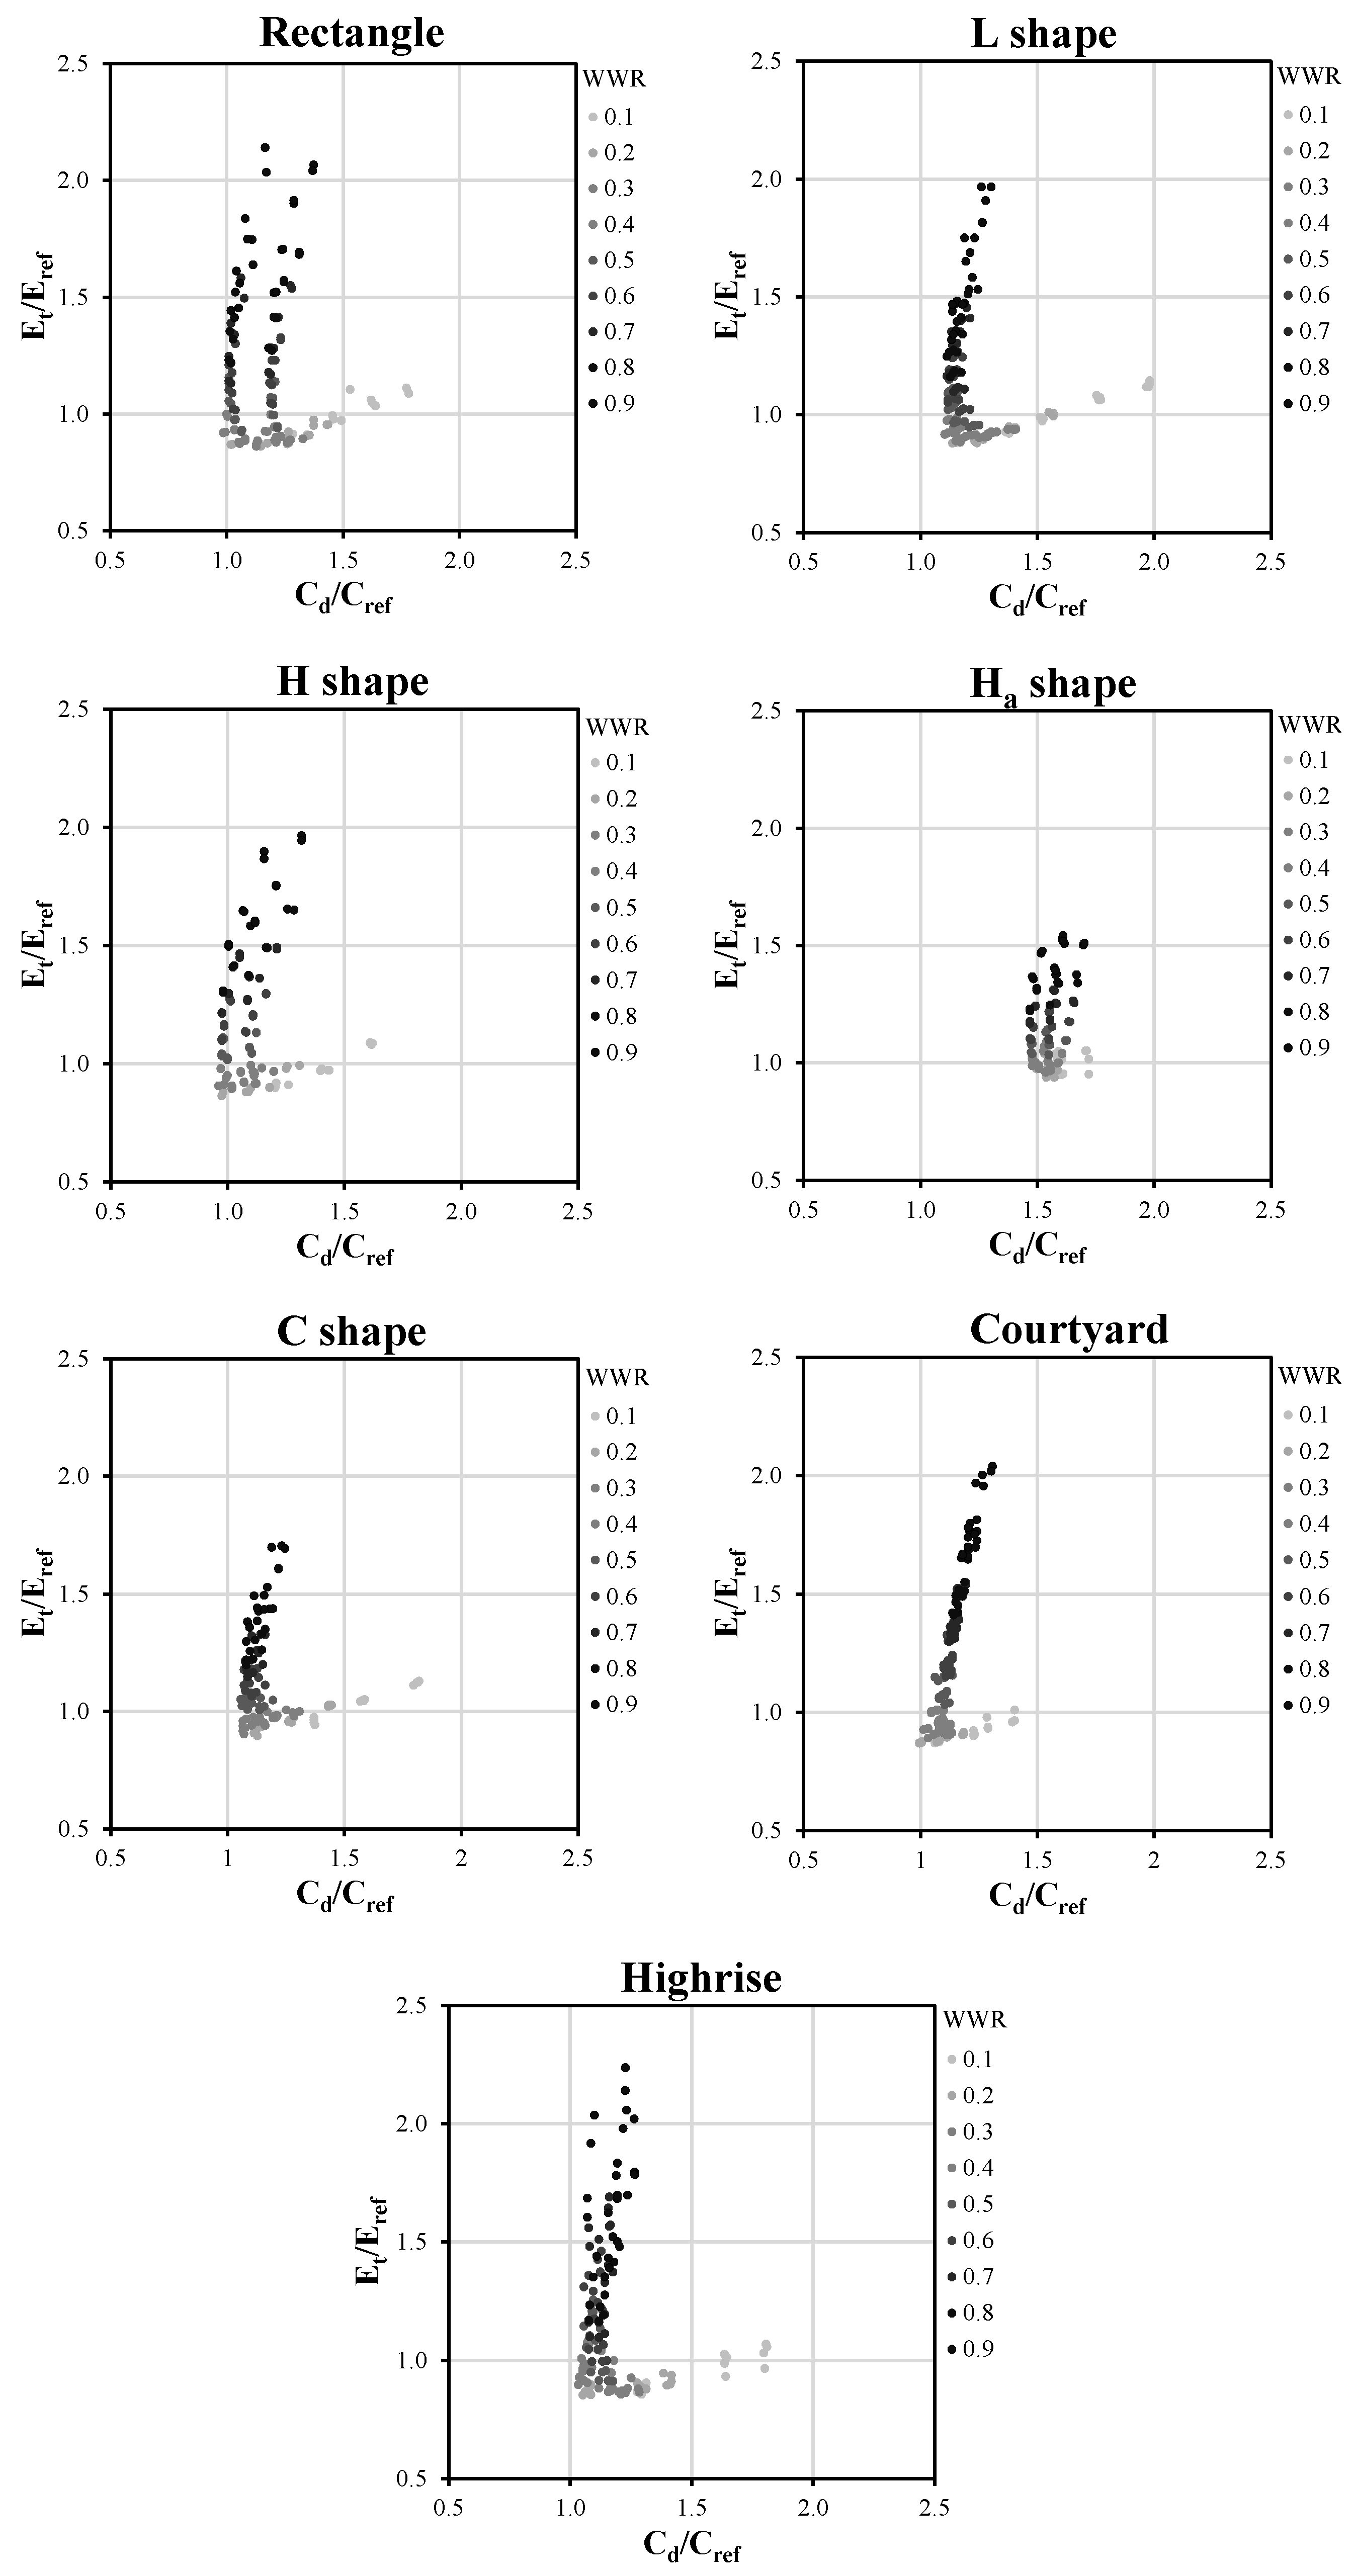
Figure 2 illustrates both the normalized annual total energy consumption (Y-axis) and summer discomfort time (X-axis) in terms of WWR for all building shapes. Each point corresponded to the result of a design combination. The closer the points were to the origin of the axes, the lower the energy consumption and summer discomfort time. The depth of color indicated the size of WWR; a darker color indicated a larger WWR and vice versa.
As seen in
Figure 2, the results of most building shapes were similar to a hyperbolic curve. When WWR increased from 10% to approximately 40%, the summer discomfort time decreased significantly, while the total energy consumption lowered marginally. The increased WWR promoted indoor air circulation and heat dissipation, which leads to the decrease of summer discomfort. Furthermore, the reduced total energy demand was caused by the decreased lighting demand when the WWR increased.
As WWR increased from 40% to 90%, the total energy consumption increased rapidly with a relatively lower rise in summer discomfort time. In this process, the heating demand (the main part of total energy demand) increased rapidly due to the increased high-U-value glazing area, while the lighting demand remained constant as the requirement of illuminance level was met. Therefore, the total energy demand rapidly increased. For summer thermal comfort, oversized windows resulted in a higher air exchange between the indoor and outdoor environment, bringing the indoor temperature closer to the high outdoor temperature, thereby reducing the indoor thermal comfort time.
For all building shapes, a WWR of approximately 40% resulted in both the minimum energy consumption and the summer discomfort time. However, the position and degree of extension of the point sets in the quadrant for various shapes were different. Most obviously, the Ha type was more to the right on the X-axis than the other types, with a minimum Cd/Cref around 1.5. This indicated that the discomfort time of the Ha type was generally higher than other types; however, its range of values on the Y-axis was the smallest, suggesting that its energy consumption overall was lower than the other types. The reason for this is its unique spatial structure; it has a glass-enclosed atrium, which results in more solar heat gain in summer, leading to an increase in discomfort time, while in winter the atrium acts as a solar collector and distributor, contributing to passive heating and decreased heating energy demand.
For the other building shapes, the best design combinations (namely the inflection points of the point set at the bottom left in
Figure 2) had similar values around point (1.0, 1.0) in the coordinate system. Nevertheless, the maximum values of C
d/C
ref and E
t/E
ref were different. The courtyard shape had a smaller (C
d/C
ref)
max (1.4) than the others due to its small building depth, which promotes indoor air convection and helps dissipate indoor heat. In addition, the C shape exhibited the lowest (E
t/E
ref)
max of 1.7. The rectangle and high-rise type had the highest (E
t/E
ref)
max of approximately 2.2, which indicated that for these two types of buildings, inappropriate geometry design led to larger energy consumption than for other building shapes.
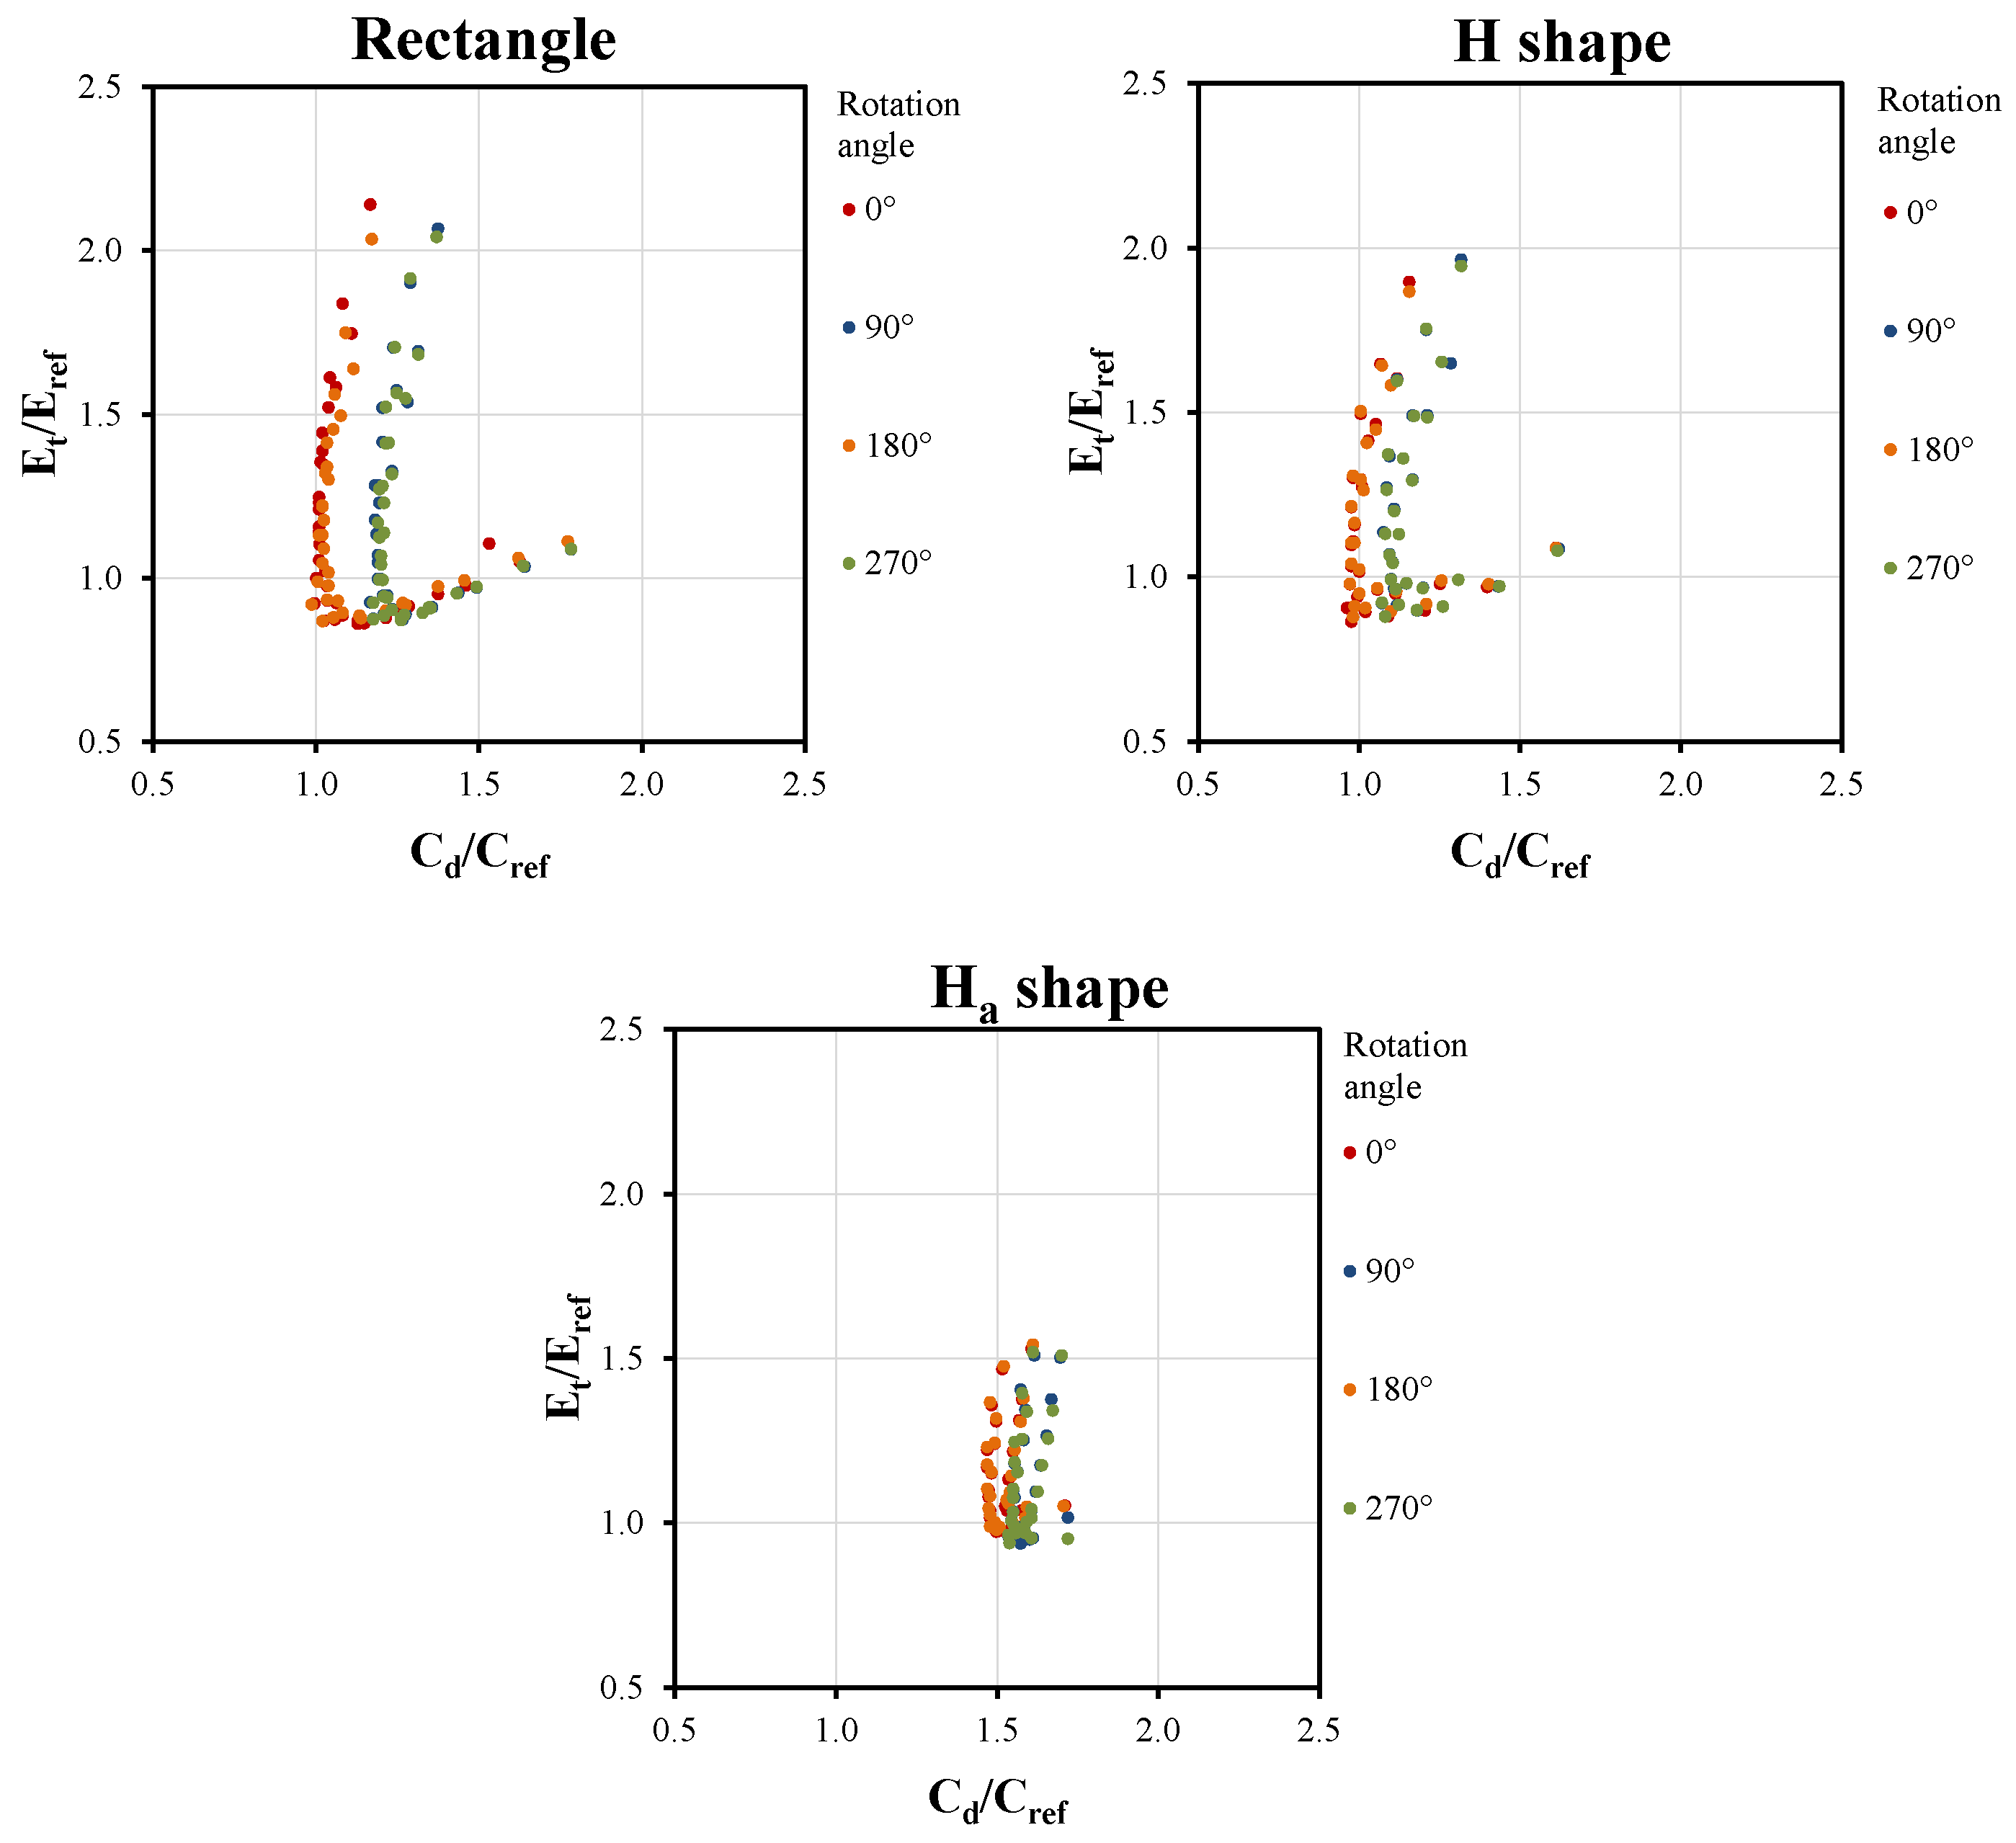
It is also worth noting that the results of the rectangle, H, and H
a shapes were clearly grouped into several lines. This phenomenon was caused by the orientation effect.
Figure 3 distinguishes the design results in terms of four rotation angles, where results consisting of 0° and 180° were more to the left on the X-axis than those of 90° and 270°, indicating that the summer discomfort time at 90° and 270° was relatively higher. The 90° and 270° rotated models had more west-oriented rooms where the direct sunlight time is prolonged in the afternoon, thus increasing indoor temperature. It was particularly obvious for the rectangle shape, since it varied the most in the different-facing rooms due to orientation change.
Table 6 presents the ranges of the south window area ratio for all shapes. The south window area ratio refers to the percentage of windows on the south walls of the building, indicating the geometric anisotropy of the buildings as well as the solar heat gain variation from openings due to orientation change. The rectangle shape had the maximum variation range, followed by the H and H
a shapes. On the other hand, energy demand was much less affected by orientation since the results had no significant deviation on the Y-axis.
Moreover, it can be seen from
Figure 3 that the results of a 0° rotation angle (red dots) were very similar to the results of 180° (orange dots) for the three building types. The results at 90° (blue dots) and 270° (green dots) exhibited the same phenomenon. From a geometric point of view, these two pairs were completely symmetrical, with the only difference being the organization of the internal space. This reflected that the arrangement of internal spaces only had a marginal effect on building energy demand and indoor thermal comfort.
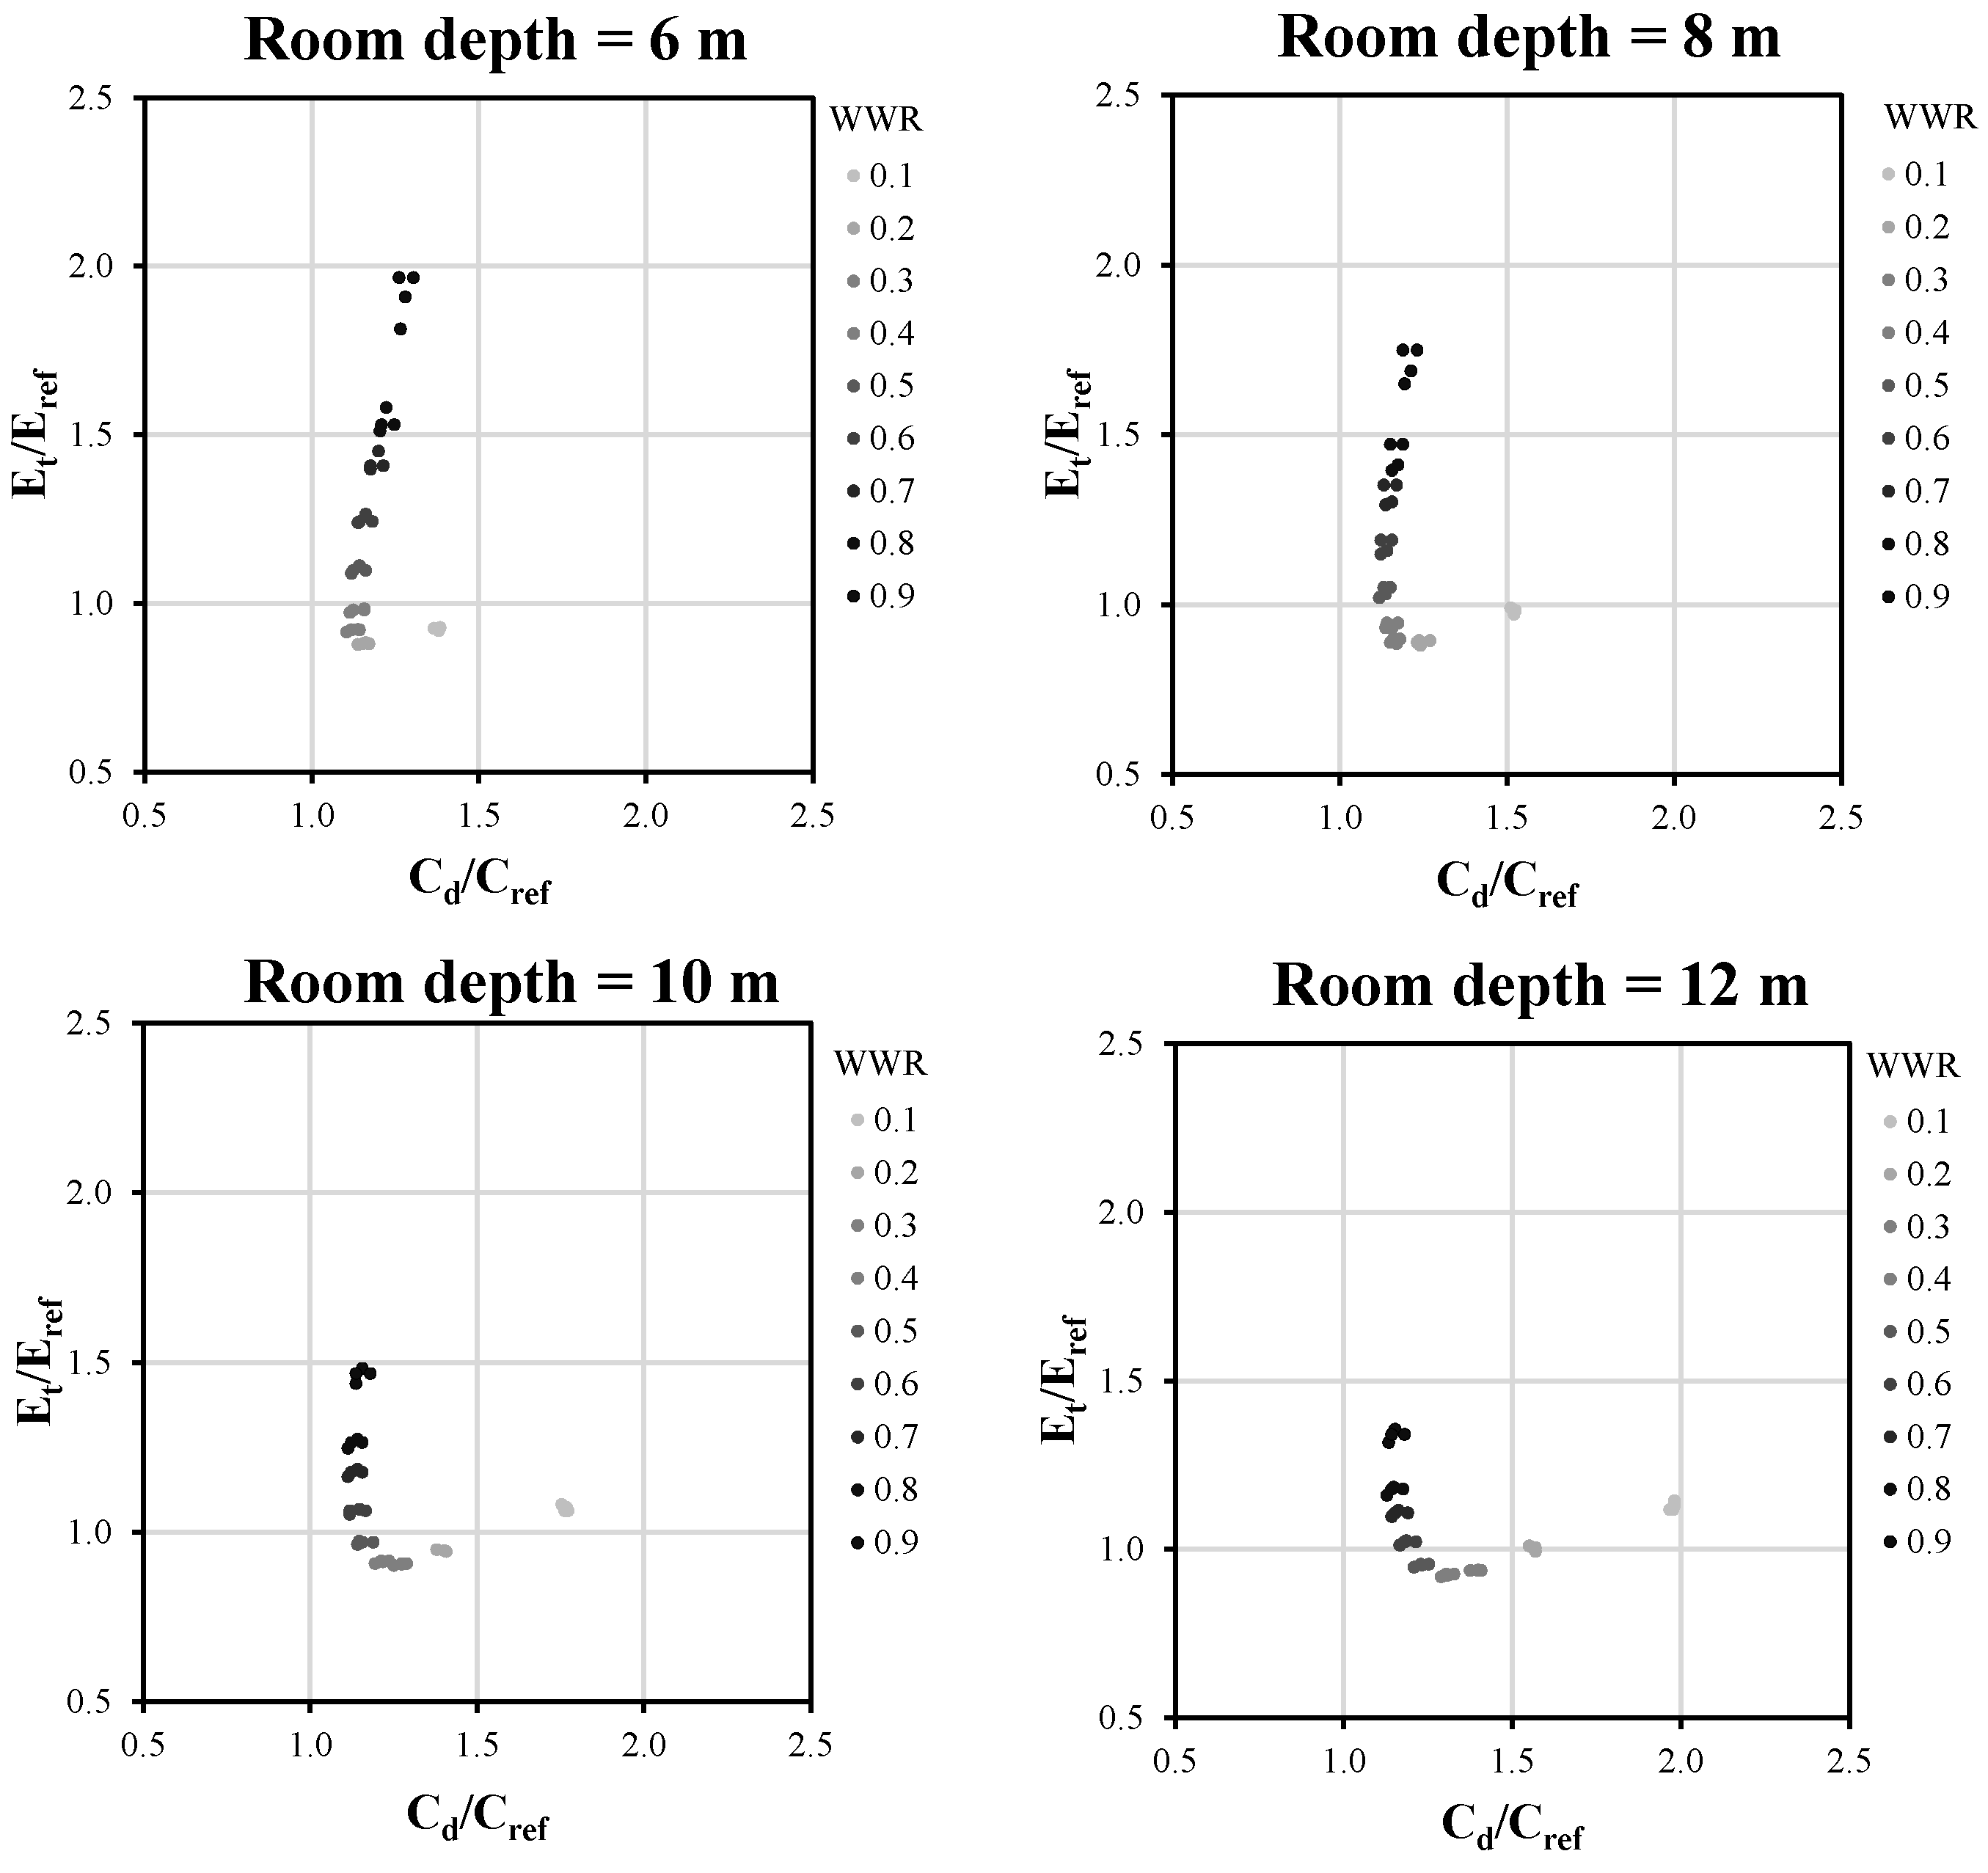
To explore the effect of room depth on energy demand and thermal comfort, the results of the L shape were used as an example and classified according to the four investigated room depths (
Figure 4), and the distribution of the results differed as the room depth increased. The results varied along a hyperbolic trajectory as the room depth varied: when the room became deeper, the points extended towards the X-axis direction; when the room became shallower, the points extended towards the Y-axis direction. For a room depth of 6 m, the maximum E
t/E
ref reached around 2.0 and the maximum C
d/C
ref was only 1.4. When the room depth increased to 12 m, the maximum E
t/E
ref reduced to 1.3 and the maximum C
d/C
ref rose to 2.0. This indicated that the deep-plan buildings generally had a lower energy demand and higher summer discomfort time than the shallower buildings.
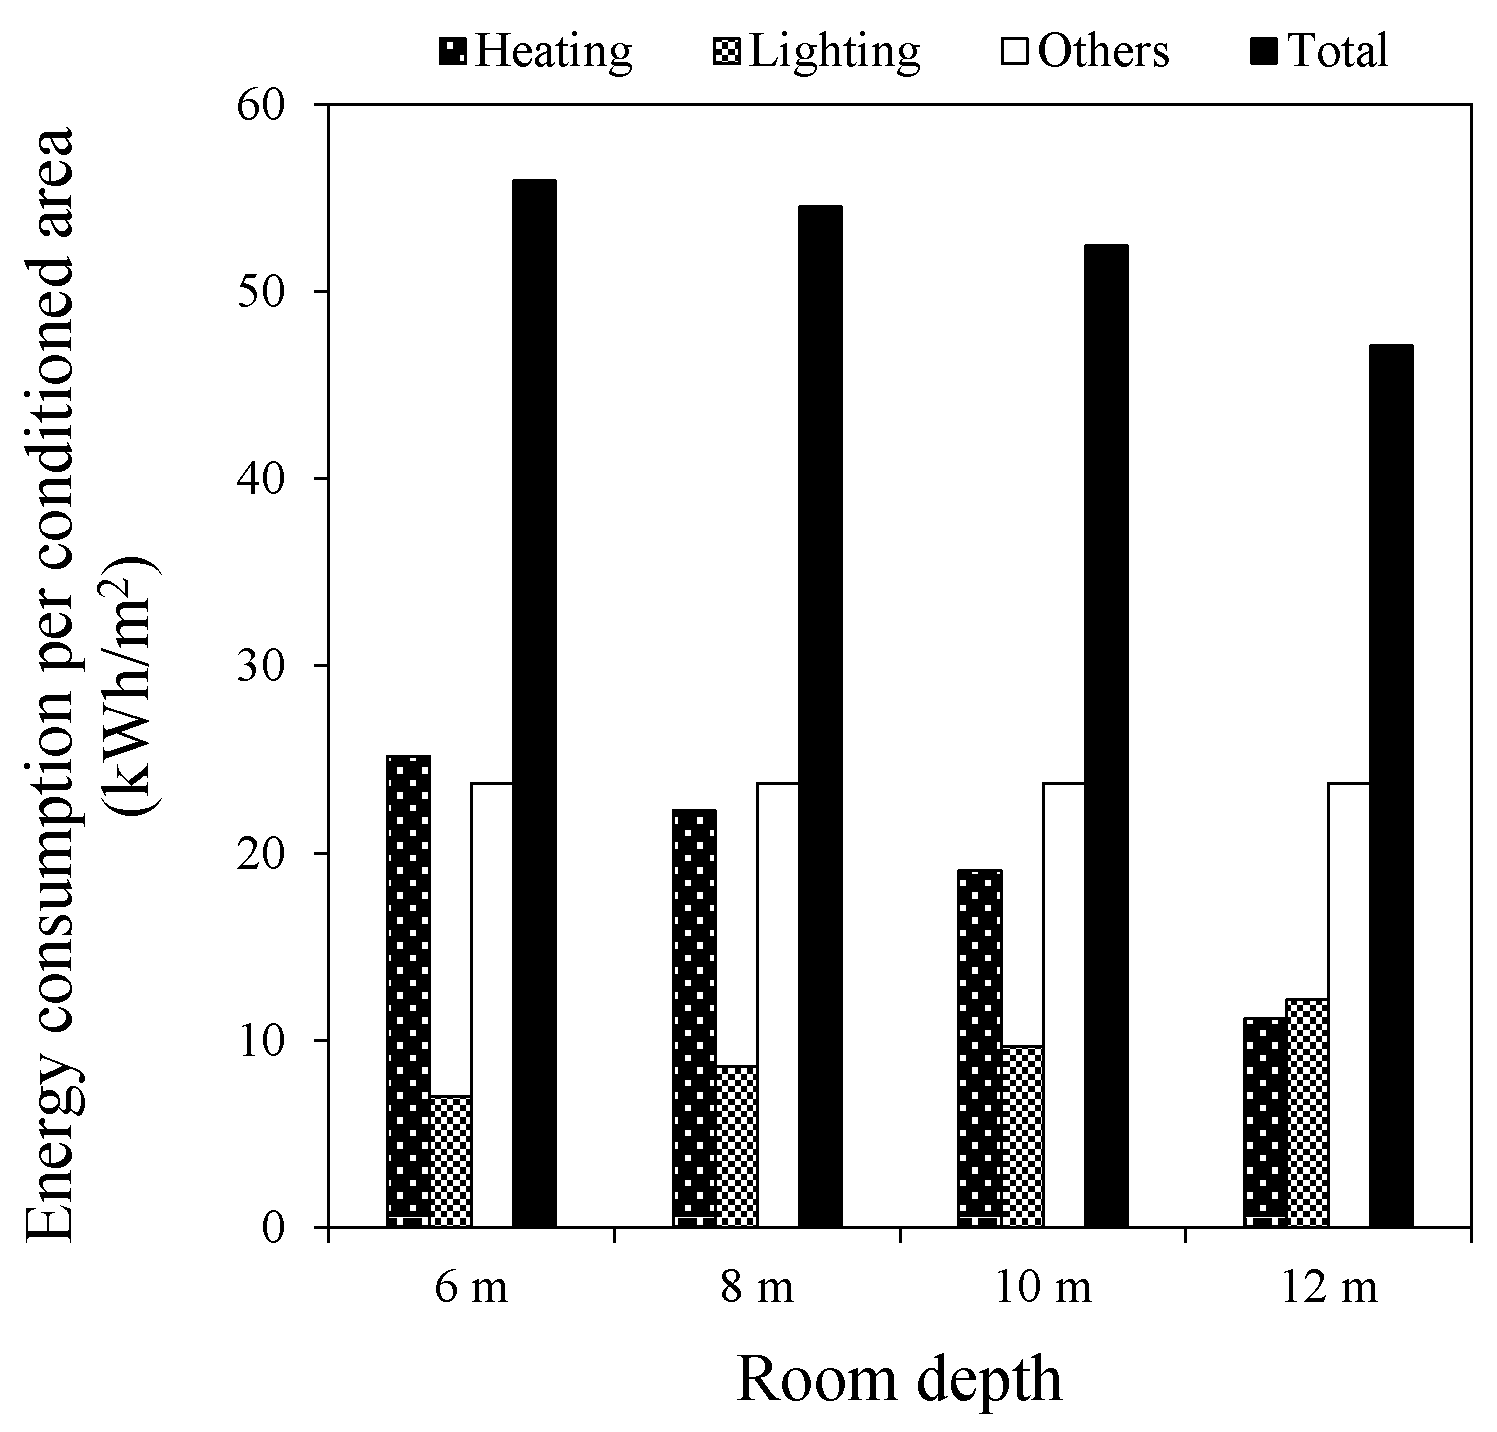
Figure 5 shows the energy consumption for the L shape buildings (south-oriented, 40% WWR) in terms of different room depths. When the room became deeper, the lighting energy increased, while heating and total energy consumption both decreased. The increased lighting energy consumption increased the internal heat gain of buildings. In summer, this contributes to the increase of indoor discomfort time, while in winter the heating energy consumption of buildings can be saved, leading to a decrease in total energy consumption.
Furthermore, it was seen that the WWR distribution differed for various room depths. For the 6-m room depth, the best design solutions, namely the closest points to the origin, had a WWR of 0.3. However, when the room depth increased to 8 m, 10 m, and 12 m, the WWR of the best design solutions changed to 0.4, 0.5, and 0.6, respectively. This indicated that deeper rooms required larger windows to save energy demand and improve thermal comfort. The reason for this is that larger windows reduce the additional lighting demand caused by the increased room depth as well as the internal heat gain from lighting. Moreover, deep plan buildings also need large windows to promote indoor air circulation and dissipate internal heat, thus reducing the summer discomfort time.
To better understand the effect of geometry parameters on energy and thermal comfort, we performed a detailed analysis where combinations of building shape, window to wall ratio, room depth, and orientation parameters showed that an increase occurred both in energy savings and thermal comfort hours when compared to the reference building. The results are summarized in
Table 7, where the bold figures indicate the designs that achieved the maximum energy savings, while the italic figures indicate the designs that achieved the maximum thermal comfort improvement. This can provide a reference for architects on utilizing building geometry as a thermal improvement measure in the design of school buildings.
Three building types—rectangle, H shape, and courtyard—exhibited potential for simultaneously reducing energy consumption and improving summer thermal comfort. The H shape is most likely to save energy and improve thermal comfort, as it has the most parameter combinations that can influence both energy and thermal comfort improvement. Moreover, its maximum energy savings and thermal comfort increase can reach 13.6% and 3.8%, respectively. The courtyard type can also achieve a similar maximum in energy saving (13.1%) and thermal comfort (4.7%), but the passive design options are much less as the WWR is limited to around 20% and the room depth to around 6 m. The design options of the rectangle shape are also limited, and the energy and thermal improvement are less (maximum of 8.0% and 1.4%, respectively). Compared to a previous study described in Reference [
10] where the H shape and courtyard type were not included, the results of this study found that the above two building types performed better than the rectangle type and provided more choices for architects.
On the other hand, energy savings and thermal comfort improvements mainly occurred at 20–40% WWRs, suggesting that higher WWR could cause either more energy consumption or the risk of overheating. Deep rooms (room depth > 8 m) also had fewer possibilities in saving energy and improving thermal comfort improvement. Moreover, energy savings and thermal comfort enhancement occurred more often in the 0° and 180° rotation angles than the 90° and 270° rotation angles.
3.2. Subjective Preferences of Students
In this section, the students’ preference towards the building geometry design was analyzed. The reliability analysis showed that Cronbach α = 0.757, which was considered as acceptable based on the George and Mallery rules of thumb [
51]. For the factor analysis, the Kaiser-Meyer-Olkin (KMO) and Bartlett’s test indicated that KMO = 0.732, which exceeded the recommended value of 0.6, indicating that the sampling was adequate. The chi-square distribution was 1989.866, and the
p-value was 0.000, which was below 0.05, so we could declare the result to be statistically significant. Overall, the data were suitable for factor analysis.
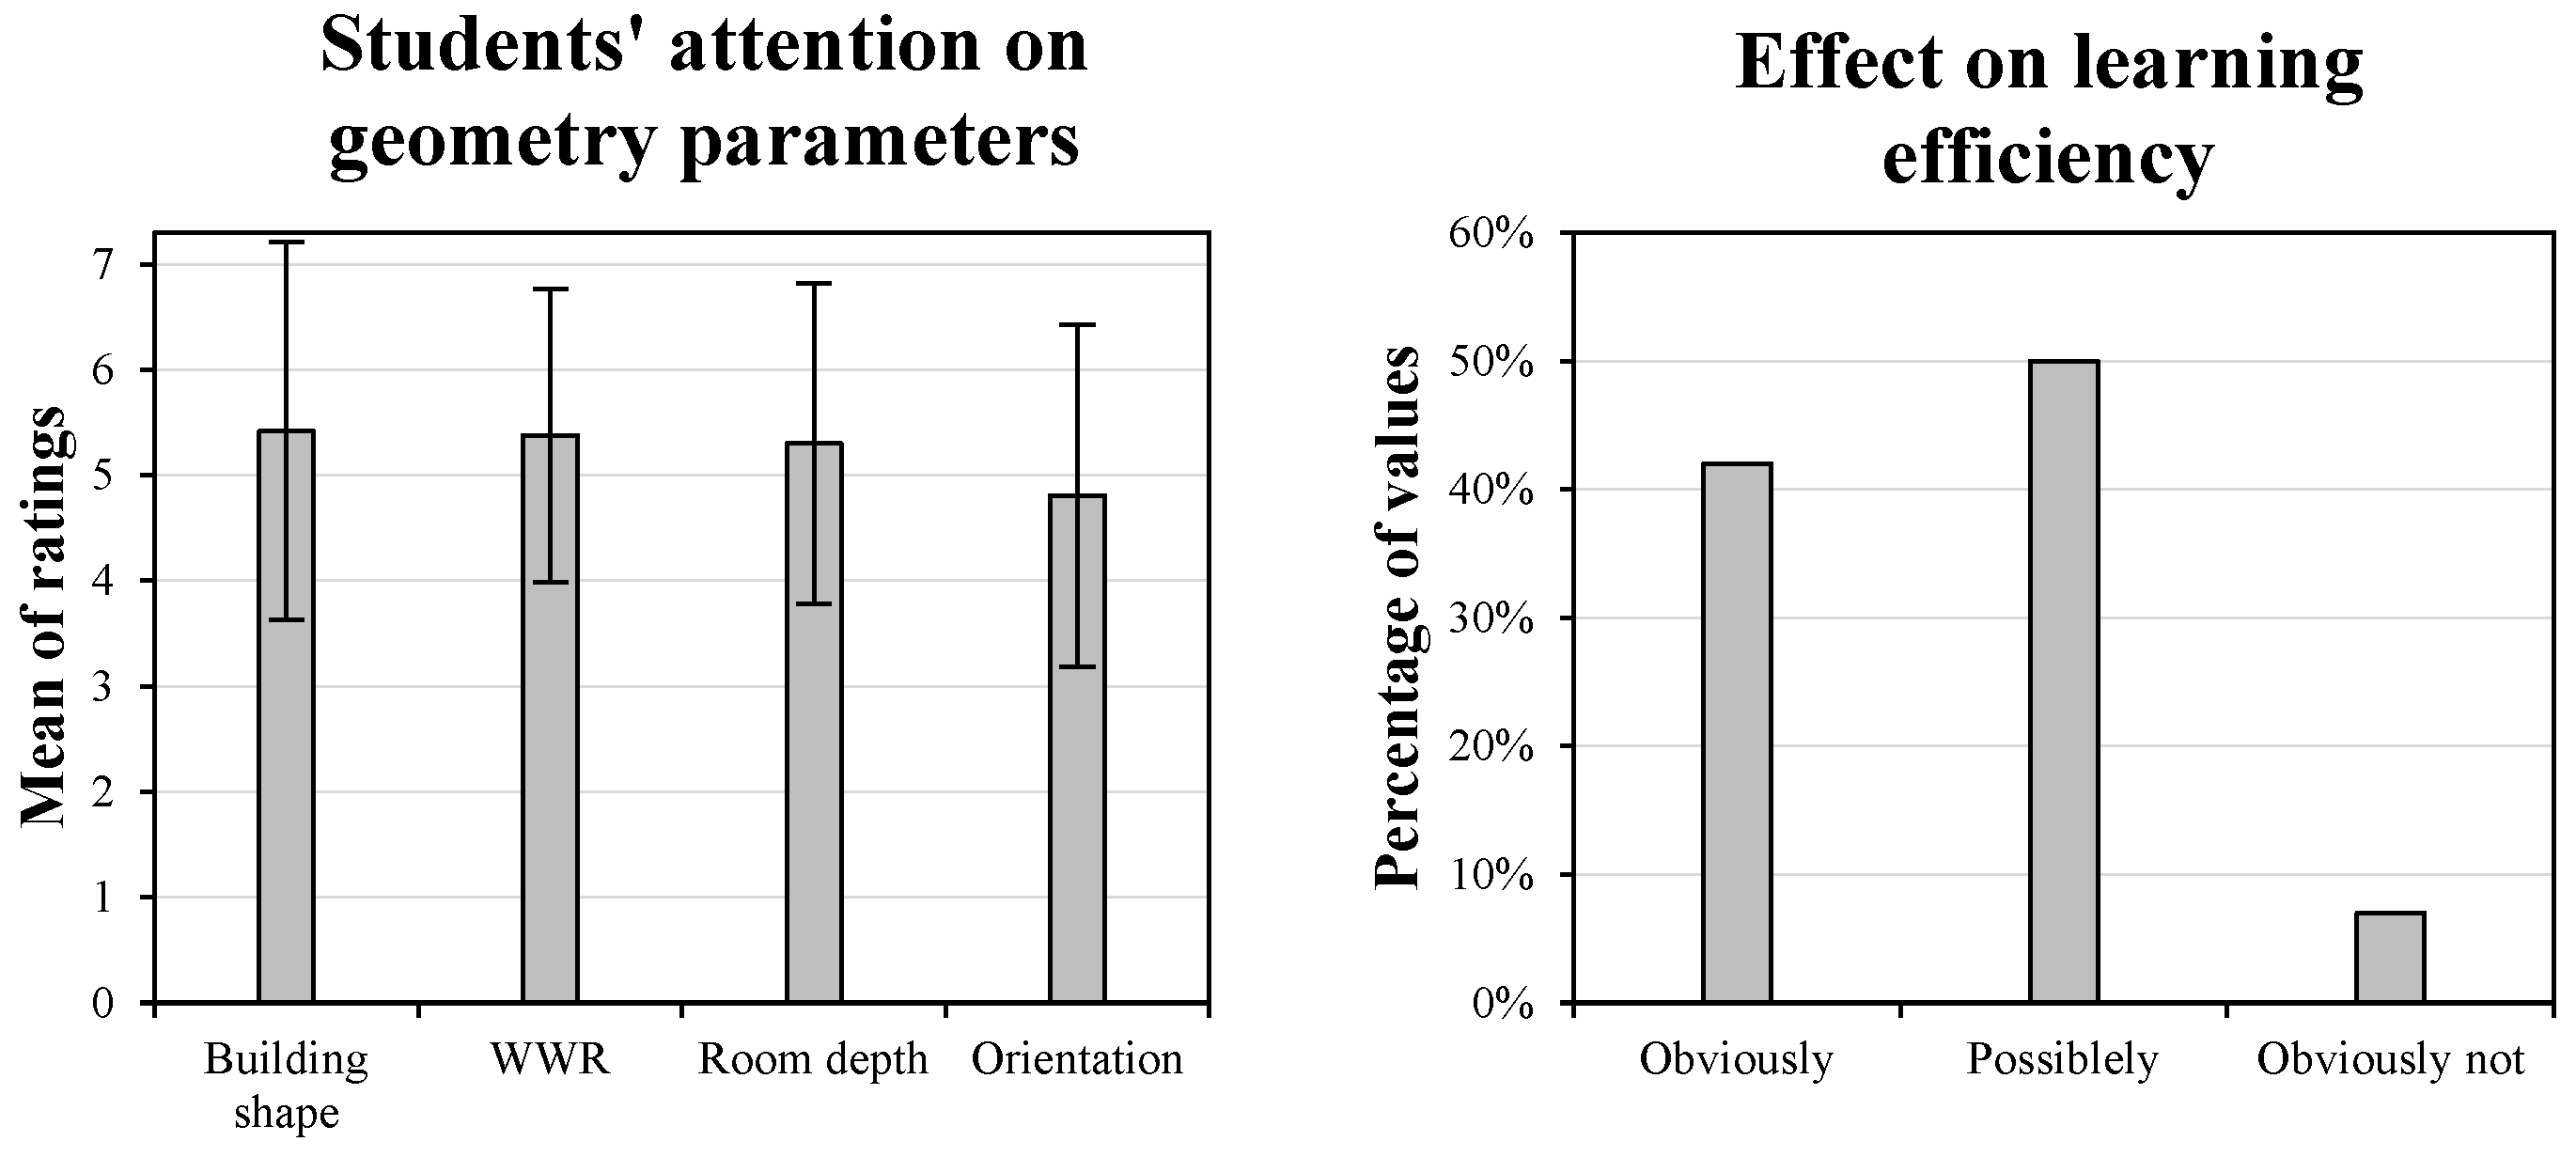
Students paid more attention to the four building geometry parameters by means of ratings ranging from 4.8–5.4 (
Figure 6). Orientation had the lowest ratings, while the ratings of the other parameters were almost the same. One of the reasons for the high ratings might have been their potential effects on learning efficiency given that very few students (7%) thought that the building geometry design had “obviously no effect” on learning efficiency. Approximately 42% of students thought that it had an “obviously effect” on their leaning efficiency, and 50% of students thought that the effect could “possibly exist”.
The above analysis reflects that building geometric parameters also play an important role in the students’ feelings and possibly learning efficiency, and thereby need to be carefully addressed.
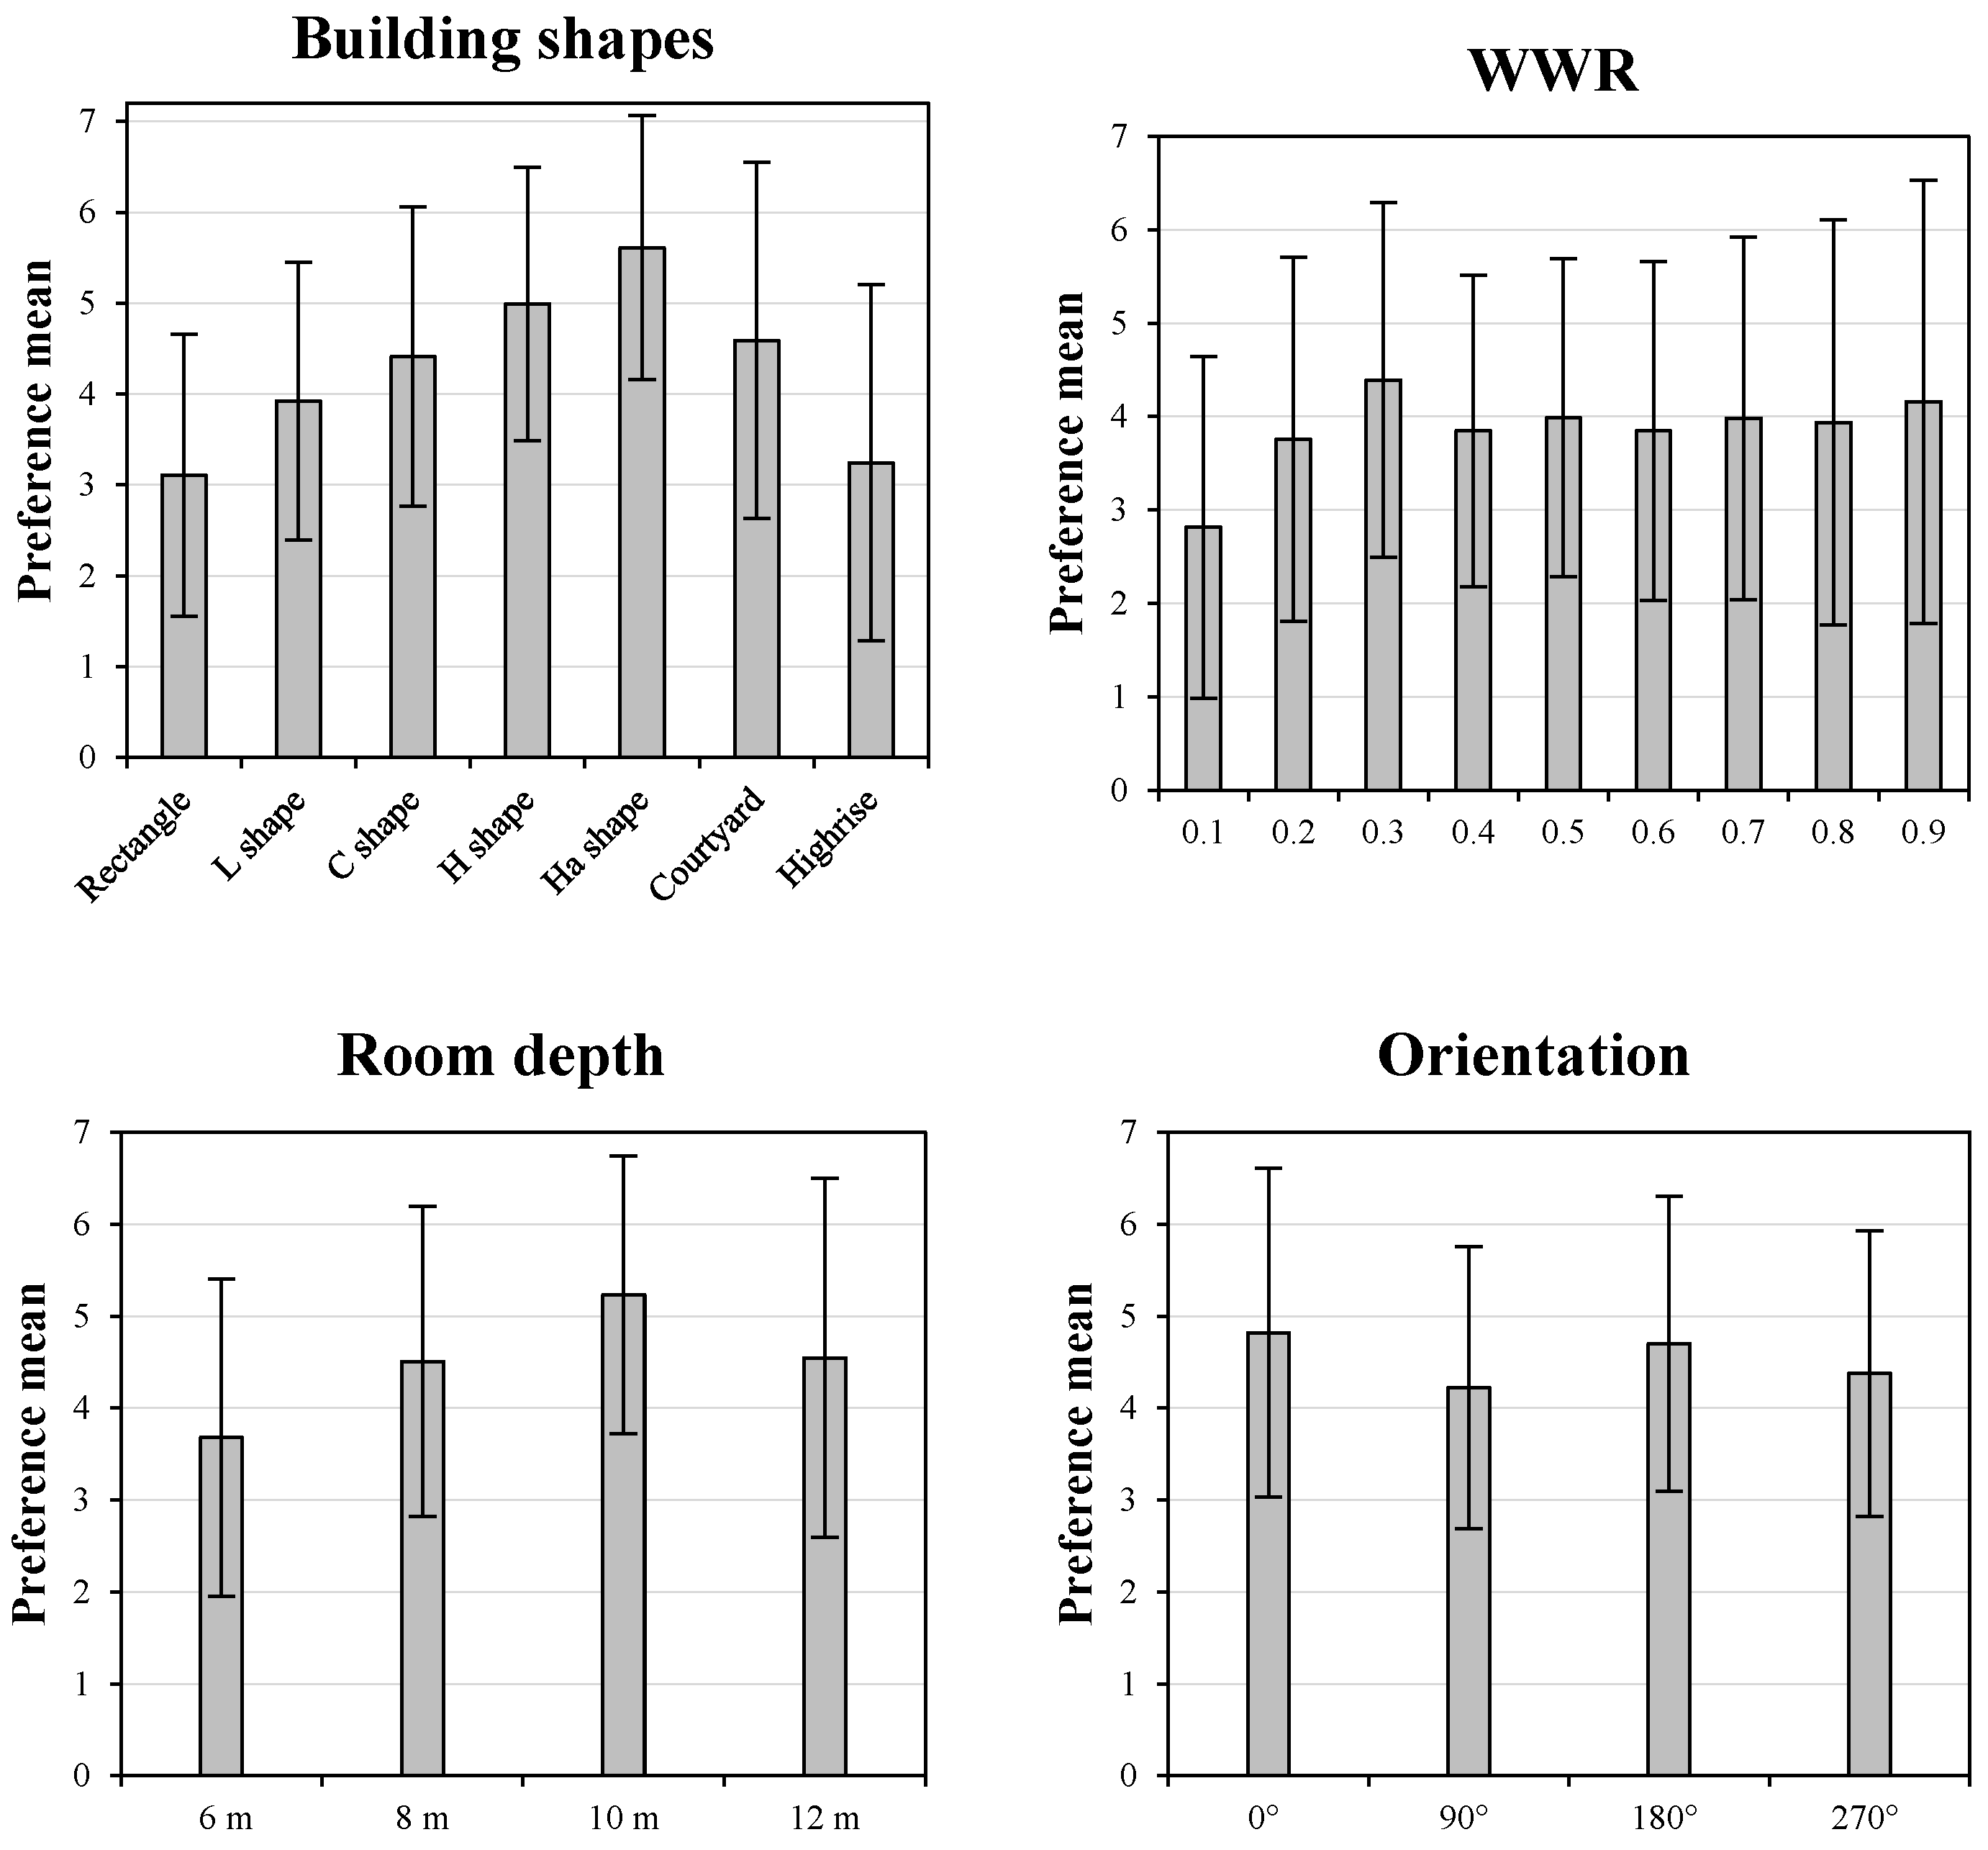
Figure 7 shows the mean and standard deviation of the student ratings for various building geometry factors. For building shape, the H
a shape exhibited the highest mean score (5.6), while the rectangle and high-rise type had the lowest score (3.1 and 3.2, respectively). The H shape ranked second with a high score of 5.0. This indicated the students’ fondness for complex forms, and tiredness of monotonous shapes, which was consistent with Aitken and Hutt’s findings for 7–10 year old children [
52]. In addition, the L, C, and courtyard types ranked in the middle with scores around 4.00. Furthermore, there was disagreement in rating the courtyard and high-rise type, since their standard deviations were the highest (2.0). The standard deviations of the other shapes were smaller (approximately 1.5), indicating less disagreement.
As for windows, a score of WWR with 0.1 was obviously the lowest (mean = 2.8), while the other WWRs all had similar scores around 4.00. This suggested that students did not like very small windows, yet they had no obvious antagonistic sentiments to the large windows. However, the standard deviation gradually increased from 1.66 to 2.37 when the WWR increased from 0.3 to 0.9, meaning there that there was more disagreement on preferences of larger WWRs.
The classroom with a 10-m depth had the highest score of 5.2, while the classroom depth of 6 m showed the lowest score of 3.7, indicating the students’ demand for spacious learning spaces. However, classrooms that were too stubby were undesirable, i.e., the classroom with a depth of 12 m only scored 4.5.
Considering orientation, orientations with 0° and 180° rotation angles had slightly higher ratings than the other two rotation angles. The standard deviations were similar for all room depths and orientations (approximately 1.6), indicating no significant disagreement between the different room depths or orientations.
In addition, the minimum and maximum ratings for preference of options for all four parameters always ranged from 1–7. Thus, at least one of the 156 respondents always felt extremely attracted or unattracted every time.
3.3. Proposal for School Building Geometry Design
Architectural design should consider both the building thermal performance, and the subjective preference of users. However, from the above analysis, we found that high-performance school building design options in terms of the indoor physical environment were partly contradictory to the subjective preferred designs of the students.
The student’s favorite type, the Ha shape, showed poor performance, particularly in summer thermal comfort. Conversely, the least favorite type, the rectangle shape, showed improvement in energy use and thermal comfort. Considering both the thermal environment and user preference, the H shape performed the best due to its high potential and various options for energy savings and thermal comfort improvements, as well as its second-place ranking in student preferences. The courtyard is also suggested, given its potential for energy saving and thermal comfort improvement and ranked highly with the students.
On the other hand, for WWR design, the most promising range for thermal improvement, 20–40%, had similar preference ratings for most WWRs, with the exception of a WWR of 10%. This simplifies the WWR design in improving thermal performance without needing to consider the preferences of students too much. However, this becomes difficult when designing classroom depth. The high-thermal-performance designs mainly have a room depth of 6 m, which was the least favored type of room depth for students; therefore, the students’ demand for spacious classrooms is in conflict with energy usage and thermal improvement. Finally, regarding orientation, the 0° and 180° rotation angles showed better thermal performance and higher ratings of student preference than the 90° and 270°, indicating that the 0° and 180° rotation angle are more suitable when designing school buildings than the other two orientations.

 ,
, 


