1. Introduction
In the last decades, several studies have revealed how critical the urban heat island (UHI) effect can be in cities in cold climates, such as the Canadian one. This has led many researchers to look at the impact of the city design over the urban microclimate, and in particular, to raise concerns about too dense cities [
1]. This study focuses on the Greater Toronto Area (GTA), the largest and most populous metropolitan area in Canada, with over 6 million persons. Toronto population is rapidly growing with new 76,500 persons in the last year, making Toronto the sixth largest metropolitan area in North America in terms of total population with only New York, Los Angeles and Chicago being significantly larger [
2]. Moreover, the annual growth over the last year shows that Toronto is not far behind New York and Los Angeles, with a significant dependence in the case of Toronto on immigration as the key driver of population growth. The net immigration in Toronto over the last year was equal to 66,700 persons [
2]. In this context, the Toronto urban environment is undergoing huge transformations. The “Places to Growth” is the Toronto development plan originally released in 2005, and reviewed in the following years, which represents the response to the forecast that by 2025 Toronto will house additional 2.4 million persons [
3]. Under the effect of this plan, Toronto is experiencing one of the highest rate of building development in the developed countries. Over 48,000 and 33,000 new home permits were issued in 2012 and 2013 respectively, with 470 high-rise proposals across the GTA released at the beginning of 2015 [
2,
3]. In this regard it is important to mention that the Canadian urbanization rate is above 80%, and as a result the urban comfort and urban energy demand represent national priorities [
4]. This trend is similar to that occurring in many other countries [
4,
5]. Given the large transformation that Toronto is facing in its urban design, and the amendments to the Official Plan housing policies which allow high-rise buildings almost everywhere around the city, it seems important to investigate how the urban design will influence the outdoor thermal comfort in Toronto and, consequently, the building energy consumption. Akbari suggested that every 0.6 °C increase in air temperature resulted by the UHI effect can add 1.5% to 2% to the peak demand for cooling, with many health consequences too [
6]. Moreover, in Toronto, the peak demands increase the use of electricity supplied by local coal burning power plants, and consequently they have significant environmental implications. In Toronto, days with temperatures above 30 ◦C are expected to increase from an average of 13 nights per year in the 1970s to 65 by the end of this century [
7,
8]. Tam et al. (2015) stressed the evidence of the UHI in Toronto in by looking at the effect on a day to day temperature change between urban and rural areas [
8].
Evaluating the relationships between buildings and the surrounding outdoor environment for controlling the urban microclimate and for mitigating the UHI effect is a multidisciplinary task which requires competences in many subjects, including landscape, urban planning, architecture, and building material science [
8]. In view of the negative UHI effects, many researchers have focused on UHI mitigating strategies by simulating single blocks or neighbors [
1,
8]. However, preliminary results have shown the importance of urban design on the microclimate of outdoor spaces and urban canopy layers [
9,
10,
11,
12]. In fact, the urban density plays an important role for the UHI effect, since a denser urban form results in multiple reflections of solar energy, and influences the air convection within the urban canyons as well as the wind “porosity” of the city [
13,
14]. As a result, a denser morphology influences the radiant heat loss within the urban canyons due to the lower sky view factor (SVF). In fact, tall buildings and narrow urban canyons reduce the SVF and increase the amount of shaded area at the ground level, keeping the bottom of urban canyons cooler than the surrounding area by day, but increasing its temperature at night time [
15,
16,
17]. Computer models have shown that an urban form with a building height to street width around 0.5 and a building density around 0.3 should be promoted to mitigate outdoor discomfort and other UHI effects [
18]. However, the height of new construction in Toronto shows trends far from these geometrical design ratios. Bosselmann et al. back in 1995, presented an extensive study of how the change in the urban from of downtown Toronto was going to affect sunlight on sidewalks and open spaces as well as the wind conditions at street level [
19]. By making wind tunnel measurements, they found that wind significantly accelerates above 10 m/s among several high-rise towers, creating both wind chilling effects and mechanical forces on the pedestrians that can make unsafe to walk. Mesoscale CFD studies have demonstrated that wider streets could induce easier go-through winds. However, the higher flow rate along the main streets reduces the flow rates in parallel narrower streets, negatively affecting the ventilation efficiency [
20,
21]. Moreover, the design of building facades also effects the urban wind environment [
22]. Long building facades which are parallel to the prevailing wind direction, can accelerate horizontal vortex airflow at the edges [
23]. Similarly, deeper urban canyons increase the wind speed [
24]. Therefore, although the effects of the new constructions on urban wind environment depend on the construction location and the building facade design, it is evident that the development of high-rise buildings in Toronto is creating deeper urban canopies, while narrowing the relative street widths.
The researches about thermal remote sensing are based on satellite measurements (2-D data) or aircraft scanners (2-D data). In particular, land surface temperatures (LST) maps derived from satellite data are the most commonly used ways to demonstrate the extent of the UHI effect in cities [
25,
26]. Natural Resources Canada used air temperature and surface temperature measurements collected from satellite imagery and 30 stationary stations to characterize the microclimatology across the GTA [
27]. Although the UHI was most readily detected at night and when local winds were weak [
27], an element that emerged in all the satellite elaborations was that downtown Toronto showed lower surface temperatures than more peripheral suburban area [
28]. In fact, in downtown, although the high density of high-rise buildings surrounded by hard and dark surfaces would probably suggest higher surface temperatures, it has emerged that suburban areas within the GTA also experienced higher thermal admittance properties, as common in downtown city centers. Moreover, it was demonstrated a strong relationship between the gross building coverage and the mean wind velocity ratio. In this sense, it was shown that the greater density of high-rise buildings in downtown Toronto could be responsible for creating vertical thermal drafts, with more releases of heat into the air [
28]. Although the advantage of using LST is the possibility to cover extensive spatial area and to investigate the UHI in a macro-scale, 2-D LST data have their limitations on spatial resolution and the expression of urban typologies. Observed LST depends on spatial resolution, because of the different land cover types. Typical spatial resolution of 1 km
2 ignores land cover characteristics on a community scale. Furthermore, LST derived from the satellite database ignores the contribution from the surface of exterior building walls. This is a serious deficiency for the consideration of urban solar heat absorption and reflection. This means that the satellite pictures showing UHI effects ignore the contribution from the building walls, and calculate the surface temperatures from the radiated energy in a small spectrum range, suffering thermal anisotropy. This is especially relevant for metropolises that have many high-rise buildings. Recent studies have clarified the spatial limits of satellite analyses of the urban environment, and have suggested a combination of satellite images with detailed analyses at the scale of single neighborhoods in order to capture specific urban elements [
29]. In previous studies, the authors have compared different areas of Toronto, and have looked at the effect of some UHI mitigation strategies for areas of the city with different densities both during summer and winter time [
30]. In particular, the surface reflectance and green areas were compared as potential UHI mitigation strategies showing appreciable benefits in both cases.
The present study will specifically focus on the effects of new constructions during summer time in a downtown area where several new construction projects are taking place. In particular, in the selected area, open parking lots and Victoria buildings have recently been replaced by high-rise residential condos.
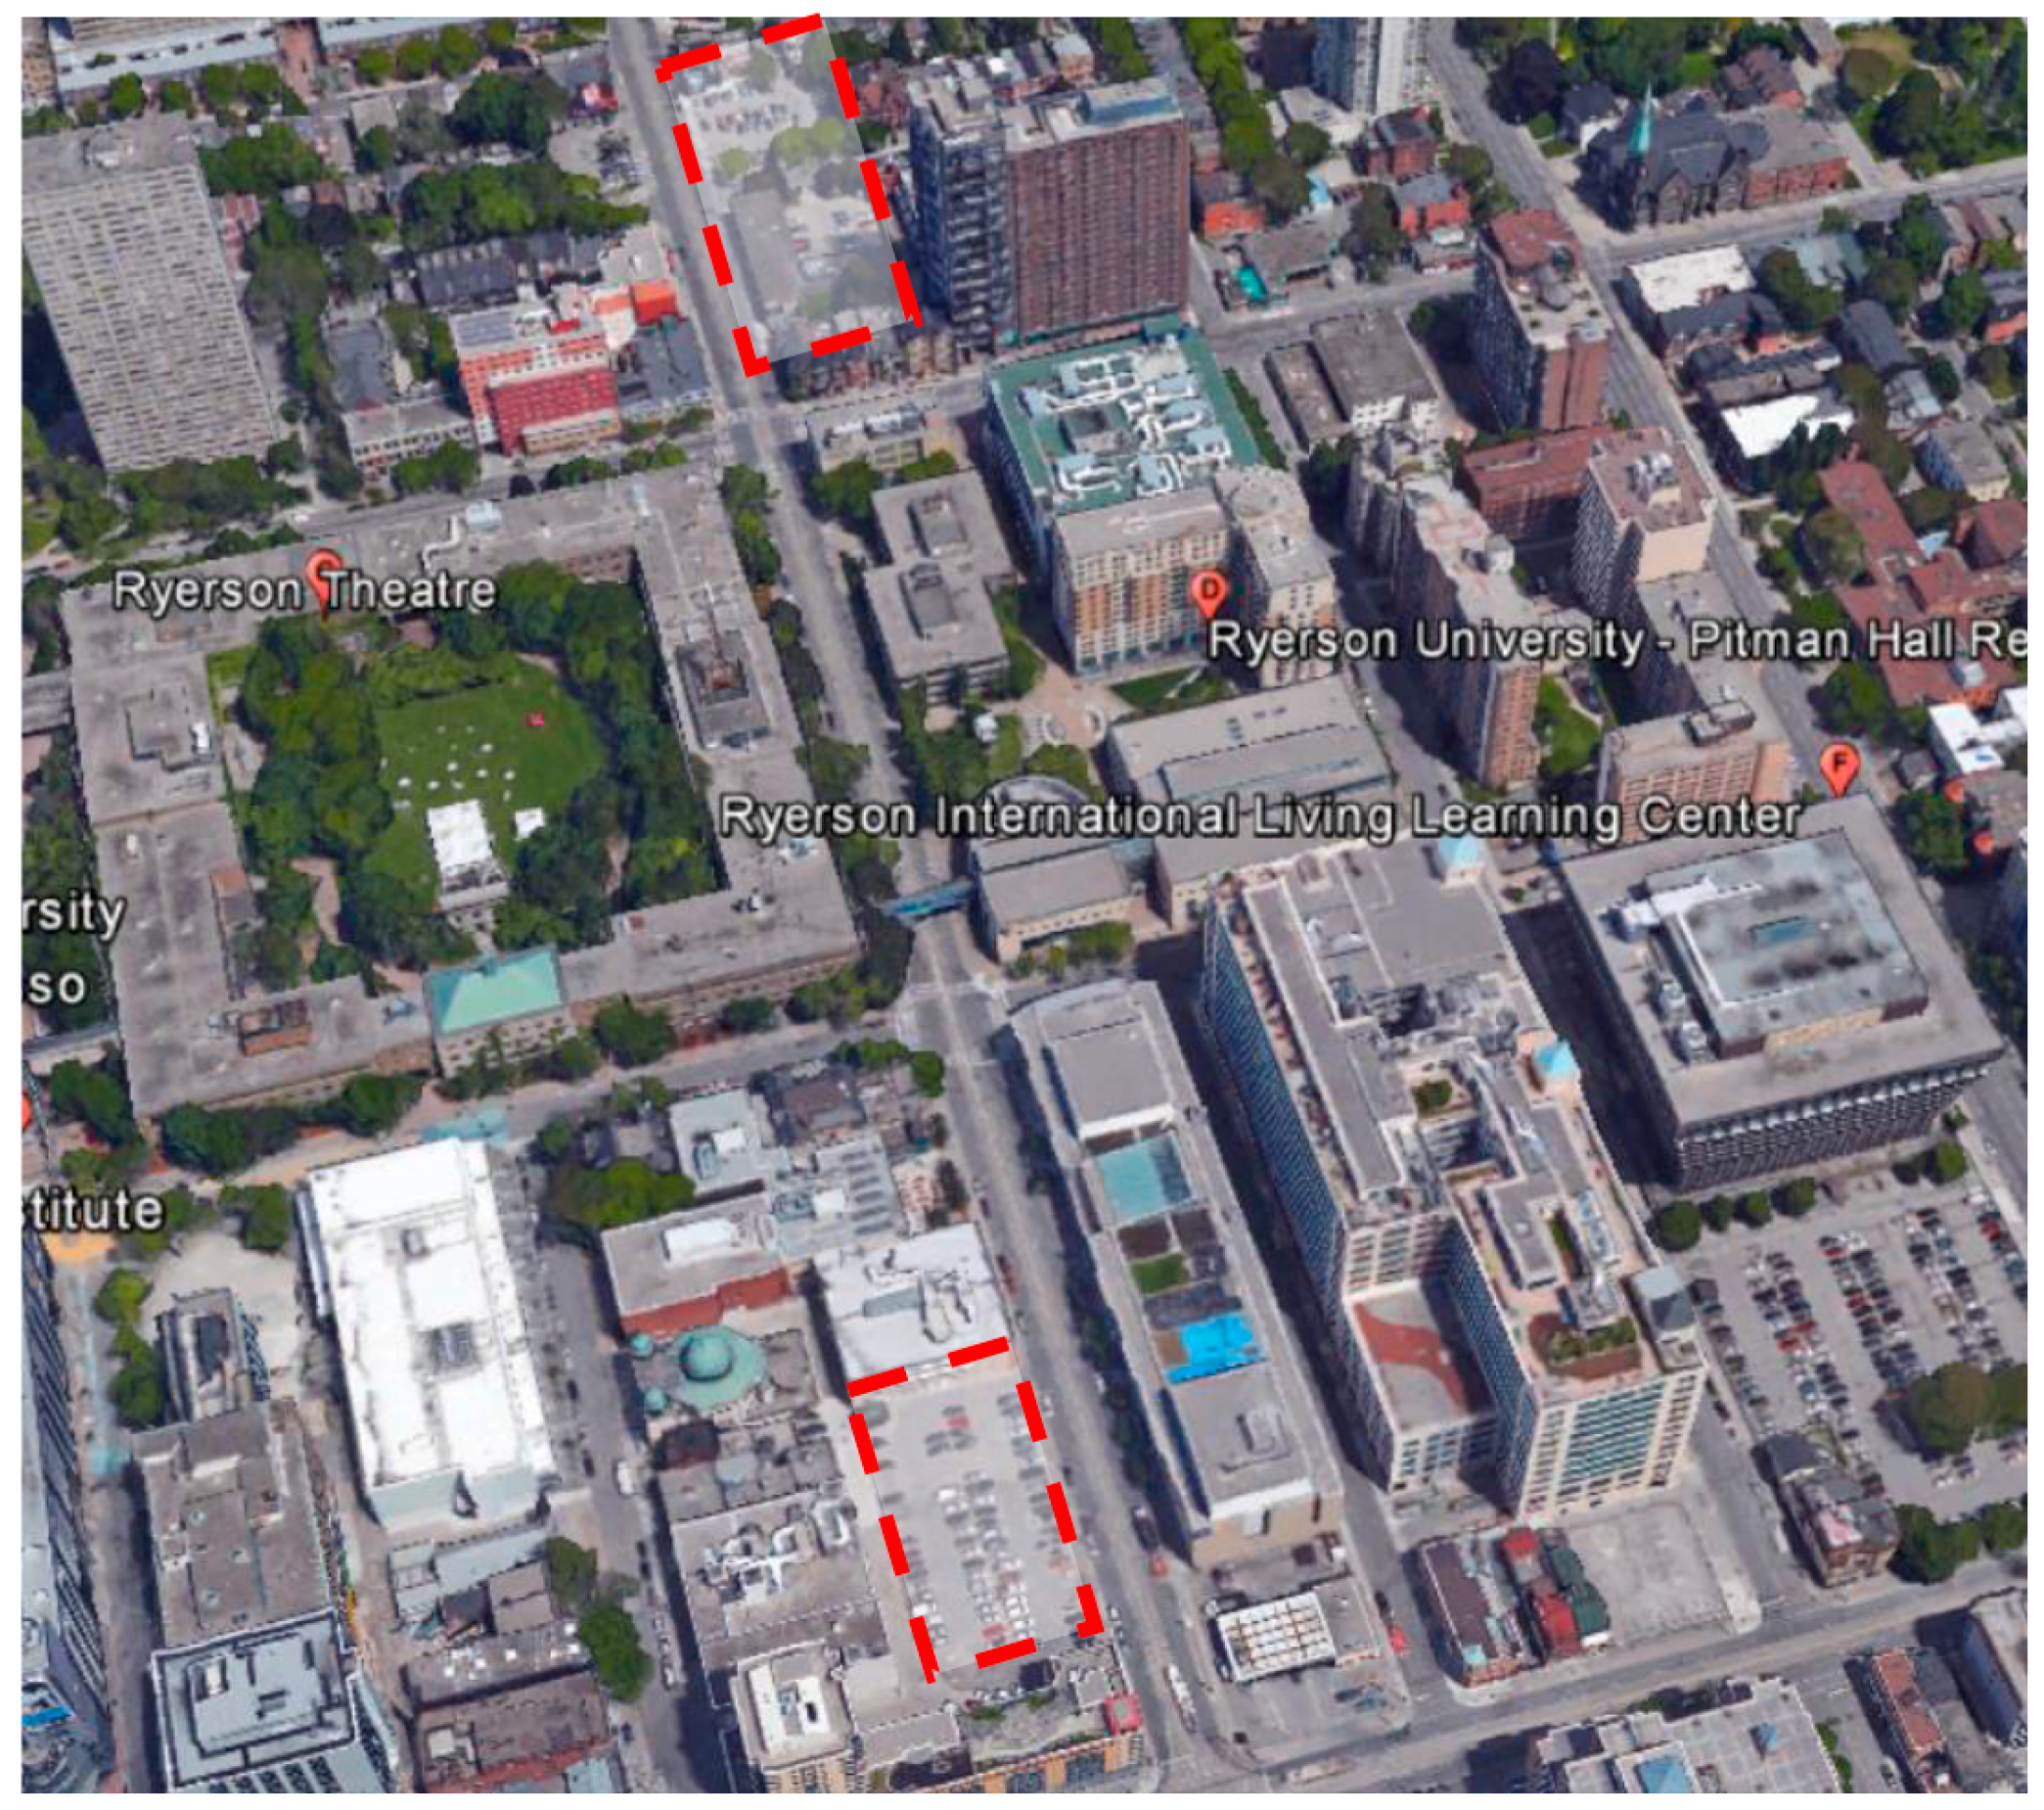
The selected area (in
Figure 1) is known as “Garden district”, and presents a mix of condominium and office buildings, with variable building heights from two to twenty floors. The presence of the Ryerson University and of many other city attractions has led building developers to focus on this area.
Figure 1 shows that the investigated area is currently occupied by parking lots, with low albedo surface (asphalt). Although, the new buildings will include some green features (i.e., including green roofs), the main interest of this paper is towards the effect of the new urban geometry over the outdoor microclimate.
2. Methodology
ENVI-met 4.0 (ENVI-MET GmbH, Essen, Germany), a three-dimensional computer software that simulates micro-scale thermal interactions within the urban environment was used for simulating the areas of analysis. The program is used to model surface-plant-air interactions in urban environments, but it also simulates the flows around buildings, heat and vapor transfer at urban surfaces, turbulence, and exchange. ENVI-met carries out detailed calculation in regards to shortwave and longwave radiation fluxes with respect to shading, reflection and re-radiation from building systems and vegetation. The software was chosen since it has been extensively validated in recent years [
29,
30]. It is important to mention that ENVI-met has some limits such as the lack of assessment of anthropogenic heat emissions (due, for example, to traffic or air conditioning), and the possibility to establish some urban parameters homogenously to the entire model only. For example, the indoor building temperature is unique in all the points of the building, it is the same for all buildings and is not an output of the simulations, but is an input data necessary to fix boundary conditions for calculating the cell.
ENVI-met has a typical spatial resolution from 0.5 m to 10 m, and a temporal resolution of 10 s. A simulation should typically be carried out for at least 6 h, but a 24 h period is often more usual. The optimal time to start a simulation is at night, so that the simulation can follow the solar radiation daily increase.
The main input parameters of an ENVI-met simulation include weather conditions, structures and physical properties of urban surfaces and vegetation. Combining Reynolds averaged Navier–Stokes equations and the advection diffusion equation, ENVI-met allows to calculate the air temperature, as well as the mean radiant temperature (MRT). This temperature has proved to be important for outdoor comfort, since during hot waves, it assumes values that refer better to comfort perception than the air temperature [
30,
31,
32].
Based on previous studies, a typical summer day (15 July 2013) was selected for the analysis. The recording of two weather stations (Latitude: 43°40′00″; Longitude: 79°24′00″) were used for the calibration of the model, following a procedure already presented in other papers [
14,
30].
Table 1 reports the details of the initialization input parameters in the software, while the data about the urban form before and after the new constructions are presented in
Table 2. The new buildings were modelled as boxes, using the proposed maximum height (
Figure 2).
Simulations started at 21:00 and lasted two days in order to have enough microclimate data. The study conducted in this paper was less sensitive to the proper assessment of the albedo of the different surfaces in the studied area, as the main goal was to look at the impact of new buildings that are going to substitute vacant parking lots.
In every numerical model, especially 3D models such as the ENVI-met ones, simulations often suffer reliability at their model borders and at the grids very close to them. Nesting grids could be added in the boundary of models for increasing the authenticity of the simulation results. However, the more nesting grids are used, the lower is the chance that numerical problems occur because one or more of the model bounder are interfering with internal model dynamics. In this research, 10 nesting grids on each side of model boundaries were added in the simulation models.
Simulation Validation
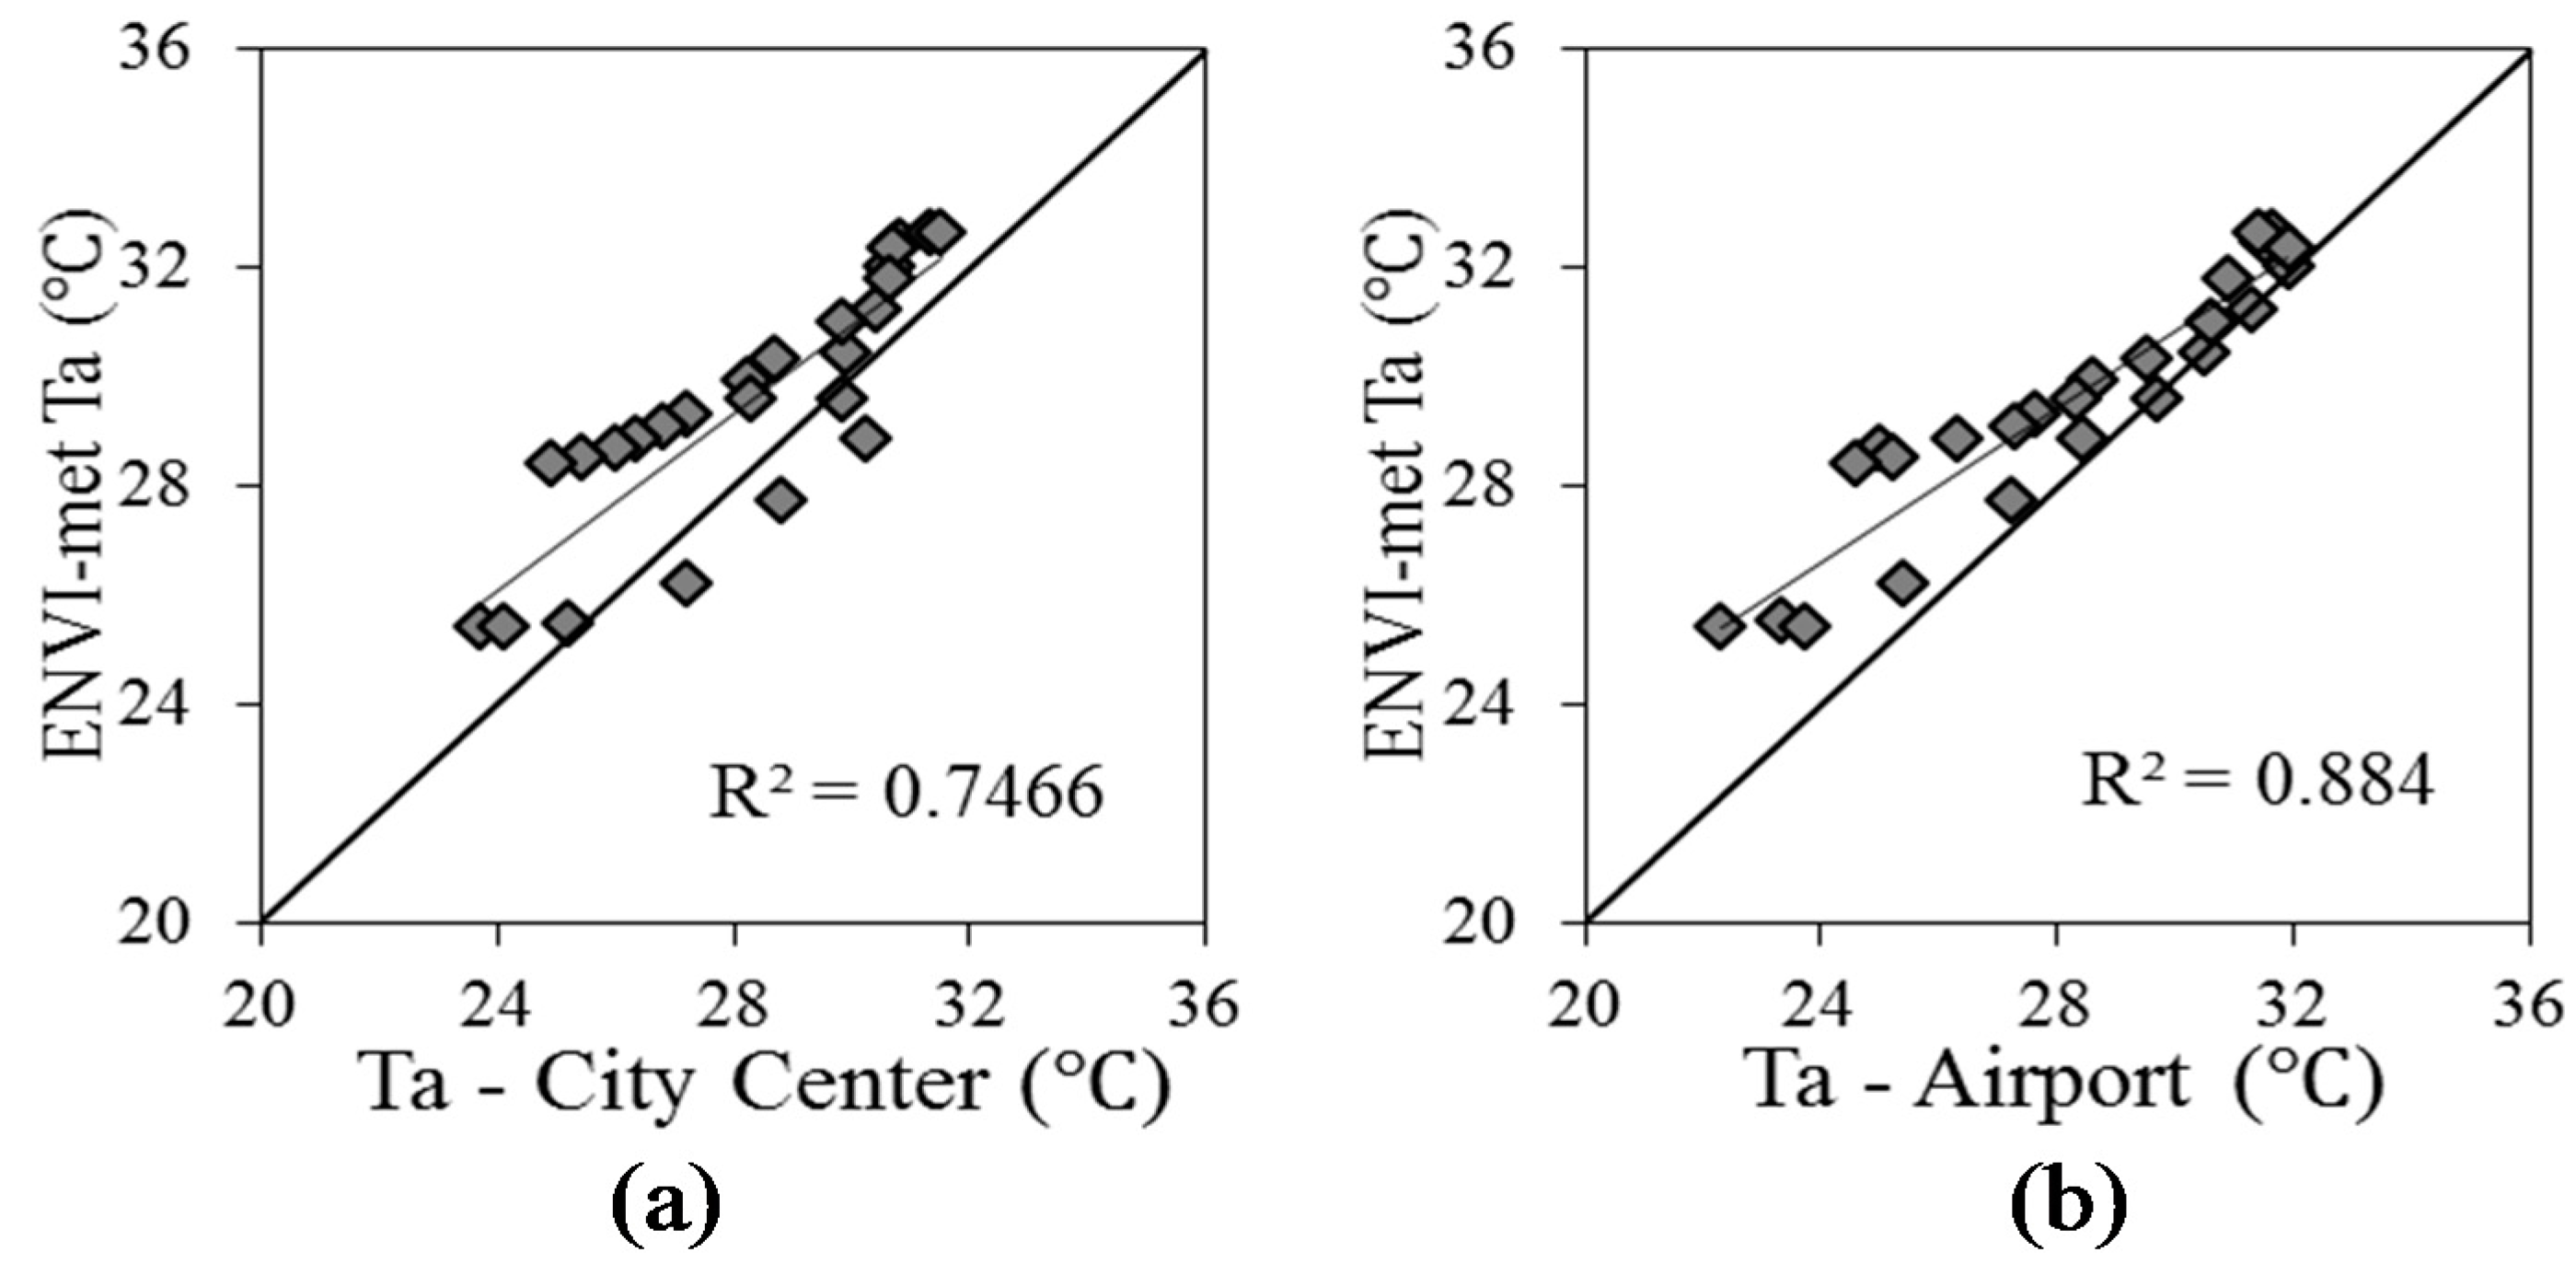
Figure 3 and
Figure 4 show the validation of the ENVI-met model through a comparison between field measurements and simulation results for a summer day of the air temperature (Ta) [
33]. The measurements data were derived from the governmental weather station data base. The maximum Ta difference between the simulations and the measurements at the airport was around 3.8 °C and occurred at 04:00 of 17 July. Reversely, the maximum Ta difference between the simulation and the measurement at the city center weather station was around 3.5 °C, and occurred at 04:00 of 17 July. The average difference between the simulations and the measured results was 1.3 °C. This discrepancy could be explained by inaccuracies in the simulation input for surface materials, soil, and vegetation conditions. In fact, the univocal values for the material properties used in the simulated model represents a clear discrepancy of the simulation model. Looking at the scatter plots in
Figure 4, the coefficient of determination (
R2) between the simulation and measurements is 0.75 to 0.88 for the measurements in the city center and in the airport area respectively.
3. Results
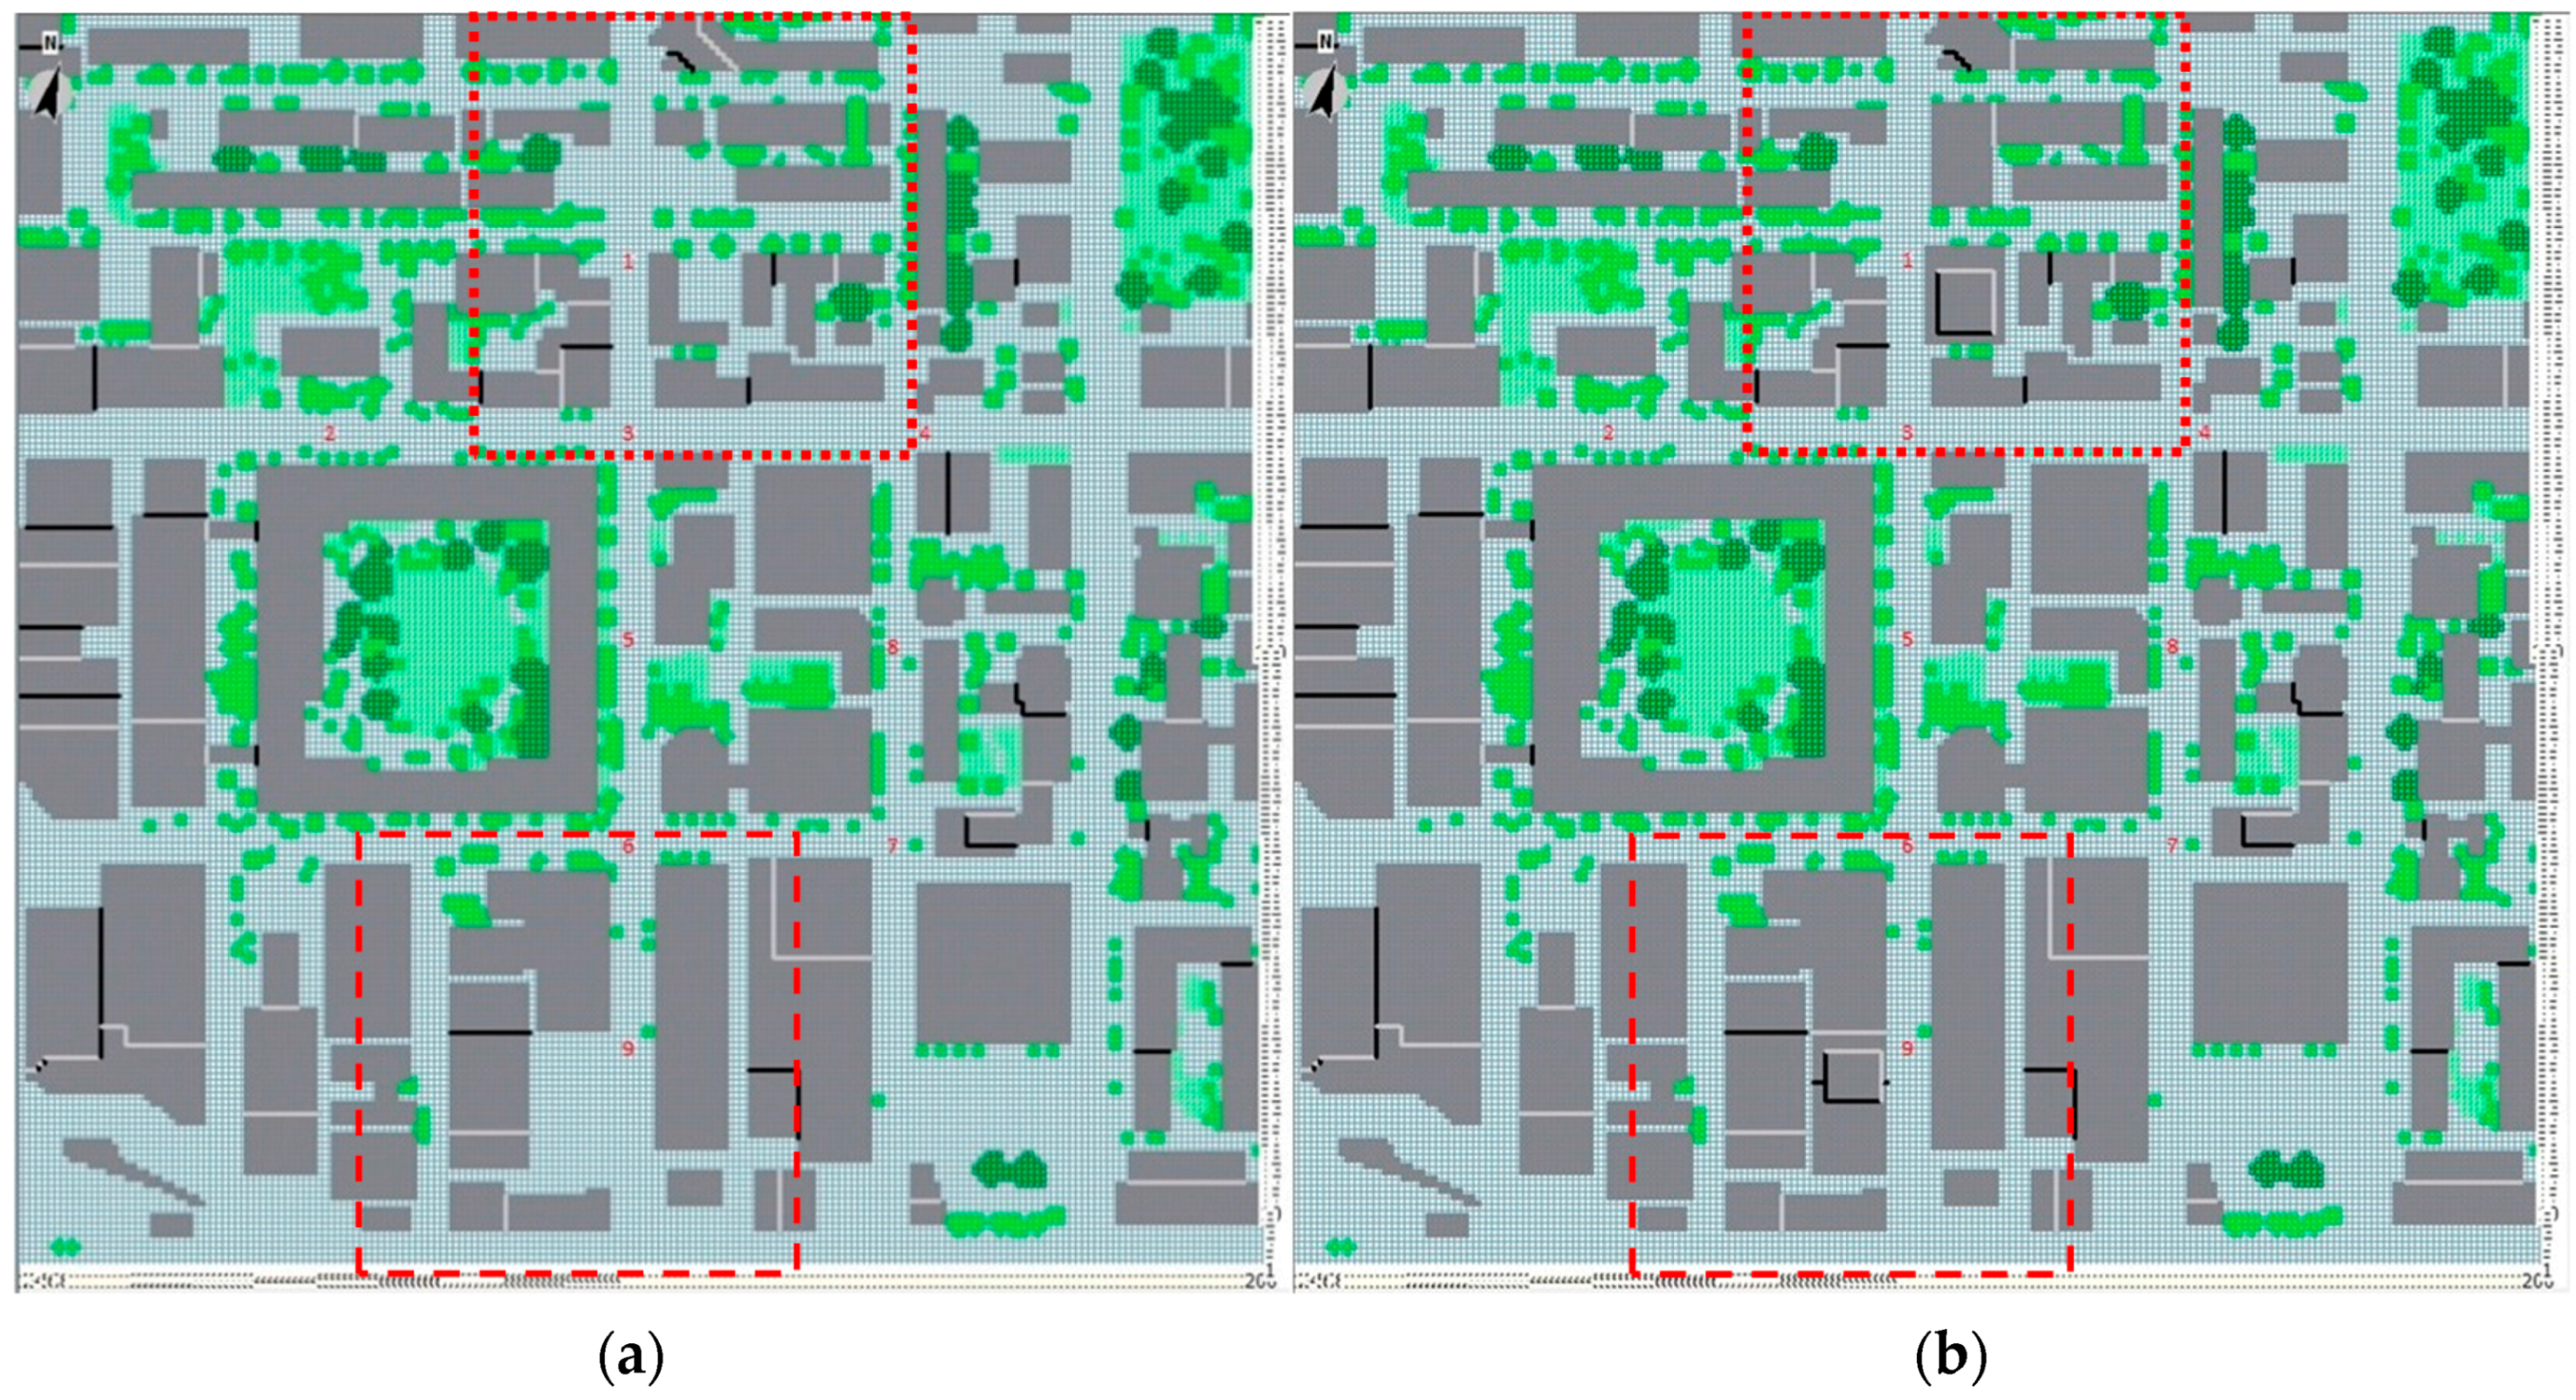
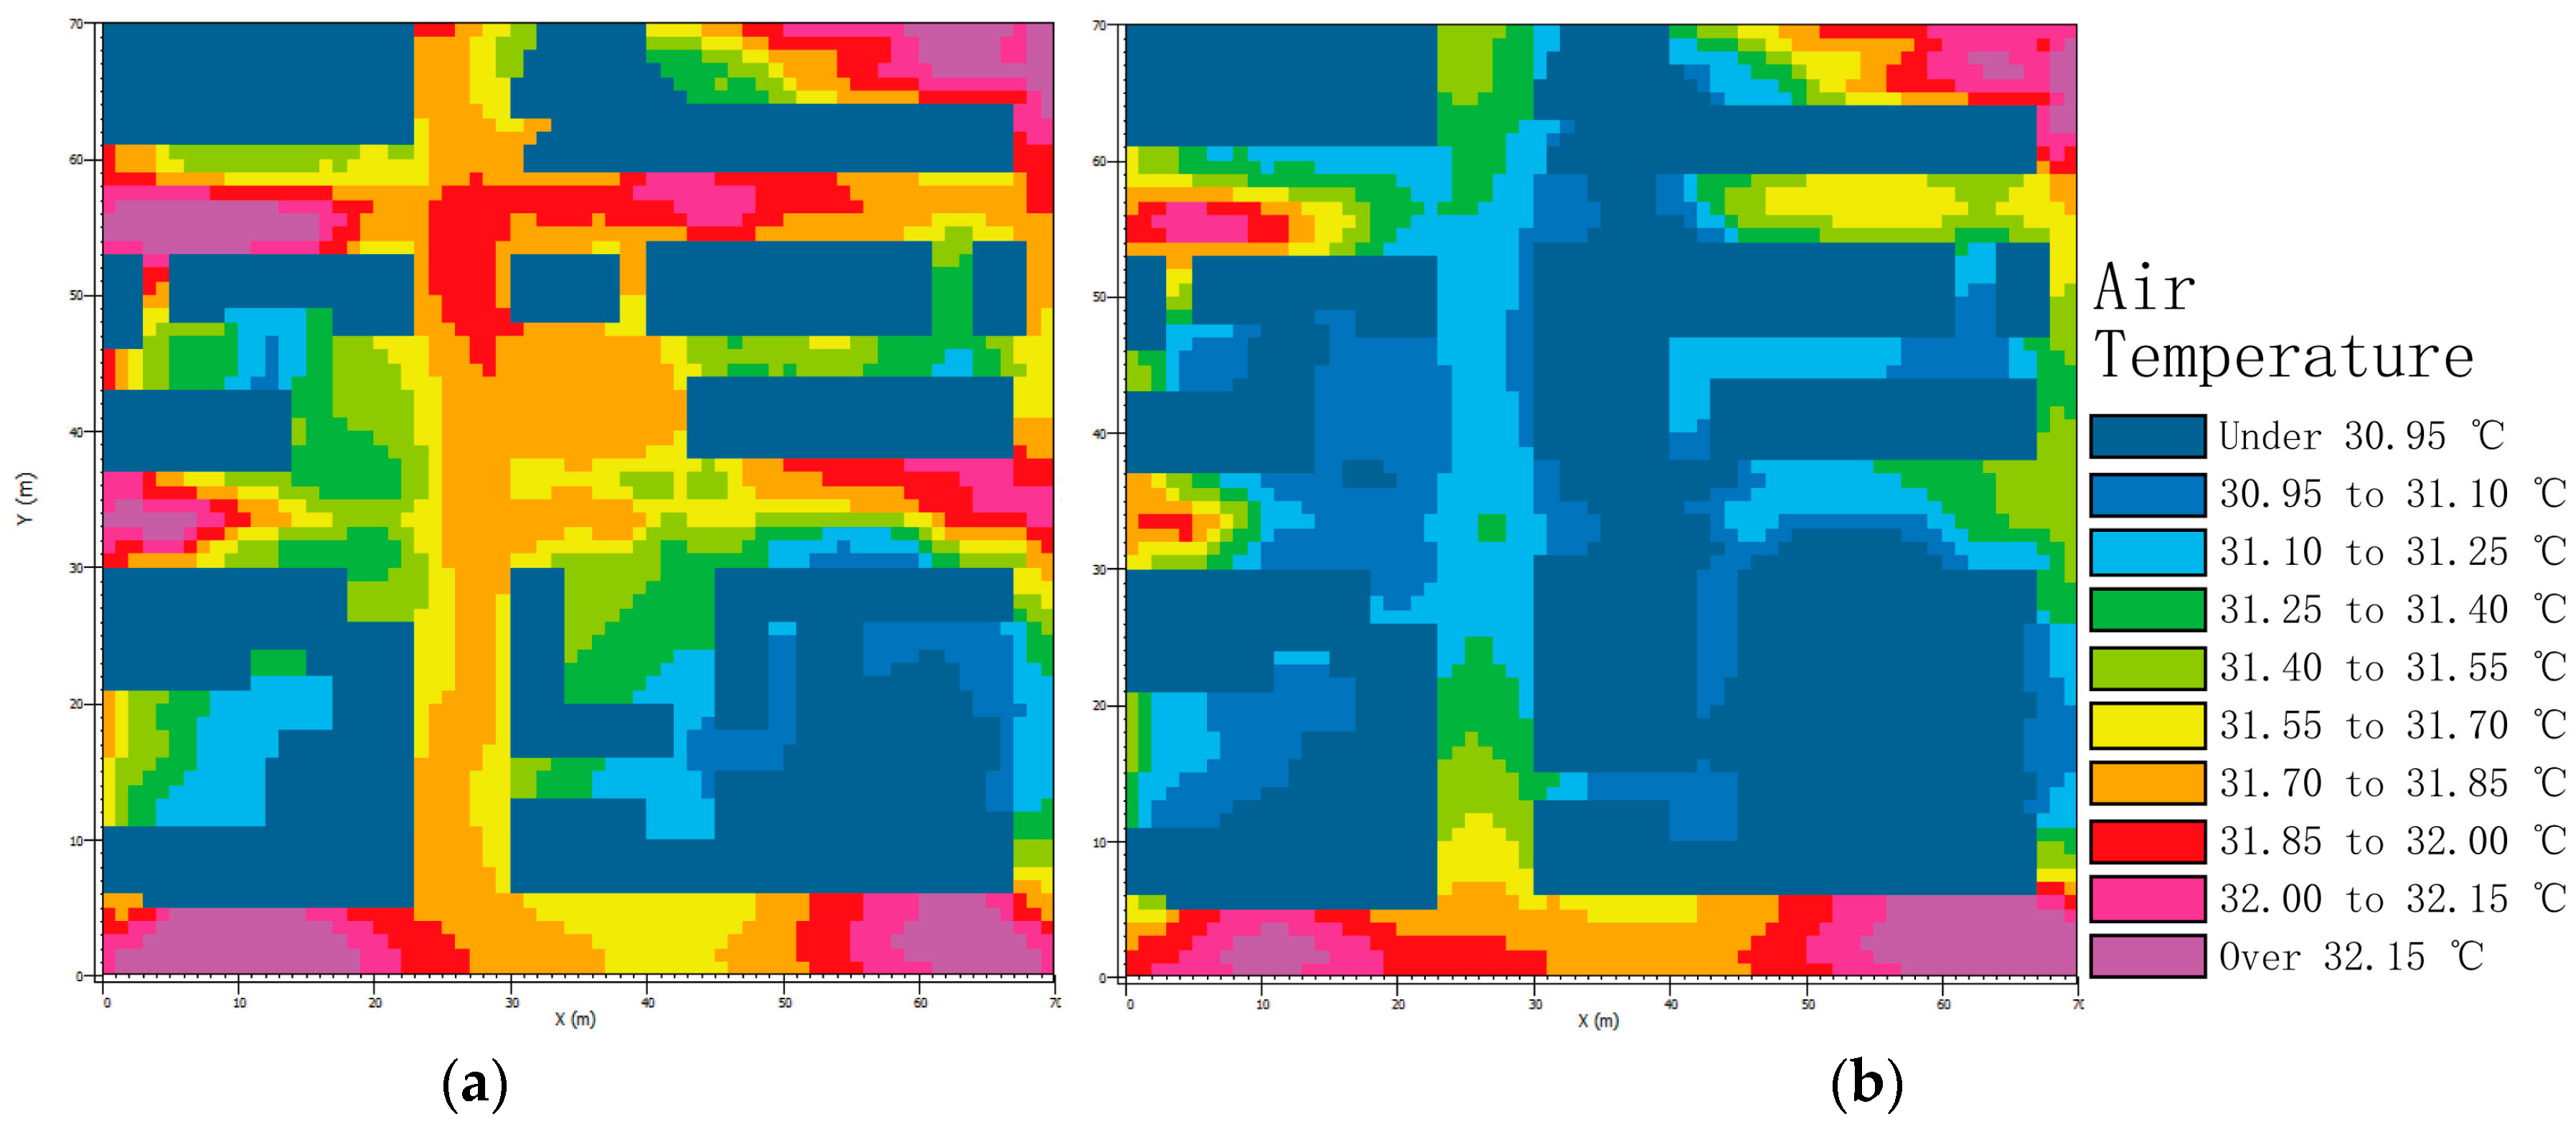
Figure 5,
Figure 6,
Figure 7 and
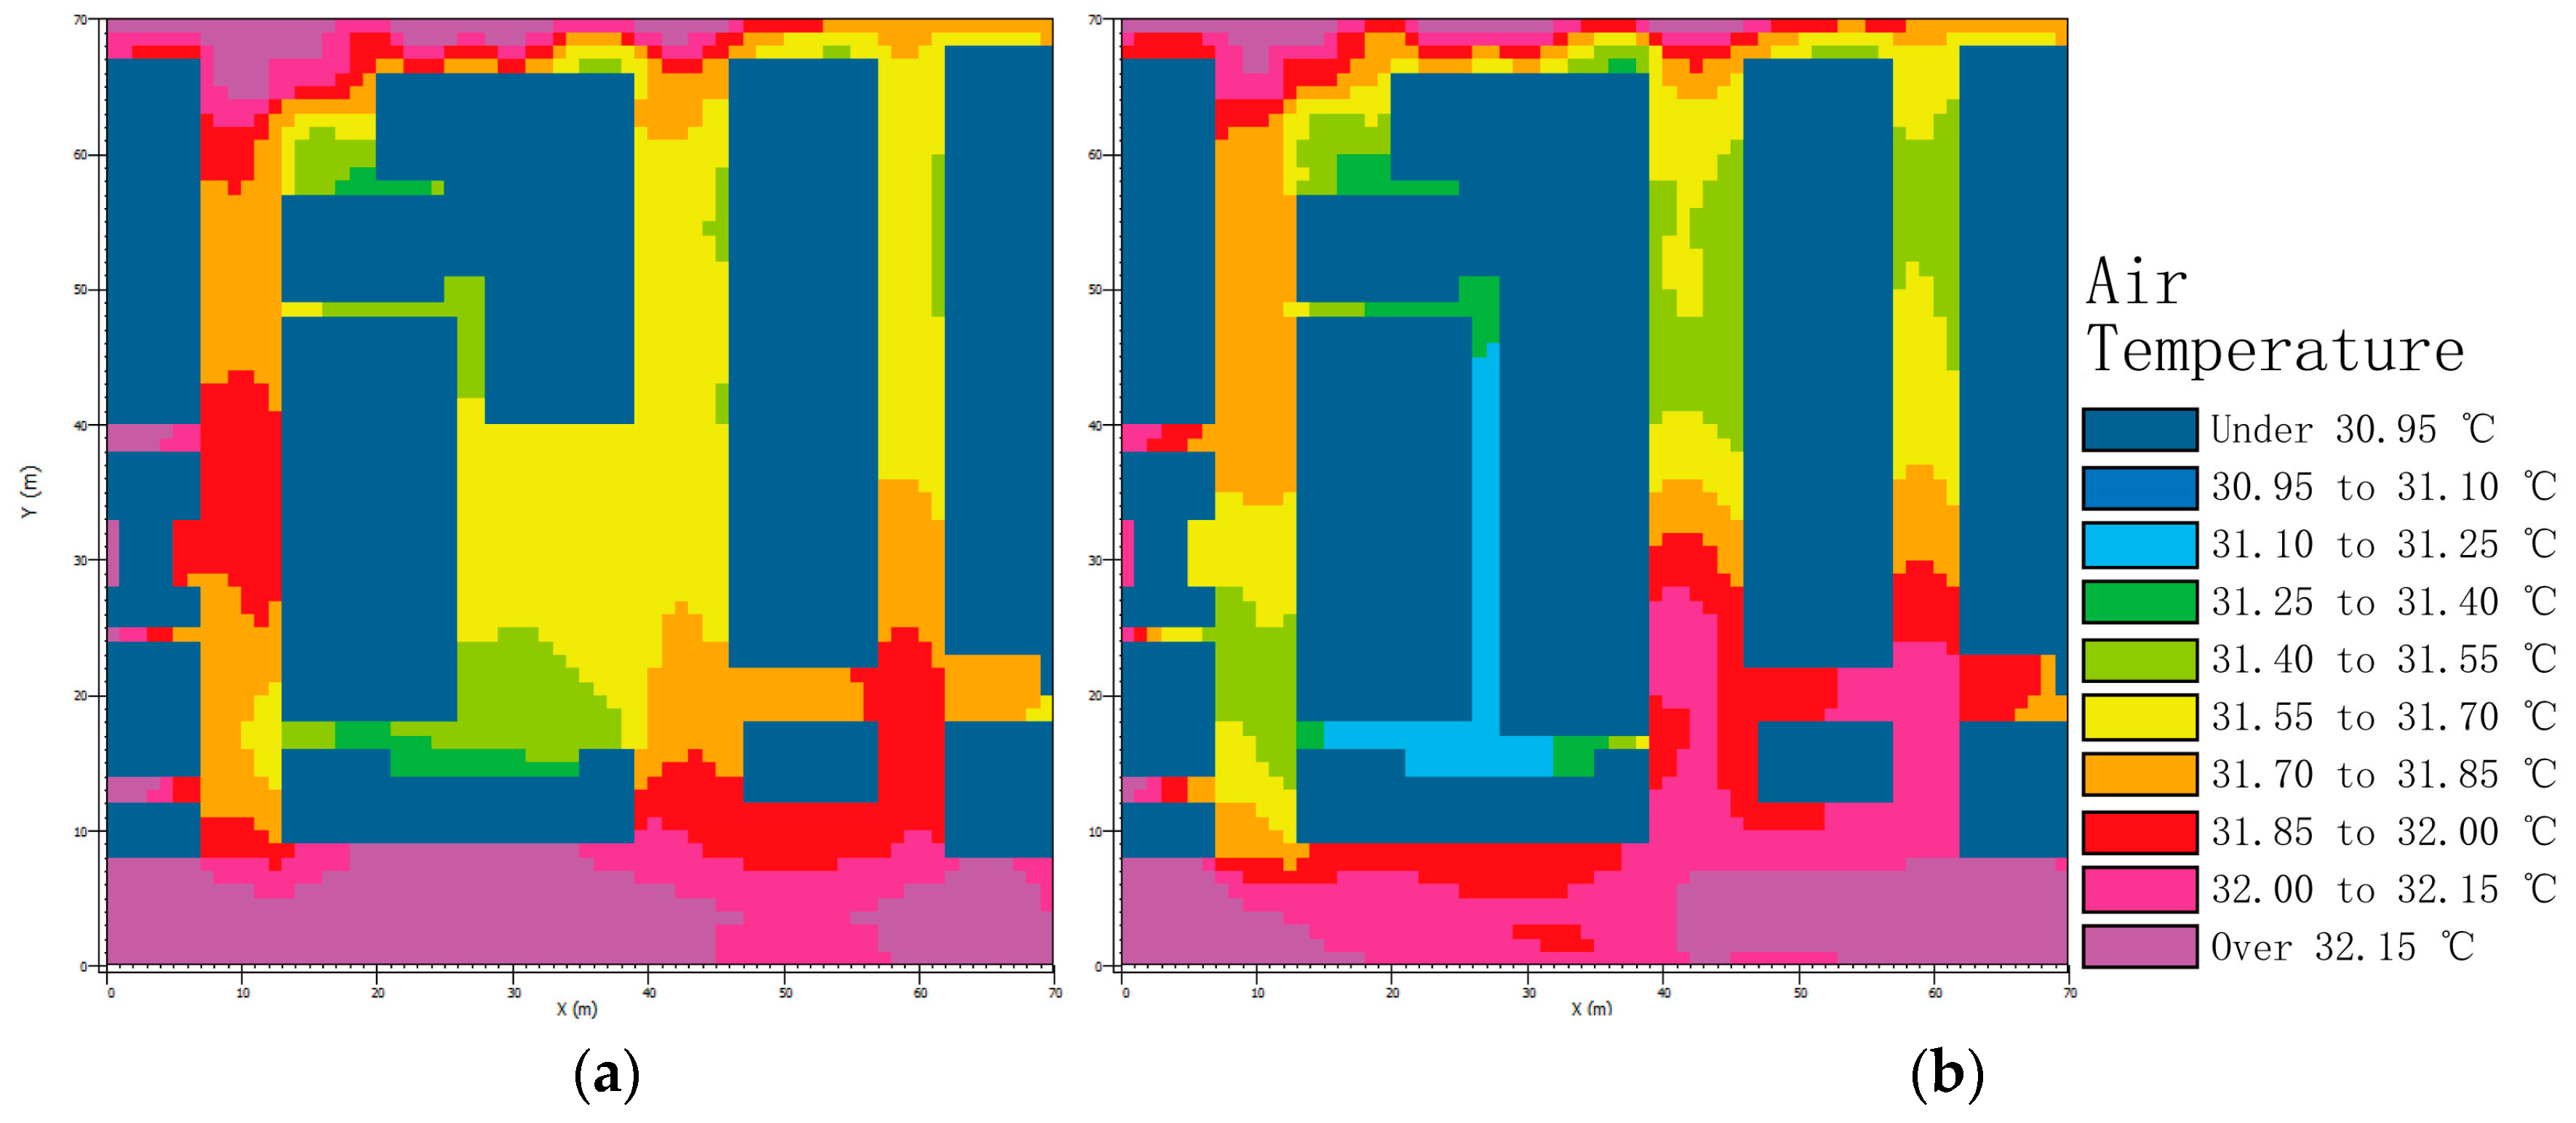
Figure 8 show the air temperature, wind speed and wind direction maps at the ground level (1.8 m height from ground) at mid-day in the two zones pointed in
Figure 2, before and after the new constructions. The maps in
Figure 5 and
Figure 6, although depicted at a time when the sun is high in the sky, show an evident variation of the air temperature after the construction, with a cooler temperature of almost 1 °C. The cooler spots could be found around the new buildings in the after-construction model.
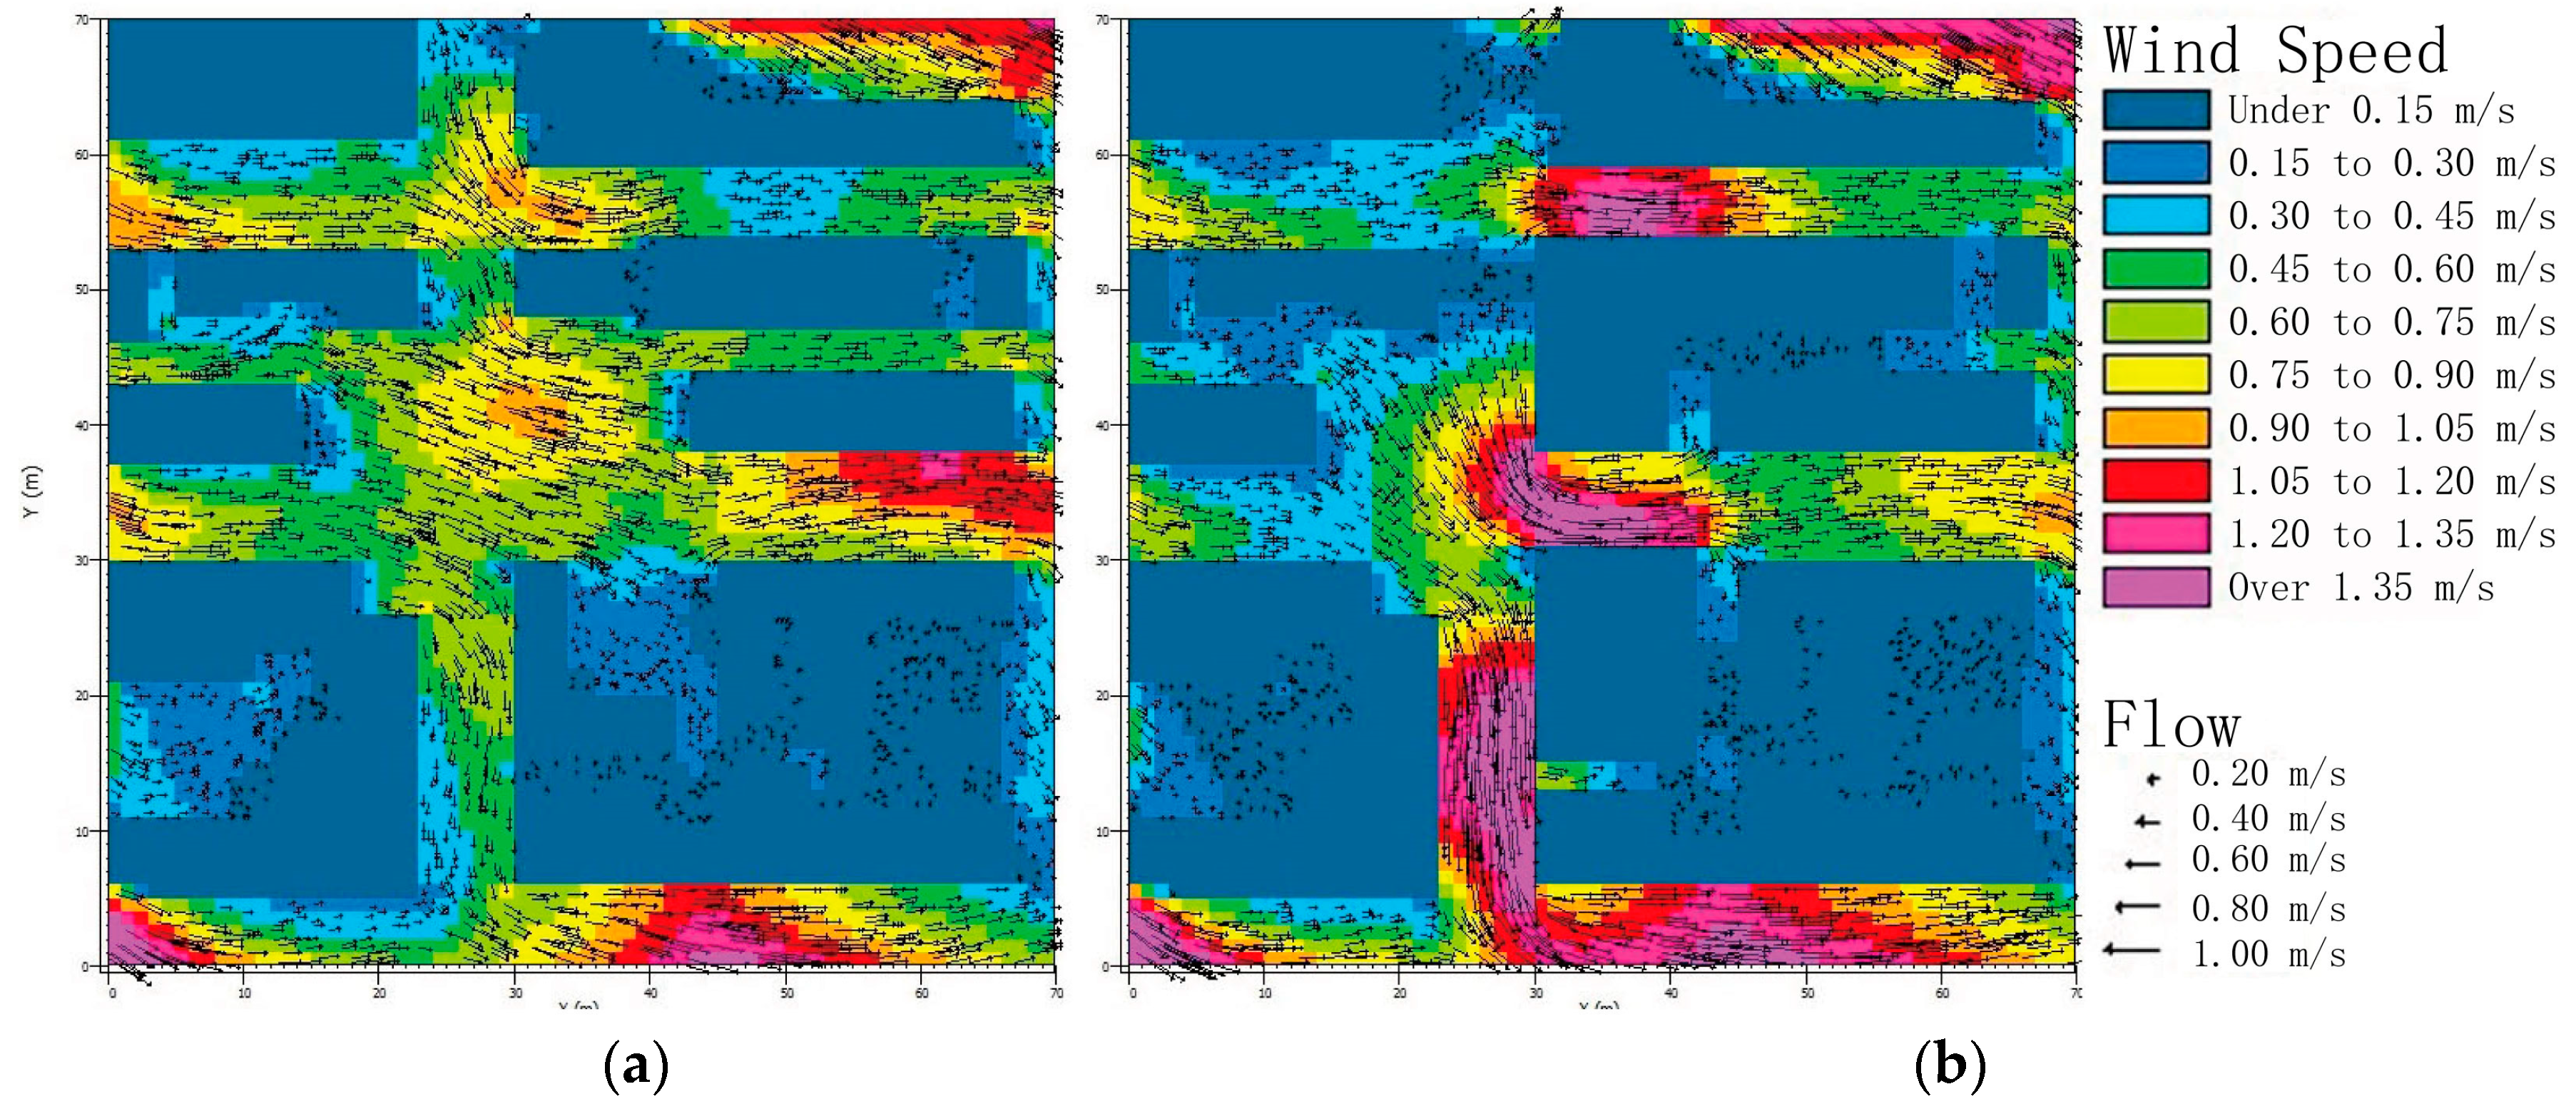
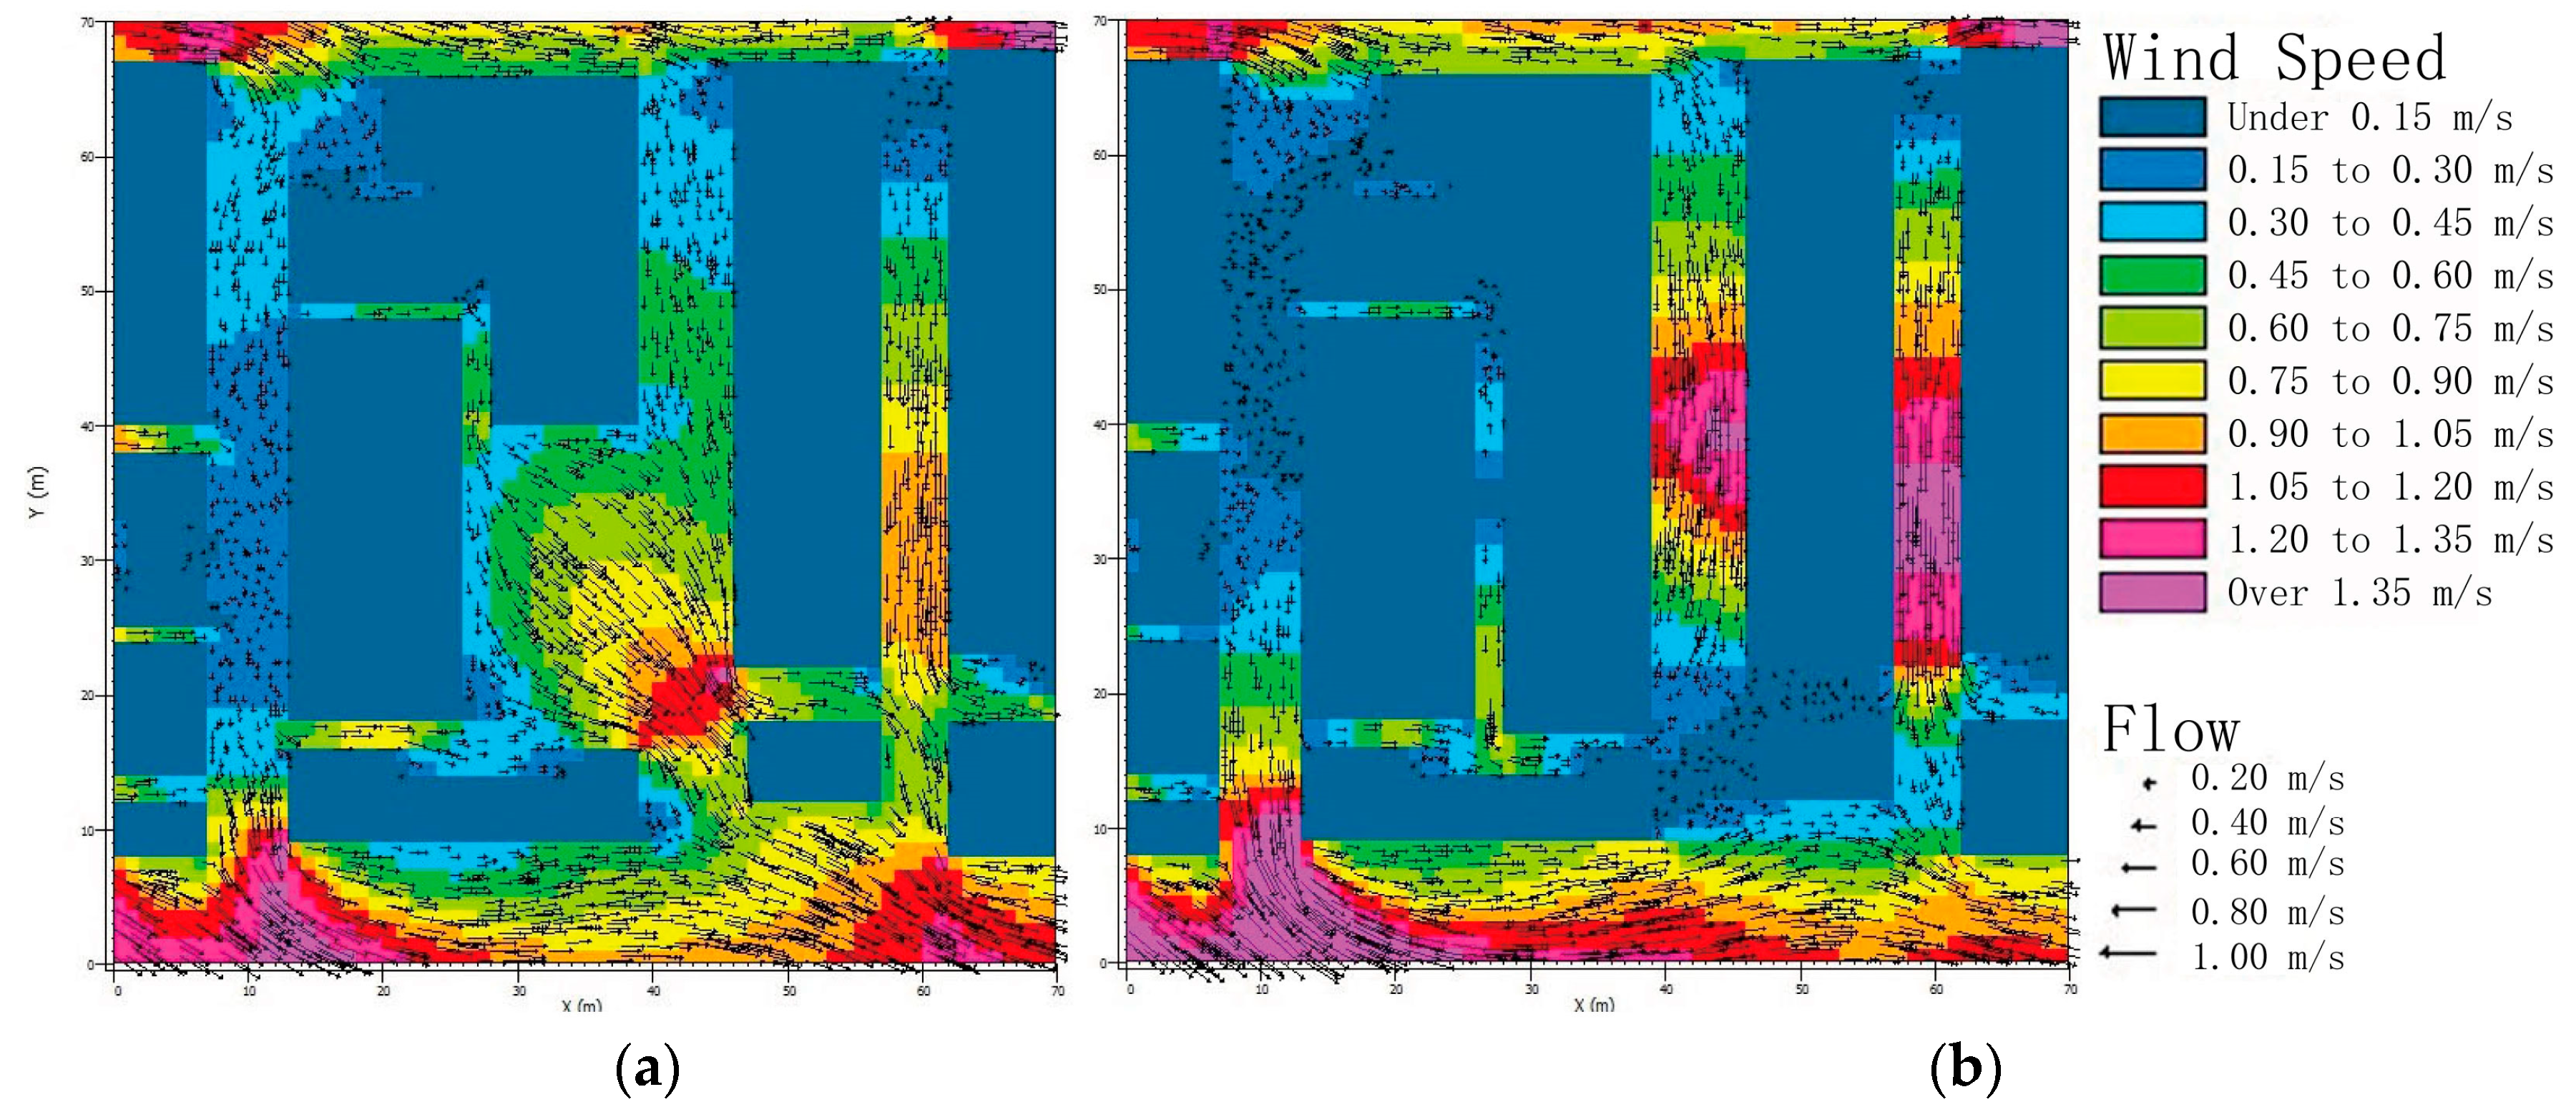
Meanwhile, in the wind speed distribution showed in
Figure 7 and
Figure 8, it emerges that the location with wind speed increases are consistent with the locations of air temperature decrease, and vice versa. Since the new buildings occupy open spaces and resulted in accelerated air flow, they seemed to reduce the stagnation of hot air at day-time, while thanks to their shading effects, they also reduce the midday air temperature.
In order to analyze the simulation results in more detail, it was decided to compare the microclimate parameters both in the current urban configuration and after the new constructions in some representative points.
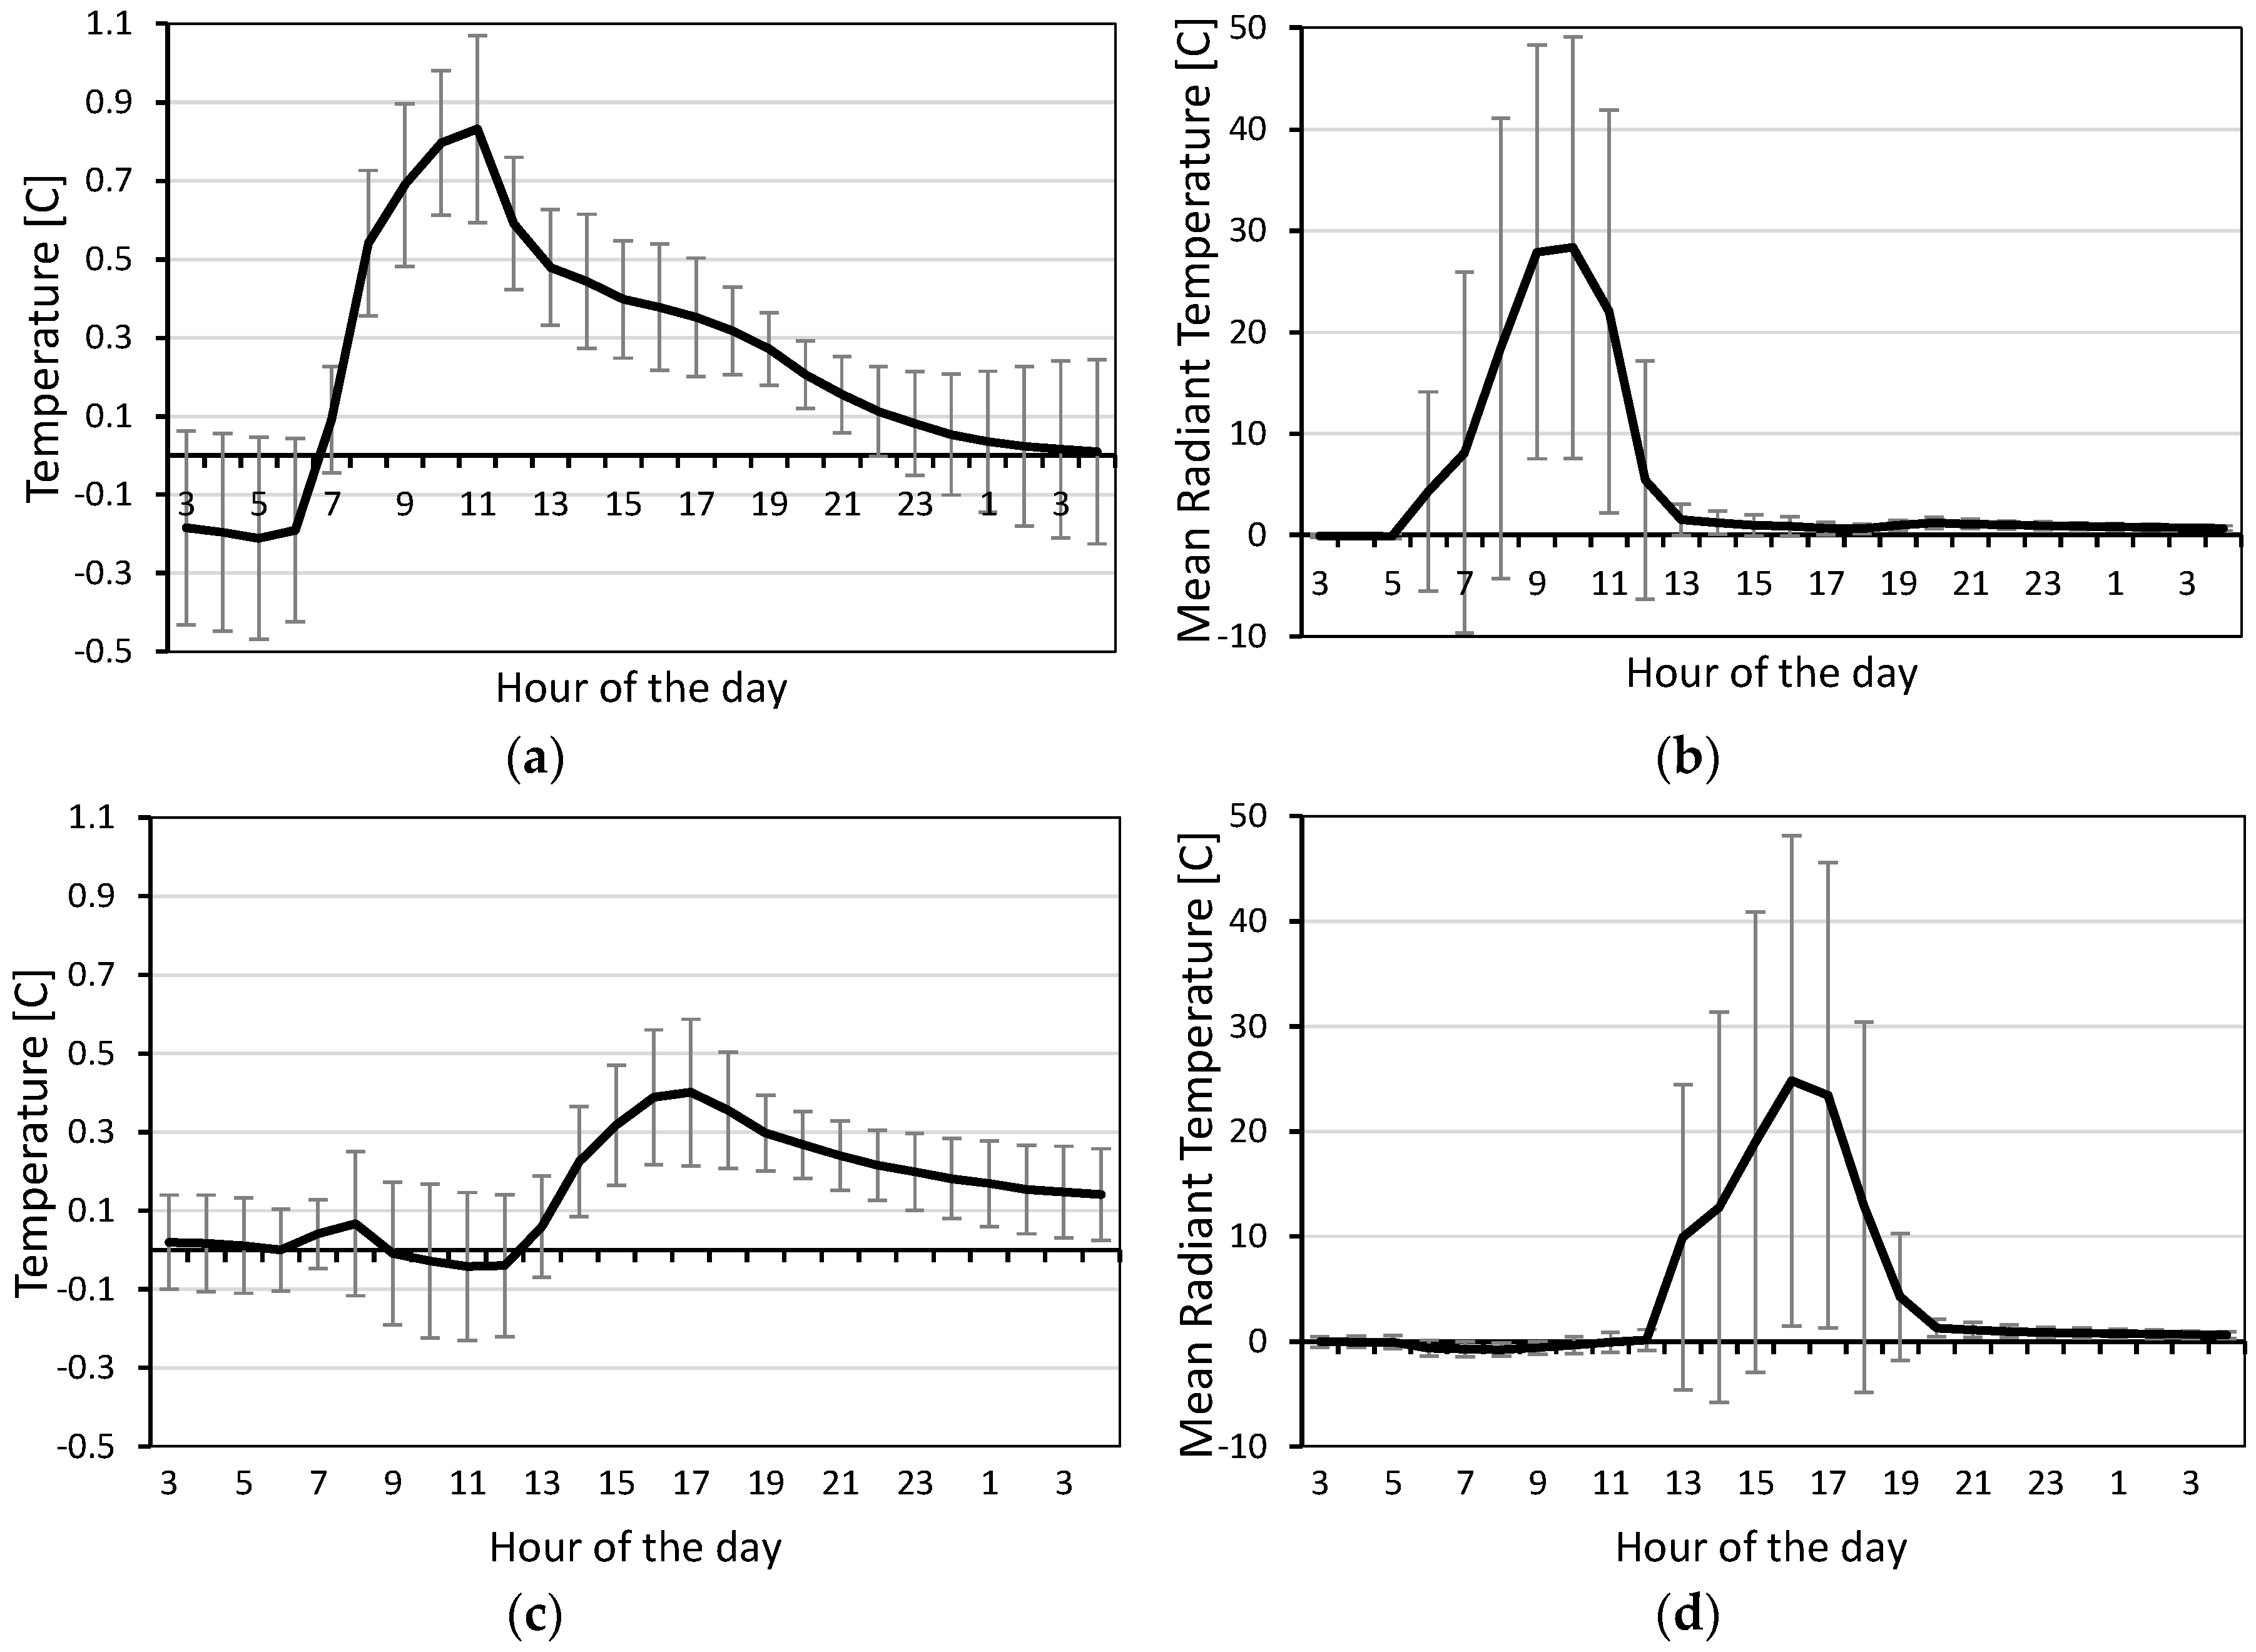
Figure 9 shows the difference between the air temperature and the mean radiant temperature in the current scenario versus the post construction one, in both the zones investigated in the present paper. The figure reports the average difference of the values obtained in nine receptors in each zone, together with the standard deviation among the values in the nine receptors.
The air temperature in the North zone shows a small reduction in the first hours of the night and then averaged air temperature values of almost 0.9 °C, with a reduction that becomes almost negligible during the following night hours.
In the South zone, the same behavior appears, although it is generally more mitigated and delayed. This means that the new constructions will result in a slightly cooler air temperature especially during the central hours of the day, thanks to the shading that the new constructions will provide. The standard deviation of the air temperature is generally constant through the day, and assumes values up to 0.2 °C, showing a reasonably homogenous value among the several receptors.
The differences in the values of the mean radiant temperature before and after the construction are significant. In particular, during the hottest day hours, the average difference reaches values of almost 30 °C and 25 °C in the North and South areas of analysis respectively. Conversely, overnight, the difference of the mean radiant temperature in the current scenario and in the post construction one tends to almost disappear. This means that the new constructions will have a significant impact in terms of shading the streets and creating lower mean radiant temperature.
The assessment of the change in the human thermal comfort before and after the constructions requires some preliminary discussion. In fact, although several studies have recently appeared, a lack of a general framework for assessing the outdoor thermal comfort exists. In fact, a number of biometeorological indices have been developed to describe human thermal comfort by aligning local microclimate conditions and human thermal sensation [
34].
Human thermal perception depends on air temperature, air humidity, wind speed and radiation fluxes, as well as the personal body energy balance, and their variability. The Physiologically Equivalent Temperature (PET), a human thermal comfort index based on the Munich energy-balance model for individuals (MEMI) was assessed in this study [
35]. PET is defined as the air temperature at which, in a typical indoor setting, the human energy budget is maintained by the skin temperature, core temperature, and sweat rate equal to those under the conditions to be assessed. PET is particularly suitable for outdoor thermal comfort analysis as it translates the evaluation of a complex outdoor climatic environment to a simple indoor scenario on a physiologically equivalent basis that can be easily understood. PET is a steady state index (that assumes thermal equilibrium) and has the unit degree Celsius, being easily interpreted by urban planners and not requiring an expert.
The software “RayMan” was used for the assessment of PET using the output data from ENVI-met simulation.
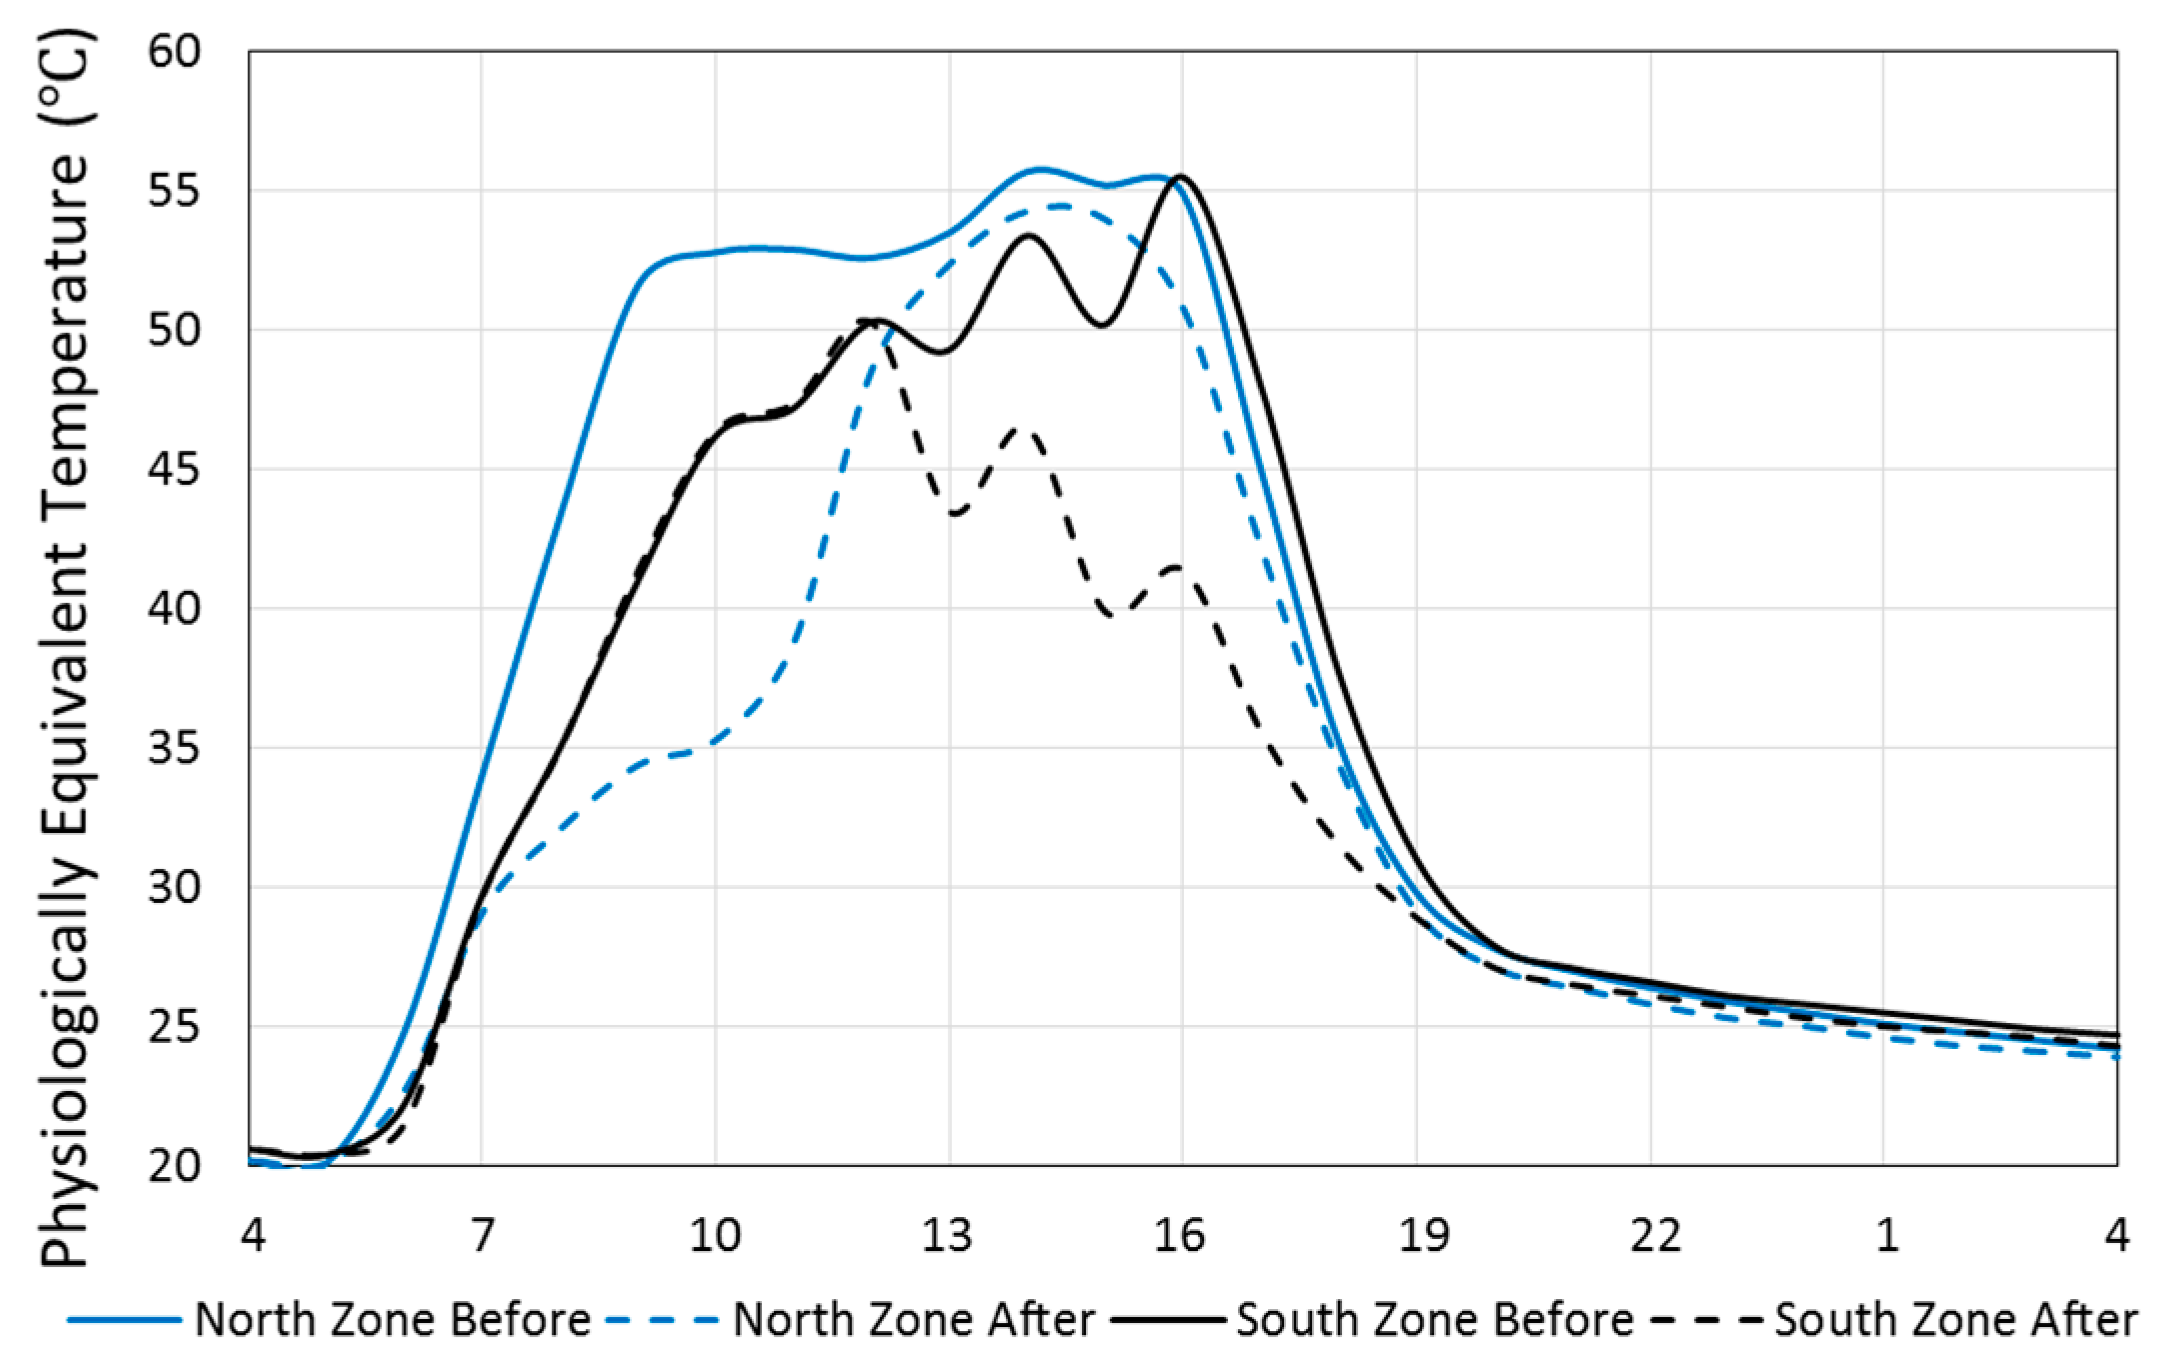
Figure 10 shows the Physiologically Equivalent Temperature (PET) in the two investigated areas through the summer day. The results show that the development with the higher density would reduce the PET in the urban canopy during the summer time. The maximum PET reduction will be around 17.5 °C at 10:00 in the north zone, and around 14.1 °C at 14:00 in the south zone. Overall, through the investigated summer day, the average PET reduction is 3.4 °C in the north zone and 2.4 °C in the south zone.


