1. Introduction
Japan had prohibited rice imports for long periods of time, but through the Uruguay Round of negotiations, Japan conceded a limited opening of its rice market and permitted minimum access (MA) rice imports starting in 1995. The MA scheme entitles a certain quantity of foreign rice to enjoy a zero tariff rate when the rice is imported into Japan’s market. In 1999, Japan permitted imported rice to enter through the customs tariff with a prohibitive tariff rate of about 351 yen/kg, which was later lowered to 341 yen/kg in 2000. With regard to the MA quota policy, foreign rice is subjected to a lower mark-up limitation of 292 yen/kg. Subsequently, the total import quota of MA in brown rice has been adjusted to 767,000 tons since the 2000 fiscal year including a simultaneous buy and sell (SBS) system. Meanwhile, the upper limit of SBS rice is currently fixed at 100,000 tons. The quota level designed in 2000 has been maintained until next World Trade Organization (WTO) negotiations.
Japan’s MA policy includes Ordinary Minimum Access (OMA) rice and SBS rice. OMA rice focuses on medium- and long-grain rice, while SBS rice consists of short-grain rice. Imported rice through the SBS channel is marked up when entering Japan’s market. In the course of the SBS quota tender, the importers sell the imported rice to the Ministry of Agriculture, Forestry and Fisheries (MAFF) of Japan and simultaneously buy it back. In this process, MAFF grants the import quota to those bids that maximize the mark-up. Thus, the importers and wholesalers themselves decide the nation and category of importation within the SBS quota. Japan’s SBS rice is mainly from China, followed by the USA, Australia, Thailand, Pakistan and other countries.
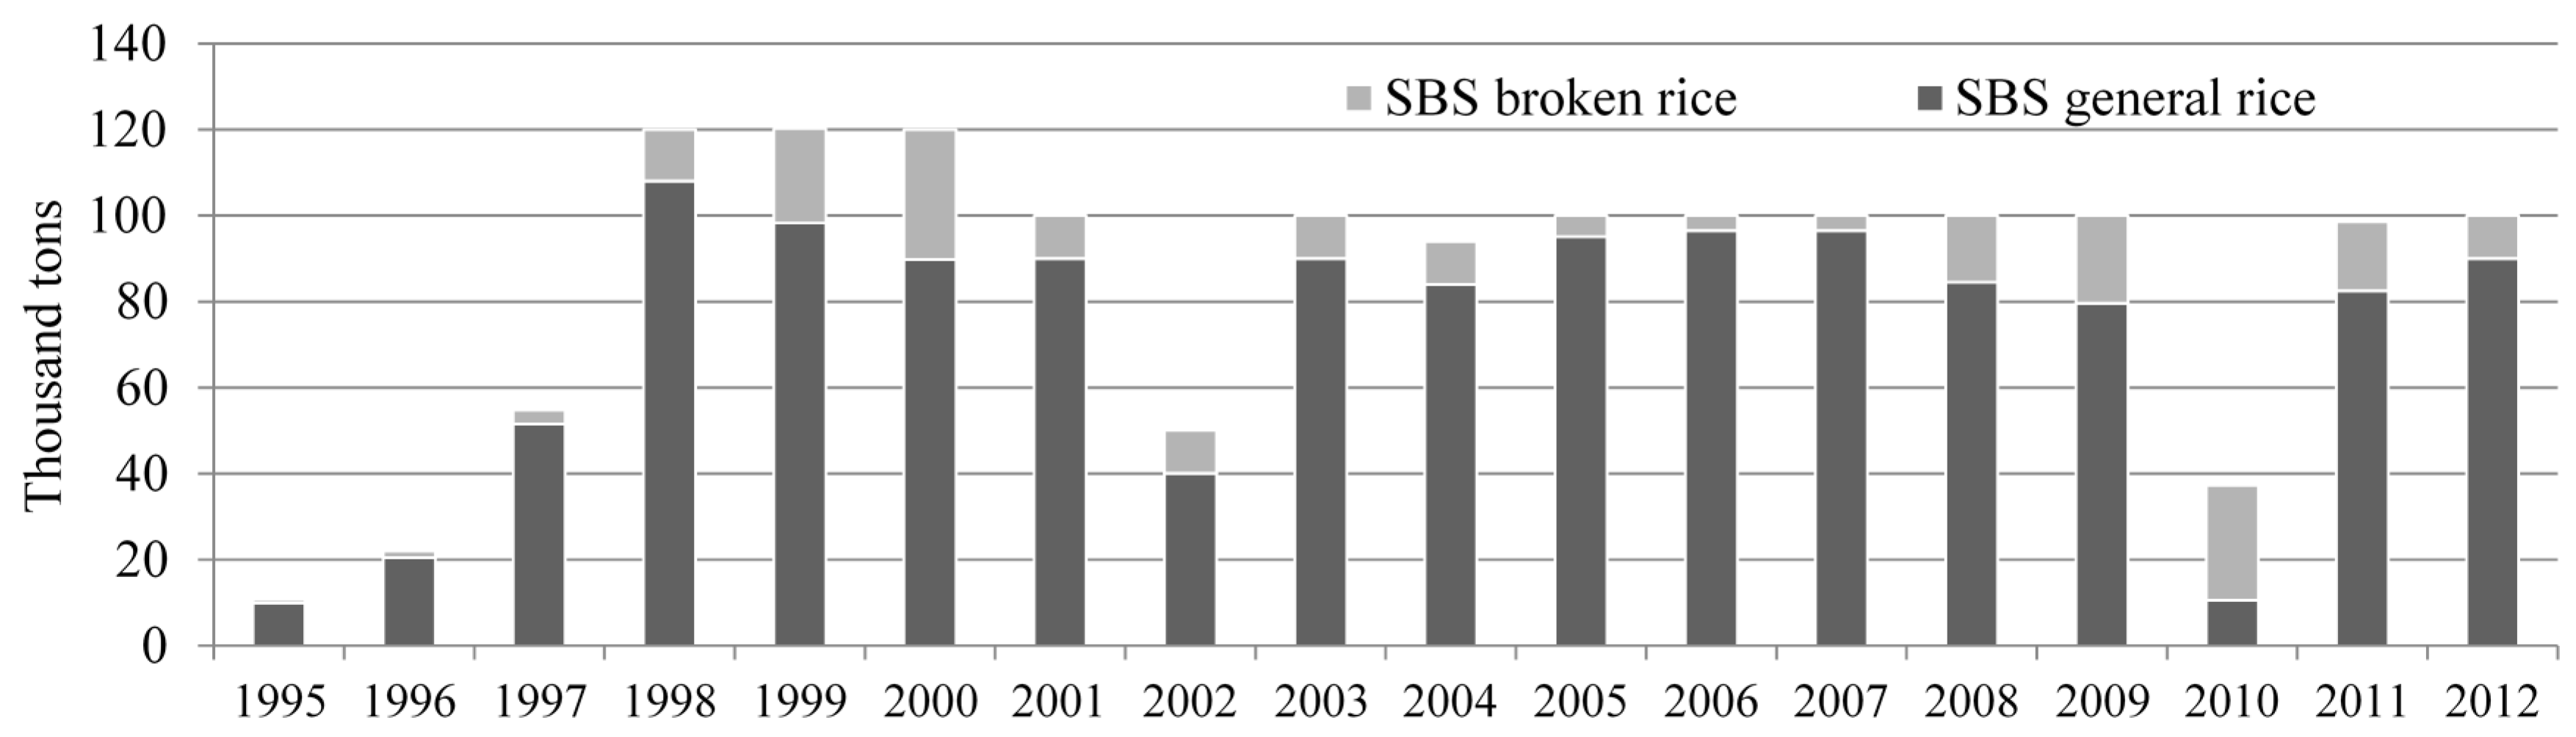
There are, in fact, two kinds of rice within the SBS rice: SBS general rice and SBS broken rice. Broken rice, mainly used in food processing and animal feeding, holds a small proportion of the total SBS quota. SBS general rice can be consumed as a staple food, and this category of rice is the investigated object in this study (
Figure 1, source: [
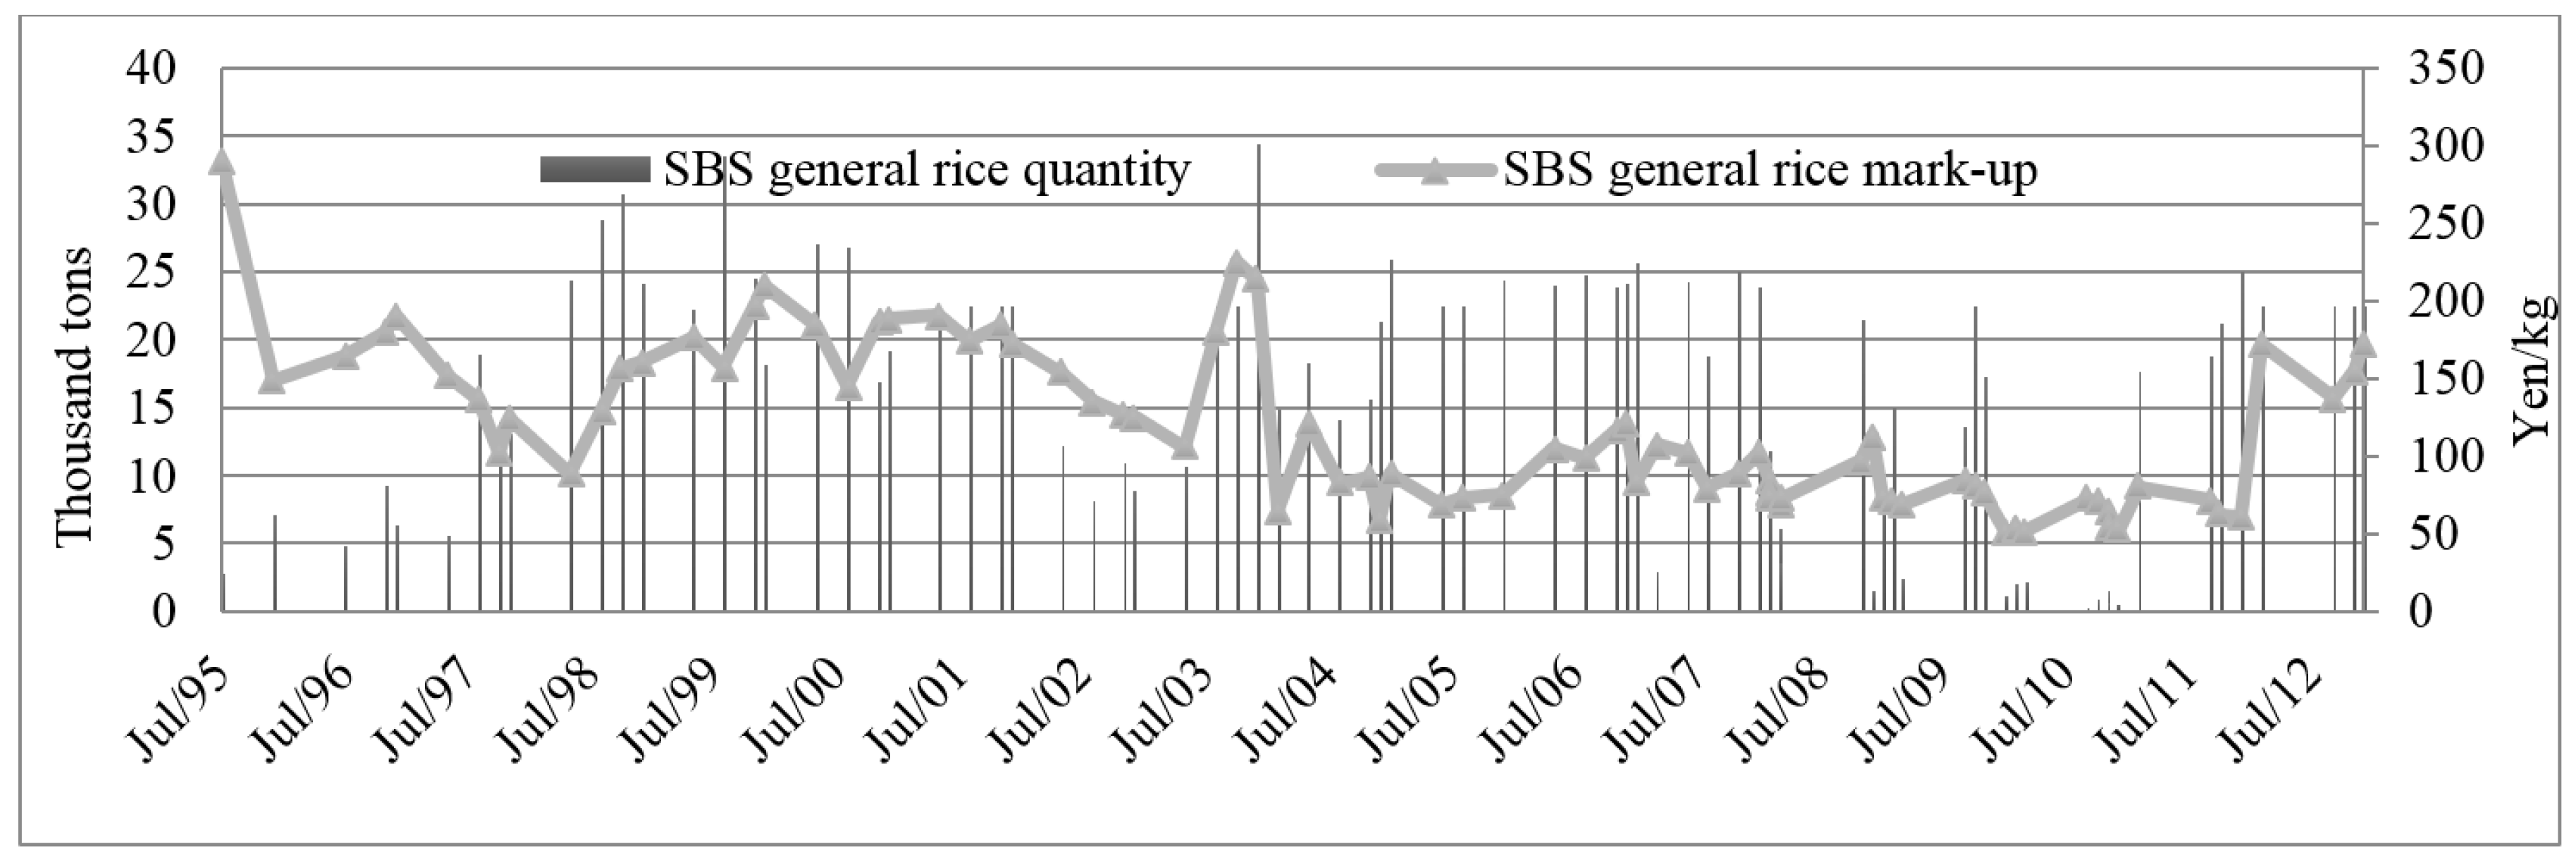
1]). MAFF usually organizes four or more instances of bidding activities annually for the rice import quota for SBS. From the fiscal year of 1995 to the fiscal tear of 2012, MAFF carried out a total of 82 times of tenders (
Figure 2, source: [
1]).
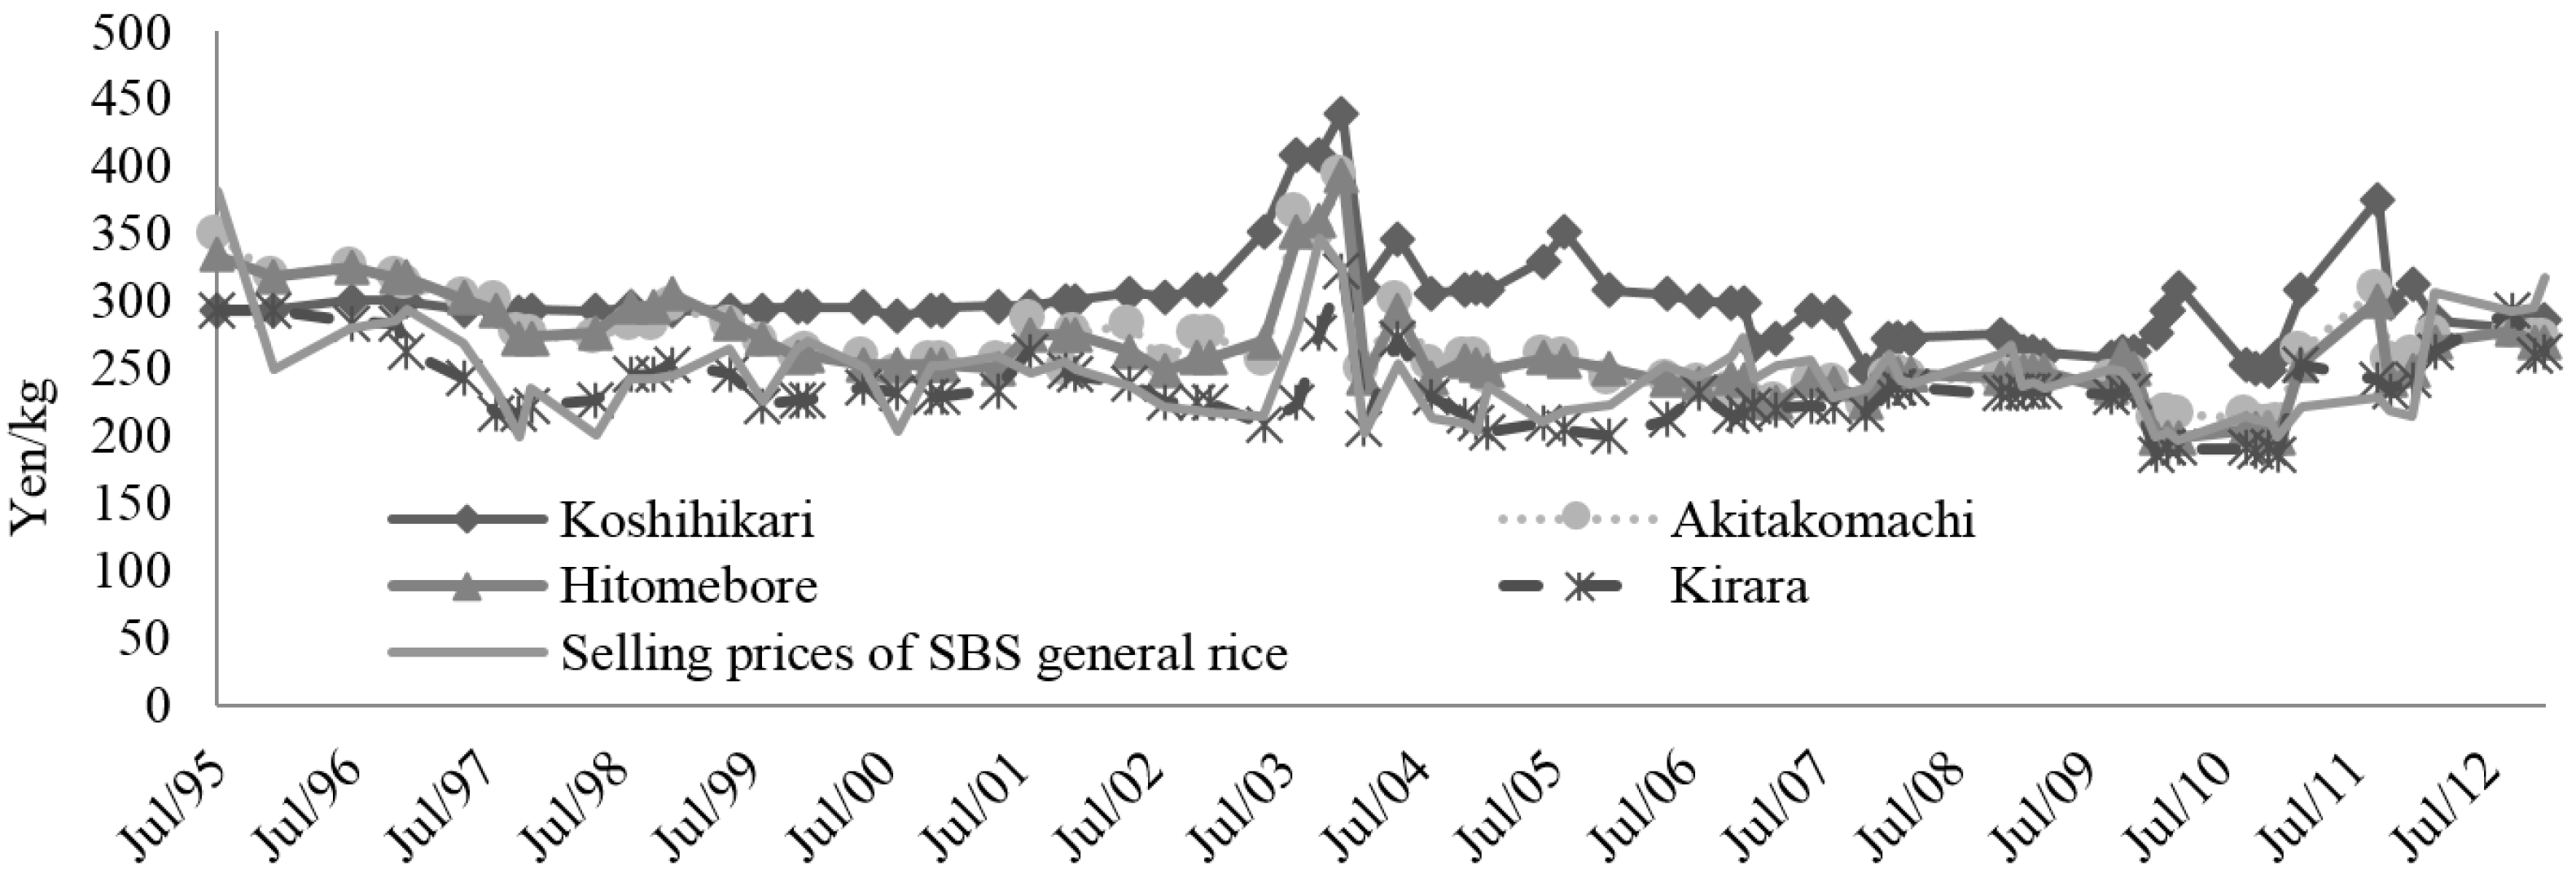
Even though the imported rice is imposed on mark-up, the selling prices of SBS general rice by MAFF still have some price advantages over Japan’s domestic rice, Koshihikari, Akitakomachi, Hitomebore and Kirara, in general (
Figure 3, source: [
2]). In practice, the mark-up imposed by MAFF on imported rice appears as a trade barrier, while whether the intervention of MAFF in the process of bidding does cause non-tariff barriers to trade (NTBs) is worth studying.
Many researchers have put forward various concepts of NTBs. The research in Reference [
3] denoted that “NTBs consist of all barriers to trade which are not tariffs”. In fact, this meaning of NTBs was defined by what it was not. Moreover, NTBs are explained by Reference [
3] as measures that “alter directly or indirectly the prices and/or quantities of trade”. Therefore, NTBs include distorting trade plans such as the import quota. There are actually many kinds of methods to measure the effects of NTBs according to the categories and characteristics of NTBs. Several prevailing methods and related literatures are reviewed and summarized as follows. The price wedge method [
3,
4,
5,
6,
7] was widely adopted and the key of this method is to compare prices under the assumption of those without NTBs with the prices in the presence of NTBs. However, the limitation of this method requires the imported product and domestic product to have as homogenous attributes as possible. When the requirement is not satisfied, some parameters should be introduced to evaluate the differences in consumption patterns and, based on that, to calculate NTBs. In practice, if the quality differences between the imported product and domestic product were overlooked, the evaluation of NTBs would be overestimated or underestimated. Therefore, parameters, such as elasticity of substitution, are generally introduced to represent the quality difference. Besides, the gravity-based method [
8,
9,
10,
11] can also be used to examine NTBs. Introducing dummy variables in the gravity model to represent NTBs can simplify the calculation, while it might lack accuracy. Additionally, the inventory-based method [
12,
13,
14] counts the items of Sanitary and PhytoSanitary (SPS) and technical barriers to trade (TBT) as estimating NTBs. However, there is controversy over this method for focusing on the measurement weights for different NTBs. Another method applied extensively is the partial equilibrium or general equilibrium model [
15,
16,
17,
18,
19], which dynamically and synthetically considers the importing and exporting functions, and measures NTBs in a comprehensive context. Some researchers adopted other methods to estimate NTBs, for example cost-benefit measurements based on risk assessment [
20] and game theory [
21].
Japan has already been a member of the Trans-Pacific Partnership (TPP) promoted by the United States to realize free trade among memberships. However, one of the requirements for Japan’s participation in the TPP is that Japan has to open its rice importing market and cut the trade barriers to relax its limitation of the rice import quota. In this context, Japan has been required to ensure that imported rice has the same opportunity as Japan’s domestic rice when sold in the supermarket to cater to the needs of the TPP. Given this development, it is vital to study the welfare effects of adjusting Japan’s rice quota based on measuring NTBs. Moreover, the calculation of NTBs is completed based on estimating consumption patterns (the elasticity of substitution and preference parameters). The findings could offer some useful insights for foreign SBS rice producers such as China, the USA, etc. Finally, in the scenarios, this study attempts to compare the changes in consumer prices of SBS rice and consumers’ welfare with assumptions of altering the SBS quota volumes.
2. Theoretical and Analytical Framework
In microeconomics, consumer theory is built upon the assumption that the consumer is a rational human being who makes decisions to maximize utility. Subsequently, a utility function can be applied to study consumer behavior and choices. According to Reference [
22], the consumer purchases a combination of goods to maximize their utility which is subject to a budget constraint. The consumer’s preference for each product can be expressed with a utility function. Because of the budget constraint, the consumer’s decision depends on the prices of the products, considering the properties of the goods and the preferences of the consumer. This kind of utility function with the corresponding constraint conforms to reality for the introduction of the elasticity of substitution. The elasticity of substitution represents the quality differences between the goods, and reveals whether the goods are substitutes or complements. Therefore, to solve the utility optimization problem, consumers’ consumption patterns should be studied, i.e., the elasticity of substitution representing the relative properties of the products, and the preference parameters of the consumer for different products are introduced into the utility function with a budget constraint.
In this respect, let Japan be the rice-importing country and the foreign countries are the rice-exporting nations. It is assumed that Japan is faced with changes in the imported price fluctuation with world rice prices. In addition, the domestic rice prices of Japan are decided by its supply and demand. We assume that Japanese households consume the composite of rice differentiated by their sources, i.e., rice from the domestic market and abroad. More precisely, we adopt a previous type of utility function [
23], which was extended by the research in References [
6,
24,
25]. The Japanese household consumption of japonica rice from Japan and foreign countries can be formulated as follows.
where
Dt is the Japanese domestically produced rice quantity,
It stands for the imported SBS general rice volume, and
is the total SBS quota.
Pdt is the price of Japanese domestic rice, while
Pit is the consumer price of imported SBS general rice. Finally,
Et is the expenditure of consuming japonica rice. Further,
θ is the elasticity of substitution, and
a and 1 −
a are the Japanese consumers’ preference for domestic and imported SBS general rice, respectively.
Thus, maximizing the utility Equation (1) defined by
Ut(Dt, It) at time t subject to the budget constraint and import quota, the following Lagrange function is constructed which yields the first-order conditions.
The Kuhn-Tucker conditions are as follows:
In order to estimate the preference parameters, we need to assume that
λ2 = 0,
λ1 > 0 (which conforms to reality). From Equations (3) to (6), we can obtain the following equation:
Meanwhile, the elasticity of substitution [
26] was introduced to measure the degree of substitutability of one good for the other, which is subsequently applied in the study to estimate the elasticity of substitution between the domestic rice and imported rice as is defined below.
where the subscripts
d and
i are Japan’s domestic rice and imported SBS general rice, respectively;
cd and
ci are the consumption of goods
d and
i;
Pd and
Pi are the prices of goods
d and
i, respectively;
MRSi,d is the marginal rate of substitution between
d and
i. Using the results of the calculated elasticity of substitution
θ by Equation (8) and the sample data, we can employ the ordinary least squares (OLS) regression of Equation (7) to obtain the values of the preference parameter,
a, in the utility function.
Thereafter, the tariff equivalents of NTBs (the SBS import quota) can be estimated. Consumer prices of imported SBS general rice
Pit can be decomposed into the following factors:
is the CIF (Cost, Insurance, and Freight) prices of imported SBS general rice;
MP is the mark-up imposed on imported rice by MAFF;
EC is extra cost for the import quota induced by MAFF’s intervention, which appears as a trade barrier. Since the freight charge has an effect on the prices of traded products [
27],
CT is introduced to represent the cost of transportation charged from Japan’s port to Japan’s supermarket;
π is the net profits of selling SBS general rice measured by yen/kg; and
te represents the tariff equivalents of the NTBs of the SBS import quota.
To maximize Japanese consumers’ utility, the following relationship fulfills:
where
MRS is the marginal rate of substitution between the two kinds, and
MU is the marginal utility. Combining Equations (7) and (11), the tariff equivalents,
te, can be specified as shown in Equation (12), which can be used to calculate the tariff equivalents of NTBs (SBS quota).
On the basis of the calculated tariff equivalents of NTBs (12), the changes in rice prices and consumers’ welfare in the cases of altering the quota can be evaluated. As for the consumer welfare, compensated variation (CV) is applied to measure the welfare effects. The research [
28] introduced the concept of the shifts of expenditures necessary to compensate consumers for the effects of price changes after trade reforms.
where
E(·) is the expenditure function;
Pit and
are the initial and new consumer prices of imported SBS general rice in Japan’s market;
U is the initial utility level. A positive
CV means that consumer welfare decreases, while a negative
CV implies a gain in consumer welfare.
Following the previous research [
29], let
Ih (
,
U) be a vector of Hicksian compensated demand at the price
and at the initial utility
U.
Because
dPit =
−
Pit, and
dIh =
Ih (
,
U) −
It, Equation (14) can be transformed into the formation of Equation (15).
To receive the compensated quantities demanded
dIh, we estimate a quantity demanded function of prices and per capita income, which is shortened as
IC (Equation (17)). Therefore, price elasticity
ep and income elasticity
ei can be evaluated. Based on the Slutsky equation, the compensated price elasticity
is the formation of Equation (18), where
w is a spending share of the SBS general rice in the total expenditures.
Therefore, CV can be calculated and welfare changes can be received.
4. Results and Discussions
In order to investigate the general condition, we construct a kind of “integrated rice”, which is defined as the average of Japan’s four kinds of rice (Koshihikari, Akitakomachi, Hitomebore, and Kirara). Therefore, the prices of “integrated rice” are calculated as the volume weighted average prices of Japan’s four kinds of rice, and the quantities of “integrated rice” are the total Japanese consumption of domestic rice.
Table 2 presents the results of the preference parameters “
a” from Equation (7) by different types of domestic rice consumed in Japan. The estimated preference parameters are greater than 0.5 (see for detail in [
30]), and therefore it supports the finding that Japanese households prefer domestically produced rice compared with imported SBS general rice in the study. The previous research [
31] indicated that Japanese people consumed rice with more attention to the sensory enjoyment compared with the feeling of satiation. Besides, it was discovered by the research [
31] that Japanese consumers regarded “type of rice” as an important criteria for judging good rice. Therefore, results in this study showed that domestically produced rice is a better type of rice and could make the Japanese more satisfied from the viewpoint of sensory enjoyment.
Table 3 presents the results of the estimated elasticity of substitution from Equation (8), and elasticities were found to be greater than one. Moreover, the estimated elasticities shown in
Table 3 indicate that the nearest approximation of SBS general rice is Akitakomachi rice because of its highest elasticity, 3.45, followed by Hitomebore, Kirara, and integrated rice, while the most different compared to SBS general rice is Koshihikari rice, which in practice is the most expensive rice in Japan due to its high quality. Besides, Japanese consumers’ favorite rice is Koshihikari since the preference for it is highest at 0.79 (
Table 2), followed by integrated rice, Hitomebore, Akitakomachi and Kirara.
According to Equation (17), we present the results of the compensated variation (CV) that is designed to measure consumer’s welfare effects in
Table 4. The table shows the relationship between the quantity of SBS general rice demanded with the consumer prices of SBS general rice and Japan’s per capita income. The evaluated coefficients
ep and
ei are the elasticities of prices and incomes, respectively. Thereafter, the compensated price elasticity is expressed and computed using Equation (18). Since
w in Equation (18) is estimated on average to be less than 0.0075% through SBS general rice expenditures divided by Japan’s national disposable incomes, then
. Using the elasticities in
Table 4, the compensated price elasticity
is approximately equal to −2.836 in the study.
Meanwhile, as the consumer prices of SBS general rice in Japan’s market are unavailable, we utilize the selling prices of SBS general rice by MAFF as a substitute to approximately calculate Equations (7) and (8). Thereafter, the tariff equivalents were obtained, and by combining Equations (9) and (12), the real consumer prices of SBS general rice can be calculated. Thus, the results reveal that the consumer price of SBS general rice was on average equal to 443 yen/kg from 1995 to 2012.
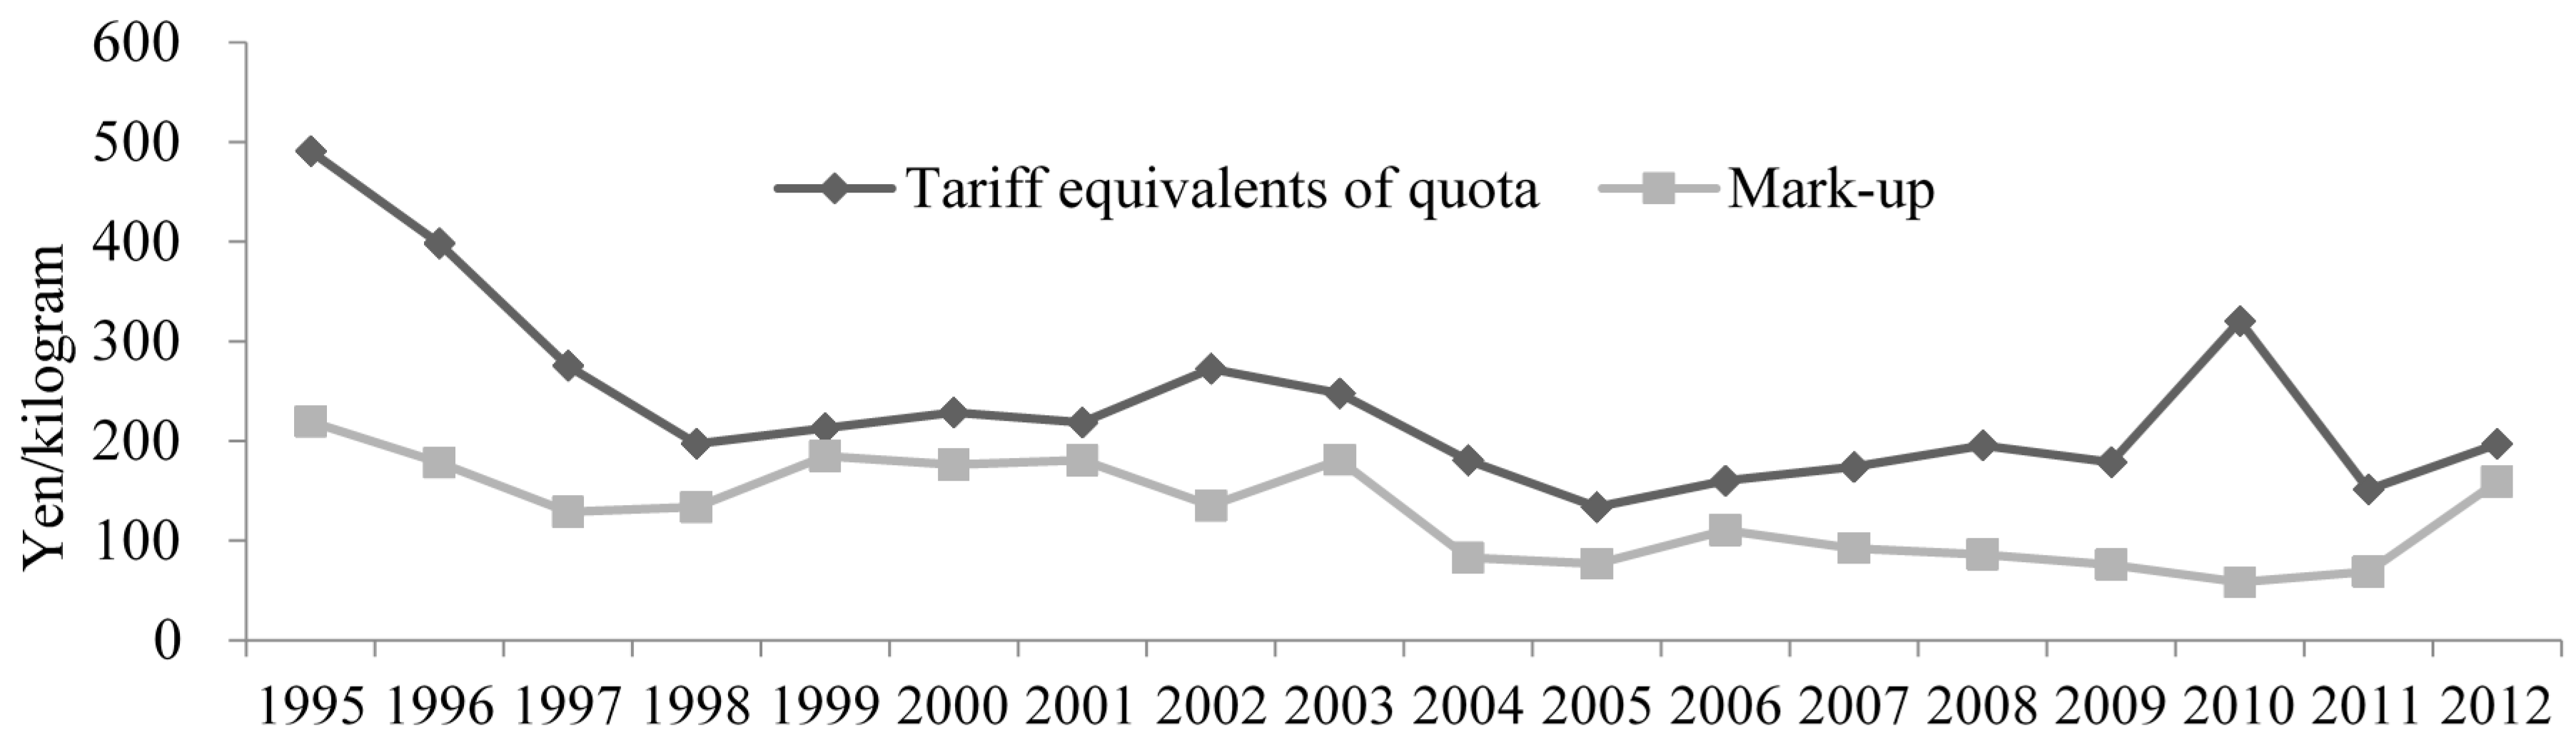
On the basis of the elasticity of substitution and preference parameters, applying the empirical data in Equation (12), we compute the tariff equivalents of NTBs (the SBS import quota). In this context, we utilize the constructed integrated rice data because, in practice, the Japanese consume different types of domestically produced rice as well as imported rice, and the integrated rice conforms to reality. Meanwhile,
Figure 4 is drawn according to the results of mark-up [
1] and tariff equivalents of the SBS import quota compared with Japan’s integrated rice. In 1995 Japan opened its rice market to the world through the MA channel, yet the importation was only about 10 thousand tons, and the volume of the SBS importation increased to 50 thousand tons in 1997. Correspondingly, the tariff equivalent of the SBS import quota was high enough to reach 491 yen/kg in 1995, and decreased to 275 yen/kg in 1997 (
Figure 4). From 1998 the quota of SBS was fixed at 120 thousand tons; meanwhile, the tariff equivalents of it were around 200 yen/kg. After 2001 the SBS quota was cut down to 100 thousand tons, while accordingly the tariff equivalents decreased gradually to about 180 yen/kg for most years of the last decade.
Given this, some special attention is paid to the special points. For example, the research [
32] found evidence that the Japanese government established intended buying and selling price criteria for each foreign country. As noted by the author, the criteria regulated a much wider difference between buying and selling prices for China’s rice, while there was a narrower difference for the rice from the USA in 2002. China had to afford a higher mark-up compared with a lower mark-up imposed on the US rice. Therefore, in 2002 rice imports from China decreased sharply, and this caused a significant reduction of the SBS volume that year. As a response, the tariff equivalent reached 272 yen/kg in 2002. Furthermore, Japan implemented a rice traceability policy in 2010, which has required wholesalers to label detailed information of the imported rice such as the place of origin, and this measure induced traders and wholesalers to reduce rice importation. Thus, SBS rice importation was even less than half of the quota in 2010, and correspondingly the tariff equivalent reached 320 yen/kg in that year. However, a catastrophic earthquake and tsunami occurred in Japan in 2011, and rice farming was affected. Subsequently, Japanese consumers were anxious due to the radiation in plantations, especially the rice plantations in the northeastern areas of Japan. Therefore, Japan recovered SBS rice importation, while tariff equivalents decreased to 151 and 197 yen/kg in 2011 and 2012, respectively.
Table 5 shows the estimated tariff equivalents of the SBS quota and mark-up in these special years.
To further study the welfare effects of the SBS quota on Japanese rice consumers, we conduct three scenario situations where the quota is modified. In practice, SBS rice is subject to below the limitation of 100 thousand tons. Thus, in the first scenario, we suppose MAFF increases this limitation by 10 thousand tons and requires SBS rice imports to be within 110 thousand tons in one fiscal year. Moreover, we suppose that Japan’s rice traders and wholesalers would jointly bid more than 2500 tons than before for SBS general rice in each tender. Thus, in the case of four instances of bidding in every fiscal year, the SBS volume would increase to 110 thousand tons. Meanwhile, the consumer price of SBS general rice would fluctuate because of the volume changes. The result shows that the consumer price of SBS general rice on average decreased by 57 yen/kg, so the new consumer price of SBS general rice equals 386 yen/kg. Therefore, the change of Japanese consumers’ welfare denoted by CV is −248 million yen on average for each instance of bidding, and −1.23 billion yen for a fiscal year. As earlier mentioned, the negative CV indicates that Japanese consumers benefit through the increase of the imported volume. In summary, if MAFF increased the SBS quota to 110 thousand tons in one fiscal year, Japanese consumers would gain about 248 million yen in every time of tender, and would win about 1.23 billion yen on average in one year.
Similarly, in the second scenario, the SBS quota volume is changed to be 120 thousand tons in one fiscal year. In this case, the simulated results show that the consumer price of SBS general rice is lowered by 82 yen/kg, and thus the new consumer price equals 361 yen/kg in the context of 120 thousand tons of the SBS quota. Moreover, Japanese consumers’ CV equals −420 million yen on average for each time of tender, and would benefit from an extra 1.86 billion yen in one fiscal year. Subsequently, we can obtain an SBS quota boundary and, beyond this quantity boundary, the consumer price of SBS general rice would be lower than the prices of Japan’s domestic rice. Through simulation, the boundary was found to be equal to 180 thousand tons. Thus, using this as the third scenario, i.e., the SBS quota is adjusted to be 180 thousand tons in one fiscal year. Results show that the consumer price of SBS general rice would be cut down by about 188 yen/kg, and thus the new price would be about 256 yen/kg on average, which is lower than the 262 yen/kg of the “integrated rice” price. In this context, Japanese consumers would benefit from an extra 919 million yen in every bidding process, and would gain extra 3.98 billion yen in one fiscal year when the SBS quota is changed to 180 thousand tons.
5. Conclusions and Policy Implications
Japan has vigorously protected and supported its rice farming for decades, and the Japanese have great zeal to consume domestic varieties of rice over imported rice. However, under the strong pressure of advocating freer trade with multinational trade negotiations, Japan had to gradually open its rice market to the world as of 1995. In order to exempt domestic rice from accepting a strike by foreign rice, MAFF imposes a mark-up on imported SBS rice. The mark-up should be limited to within 292 yen/kg according to the regulation. Whether the intervention of MAFF in the market could lead to NTBs for bidders or not is worth studying. The empirical results indicate that the intervention of MAFF does cause NTBs for the bidders; or for the sake of receiving the SBS quota, traders and wholesalers have to afford some other costs besides the mark-up because the calculated tariff equivalents of the NTBs (SBS quota) are bigger than the mark-up themselves. The extra cost was about 109 yen/kg on average from 1995 to 2012.
Moreover, the average tariff equivalent was 227 yen/kg, which is smaller than the limited regulation of 292 yen/kg. While only in some special years (for example in 2002 and 2010), the tariff equivalents of the quota came close to or exceeded the upper limit, which demonstrated that MAFF’s intended regulation in 2002 and the rice traceability policy had significant effects on the imported rice. Therefore, in the process of trade negotiations, national policies should pay attention to this kind of unobservable trade barrier. On the other hand, SBS general rice exporters such as China and the US should improve the quality of their rice and make a good image for Japan’s consumers so that the effects of rice traceability can be reduced.
In the analysis of Japanese rice consumption patterns, we can see that it is easiest to substitute Akitakomachi using SBS general rice due to it having the highest elasticity estimated; on the contrary, it is the most difficult to substitute Koshihikari using SBS general rice compared with other varieties, indicated by its lowest elasticity. This phenomenon maybe because the prices and quality of SBS general rice approximate the prices and quality of Akitakomachi, while the Koshihikari rice owns the top quality rice with the highest prices. The meaning of the elasticity of substitution reflects the degree of impacts on the relative price changes and quantity ratio between the two goods. Since all of the calculated elasticities are bigger than one, it may not be unreasonable to conclude that SBS general rice has a competitive ability with Japan’s four kinds of domestic rice. As for Japan’s rice importers of SBS general rice, they can focus more on Japan’s Akitakomachi, followed by Hitomebore and Kirara rice, because the production or price fluctuations of these rice varieties can affect the demand of SBS general rice more than Koshihikari.
As far as the preference parameter is concerned, it is based on the concept of ordinal instead of cardinal preferences. Therefore, if Japanese consumers’ utility
Ut(
Dt,
It) of japonica rice consumption is equivalent to 1, then Japanese consumers’ preference for Koshihikari is 0.79, and their preference for SBS general rice is 0.21. The other preference parameters in
Table 2 also comply with this law. If we arrange these preference parameters in order of size, 0.79 > 0.73 > 0.72 > 0.71, we can judge that Japanese consumers’ favorite rice is ranked as Koshihikari at the top, followed by Hitomebore, Akitakomachi and Kirara. Therefore, it is worth it for SBS general rice exporters such as China and the United States to research and grasp the planting circumstances and producing techniques of Koshihikari so that they can produce a similar taste and high quality of rice for Japanese consumption.
From 1995 to 2012, the average mark-up was 118 yen/kg and the average tariff equivalent was 227 yen/kg compared with Japan’s integrated rice, and it almost doubled the impacts of the mark-up on the rice because of the intervention by MAFF. Thus, the intervention of MAFF did induce an extra unobservable burden for rice traders and wholesalers. The climax happened in 2002 and 2010, and tariff equivalents in other years were quite normal. While in 2011 Japan suffered a catastrophic earthquake and tsunami, which led to a higher demand for imported SBS general rice, which is why the tariff equivalents were lowered to 151 yen/kg in 2011 and recovered gradually to 197 yen/kg in 2012. The impact of this tragedy was so powerful that it could counteract the effect of rice traceability, which can also reflect the huge shock due to the disaster to Japan’s domestic rice farming.
Comparing the simulated results of those three scenarios, we can conclude that if Japan adjusted the SBS general rice quota to 110 thousand tons or 120 thousand tons, the consumer prices of SBS general rice would be 386 and 361 yen/kg, respectively, higher than the average wholesale integrated rice price of 262 yen/kg. It proves that the competitive ability of SBS general rice has been weakened because of MAFF’s intended intervention. However, in the context of 180 thousand tons of the SBS quota, the consumer price of SBS general rice would decrease to 256 yen/kg less than the average wholesale prices of Akitakomachi, Hitomebore, and integrated rice. It suggests that SBS general rice would have more price advantages, even accepting the intervention by MAFF in that case. Therefore, in the future TPP trade negotiations, SBS exporting countries such as the US could attempt to persuade Japan to modify its SBS quota to 180 thousand tons or higher than this volume so the foreign rice can compete with Japan’s domestically produced rice or have an equal opportunity to be chosen by Japanese consumers in the supermarket. Meanwhile, the addition of the SBS quota volume can benefit Japanese consumers because of the increase in consumer welfare. On the other hand, as for Japan, when it is required to expand its SBS rice import quota to be equal to or bigger than 180 thousand tons, which is a critical boundary that should be paid special attention, Japan has to endeavor to reduce its rice production cost and improve its producing efficiency, or even depend on government supports such as subsidies to lower Japan’s domestic rice prices, so that it can compete with imported rice under the circumstances of increasing the rice import quota.


