1. Introduction
Rapid urban growth has resulted in an increase in the amount of impervious surfaces in cities, which are associated with changes in the local climate [
1,
2]. In particular, intense human activity/traffic and tall buildings that obstruct air movement contribute to the urban heat island (UHI) effect [
3], and the intensity of the UHI effect is likely to increase in the context of global warming [
1,
4]. Previous studies have shown that the UHI effect significantly increases cooling energy in the summer [
5,
6,
7], worsens air pollution [
8,
9,
10], raises risks for early mortality [
11], and deteriorates the living conditions of urban dwellers [
12,
13,
14]. Accordingly, policy makers have attempted to mitigate the UHI effect with social, spatial, and environmental interventions. As one promising solution, the greening of urban spaces is held to be an effective method for reducing land surface temperatures (LSTs) and the UHI effect [
1,
15,
16,
17].
A considerable amount of literature has reported that the LST of parks and green spaces are lower than the LSTs of impervious land cover areas [
18]. The range of reduced LST in green spaces is between approximately 1~3 K [
18,
19], occasionally exceeding 5 K [
1]. Research has also found that reduced LSTs in green spaces are influenced by the size of those spaces [
20], NDVI [
21,
22,
23,
24], wind speed [
1], albedo [
25], the proportion of available tree-shaded areas [
26], configuration of the land cover [
27,
28], and the vegetation types planted in them [
29]. These studies have primarily examined LST variations inside and outside green spaces caused by their physical characteristics or meteorological conditions [
29].
Elsewhere in the literature, related studies have examined the spatial extent of Park Cooling Impact (PCI) effects. Conceptually, PCI intensity indicates the difference between the temperatures inside and outside of parks. Previous studies defined PCI intensity either with air [
1,
3,
30] or land surface temperature [
18,
31]. While PCI depends on the characteristics of a green space, it also varies by distance from the green space to the built environment [
31]. Oliveira et al. [
1], for example, investigated the PCI effect of green areas on the surrounding air temperature and found that PCI effects were detected up to 260 m away from the center of a green space. Feyisa et al. [
31], examining the cooling effects of 21 parks on LSTs in Ethiopia, found a maximum estimated effect distance of 240 m, with this distance varying according to the shape and size of the parks.
This study aims to investigate the cooling effect of green spaces on mitigating the UHI effect and reducing LSTs. Relative to earlier work on cooling effect of green spaces, our study is original in several respects. First, we explored both cooling intensity and distance as these are associated with the physical characteristics of green spaces. Previous literature has partially addressed this question, but few studies have attempted to detect both the intensity and distance of the cooling effect, primarily because of the relatively small sample sizes available [
3,
18] and the difficulty of controlling physical conditions outside of those green spaces studied. By selecting green spaces within relatively small geographical areas, this study extended the spatial scope of the cooling effect to areas adjacent to green spaces. Unlike previous studies, which aggregated land surface temperatures in a green space, the unit of analysis in this study is the land surface temperature of each grid. The total number of sample grids used in the analysis was 42,574. An increased number of observations in this study improved its analytical reliability. Second, we defined the context of green space based on land-use type and examined the associations between land-use type and the PCI effect. Several studies investigated LSTs on different land-use and land cover types [
19,
32]. However, to our knowledge, no study has explicitly hypothesized that land-use type surrounding green spaces would affect their cooling effect. This study defined the land-use type surrounding green spaces as one of the physical characteristics of green spaces and examined the variations of PCI according to that feature. Third, from a methodological standpoint, this study suggests a new approach to estimating the cooling effects of green spaces. The details of this approach are described in
Section 2.4.
2. Materials and Methods
2.1. Study Area and Selected Green Spaces
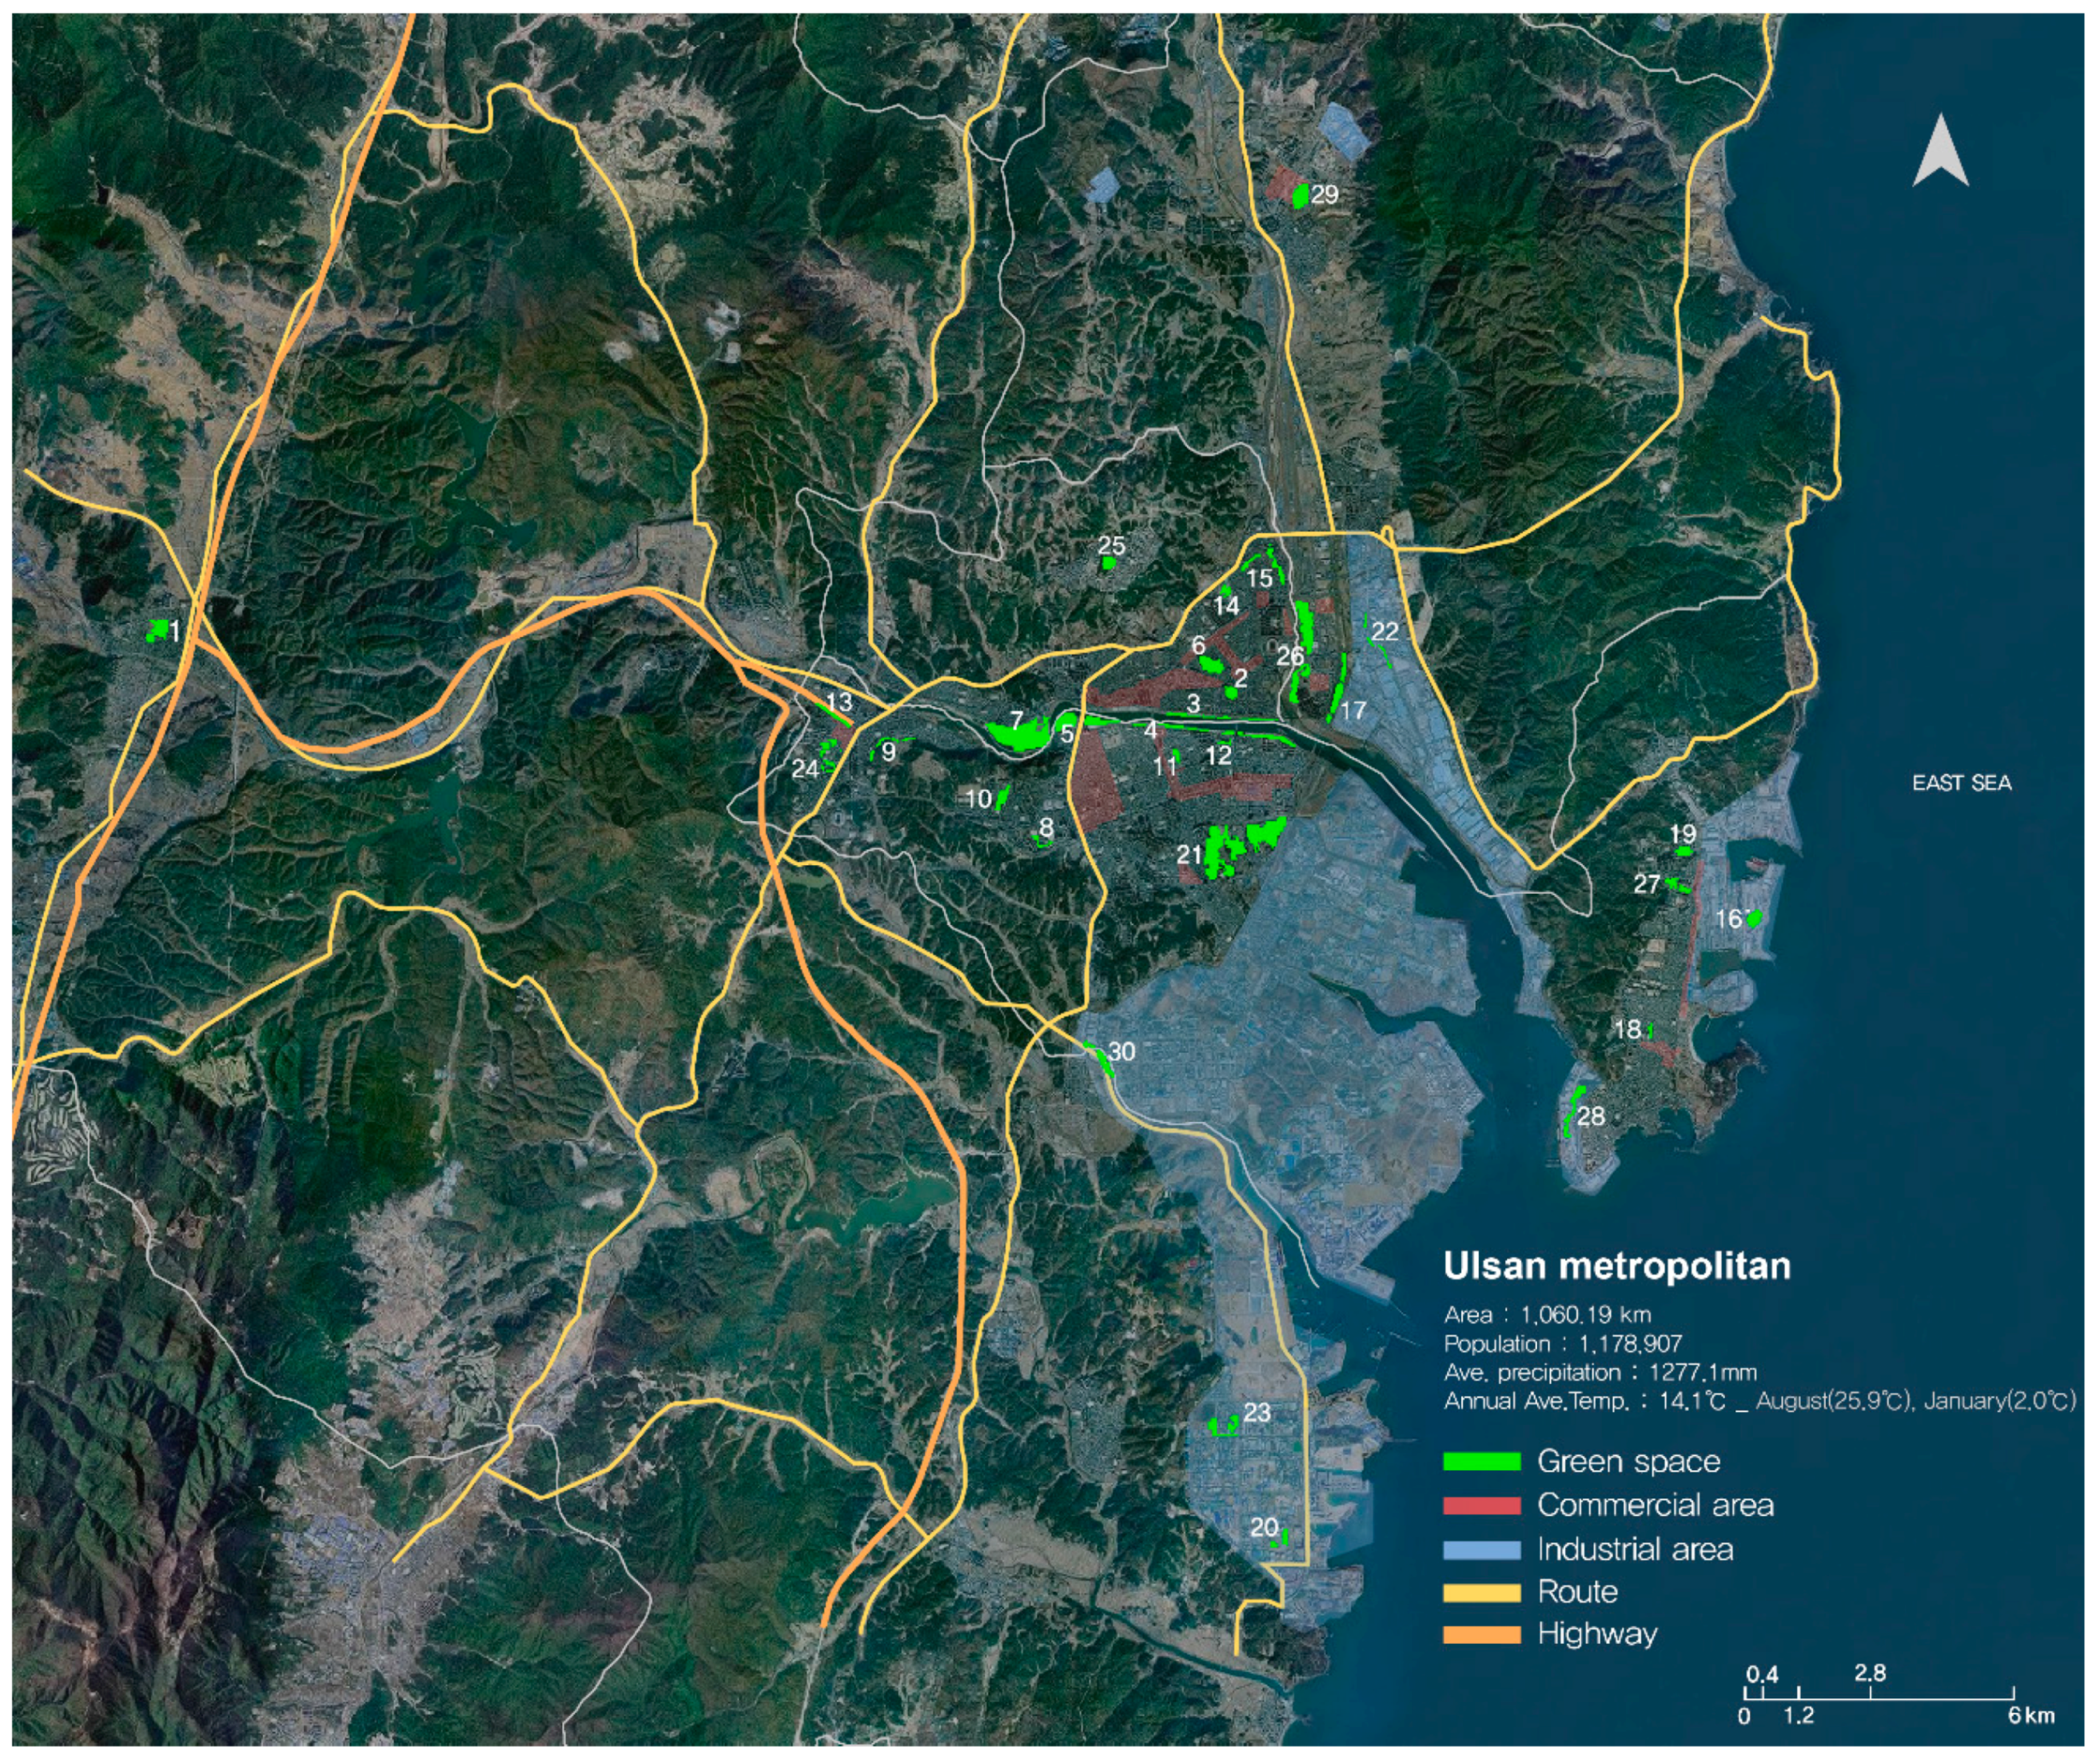
With an area of 1060.19 km2 and a population of 1.17 million, the study area, Ulsan, is the seventh largest metropolitan area in Korea and the largest industrial city in Korea. Ulsan is surrounded by mountains, and the Taehwa River runs through the city eastward into the sea. The climate in Ulsan is warm with marked seasonal changes. The annual average precipitation is 1277 mm and the annual average temperature is 14.1, with August averaging 25.9 and January 2.0. On 8 August 2013, a temperature of 38.8 was recorded, which is the highest recorded temperature in Ulsan. Land use is heterogeneous, with mixed residential-commercial-industrial areas.
To examine the cooling effects of green spaces on LSTs, green spaces in Ulsan were chosen by applying three criteria: Normalized Difference Vegetation Index (NDVI), location, and size. The NDVI is a simple graphical indicator that assesses the greenness of a target area in remote sensing data. The NDVI was calculated using the corrected reflectance of LANDSAT bands 3 and 4.
First, to address meteorological and seasonal variations of greenness in the remote sensing data, we tested the appropriate NDVI cut-off points for defining a green space, including 0.20, 0.25, 0.30, and 0.40. After crosschecking the vegetated ground surface data from Google Earth, we choose 0.25 as the most reliable value for defining an urban green space. At 0.20 NDVI, we could not distinguish the green roofs of buildings from green surfaces. If the lower cut-off value is higher than an NDVI of 0.25, the grids located at the boundaries of a green surface tend to be excluded. We then selected the green spaces located within urbanized areas as the main subject of our study. Finally, we excluded small sized areas for two reasons: first, the boundaries of small sized (less than 100 m × 100 m) green spaces were not well detected from the satellite images; second, we assumed that the cooling effect of spaces of that size on adjacent lands would be very limited. Cao et al. [
18] showed that parks greater than 20,000 m
2 had PCI larger than 1.5 K in all seasons. Thirty green spaces were selected, and their locations are shown in
Figure 1. The median size of the selected green spaces was 1.12 km
2.
The dominant vegetation types of the sampled green spaces were a mix of coniferous and broad-leaved trees, shrubs, and brush. Fifteen of the green spaces were parks that included various types of vegetation, such as grassland, trees, and shrubs. Two of the selected green spaces were farmlands with grassland and shrubs and three were “buffer” spaces with trees separating industrial and residential areas. At least one of the selected green spaces was identified as a roadside tree area. No bodies of water of substantial size were found within the selected green spaces, although ten of the spaces were located near bodies of water. Four of them have a belt-shape and run along streamlines and six have irregular or compact shapes.
2.2. Land Surface Temperature (LST)
LST was retrieved from Landsat 8 data acquired on 17 August 2013. The retrieved Landsat data was taken at 11 a.m. The cloud cover over the city was 2%. Every 16 days, Landsat 8 collects near-infrared, short wave infrared, and thermal infrared data. The resulting products consist of quantized and calibrated scaled Digital Numbers (DN) representing multispectral image data acquired by both an Operational Land Imager (OLI) and a Thermal Infrared Sensor (TIRS). These products deliver data in a 16-bit unsigned integer format. We converted the TIRS band data from spectral radiance to brightness temperature using the thermal constants provided in the metadata file of the results. Further details and the algorithm itself can be found on the U.S. Geological Survey website [
33].
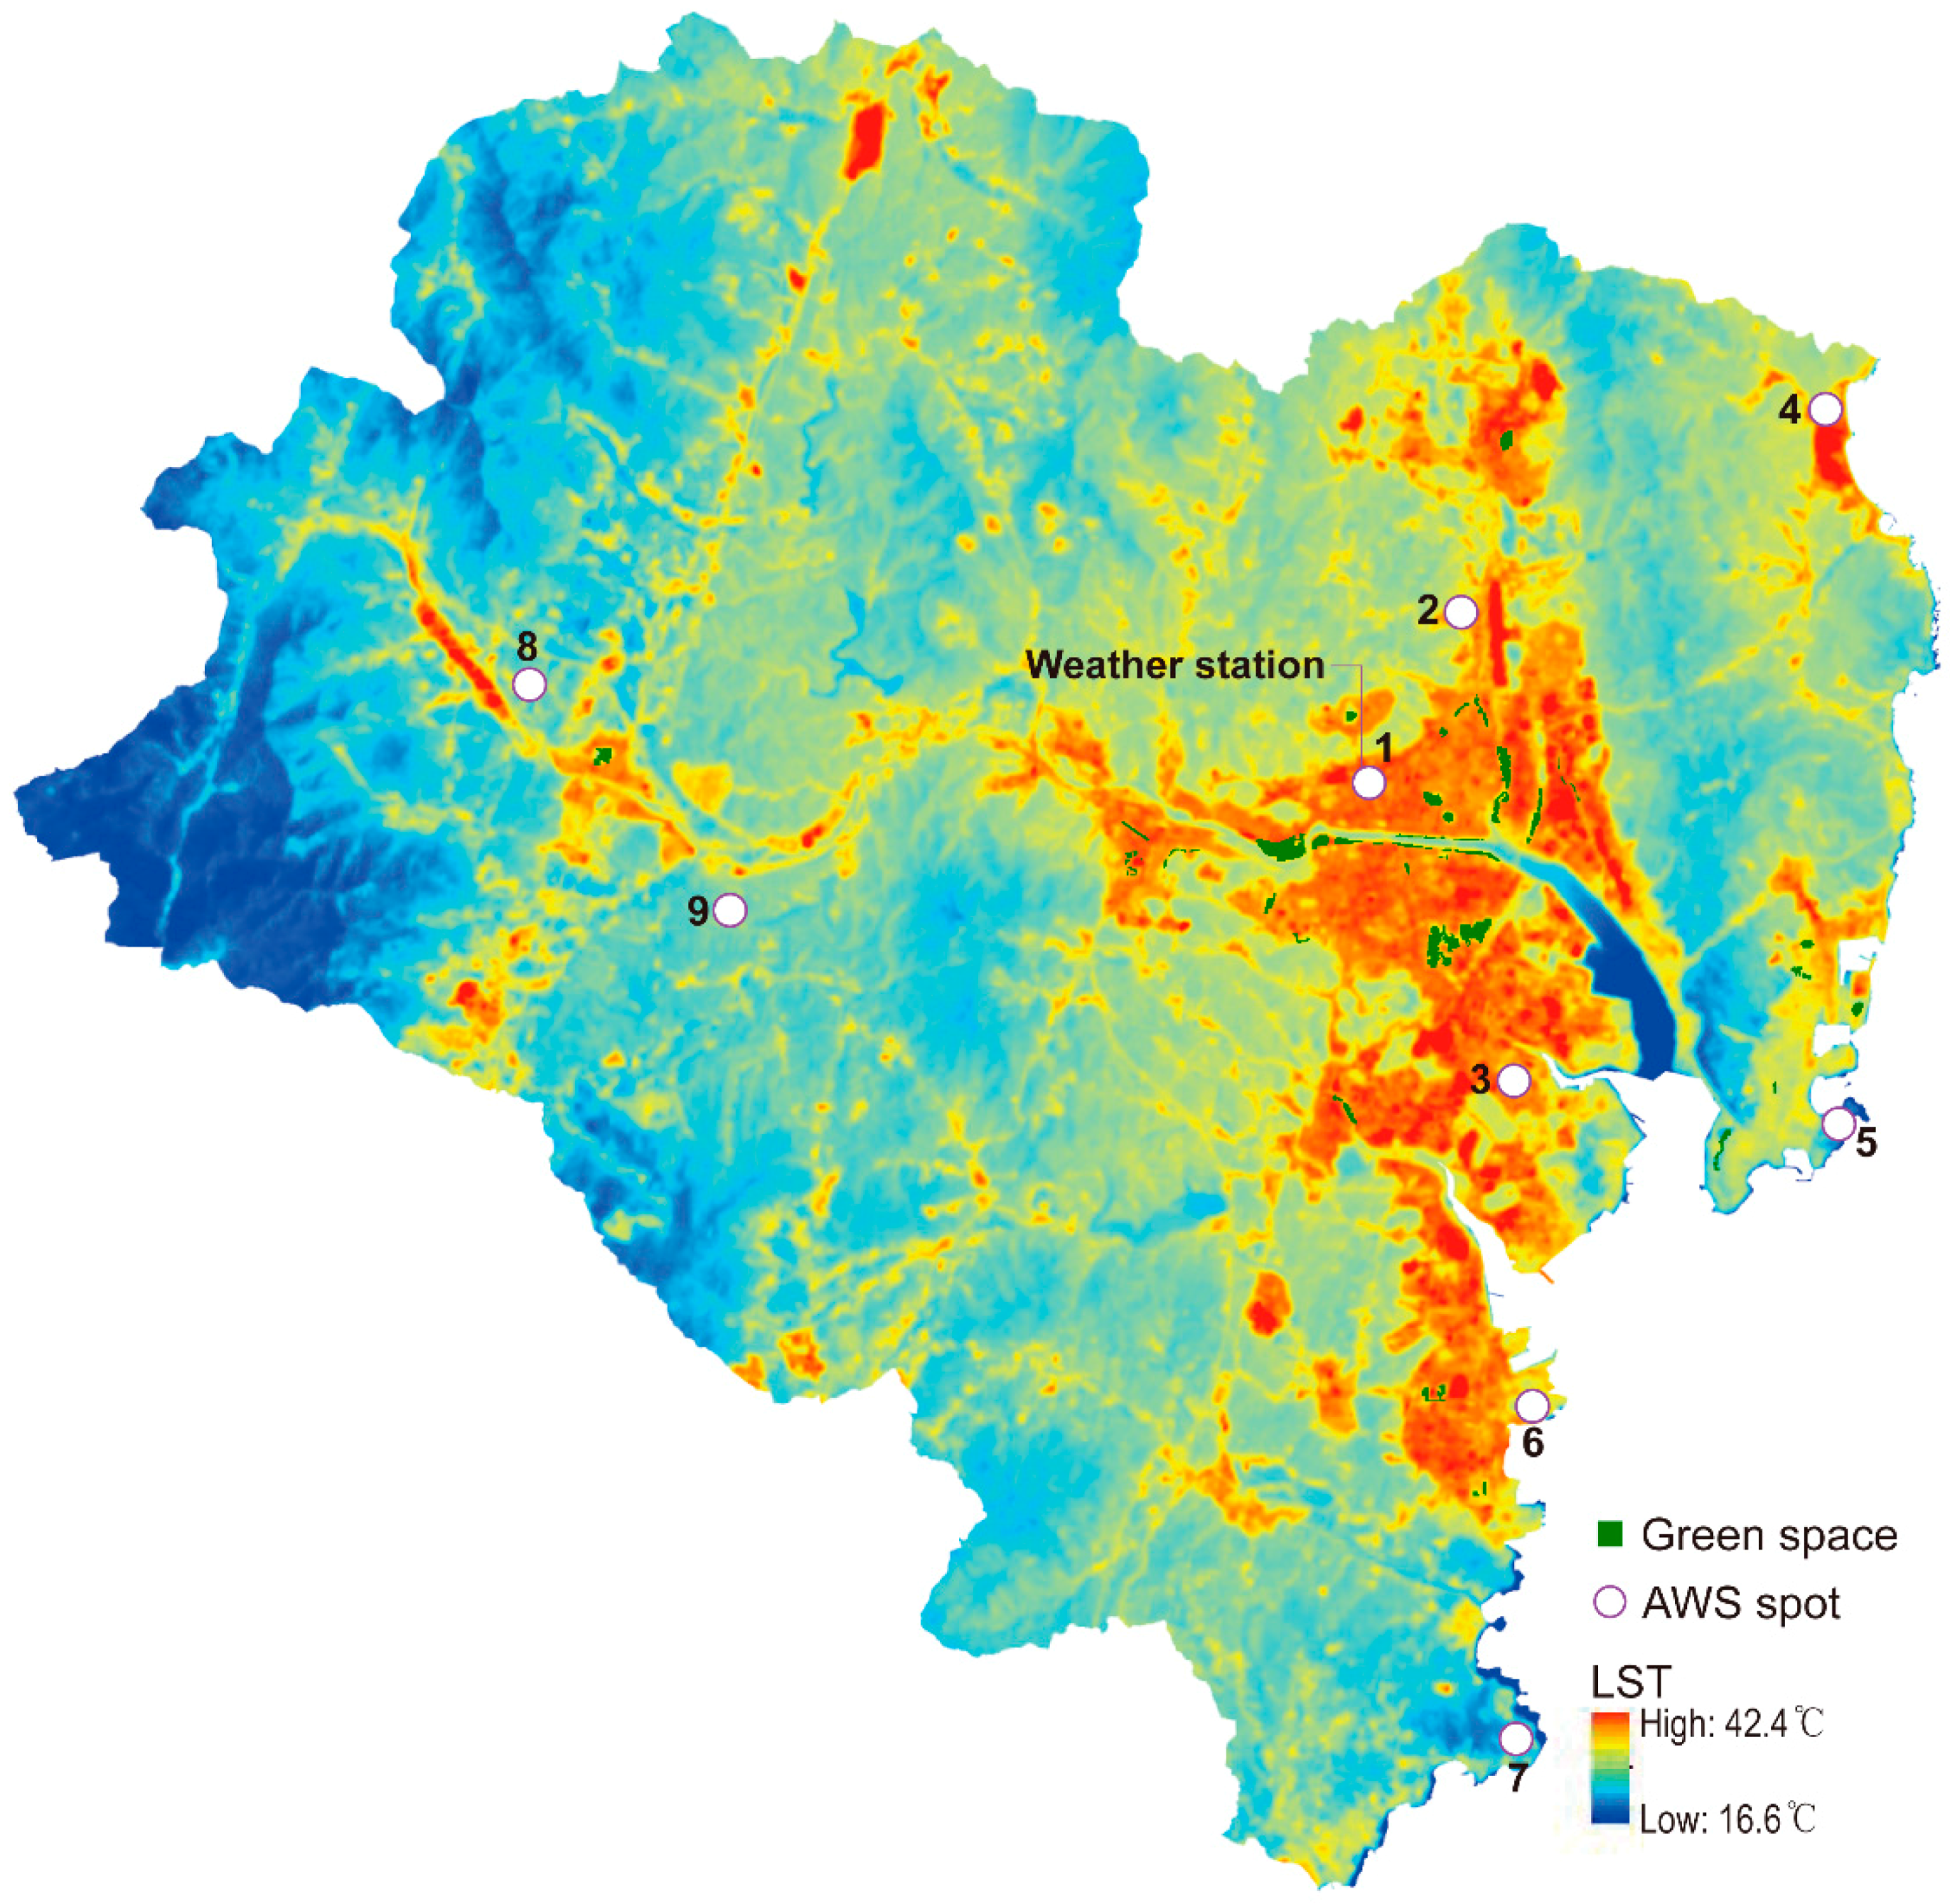
Figure 2 shows the LST of the study area and the locations of nine Automatic Weather Systems (AWSs). These are part of the meteorological observational network in the Korea Meteorological Administration. The design and operation of AWSs conform to the standards of the World Meteorological Organization (WMO). These AWSs are located in diverse geographical locations. Two AWSs are located in each of the following area types: urban area (stations 1, 2), industrial area (stations 3, 6), and mountain area (stations 8, 9). Three AWSs are located at the seaside (stations 4, 5, 7). At 11 a.m. on the study date, the air temperature ranged from 24.7
to 34.4
. The highest air temperature was found at the urban area, and the AWSs at the seaside showed the lowest air temperature. The prevailing wind direction on the study date ranged from 191
to 253
. The average wind speed at seaside (5.7 m/s) was higher than the speed at urban area (3.8 m/s). The highest wind speed was recorded at the station 6 (7.8 m/s). The selected 30 green spaces were all located in either urban or industrial areas. On average, the level of humidity on the study date was 57.4% and the air speed was 4.5 m/s.
2.3. Physical Characteristics of Green Spaces
To examine variations in the cooling effects of green spaces, we defined four types of physical characteristics: NDVI, Land Shape Intensity (LSI), land-use type, and size. Since we were specifically interested in exploring associations between the physical characteristics of green spaces and cooling effects, we tried to remove other possible causes of the cooling effects in the sample selection phase. In measuring the cooling effect of green spaces, we excluded blue spaces, such as lakes and rivers, adjacent to green spaces since blue spaces may reduce LSTs [
34]. The characteristics and context of the selected green spaces are listed in
Table 1.
2.3.1. NDVI
We estimated the mean NDVI of the cells within each green space and classified the green spaces into three groups: low NDVI (ranging from 0.25 to 0.30), medium NDVI (ranging from 0.30 to 0.35), and high NDVI (above 0.35). The number of “low” green spaces was seven, “medium” was eight, and “high” was fifteen.
2.3.2. Shape of Green Space
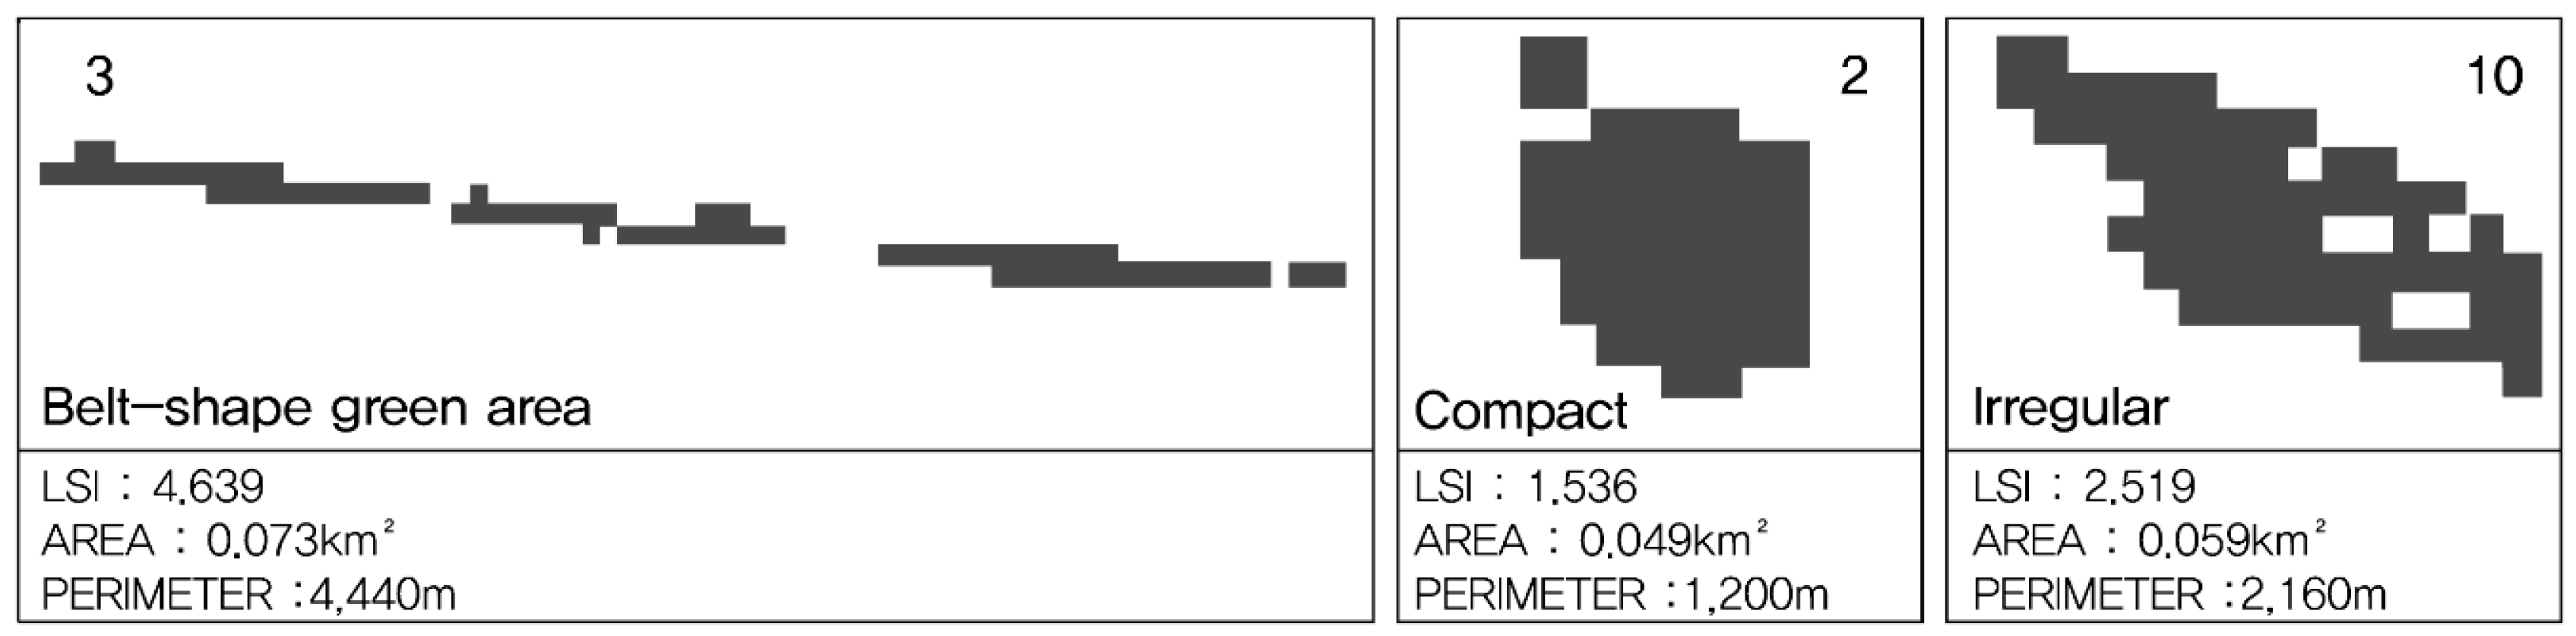
The shape of a green space is one factor influencing its cooling effect [
18]. In our study, the shapes of the green spaces were measured using Land Shape Intensity (LSI) [
35,
36], which is calculated by
where
Pu is the total perimeter around a green space and
A is the area of the green space. Intuitively,
LSI indicates the relative length of perimeter to area, with a small LSI value representing a concentrated or compact shape (
Figure 3). The shapes of our green spaces were classified into three groups: compact (less than 2.0 of LSI), irregular (between 2.0 and 3.5), and belt-shaped (higher than 3.5). The numbers of compact, irregular, and belt-shaped green spaces were 9, 15, and 6, respectively.
2.3.3. Land-Use Type
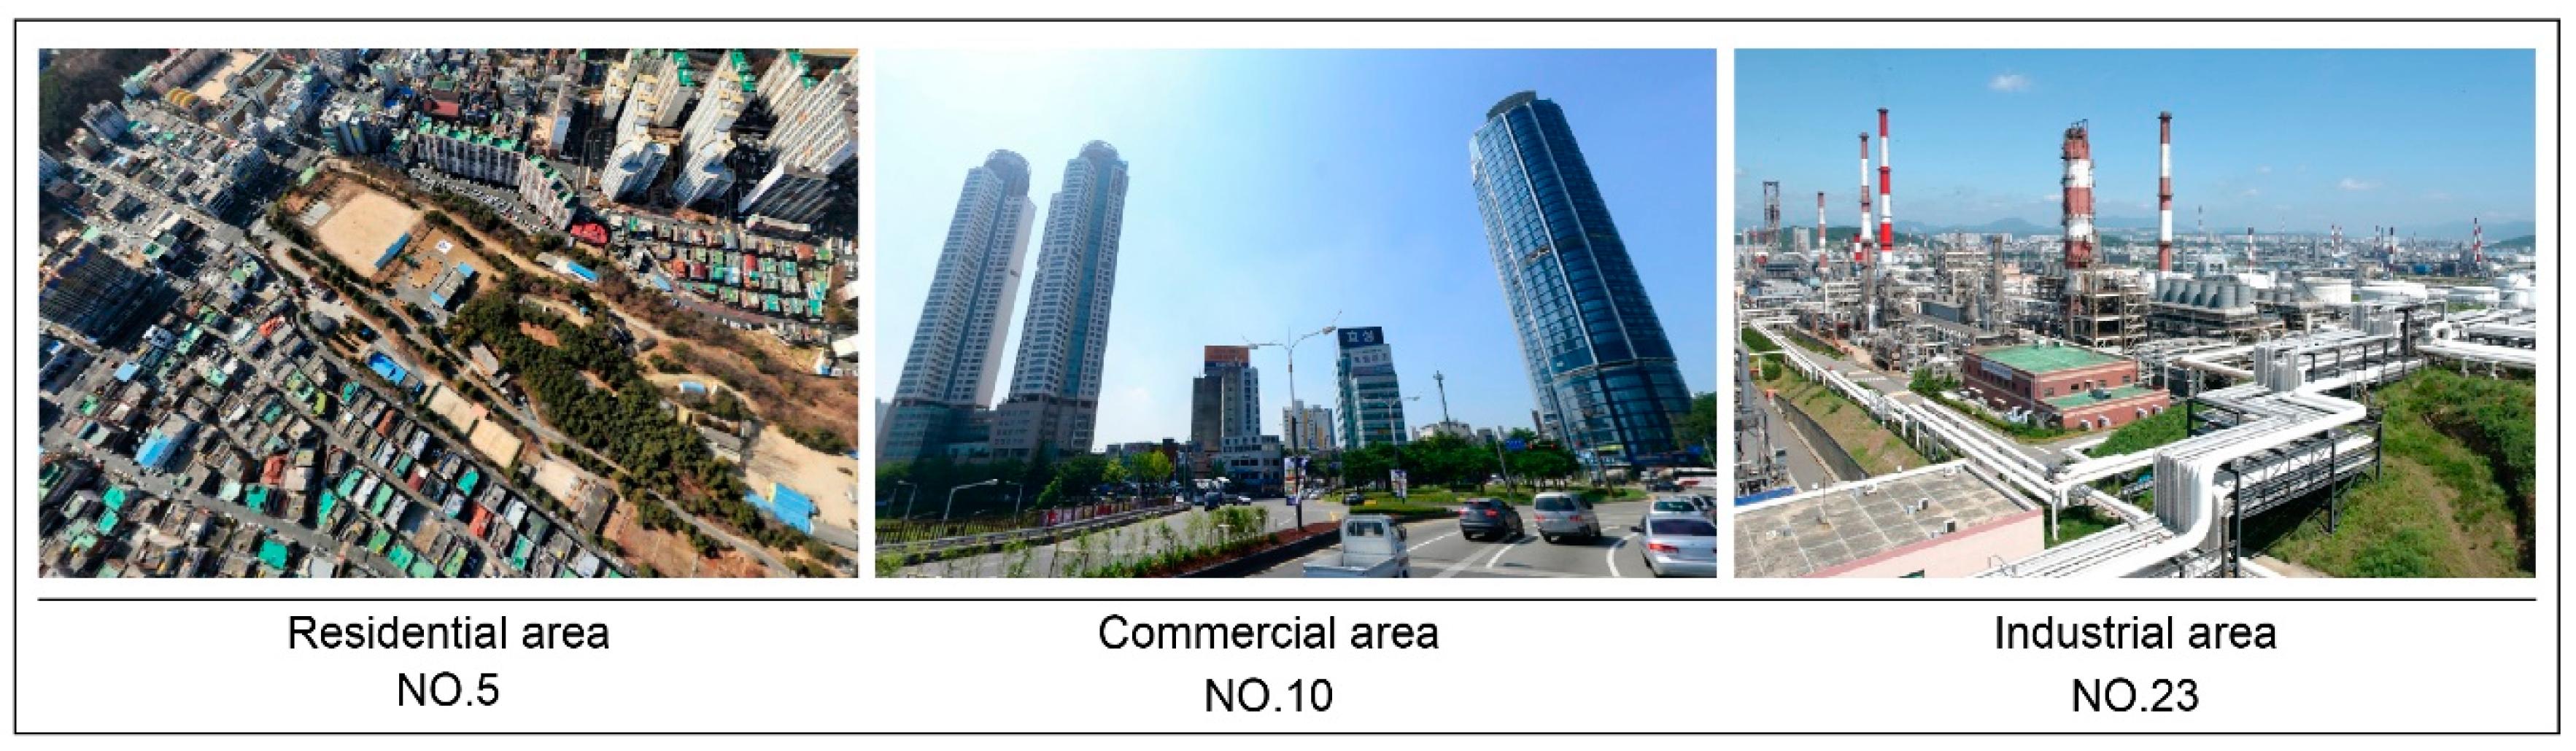
The Environmental Geographic Information System (EGIS) of Korea classifies the land cover of urbanized areas according to the following six categories: residential, industrial, commercial, cultural, transportation, and public. Since cultural and public land-use usually represents a single parcel or facility, we defined whether our green spaces were located in residential, industrial, or commercial areas. In residential areas, the predominant types of buildings are mixed low and high-rise buildings and low-density retail business areas. Commercial areas are characterized by denser mid- and high-rise building development, while heavy industrial facilities and warehouses are notable types of buildings in industrial areas. We assumed that the density and height of buildings might influence the intensity and distance of green zone cooling effects. Jusuf et al. [
19] showed that, during the daytime, industrial areas had a very high LST due to a large open concrete surface and the concrete roofs of buildings. Meanwhile, in commercial areas the shading from the high-rise buildings reduced LSTs.
Figure 4 represents typical landscapes of residential, commercial and industrial areas in the study site. The numbers of green spaces located in residential, industrial, and commercial areas were 16, 8, and 6, respectively.
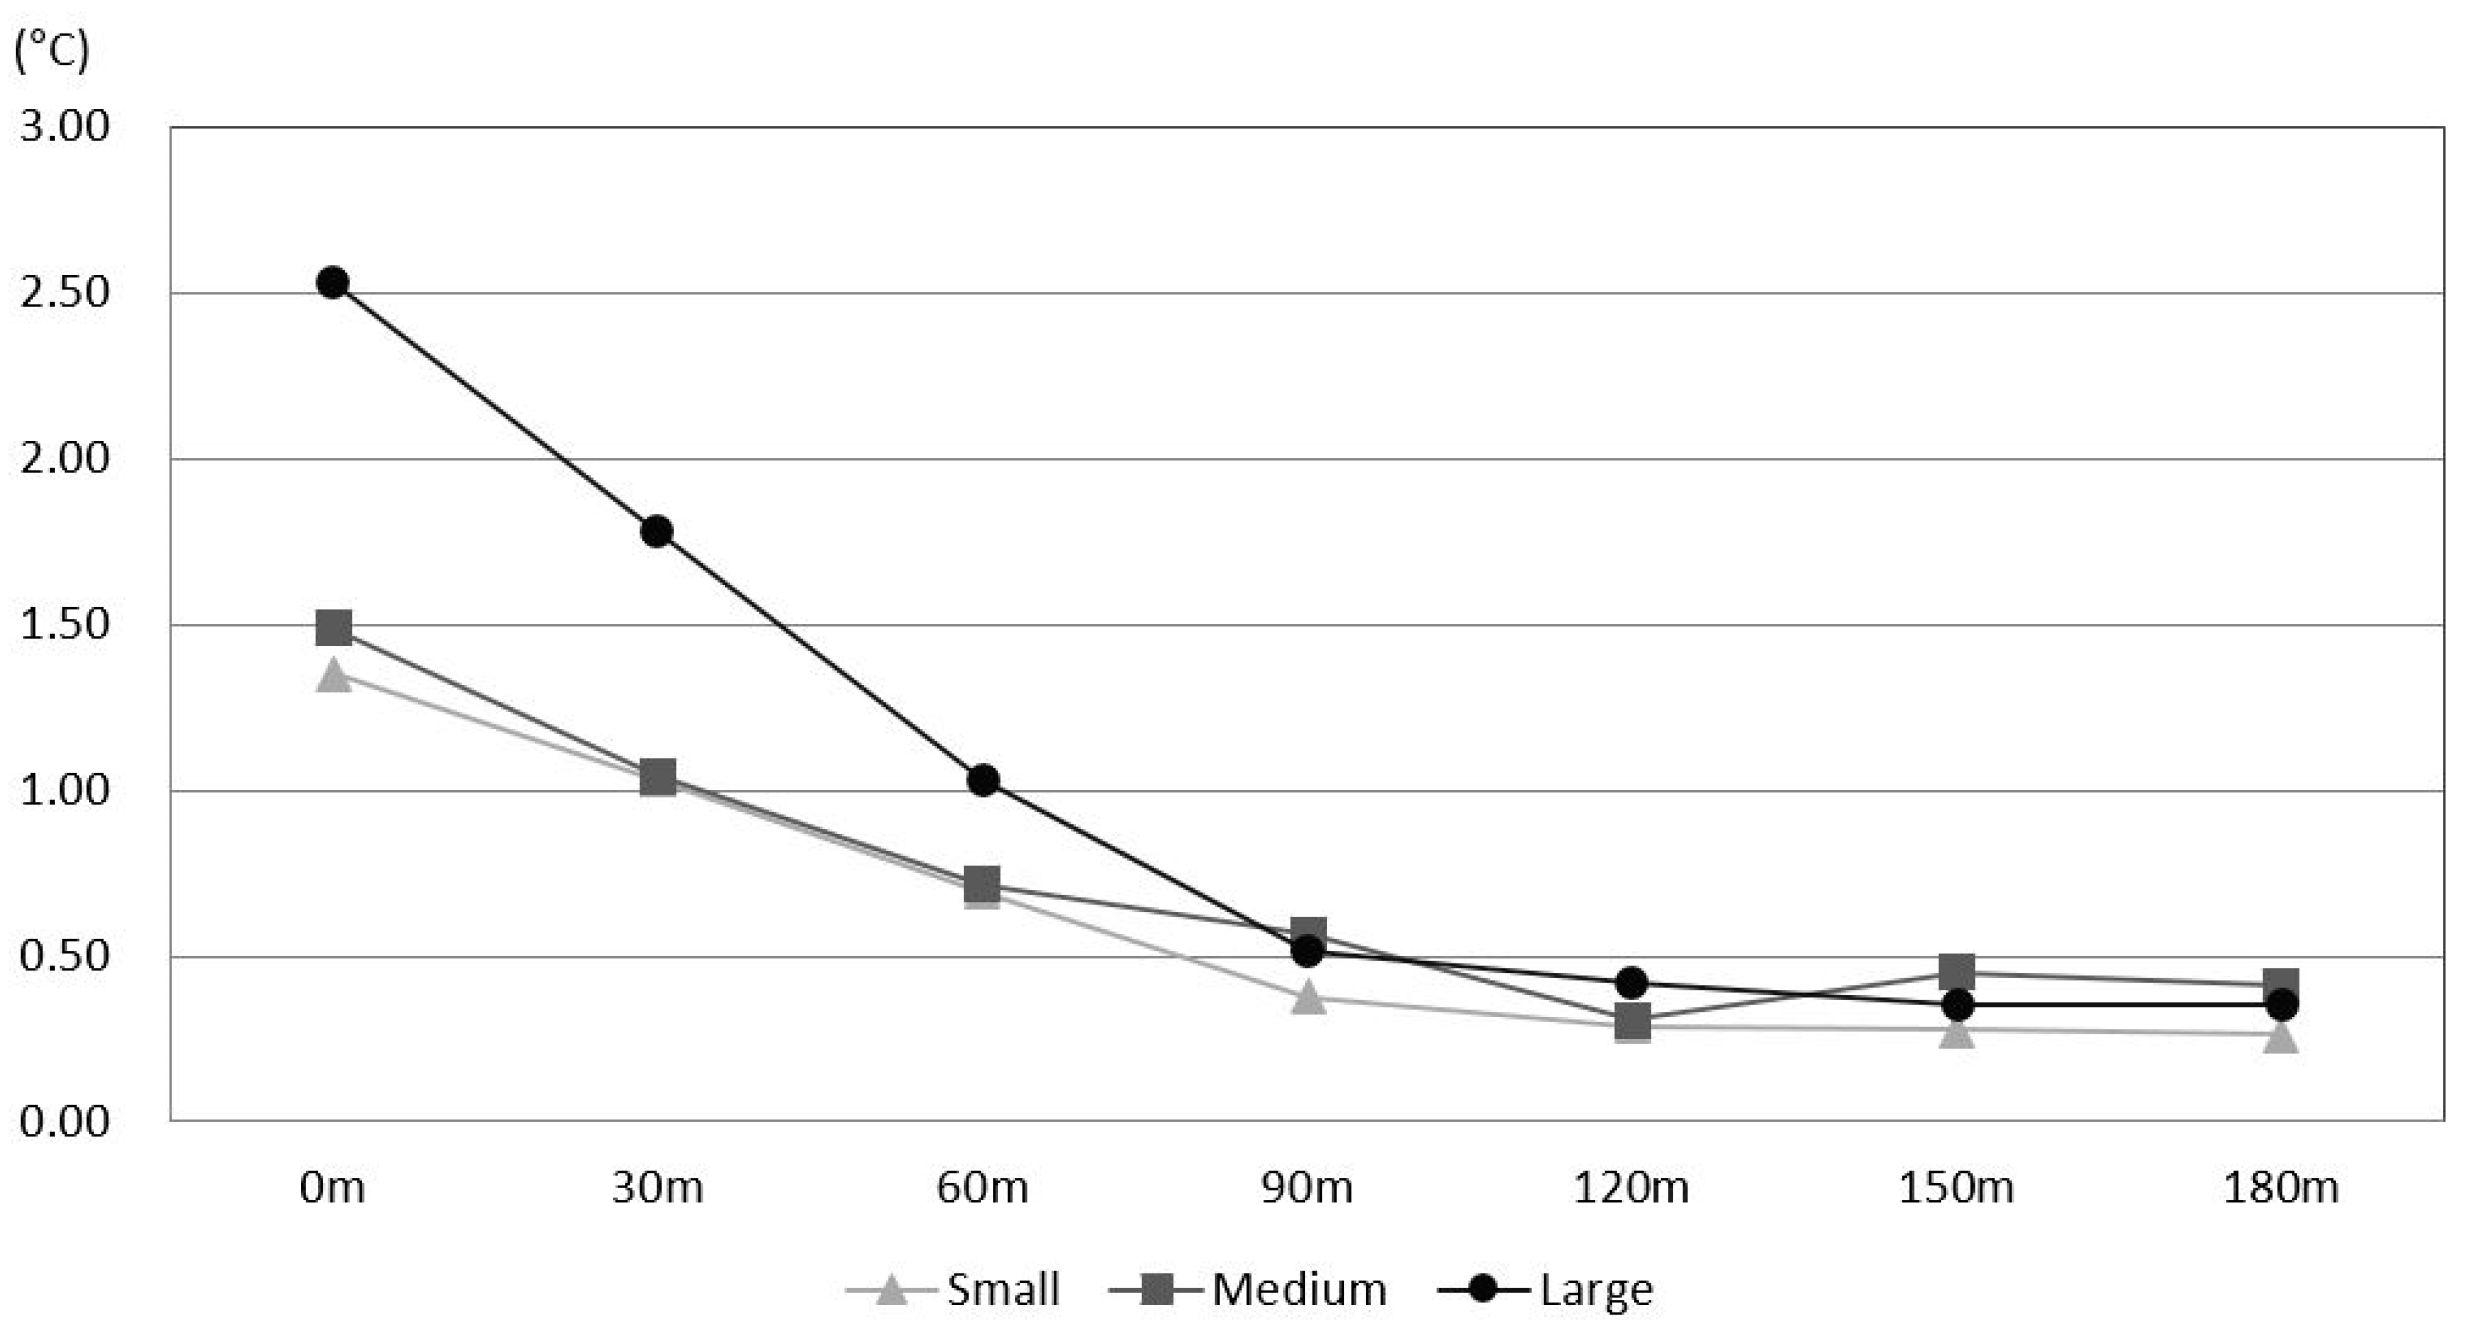
2.3.4. Size
The size of a green space is one of its fundamental physical characteristics. Our green spaces were classified into one of the following three sizes: small (less than 90,000 m
2), medium (between 90,000 m
2 and 300,000 m
2), and large (larger than 300,000 m
2). Green spaces smaller than 10,000 m
2 were excluded from our analysis because we assumed that the cooling effect of these spaces on the surrounding areas would prove trivial [
18]. The numbers of small, medium, and large green spaces we examined were 16, 10, and 4, respectively.
2.4. Definition of Cooling Effect
Cao et al. [
18] defined the PCI as the difference between the LST inside a green space and the LST within a 500 m buffer zone outside that green space. This approach, however, presents a couple of methodological problems relevant to exploring the spatial extent of PCI within multiple buffer zones. First, if we define the PCI as the difference between the LST inside a green space and the LST within a specific buffer zone outside that green space, the PCI of a point tends to increase the further that point is located from a green space, which is counter-intuitive. Second, the cooling effect of a green space cannot be defined without prior knowledge of the cooling distance of the green space. Considering these issues, this study suggests a new approach to estimate the cooling effects of green space using the following method:
is the mean LST at the 10th ring buffer zone (270–300 m) of p green space
is the mean LST within green space p
is the LST of point i at rth ring buffer zone of green space p
is the cooling intensity of rth ring buffer zone; m is a number of points located within the rth buffer zone of green space p (in units of
is a proxy measure representing LST where the cooling effect is absent (in units of
n is the number of green spaces.
We assumed that the estimated (a thermal contract between and ) would decrease as any grid i was located further from the green space.
2.5. Statistical Analysis
We conducted a two-sample
t-test to examine how the spatial extent and intensity of the PCI varied by physical characteristics. Feyisa et al. [
31] used multiple linear regression models to examine the associations between cooling distance and the physical characteristics of parks. In contrast, we identified the distance thresholds of cooling effects through an examination of non-linear PCI patterns using a two-sample
t-test since an ordinary least squares regression model that relies on the assumption of linearity was not an appropriate statistical method for our study.
To identify the spatial extent of the PCI, we repeatedly tested whether the LST in one buffer zone was significantly lower or higher than the LST in the next buffer zone. We hypothesized that (1) the points within a green space would have a maximum PCI that gradually decreased by distance, and (2) once the PCI exceeded a maximum distance cooling effect, the mean LST in one buffer zone would not be significantly different from the mean LST in the next buffer zone.
To examine variations in PCI, we classified four physical characteristics (NDVI, LSI, land-use, and size) into three groups each. Then we statistically tested whether the LST of one group was significantly different from the LST of the two other groups at each buffer zone.
4. Discussion
This study classified four physical characteristics of green spaces and examined their PCI and the spatial extent of cooling variations among them.
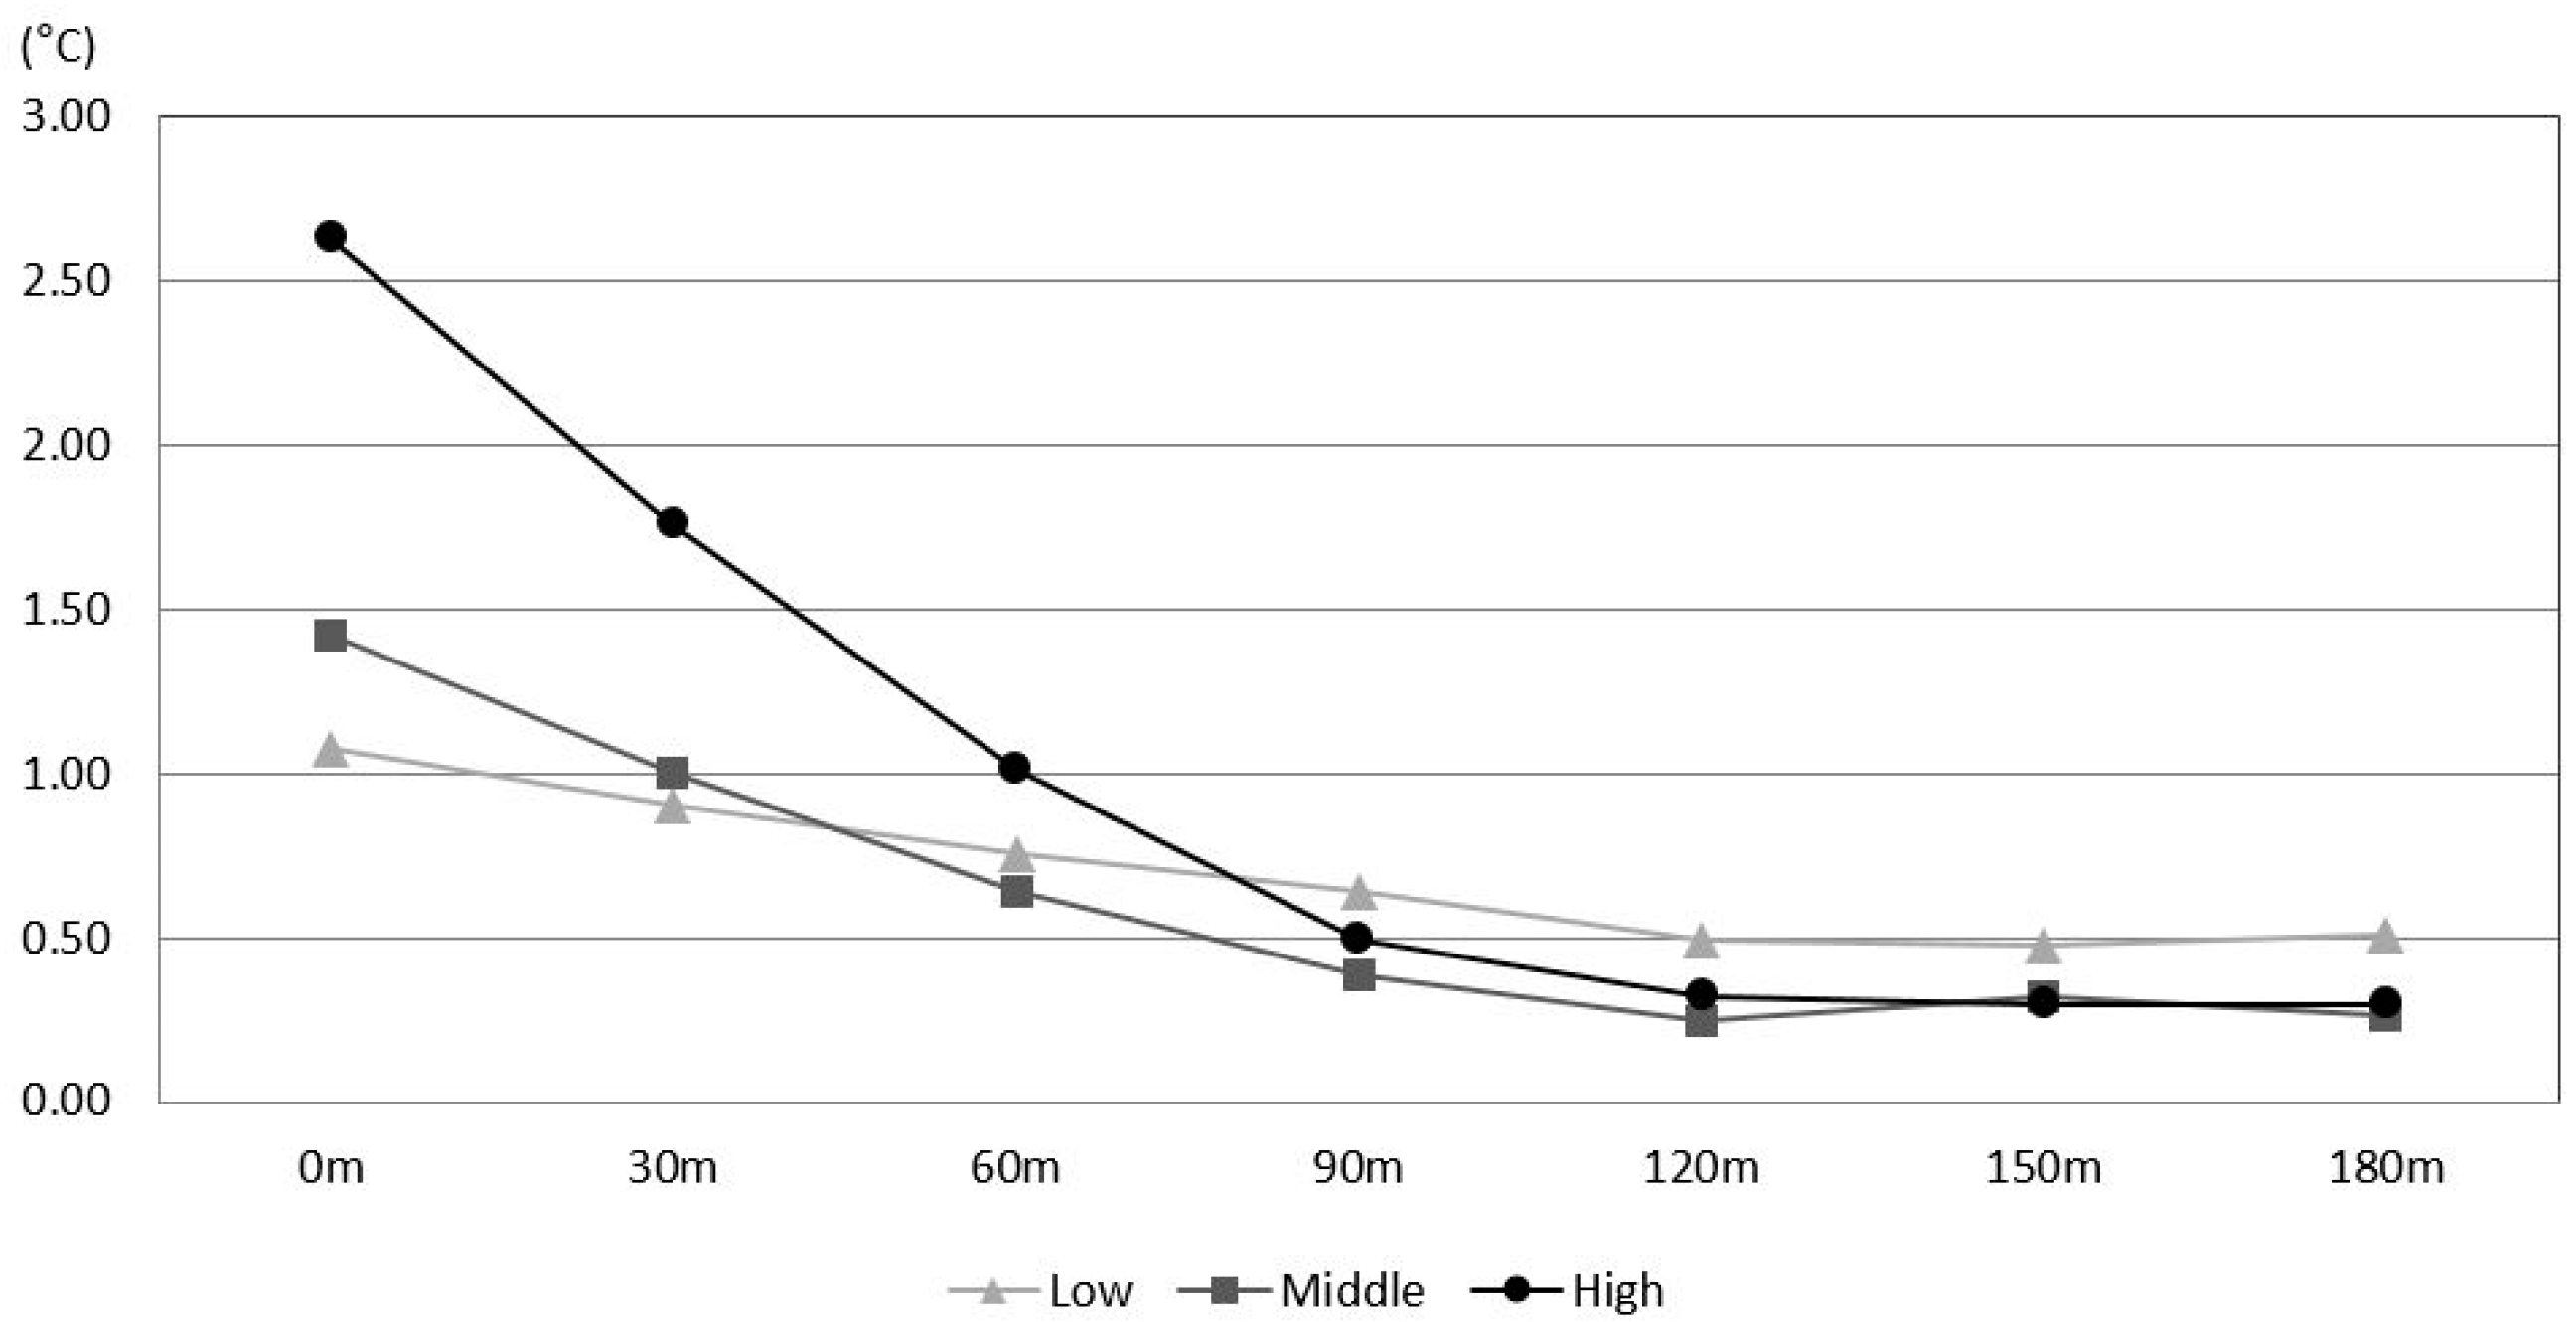
Consistent with previous findings [
3,
18,
24,
31,
35], our results showed that higher NDVI and a larger green space were associated with higher PCI. However, our findings also suggested that this association might not follow a linear pattern. Unlike green spaces with high NDVIs (over 0.35) and large sizes (larger than 300,000 m
2), those with middle range NDVIs (0.30–0.35) and medium sizes (90,000 m
2–300,000 m
2) did not have a statistically higher PCI than those with low NDVIs (0.25–0.30) and sizes in the low range (below 90,000 m
2). A non-linear relationship between size and PCI has been reported in previous studies [
3,
18], and our findings showed a non-linear relationship between NDVI and PCI.
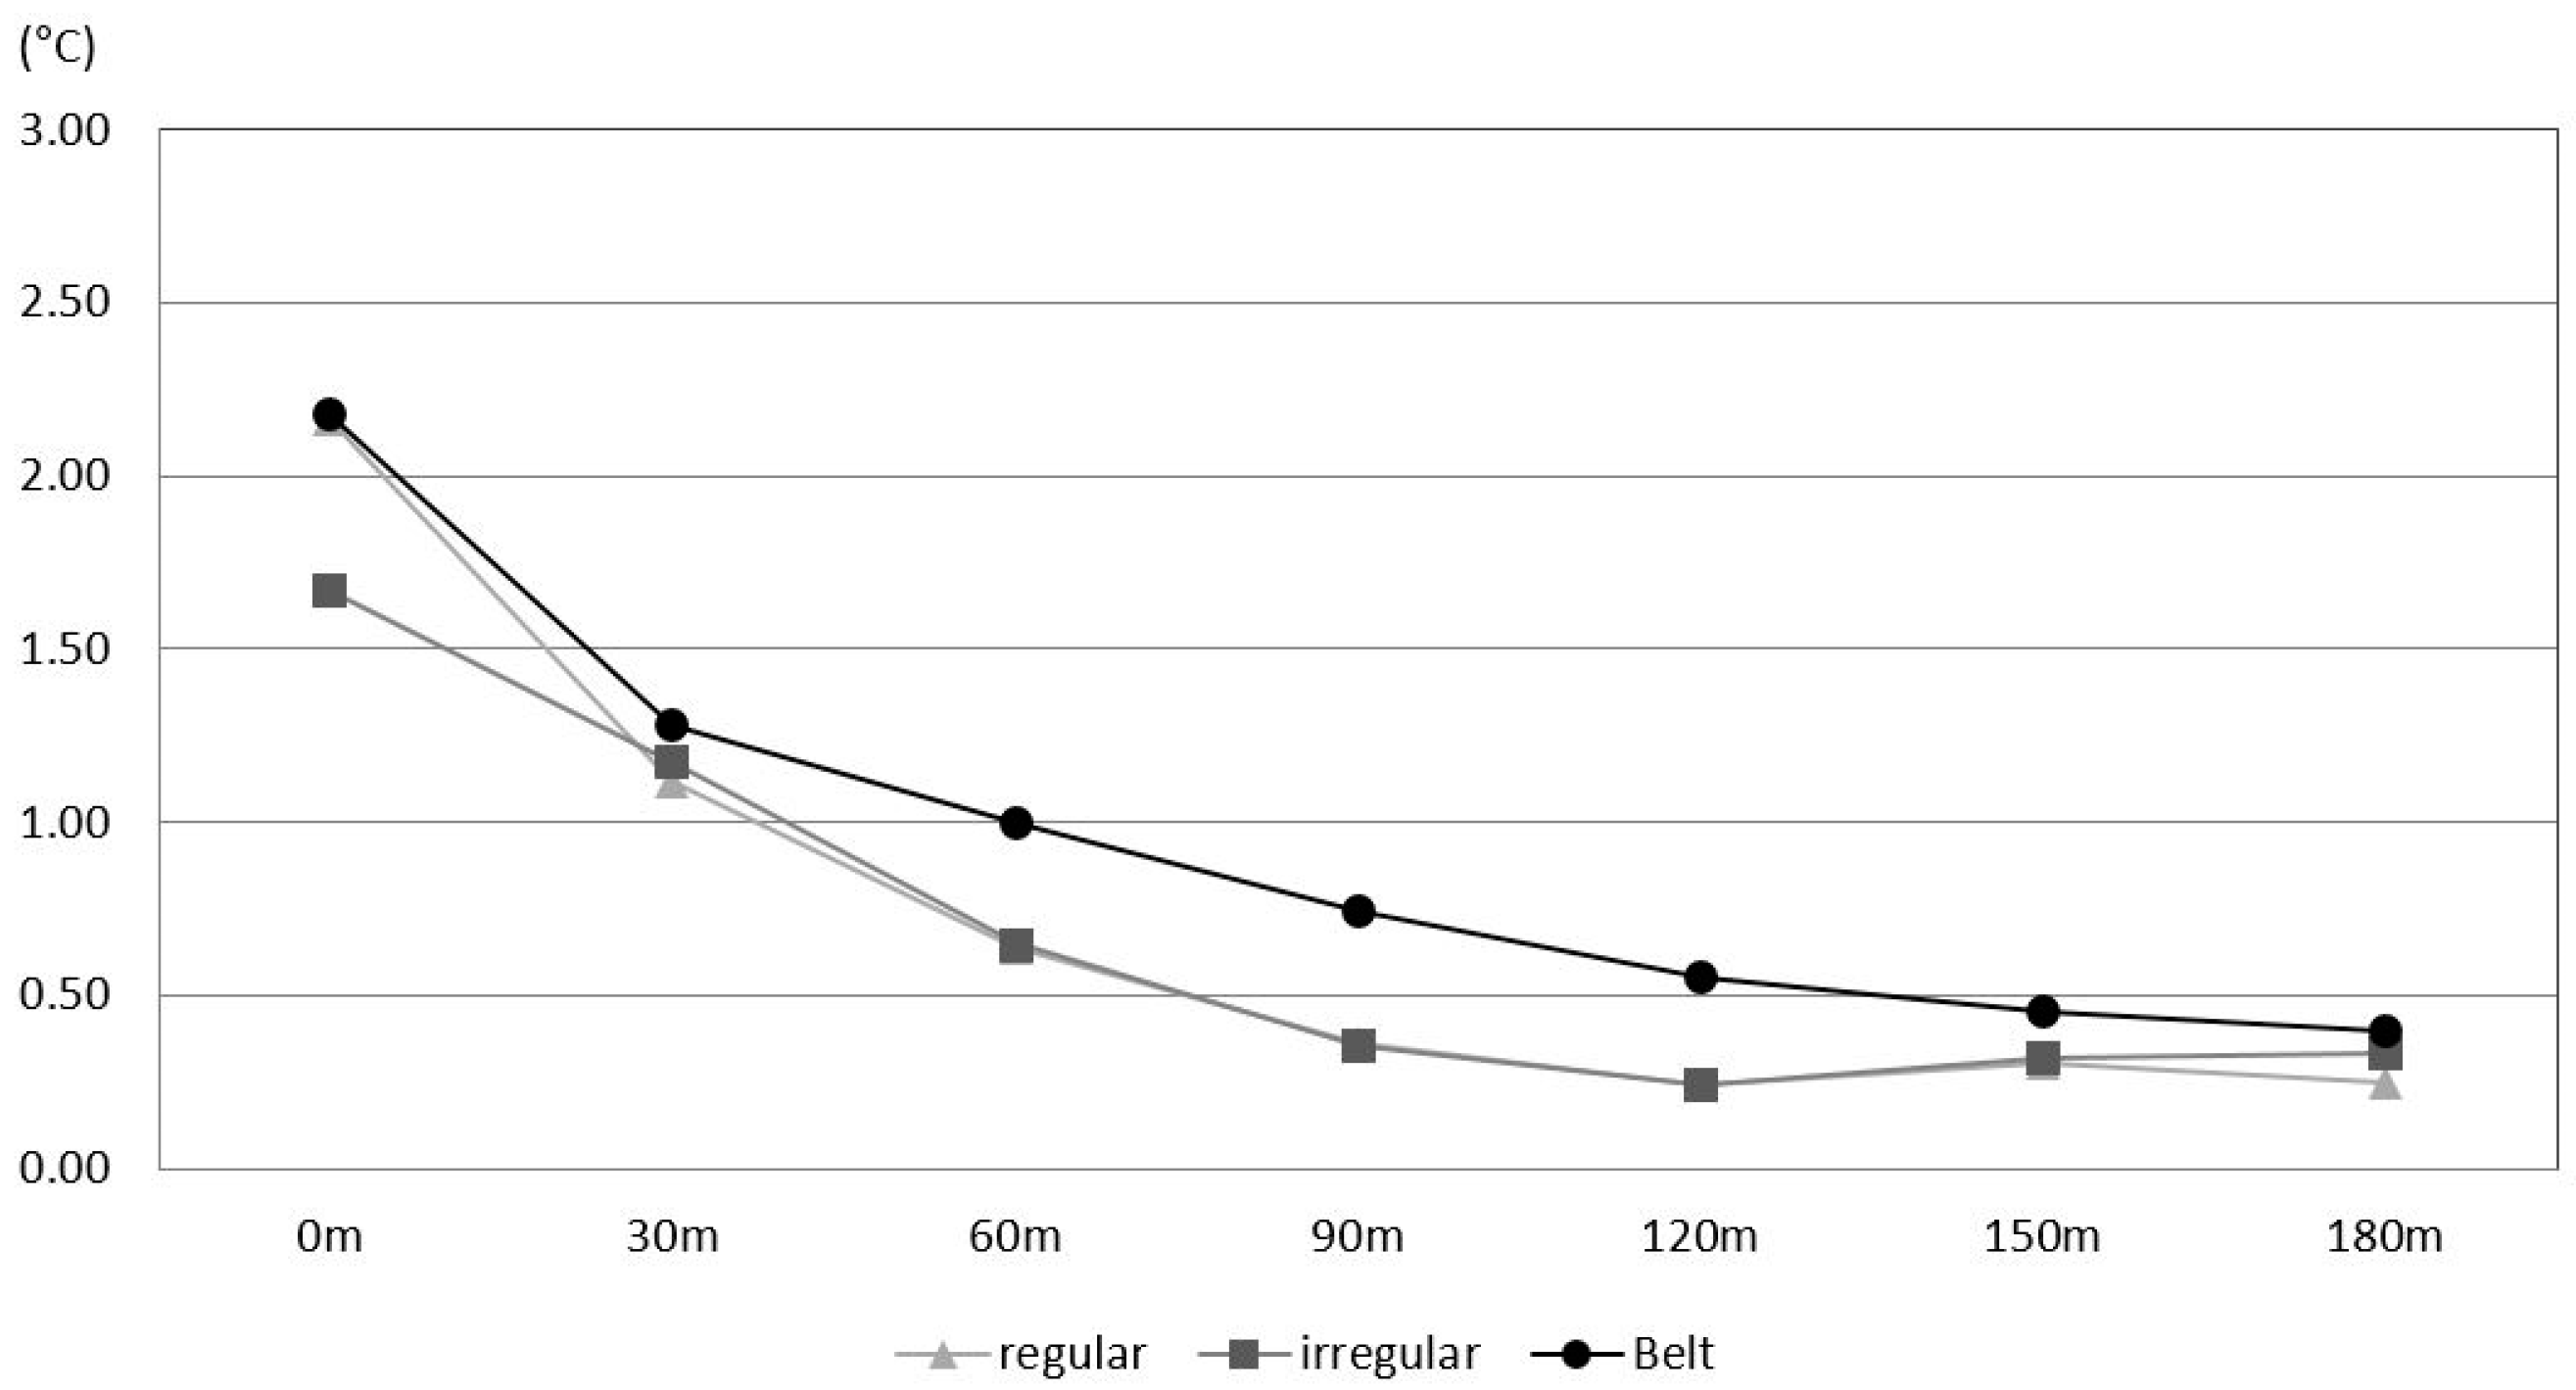
With regard to shape (LSI), belt-shaped green areas were shown to have the longest cooling distance. While LSI did not affect the PCI of green spaces on the ground, the PCI of green spaces with a compact shape did decline more sharply over distance than the PCI of a belt-shaped green space. The maximum cooling distance of a belt-shaped green space was detected at over 200 m. Feyisa et al. [
31] also found that elongated parks tended to have longer cooling distances and explained that a longer point of contact with the surroundings might maximize the distance over which parks influence the thermal environment. In other words, a belt-shaped green space has a larger cooling distance because, with a given size, the perimeters of those spaces are much longer than those of compact green spaces. Cao et al. [
18] and Feyisa et al. [
31] reported that a compact shape had a higher PCI, but we did not detect this pattern.
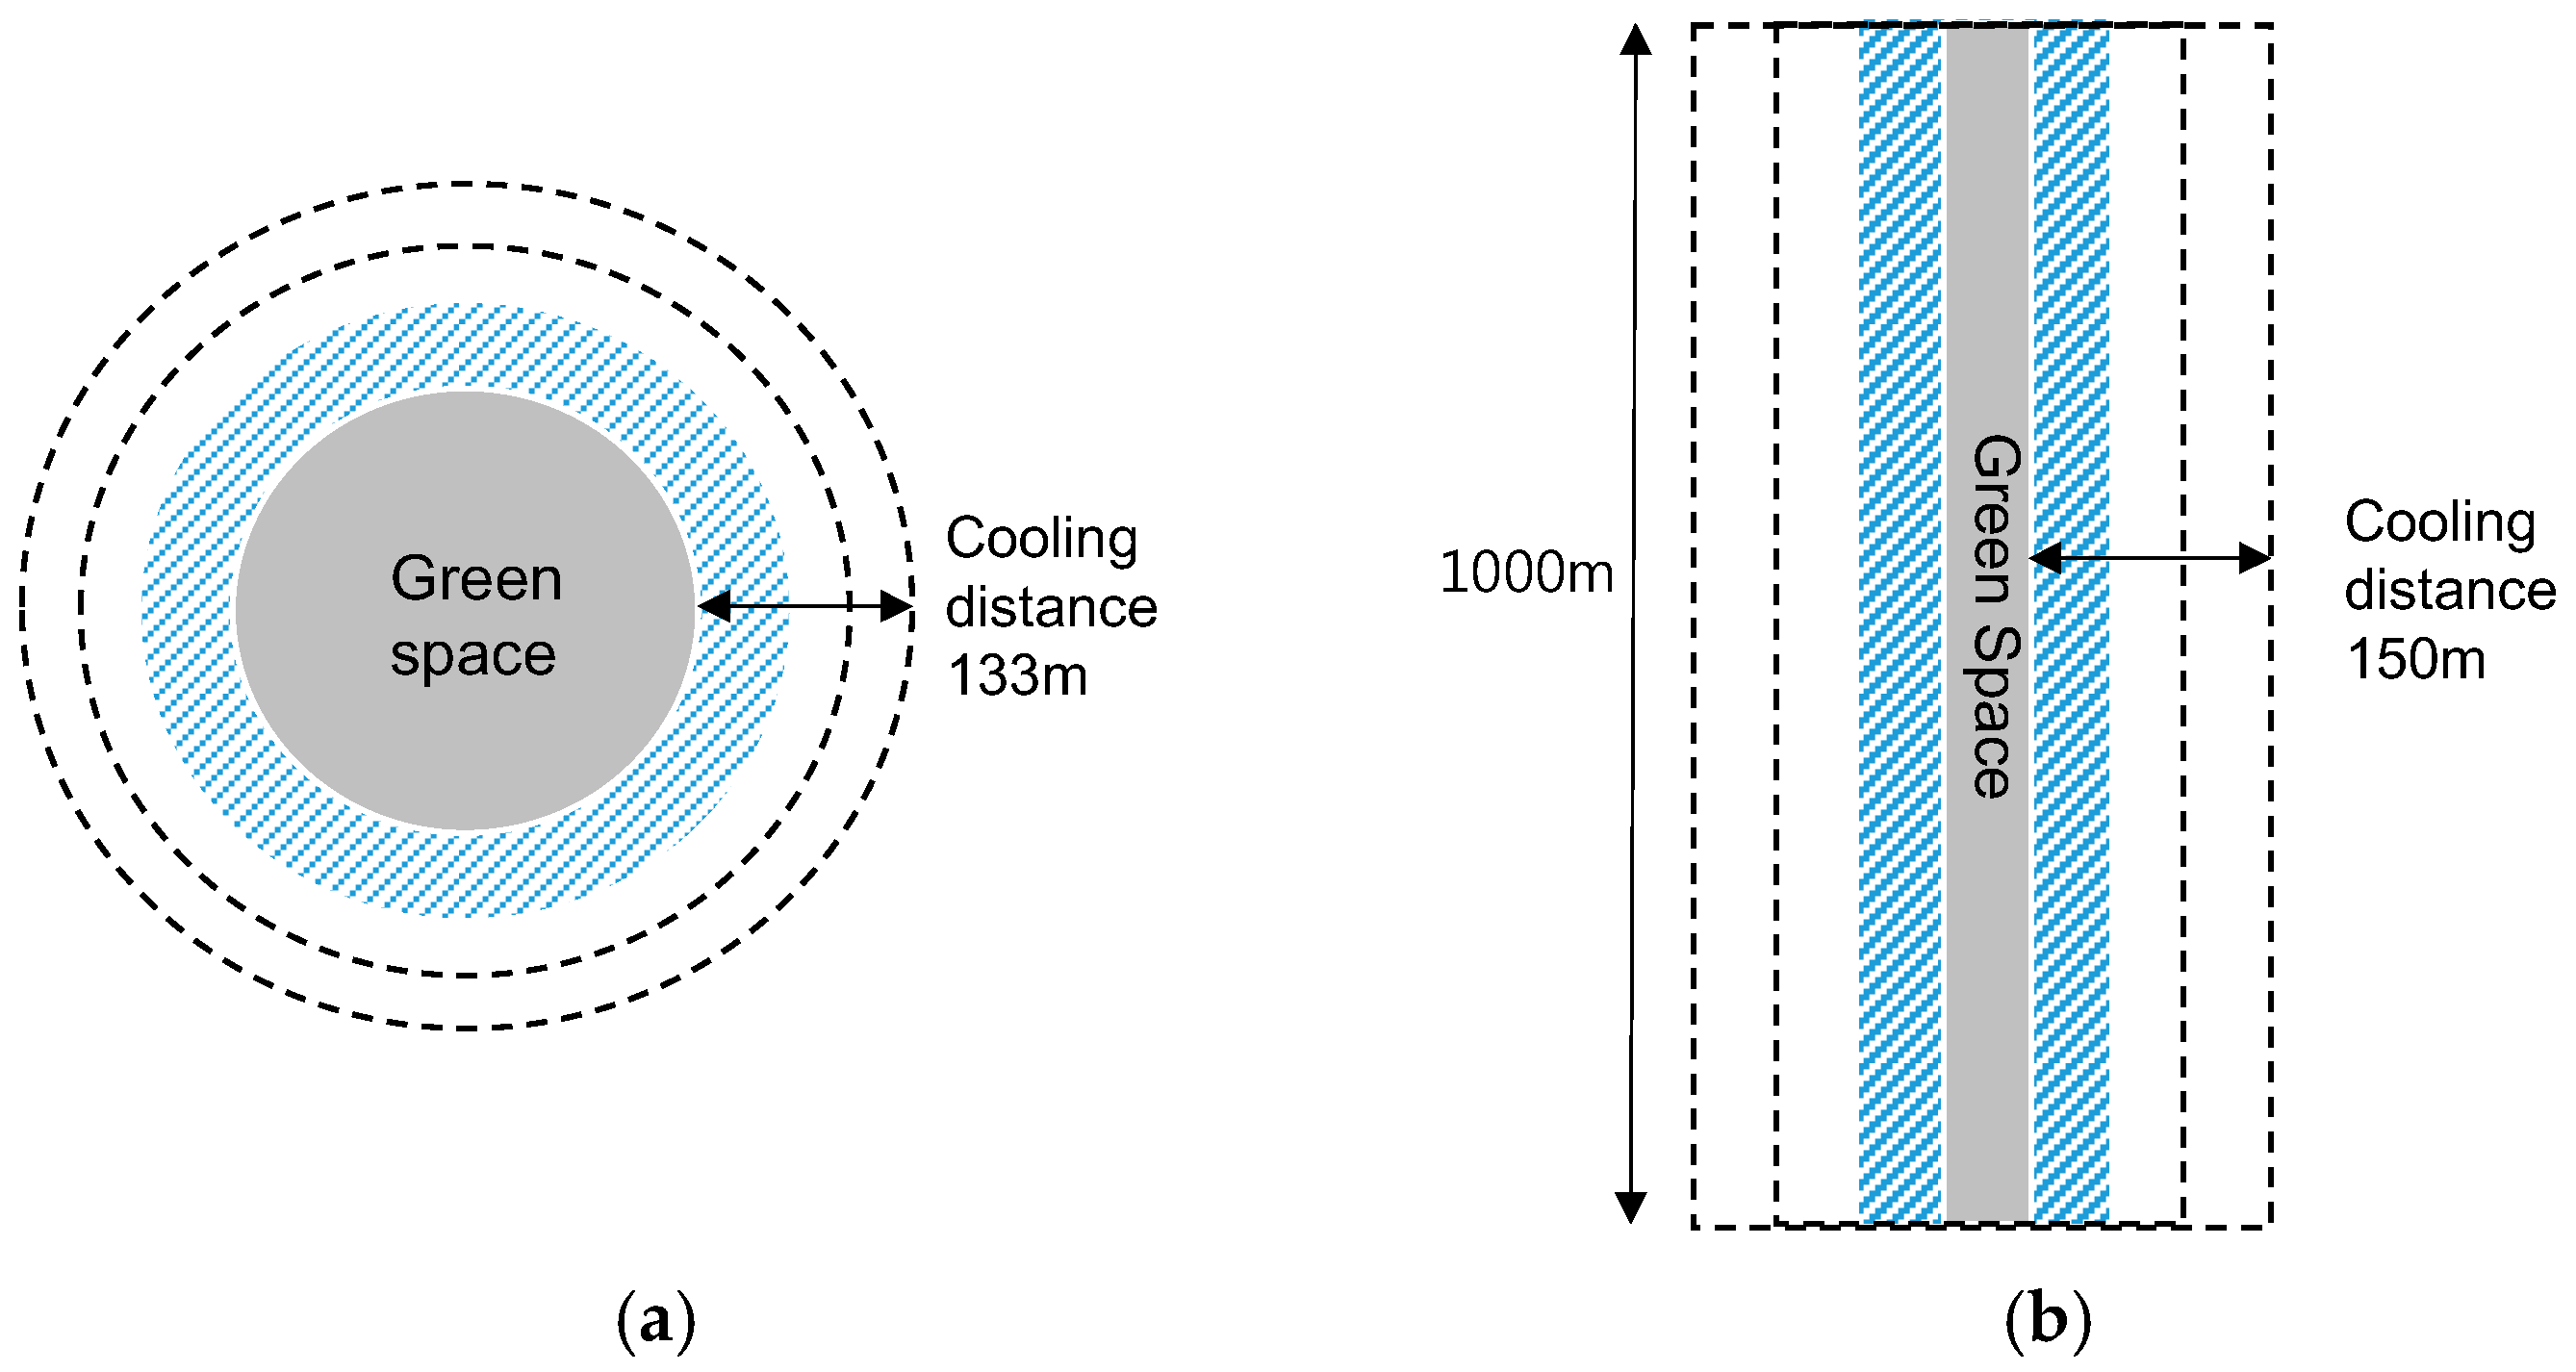
We also found that one notable dissimilarity between the cooling patterns of compact and belt-shape green spaces was the dimension of “cooling direction”. As the cooling distance increases, the cooled down area of belt-shaped green spaces showed one-dimensional growth, while the area of a compact space displayed two-dimensional growth (
Figure 10).
The blue-hatched areas represent 50 m of cooling distance from the compact green space (
Figure 10a) and the belt-shaped green space (
Figure 10b); the sizes of these cooled down areas were identical (10,000 m
2). For cooling down three times the amount of land size (30,000 m
2), the cooling distance of a belt-shaped green space was identified as 150 m, which is three times the distance of the blue-hatched area, while the distance of a compact space was identified as 133 m. The distinction in cooling distances tended to increase when the size of the green space increased. Thus, given that the size of the cooled down area is the same, the cooling distance of a belt-shaped green space is longer than the cooling distance of a compact green space. This result, however, does not imply that a belt-shaped green space is more effective at cooling down urban land because this result could be interpreted to mean that a compact green space could cool down a larger area when the cooling distance is identical.
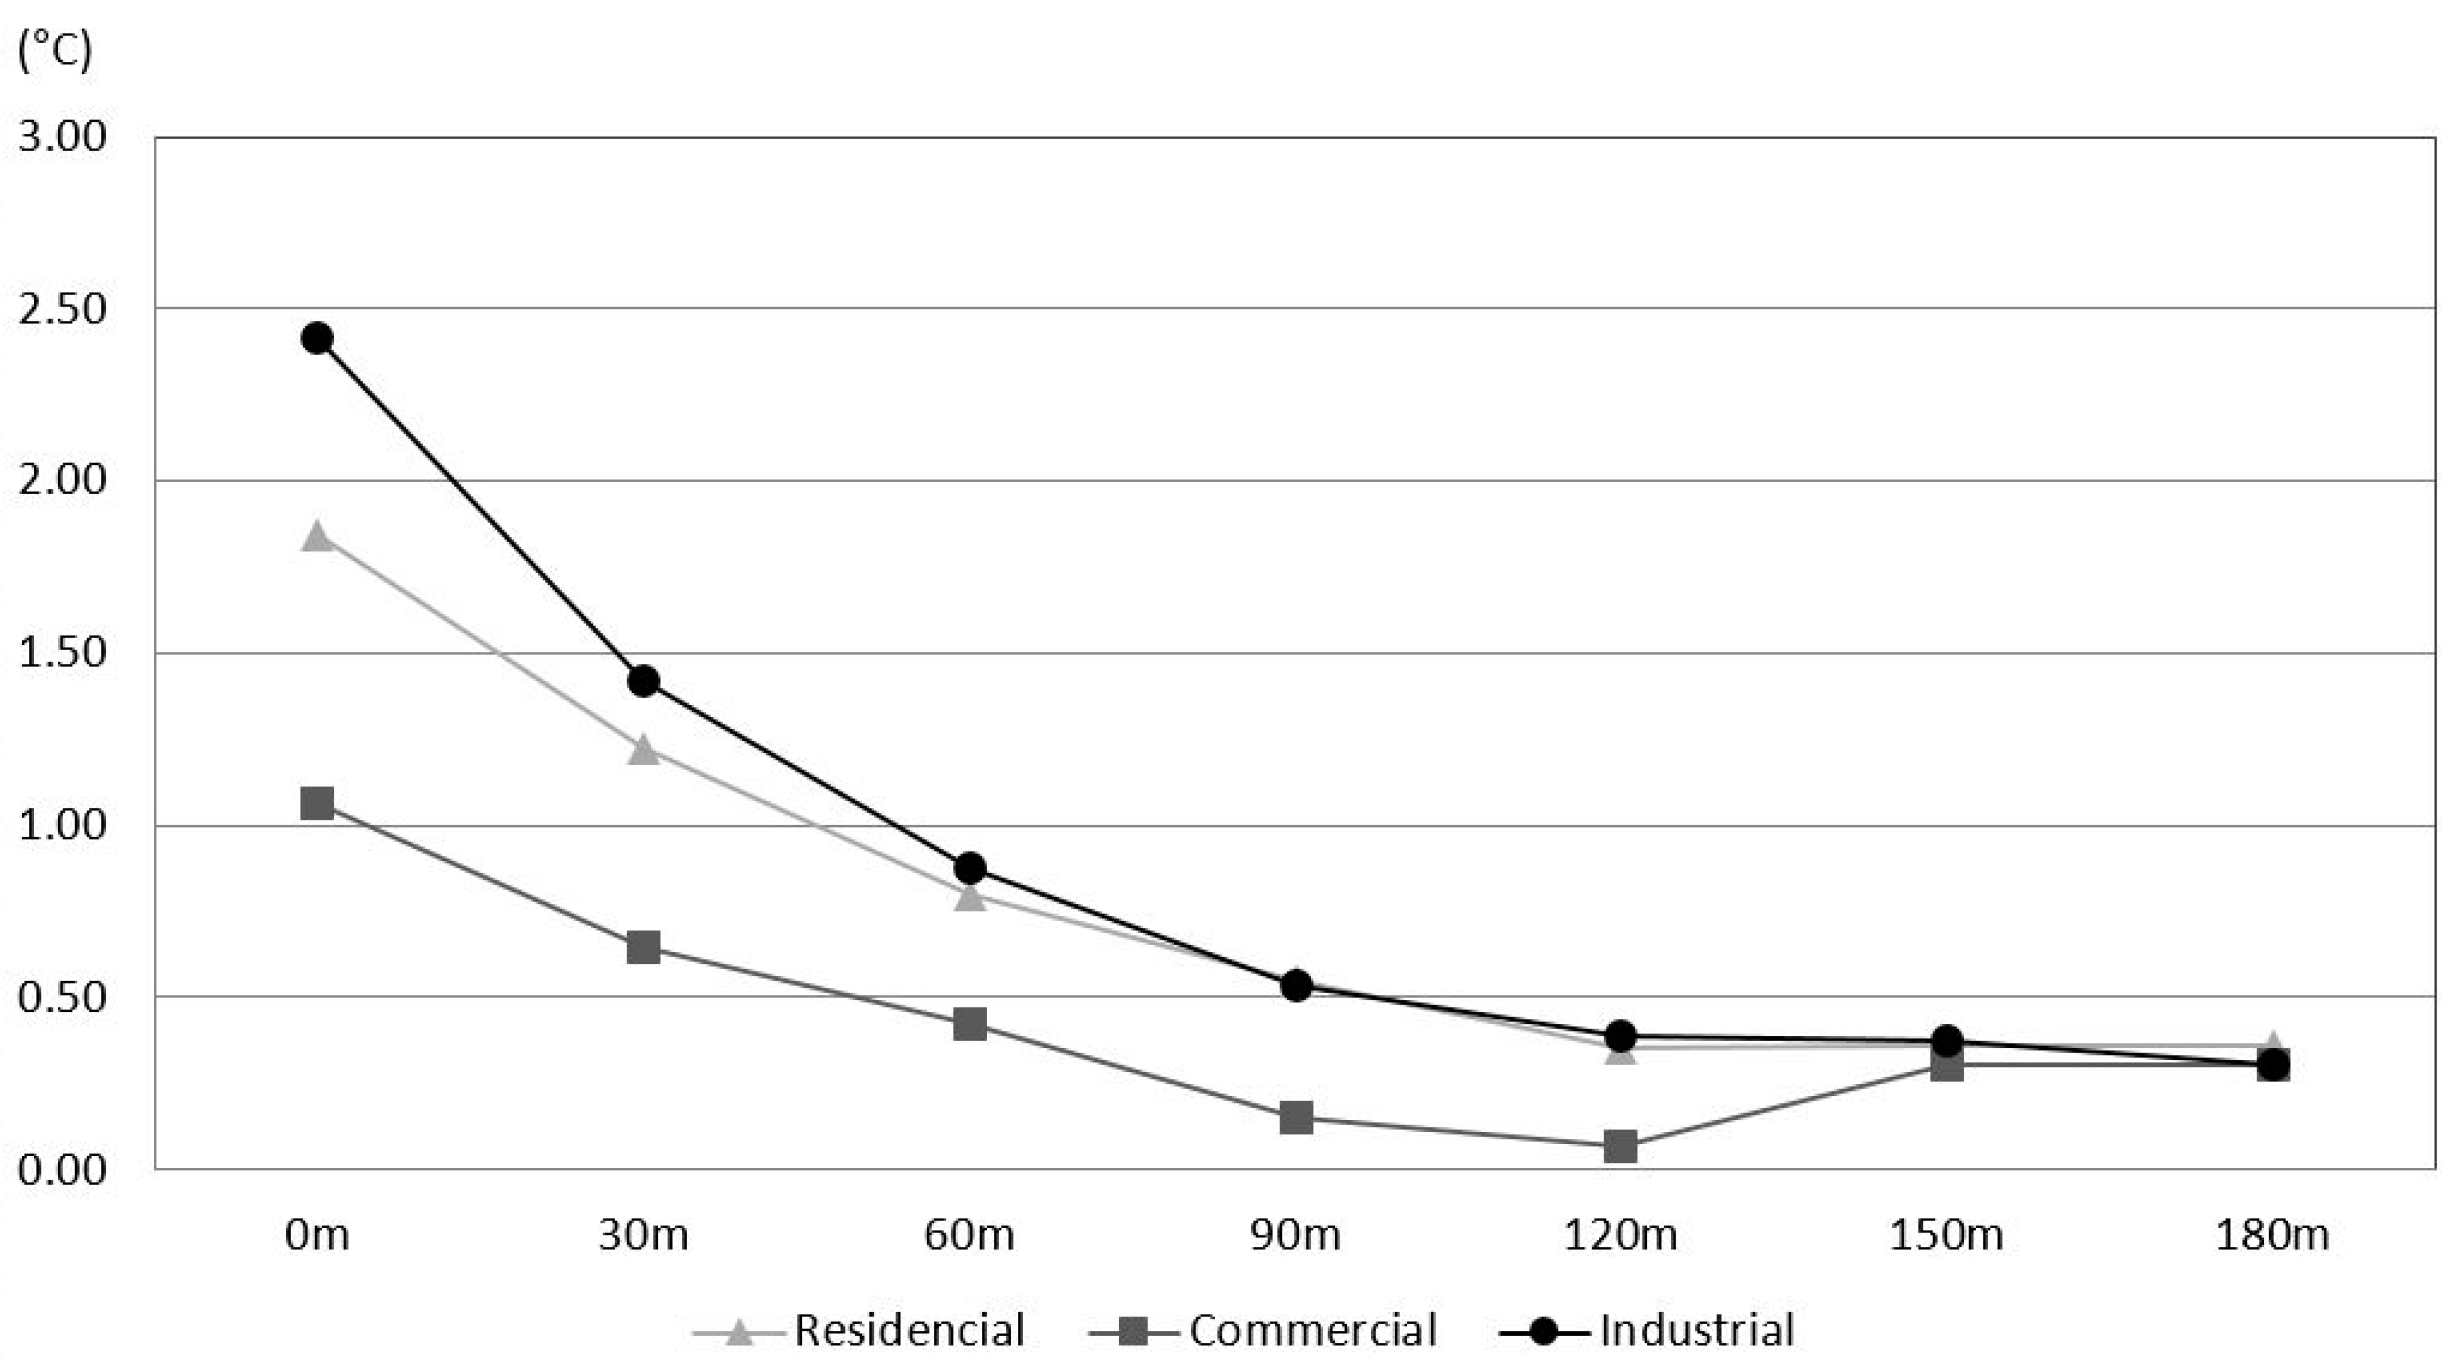
Green spaces located in commercial areas had smaller PCI than those located in residential or industrial areas. Two possible explanations can be suggested. First, all other things being equal, the most distinct feature of commercial areas is their high density. In the study area, the mean Floor Area Ratio (FAR) of commercial areas is 187.9% while the mean FAR of residential and industrial areas is 53.7% and 20.5%, respectively. Tall buildings and dense urban environments are causes of UHIs, as their density traps short-wave radiation and obstructs air movement [
3]. In other words, the higher density and the larger building sizes in commercial areas may decrease PCI effects by blocking the circulation of cooled air into city blocks. Second, the LST of industrial areas is higher than the LST of residential or commercial areas. By nature, industrial areas are mainly covered by large open concrete surfaces [
19] while the high-rise buildings in commercial areas generate shading on the surface. In any case, the density of the built-up environment surrounding a green space affects the size of the PCI of the green space.
Our study has several limitations. First, the resolution of the satellite images we acquired (100 m by 100 m) from Landsat 8 was too low to detect the micro thermal features of green spaces. Alongside these TIRS band data, surface emissivity, atmospheric transmissivity, upwelling radiance, and reflected radiance data might be used to arrive at an even more accurate estimation of LST. Our method for calculating PCI tended to over-estimate PCI by approximately 0.3 K due to variations in LST decay over distance. Second, the surrounding conditions of the selected green spaces were not all the same. Among our six belt-shaped green spaces, four were adjacent to watercourses. Six with irregular or compact shapes were located close to bodies of water, either watercourses or lakes. Two of our irregularly shaped green spaces were adjacent to mountain areas. In measuring cooling effects, we excluded bodies of water or mountain areas from lands adjacent to the green spaces examined. Although there is a possibility that the LST of urban land is affected by uneven characteristics of landscape composition and the configuration of the surrounding areas, we assumed that those features of the surrounding conditions would be a random factor, thus they might not cause systematic bias in estimating PCI. Third, we used Landsat 8 data from only one day in August 2013 because of higher cloud-cover rates on other dates during that summer. It is not uncommon to use one day of data from a typical summer day; Völker et al. [
34] showed that, among the 19 studies they reviewed, eight studies used data gathered on a single day. However, analyzing data from multiple dates may improve the reliability of future results. Fourth, LST does not directly indicate the thermal comfort level of humans, although how the thermal sensations of people influence their behavior is important in the context of urban planning [
37]. An existing study on remote sensing [
38] found that land surface temperature is linearly associated with surface air temperature. Santamouris et al. [
39] and Synnefa et al. [
40] showed that a decrease in the surface temperature considerably improved thermal comfort. However, it is difficult to accurately quantify the degree of improvement in thermal conditions since the association between land surface temperature and outdoor thermal comfort varies according to meteorological factors as well as physiology [
37]. A large number of research projects on outdoor thermal comfort have been conducted in various climates around the world. Most of them investigated the thermal comfort at a relatively limited number of locations in urban context since measurement of outdoor thermal comfort in an urban environment is a complex issue related to various factors. The use of LSTs had the advantage of collecting vast amounts of cell-based surface temperature data at one time. When we consider that the aim of this study is to investigate cooling effects of green spaces with various physical characteristics, the use of LSTs as an indicator for cooling effects seems more reasonable.
5. Conclusions
We hypothesized that different physical characteristics of green spaces might reduce the Land Surface Temperatures (LSTs) of their surroundings and mitigate Urban Heat Islands (UHIs). More specifically, this study aimed to investigate variations of cooling distance and cooling intensity of green spaces associated with their physical characteristics. To define the physical characteristics of urban built environments, we chose four dimensions: Normalized Difference Vegetation Index (NDVI), Land Shape Intensity (LSI), size, and land use.
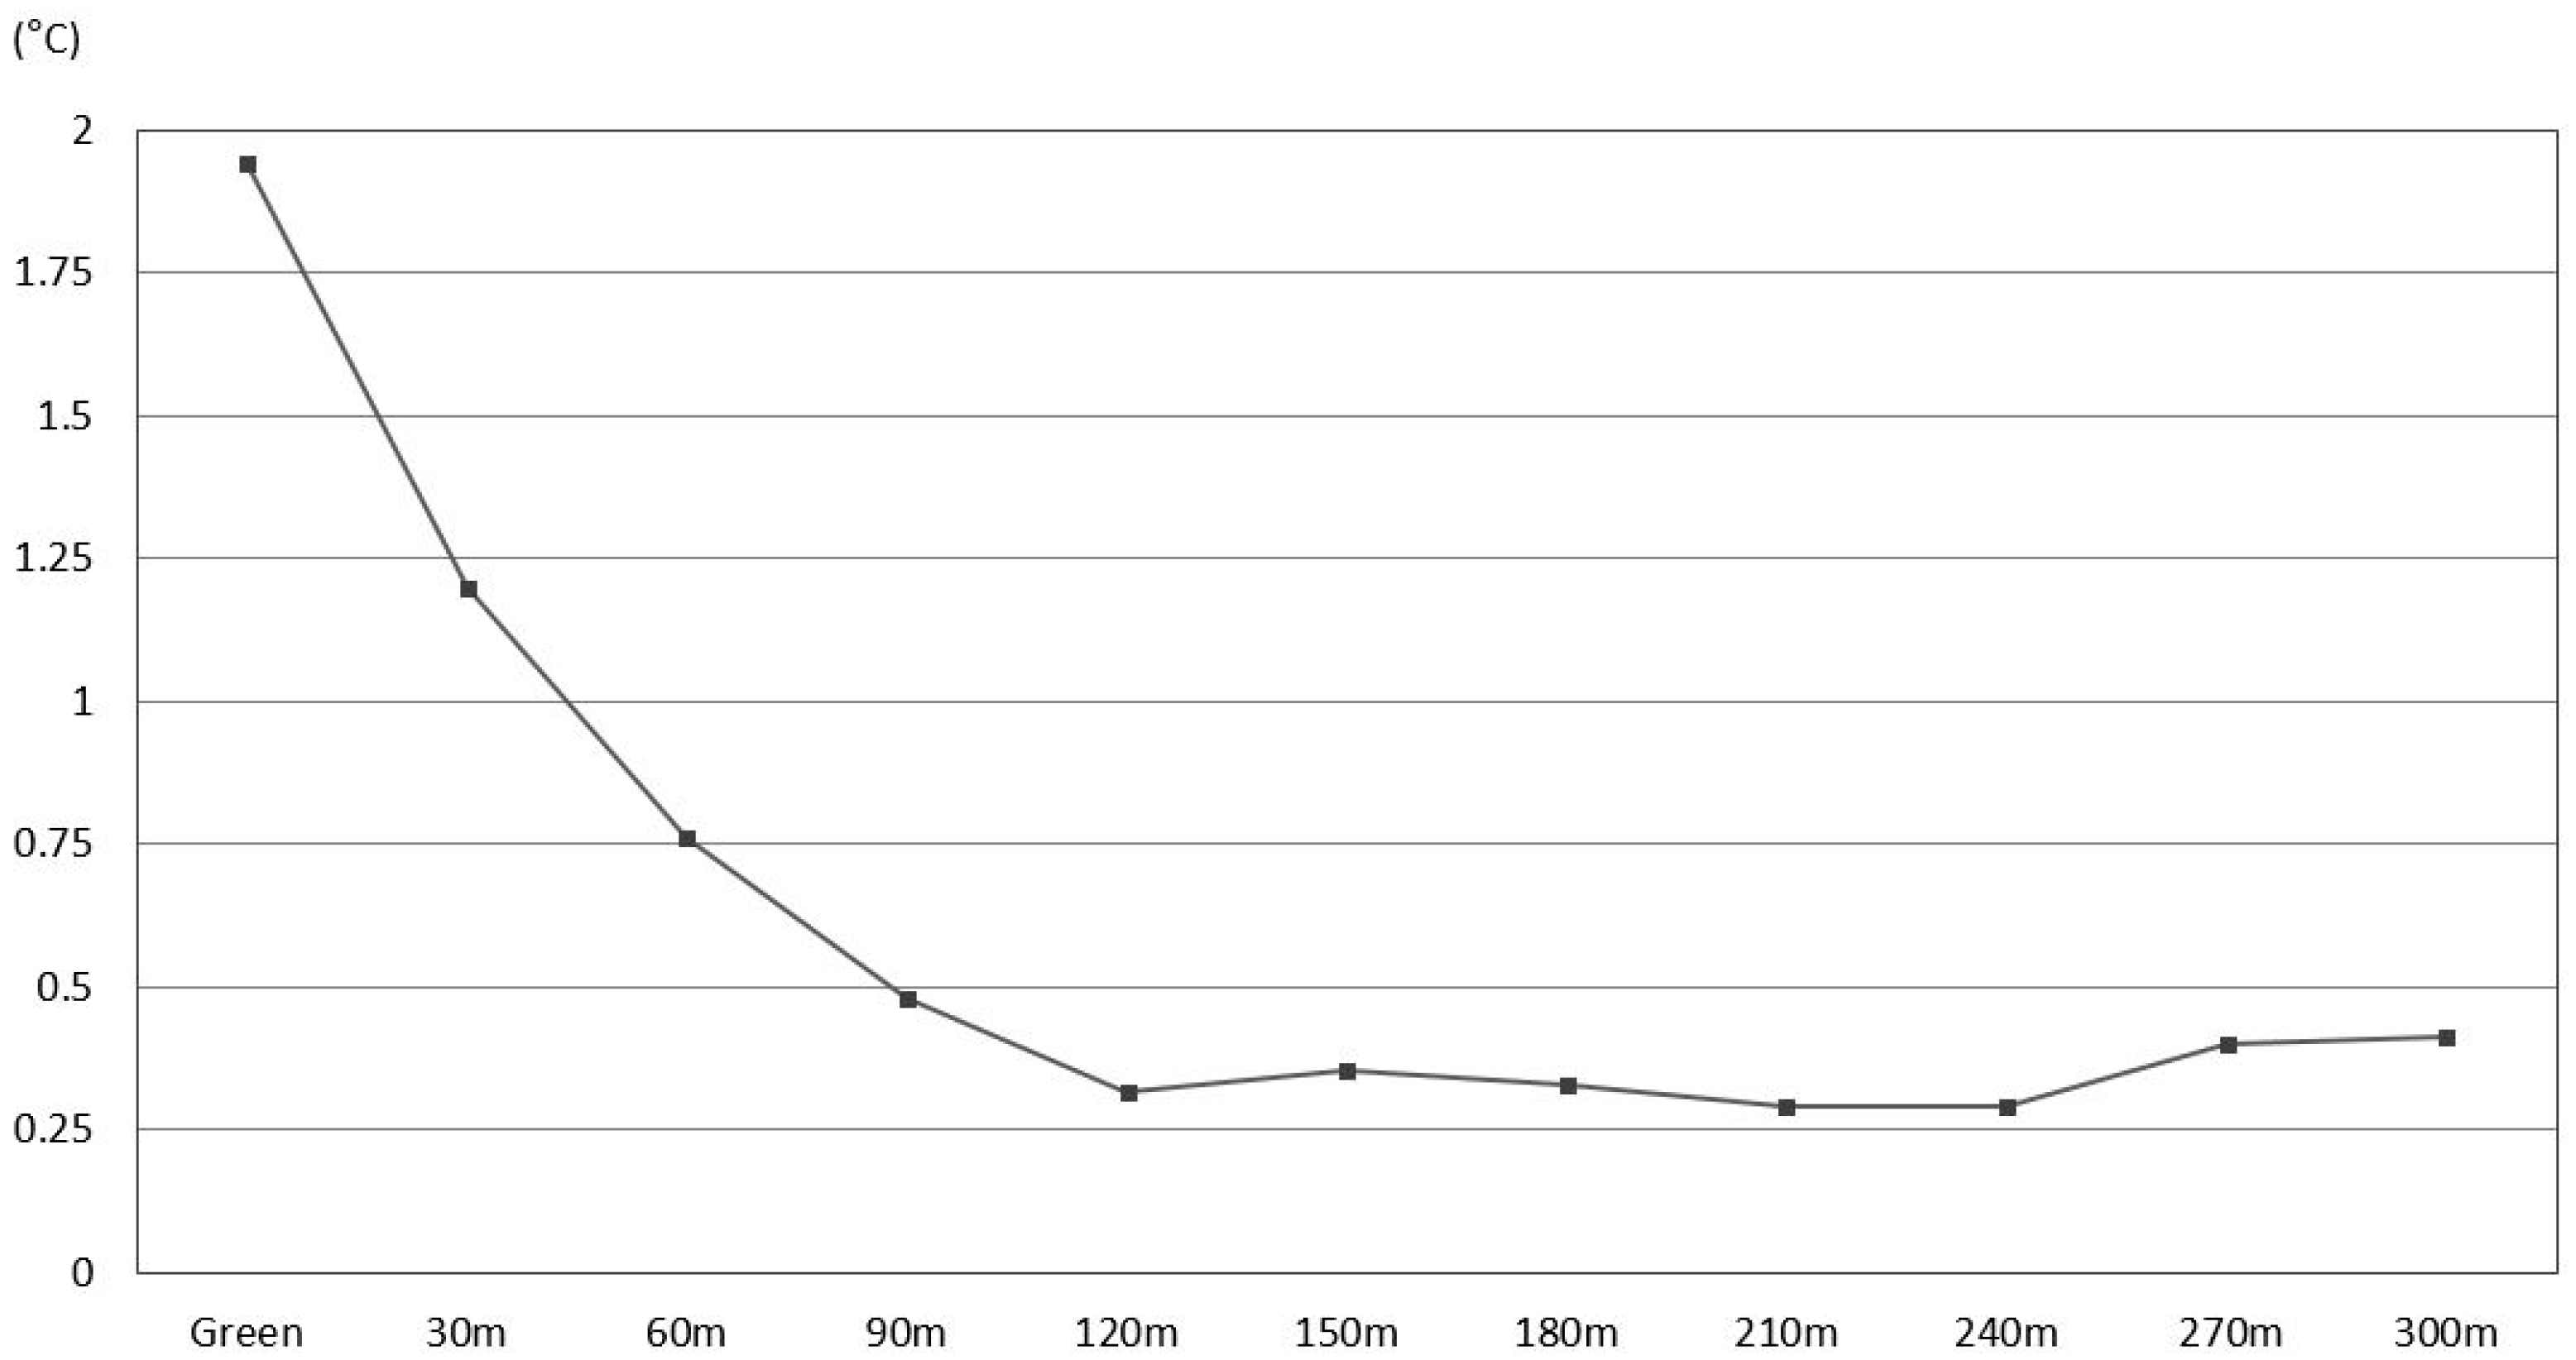
The analytical results showed that the size of the Park Cooling Impact (PCI) varied by physical characteristics. A higher NDVI and a larger green space were positively but non-linearly associated with PCI. The context of the green spaces was also influential in determining PCI. Green spaces located in industrial areas had the highest PCI, and those in commercial districts had the lowest PCI. The study area is the largest industrial city in Korea. Providing more green spaces in concrete covered industrial areas may significantly reduce the LSTs. The maximum size of PCI did not exceed 3 K. While PCI varied by NDVI, size of green space, and land-use type, the cooling distance was mainly found within 120 m of the green spaces. The only feature that might affect the cooling distance was LSI. The PCI of elongated green spaces can reach up to 180 m.
This finding suggests a couple of implications in urban planning. In terms of cooling intensity, construction of urban parks is not always an effective intervention to mitigate UHIs. A green space smaller than 300,000 m2 has a limited cooling intensity while many urban parks do not exceed the recommended size. However, with respect to cooling distance, our finding implies that construction of multiple green spaces in a dispersed pattern may be more effective than construction of a single large green space to reduce LSTs, because the cooling distance is not highly sensitive to the physical characteristics of the green space.
We have focused on a general assessment of the thermal effects that may be useful for urban planners [
41]. Our results suggest that there are certain features of green spaces that can be recommended to reduce LSTs and mitigate UHIs in concrete locations. We hope that our findings offer a better understanding of the cooling effects of green spaces and, ultimately, provide practical guidelines for urban planners designing such spaces.


