
Assessment of the Coordination Ability of Sustainable Social-Ecological Systems Development Based on a Set Pair Analysis: A Case Study in Yanchi County, China


Abstract
:1. Introduction
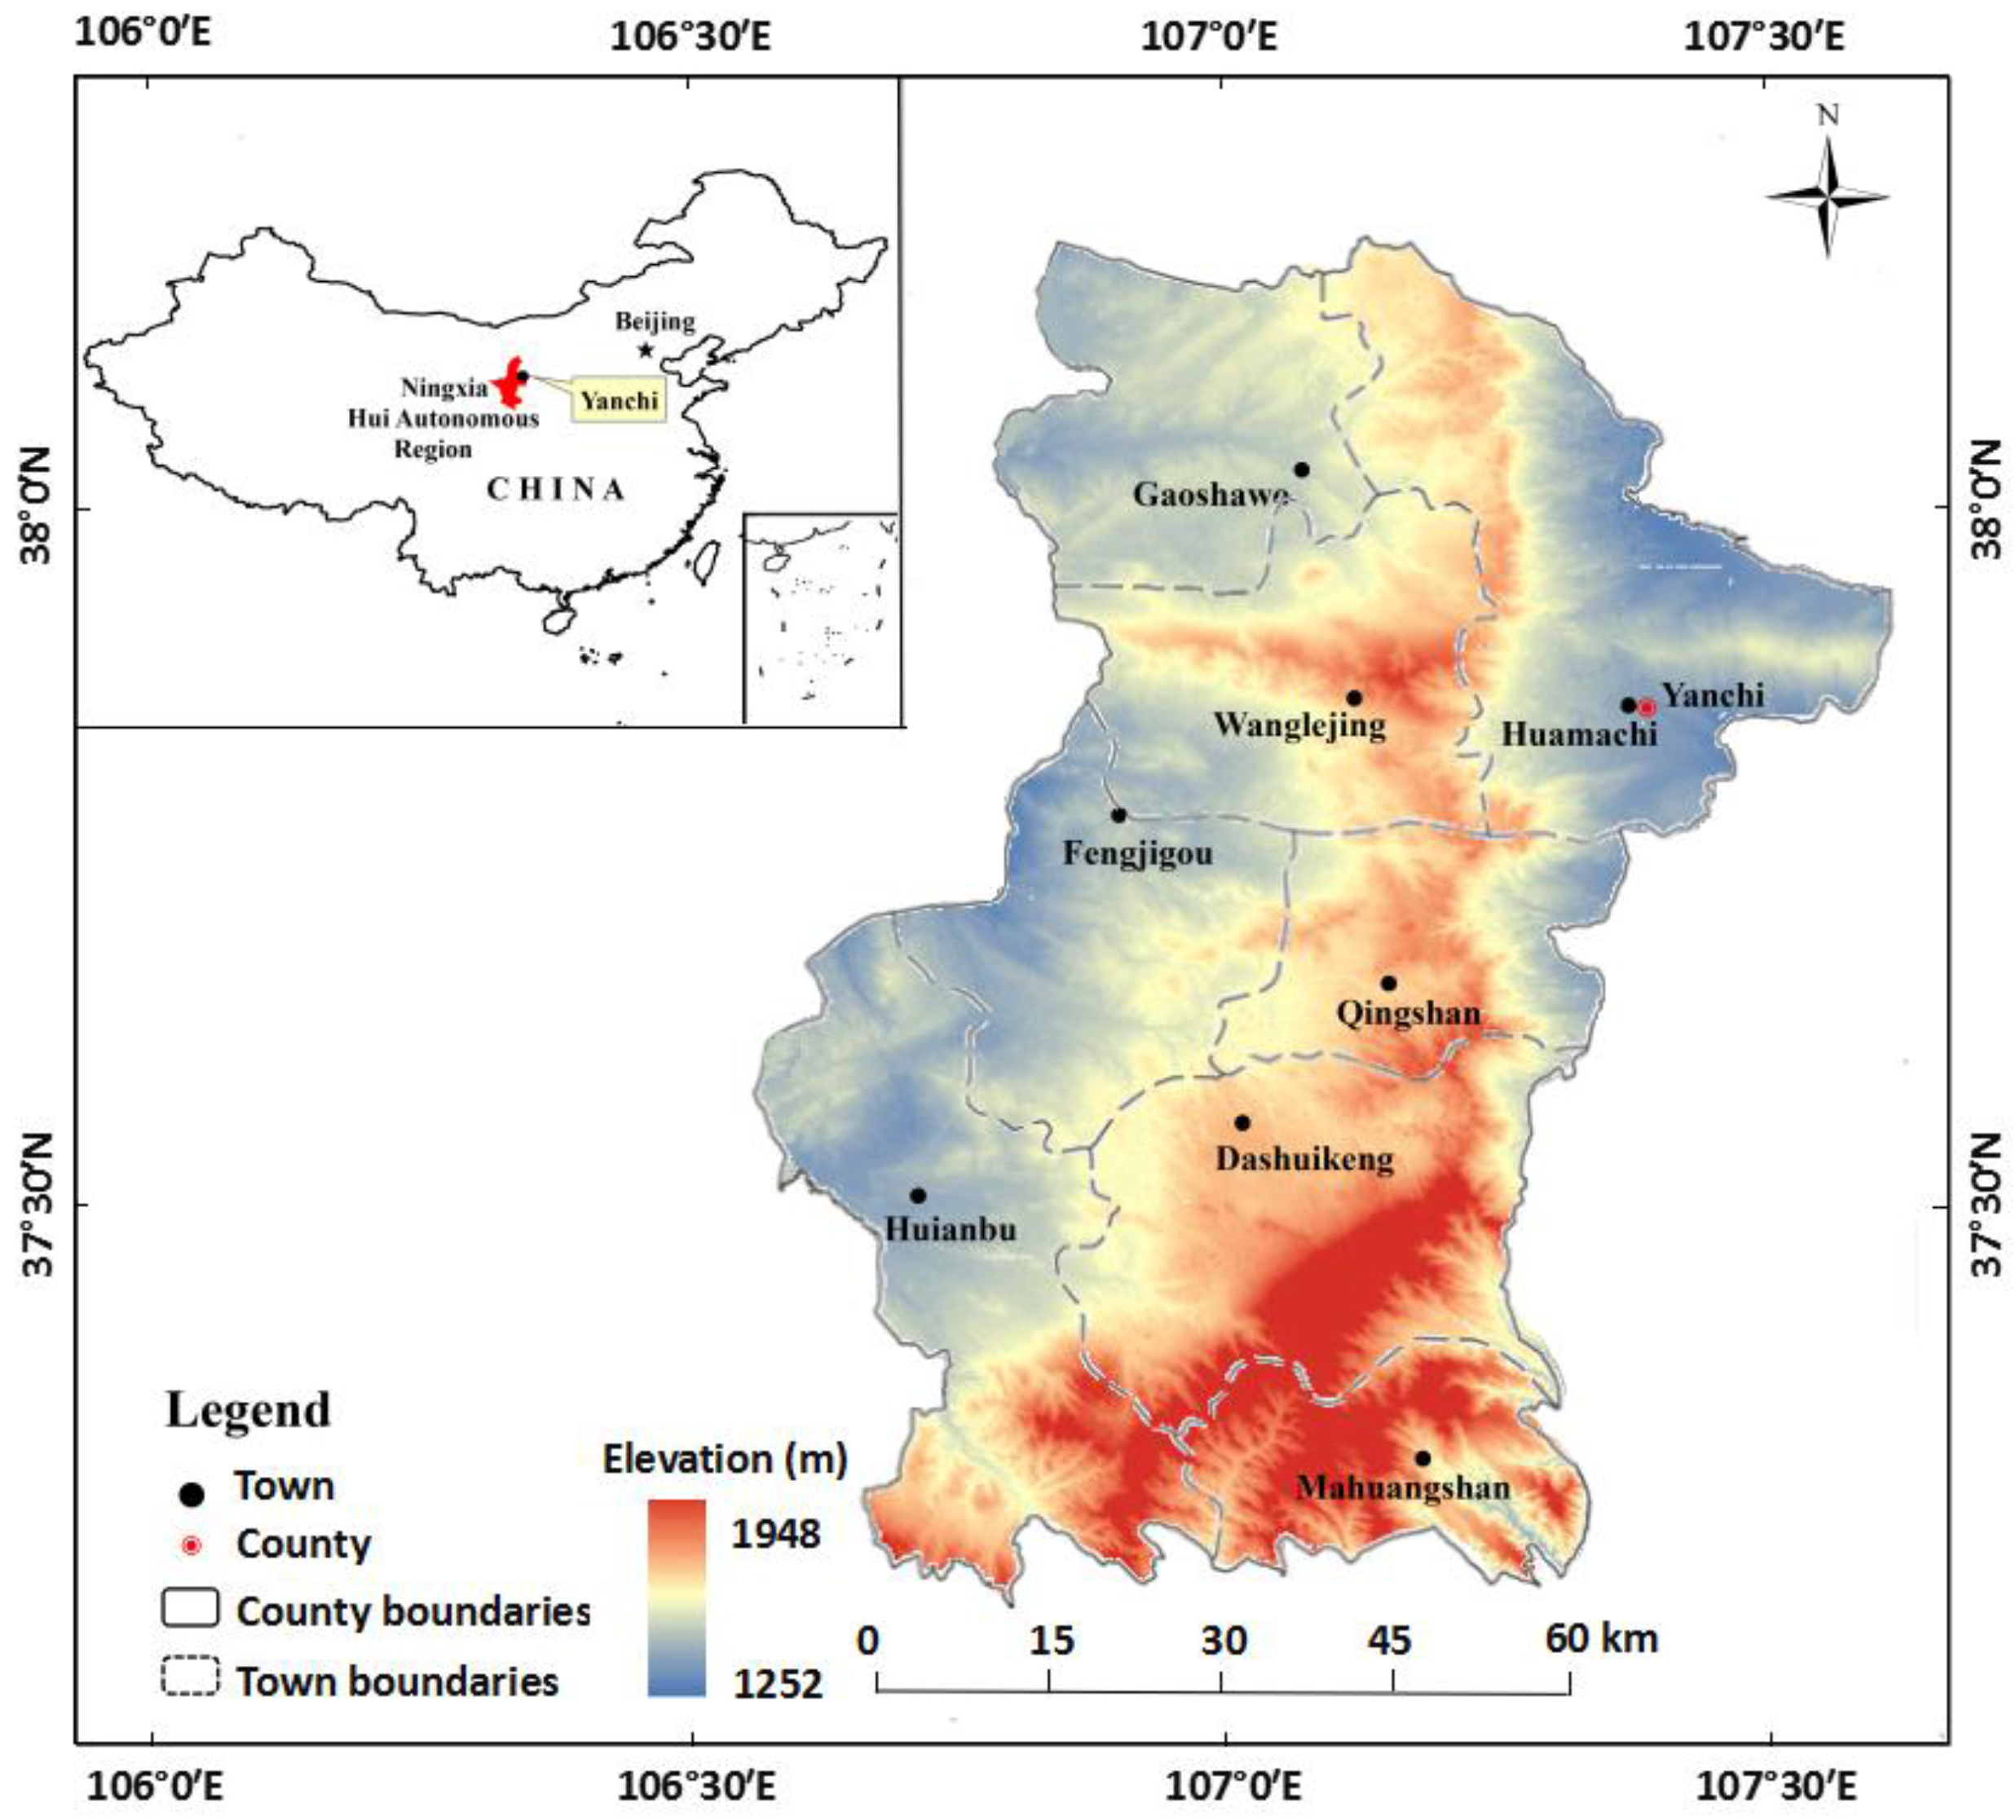
2. Study Area
3. Methods and Data
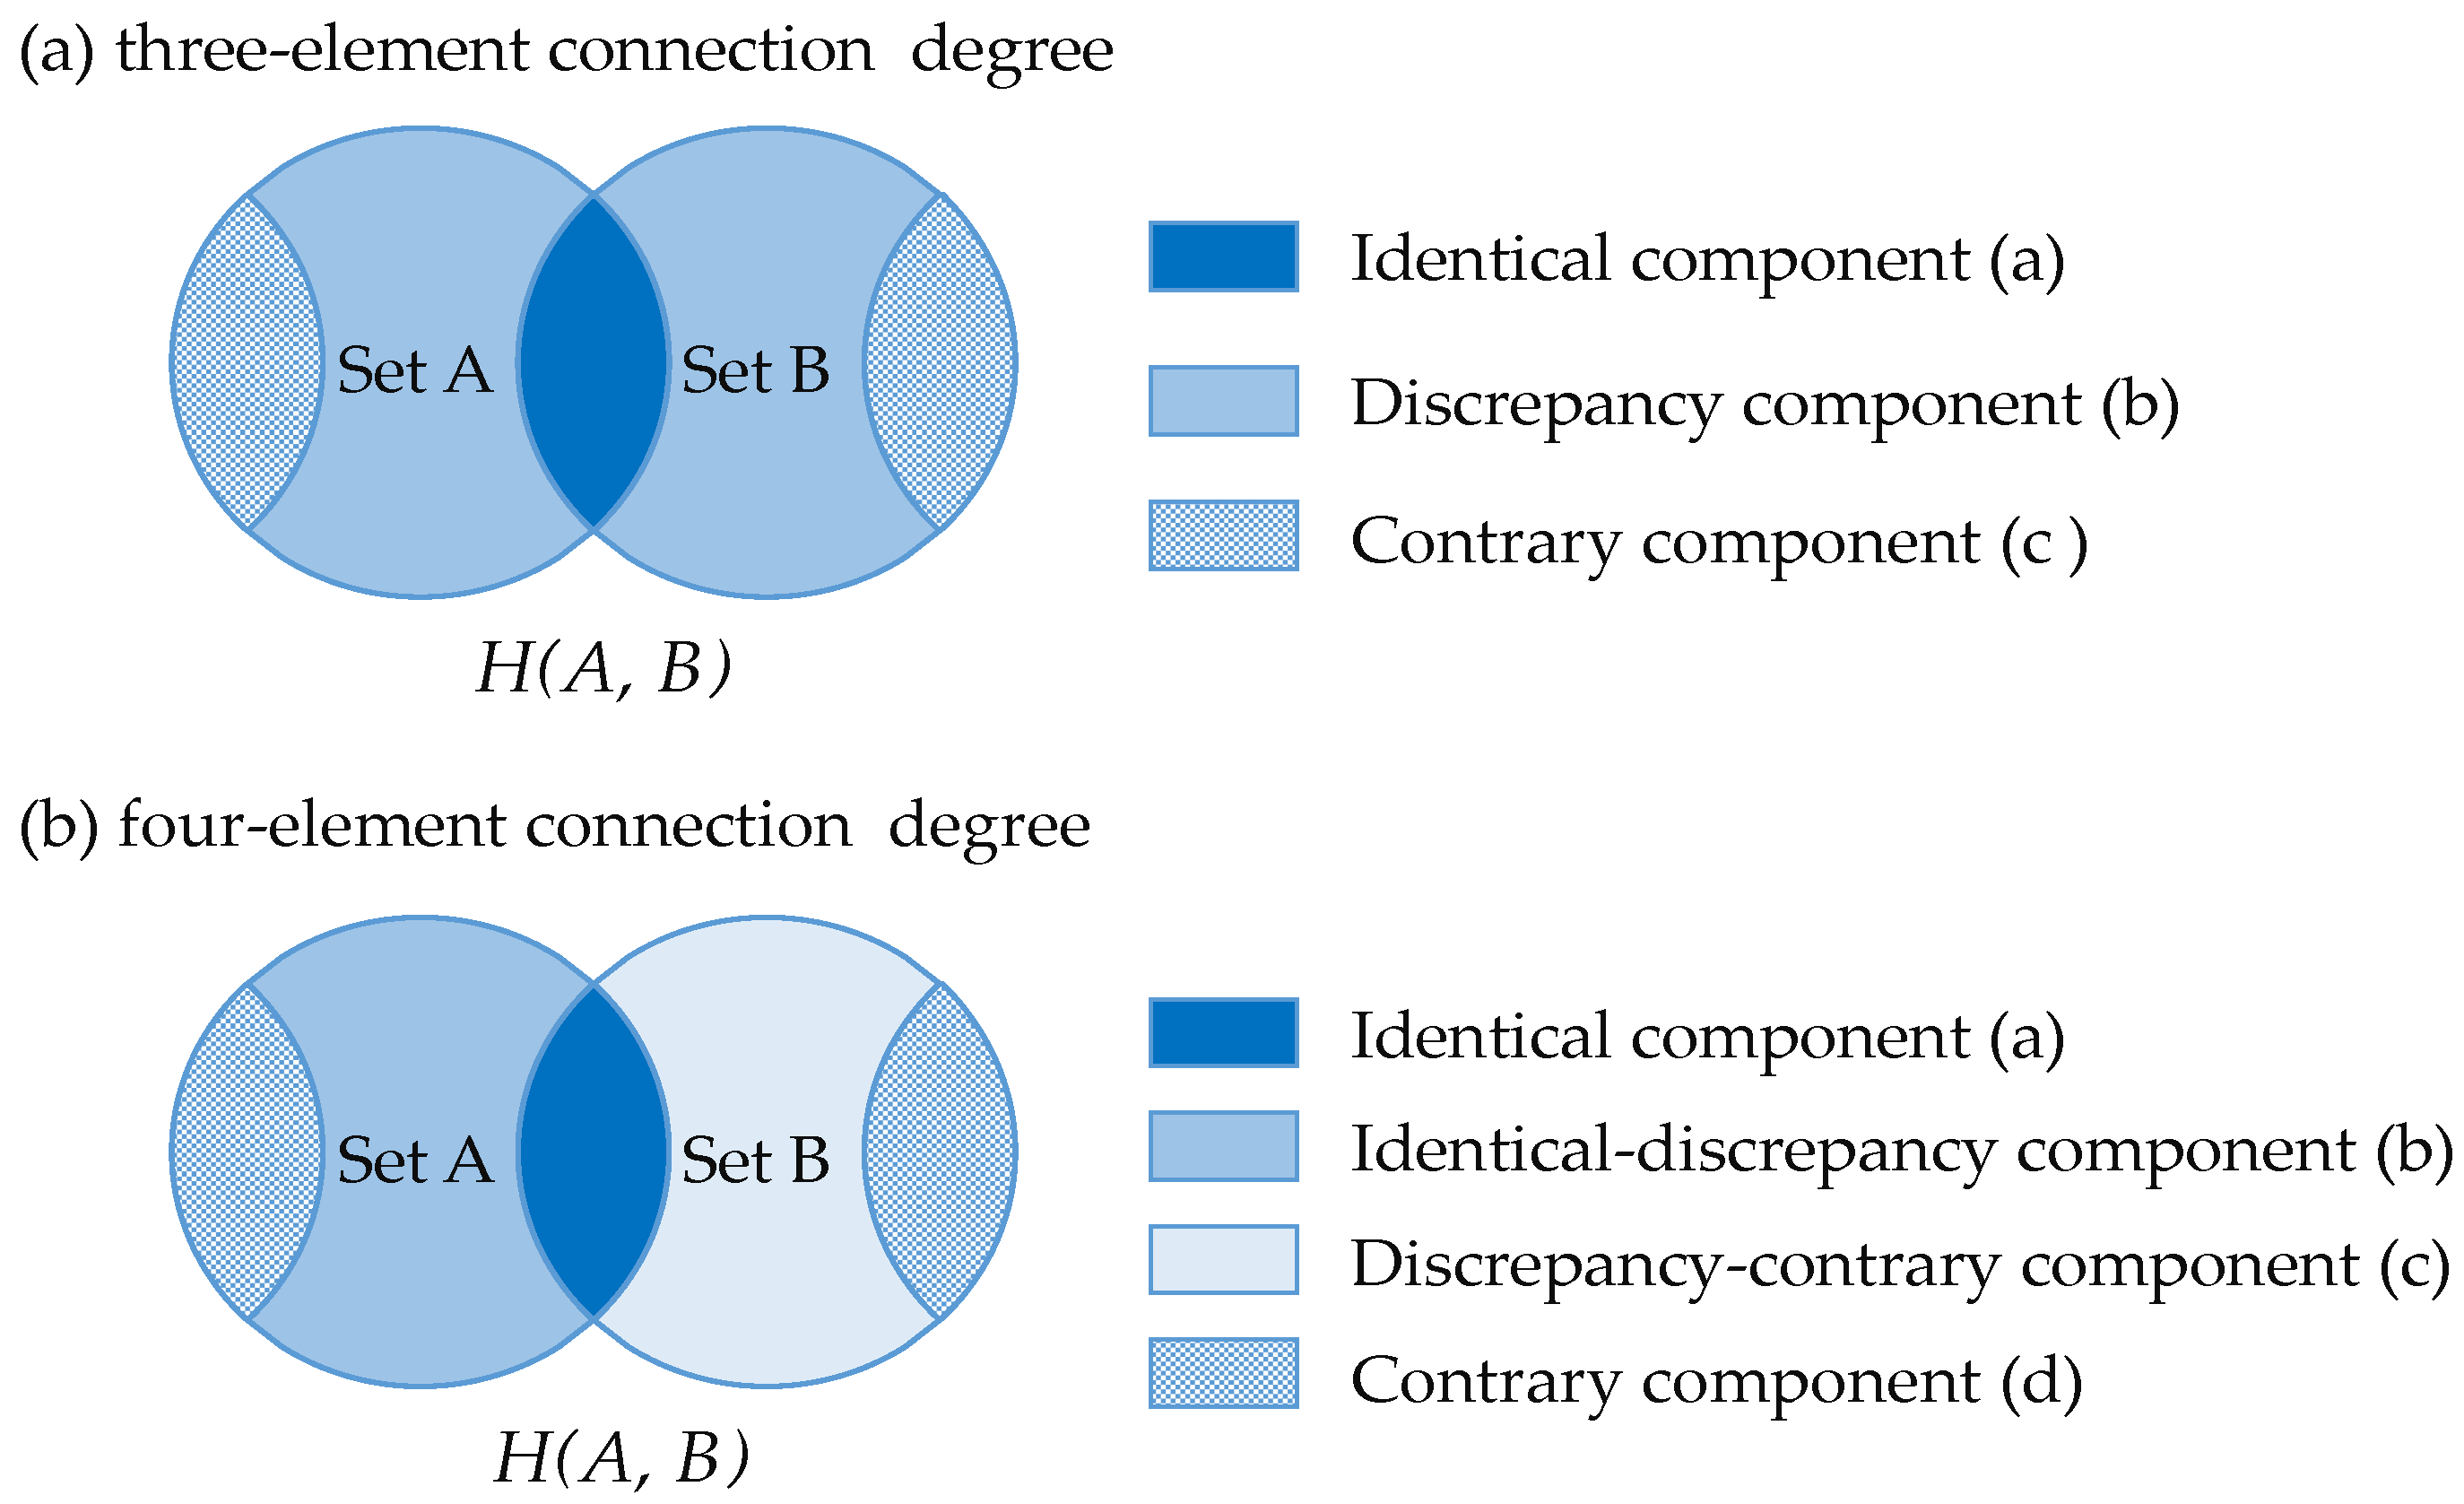
3.1. Principle and Application of Set Pair Analysis
3.2. Construction of an Index System for Sustainable SES Development
3.3. Evaluation Criteria for Sustainable Development
3.4. Construction of the Evaluation Model of Coordination Ability for an SES
3.5. Data Sources
4. Results and Analysis
4.1. Grading of Sustainable SES Development Based on the Connection Degree
4.2. Situation Sorting and Dynamic Evolution of the SES Based on the SPP
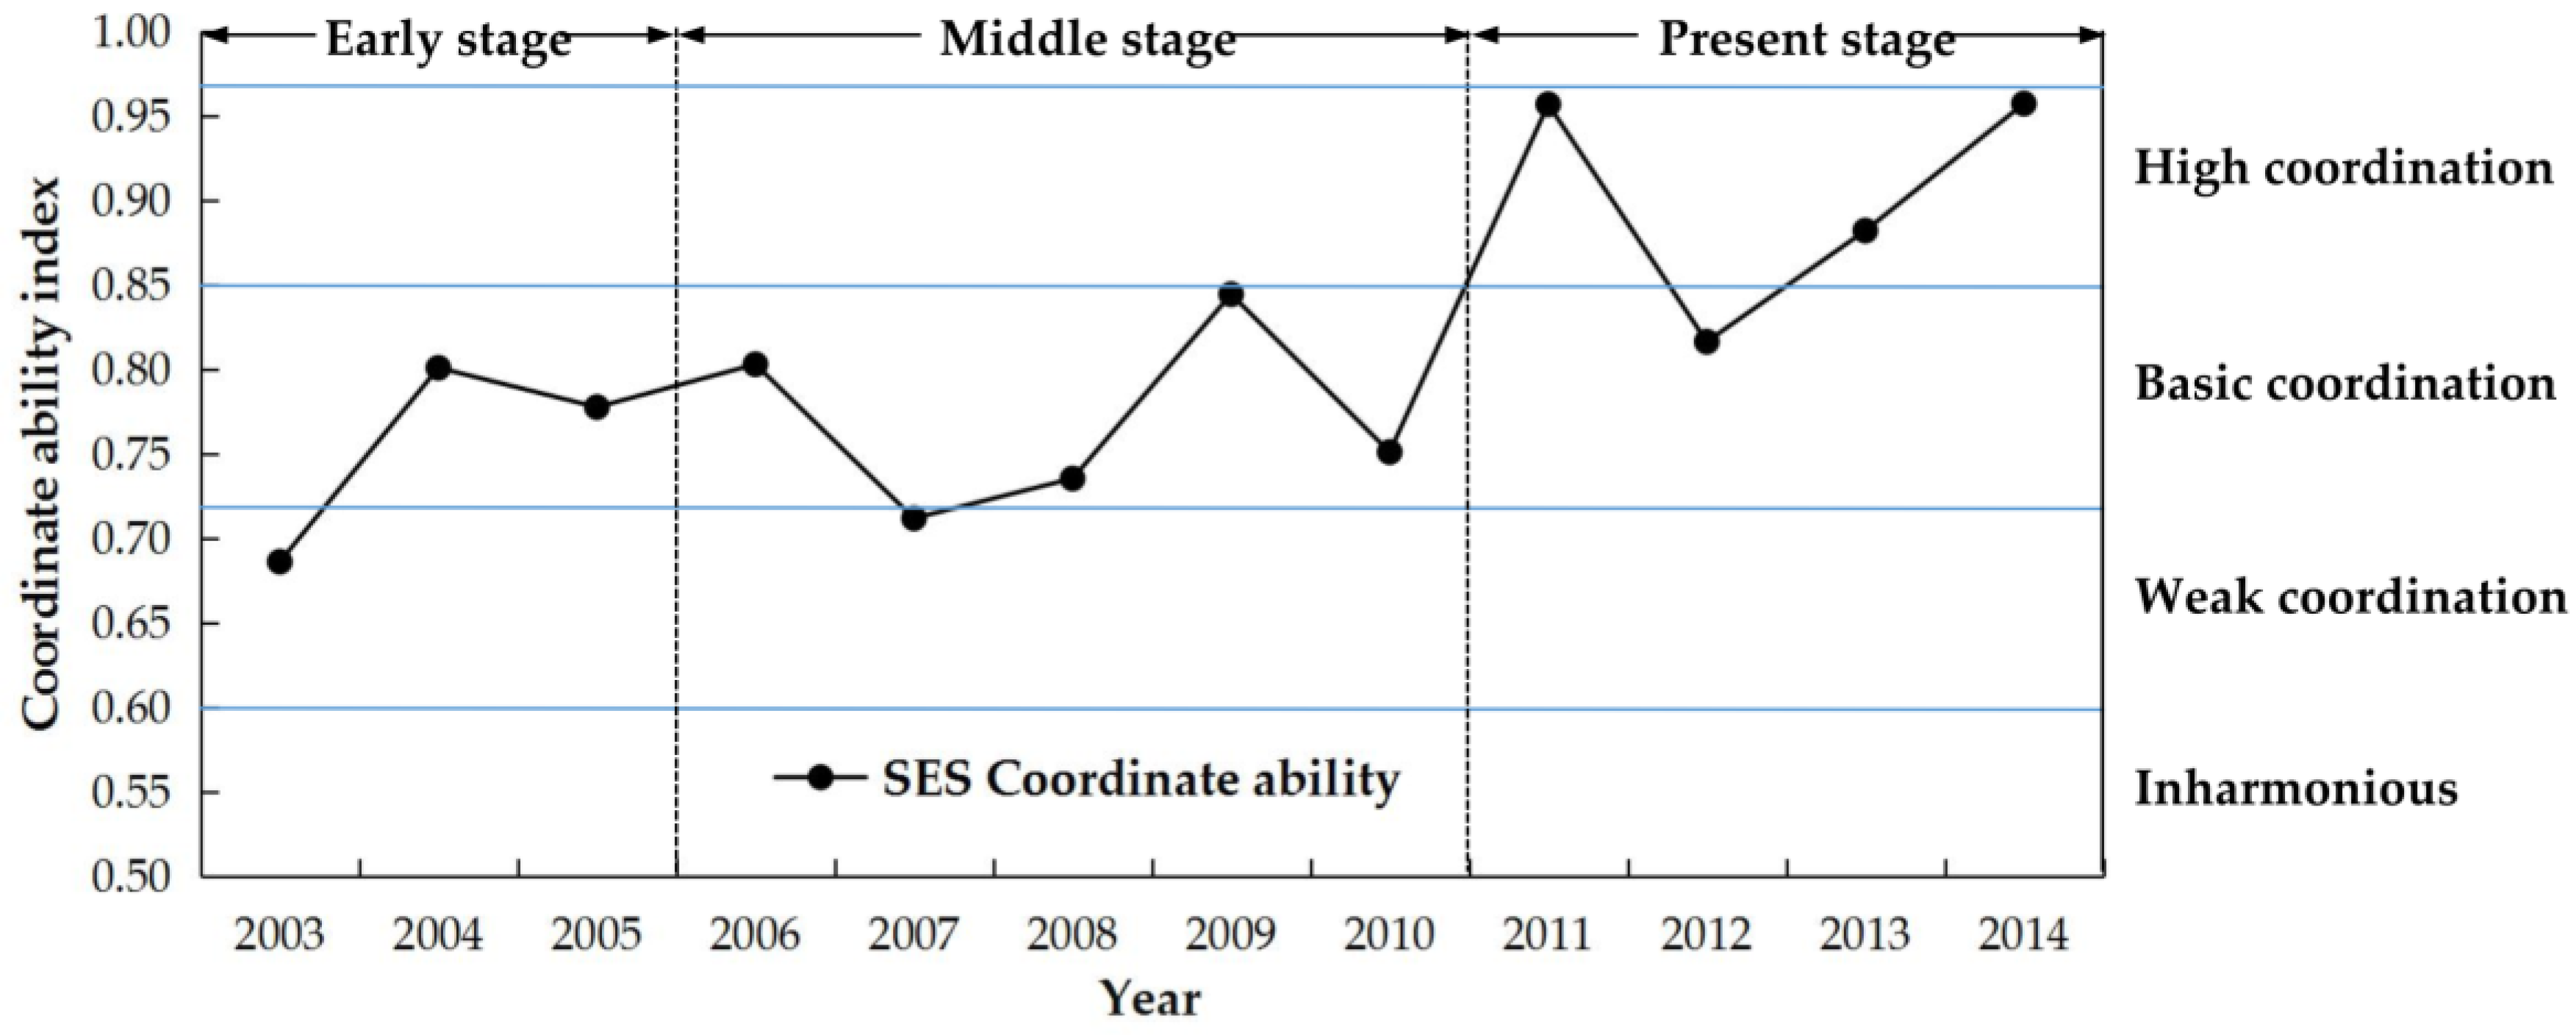
4.3. Analysis of the SES Coordination Ability Based on the Growth Curve Index
4.4. Analysis of the Variation of the SES Coordination Ability in the Different Stages of the Grazing Prohibition Policy
5. Discussion
5.1. Advantages and Applicability of the Method
5.2. Comparison and Discussion of Results
5.3. Deficiencies and Prospects of the Study
6. Conclusions
Acknowledgments
Author Contributions
Conflicts of Interest
Abbreviations
| SES | Social-Ecological System |
| IDC | Identical-Discrepancy-Contrary |
| SPA | Set Pair Analysis |
| SPP | Set Pair Potential |
| CAI | Coordination Ability Index |
References
- Anderies, J.M.; Janssen, M.A.; Ostrom, E. A framework to analyze the robustness of social-ecological systems from an institutional perspective. Ecol. Soc. 2004, 9, 18. [Google Scholar]
- Wang, Y.; Liu, J.L.; Feng, Z.; Li, S.C.; Cai, Y.L. Theoretical framework for sustainable governance of common-pool resource. J. Nat. Res. 2012, 27, 1797–1807. (In Chinese) [Google Scholar]
- Binder, C.R.; Hinkel, J.; Bots, P.W.G.; Pahl-Wostl, C. Comparison of frameworks for analyzing social-ecological systems. Ecol. Soc. 2013, 18, 26. [Google Scholar] [CrossRef]
- Fischer-Kowalski, M.; Weisz, H. Society as hybrid between material and symbolic realms. Adv. Hum. Ecol. 1999, 8, 215–251. [Google Scholar]
- Glaser, M.; Krause, G.; Ratter, B.M.; Welp, M. Human-Nature Interactions in the Anthropocene: Potentials of Social-Ecological Systems Analysis; Routledge Press: London, UK, 2012. [Google Scholar]
- Gunderson, L.H.; Holling, C.S. Panarchy: Understanding Transformations in Human and Natural Systems; Island Press: Washington, DC, USA, 2002. [Google Scholar]
- Holling, C.S. Understanding the complexity of economic, ecological, and Social systems. Ecosystems 2001, 4, 390–405. [Google Scholar] [CrossRef]
- Niu, W.Y. The theoretical connotation of sustainable development: The 20th anniversary of un conference on environment and development in Rio de Janeiro, Brazil. China Popul. Resour. Environ. 2012, 22, 9–14. (In Chinese) [Google Scholar]
- Bruntland, G.H. Our Common Future: The World Commission on Environment and Development; Oxford University Press: Oxford, UK, 1987. [Google Scholar]
- Liu, C.F.; Liu, Y.Y. Status and main models of circulated economy development. Environ. Sci. Technol. 2005, 28, 77–78. (In Chinese) [Google Scholar]
- Kates, R.W.; Clark, W.C.; Corell, R. Environment and development: Sustainability science. Science 2001, 292, 641–642. [Google Scholar] [CrossRef] [PubMed]
- Tan, F.F.; Zhang, M.; Li, H.R.; Lu, Z.H. Assessment on coordinative ability of sustainable development of Beijing-Tianjin-Hebei region based on set pair analysis. Acta Ecol. Sin. 2014, 34, 3090–3098. (In Chinese) [Google Scholar]
- Holling, C.S. From complex regions to complex worlds. Ecol. Soc. 2004, 9, 11. [Google Scholar]
- Wang, T.; Zhu, Z.D.; Zhao, H.L. Study on sandy desertification in China: 4. Strategy and approach for combating sandy desertification. J. Desert Res. 2004, 24, 115–123. (In Chinese) [Google Scholar]
- Gerile, W. Research on change of land use in desertification reversal regions of Inner Mongolia based on RS and GIS-Aohan banner. J. Inn. Mong. Norm. Univ. (Nat. Sci. Ed.) 2004, 33, 199–202. [Google Scholar]
- Lv, S.H.; Lu, X.S.; Jin, W.L. Studies on wind erosion desertification and methods of reversion in Hulunber Steppe. J. Arid Land Res. Environ. 2005, 19, 59–63. (In Chinese) [Google Scholar]
- Ma, Y.H.; Zhou, L.H.; Fan, S.Y.; Dong, Z.Y. Reversion of land desertification in China and the strategic shift of ecological control policies. Chin. Soft Sci. 2006, 6, 53–59. (In Chinese) [Google Scholar]
- Zhou, L.; Zhu, Y.; Yang, G.; Luo, Y. Quantitative evaluation of the effect of prohibiting grazing policy on grassland desertification reversal in Northern China. Environ. Earth Sci. 2013, 68, 2181–2188. [Google Scholar] [CrossRef]
- Wang, T.; Song, X.; Yan, C.Z.; Li, S.; Xie, J.L. Remote sensing analysis on aeolian desertification trends in Northern China during 1975–2010. J. Desert Res. 2011, 31, 1351–1356. (In Chinese) [Google Scholar]
- Chen, Y.; Wang, T.; Zhou, L.; Liu, N.; Huang, S. Effect of prohibiting grazing policy in Northern China: A case study of Yanchi County. Environ. Earth Sci. 2014, 72, 67–77. [Google Scholar] [CrossRef]
- Costanza, R.; d’Arge, R.; de Groot, R.; Farber, S.; Grasso, M.; Hannon, B.; Limburg, K.; Naeem, S.; O’Neill, R.V.; Paruelo, J.; et al. The value of the world’s ecosystem services and natural capital. Nature 1997, 387, 253–260. [Google Scholar] [CrossRef]
- De Groot, R.; Brander, L.; van der Ploeg, S.; Costanza, R.; Bernard, F.; Braat, L.; Christie, M.; Crossman, N.; Ghermandi, A.; Hein, L.; et al. Global estimates of the value of ecosystems and their services in monetary units. Ecosyst. Serv. 2012, 1, 50–61. [Google Scholar] [CrossRef]
- Ma, M.D.; Xie, Y.Z.; Mi, W.B.; Liu, C.N.; Ma, T.; Ao, H.W. Land use and land cover change of the sand drift areas in eastern Ningxia and its response to ecology: A case of Yanchi County. J. Arid Land Res. Environ. 2014, 28, 8–14. (In Chinese) [Google Scholar]
- Wang, X.J.; Zhou, L.I.; Shi, M.J. Sustainable development of a rural economy under grazing prohibition in a desertification control region and agro-pastoral transitional zone. Resour. Sci. 2014, 36, 2166–2173. (In Chinese) [Google Scholar]
- Yao, Y.Z.; Li, Q.H.; Yang, G. Study on dynamic changes of desertification in Yanchi County based on Idd. J. Inn. Mong. Agricult. Univ. (Nat. Sci. Ed.) 2013, 34, 61–65. (In Chinese) [Google Scholar]
- Zhao, K.Q. Research the set pair analysis and entropy. J. Zhejiang Univ. 1992, 6, 65–72. (In Chinese) [Google Scholar]
- Wu, F.F.; Wang, X. Eutrophication evaluation based on set pair analysis of Baiyangdian Lake, North China. Procedia Environ. Sci. 2012, 13, 1030–1036. [Google Scholar] [CrossRef]
- Levin, S.A. Ecosystems and the biosphere as complex adaptive systems. Ecosystem 1998, 1, 431–436. [Google Scholar] [CrossRef]
- Ye, J. An analysis of the ecosystem of the human society. J. Yantai Univ. (Philos. Soc. Sci. Ed.) 2004, 2, 143–148. (In Chinese) [Google Scholar]
- Wang, Q.; Lu, L.; Yang, X.Z. Study on measurement and impact mechanism of socio-ecological system resilience in Qiandao Lake. Acta Geographica Sin. 2015, 70, 779–795. (In Chinese) [Google Scholar]
- Ruiz-Ballesteros, E. Social-ecological resilience and community-based tourism: An approach from Agua Blanca, Ecuador. Tourism Manag. 2011, 32, 655–666. [Google Scholar] [CrossRef]
- Cumming, G.S.; Barnes, G.; Perz, S.; Schmink, M.; Sieving, K.E.; Southworth, J.; Binford, M.; Holt, R.D.; Stickler, C.; Van Holt, T. An exploratory framework for the empirical measurement of resilience. Ecosystems 2005, 8, 975–987. [Google Scholar] [CrossRef]
- Ostrom, E. A general framework for analyzing sustainability of social-ecological systems. Science 2009, 325, 419–422. [Google Scholar] [CrossRef] [PubMed]
- Ma, S.J.; Wang, R.S. Complexity Research; Science Press: Beijing, China, 1993. [Google Scholar]
- Wang, W.S.; Li, Y.Q.; Jin, J.L.; Ding, J. Set Pair nanlysis for Hydrology and Water Resources Systems; Science Press: Beijing, China, 2010. [Google Scholar]
- Wang, M.W.; Jin, J.L.; Zhou, Y.L. Set Pair Analysis Based Coupling Methods and Applications; Science Press: Beijing, China, 2014. [Google Scholar]
- Li, Z.Y.; Wang, J.Y.; Xiong, J.Q.; Xu, T.T. Models and Applications of Sustainable Development Assessment; Science Press: Beijing, China, 2007. [Google Scholar]
- Statistical Bureau of Ningxia, National Bureau of Statistics of China Survey Office in Ningxia. Ningxia Statistical Yearbook, 2003–2015; China Statistics Press: Beijing, China, 2003–2015. (In Chinese) [Google Scholar]
- National Economic and Social Development Statistics Bulletin of Yanchi County. Available online: http://www.nxyctjj.gov.cn/news_view.asp?newsid=686&aid=221 (accessed on 29 July 2016). (In Chinese)
- Ma, M.D. Analysis of Ecological Security of Sandy Area in Eastern Ningxia: A Case of Yanchi County of Ningxia Hui Autonomous Region in China. Ph.D Thesis, Ningxia University, Ningxia, China, 2014. [Google Scholar]
- Chai, H.F.; Li, Q.X.; Fu, R.; Zuo, T. The evolution and imply of prohibiting grazing policy deadlock: Based on the observation of Yanchi rural. Agric. Econ. 2009, 1, 93–98. (In Chinese) [Google Scholar]
- Ma, M.D.; Bu, X.T. Analysis on coupling relation between agricultural economy and agro-ecosystem in Yanchi County of Ningxia. Guangdong Agric. Sci. 2014, 24, 156–160. (In Chinese) [Google Scholar]
- Liu, N.; Zhou, L.; Hauger, J.S. How sustainable is government-sponsored desertification rehabilitation in China? Behavior of households to changes in environmental policies. PLoS ONE 2013, 8, e77510. [Google Scholar] [CrossRef] [PubMed]
- Ma, B.; Zhou, L.; Lu, H.; Chen, Y.; Jia, Y.; Wei, X. Quantitative analysis of ecological compensation for prohibiting grazing policy based on contingent valuation method. J. Desert Res. 2015, 35, 800–807. (In Chinese) [Google Scholar]
- Lu, H.; Zhou, L.; Chen, Y.; Huang, S.; Ma, B.; Wei, X. Sustainability of grazing forbidden policy in Yanchi, Ningxia, China: A perspective of peasant households. J. Desert Res. 2015, 35, 1065–1071. (In Chinese) [Google Scholar]
- Wang, T.; Chen, G.; Zhao, H.; Dong, Z.; Zhang, X.; Zheng, X.; Wang, N. Research progress on aeolian desertification process and controlling in north of China. J. Desert Res. 2006, 26, 507–516. (In Chinese) [Google Scholar]


| Target Layer | System Layer | Index Layer | Assessment Standard | |||
|---|---|---|---|---|---|---|
| First Standard | Second Standard | Third Standard | Fourth Standard | |||
| Sustainable SES development | Social system | S1 Urbanization rate (%) + | <26 | 26–60 | 60–80 | >80 |
| S2 Net income per capita (¥·person−1) + | <2478 | 2478–8000 | 8000–10,000 | >10,000 | ||
| S3 Urban residents disposable income (¥·person−1) + | <4900 | 4900–25,000 | 25,000–30,000 | >30,000 | ||
| S4 Urban residents per capita housing floor space now (m2·person−1) + | <13 | 13–25 | 25–30 | >30 | ||
| S5 Medical beds one in 1000 (bed) + | <2 | 2–10 | 10–20 | >20 | ||
| S6 Registered unemployment rate in town (%) − | >8 | 4.6–8 | 2–4.6 | <2 | ||
| Economic system | G1 Per capita GDP (¥·person−1) + | <7592 | 7592–30,000 | 30,000–80,000 | >80,000 | |
| G2 Tertiary industries accounting for the proportion of GDP (%) + | <32 | 32–60 | 60–80 | >80 | ||
| G3 Urban units staff average wage (¥·person−1) + | <7780 | 7780–50,000 | 50,000–60,000 | >60,000 | ||
| G4 Engel’s coefficient of rural family (%) − | >43 | 40–43 | 30–40 | <30 | ||
| G5 Engel’s coefficient of urban family (%) − | >43 | 40–43 | 30–40 | <30 | ||
| G6 Energy consumption per 10,000 ¥ GDP (tce) − | >2 | 0.6–2 | 0.4–0.6 | <0.4 | ||
| Ecological system | E1 Water resources per capita (%) + | <31 | 31–1700 | 1700–3000 | 3000 | |
| E2 Vegetation coverage rate (%) + | <10 | 10–35 | 35–60 | >60 | ||
| E3 Climate Evaporation Index (%) − | >4 | 1.5–4 | 1–1.5 | <1 | ||
| E4 Desertification land proportion (%) − | >40 | 25–40 | 10–25 | <10 | ||
| E5 Per capita ecological footprint (gha·person−1) − | >4 | 2.6–4 | 1.5–2.6 | <1.5 | ||
| E6 Comprehensive utilization rate of industrial solid waste (%) + | <40 | 40–60 | 60–80 | >80 | ||
| Assessment Standard | a | b | c | d |
|---|---|---|---|---|
| First standard | N1/N | N2/N | N3/N | N4/N |
| Second standard | N2/N | (N1+N3)/N | N4/N | 0 |
| Third standard | N3/N | (N2+N4)/N | N1/N | 0 |
| Fourth standard | N4/N | N3/N | N2/N | N1/N |
| Set Pair Potential | Situation Level | Rank | Size and Relationship of a, b, c, d | Situation Value |
|---|---|---|---|---|
| Identical Potential (IP, 1–19) | Quasi-Identical Potential (QIP, 1–2) | 1 | a > d, a > b, b > c, c > d | 1.0 |
| 2 | a > d, a > b, b > c, c = d | |||
| Strong Identical Potential (SIP, 3–9) | 3 | a > d, a > b, b > c, c < d | 0.9 | |
| 4 | a > d, a > b, b = c, c > d | |||
| 5 | a > d, a > b, b = c, c = d | |||
| 6 | a > d, a > b, b = c, c < d | |||
| 7 | a > d, a > b, b < c, c > d | |||
| 8 | a > d, a > b, b < c, c = d | |||
| 9 | a > d, a > b, b < c, c < d | |||
| Weak Identical Potential (WIP, 10–14) | 10 | a > d, a = b, b > c, c > d | 0.8 | |
| 11 | a > d, a = b, b > c, c = d | |||
| 12 | a > d, a = b, b > c, c < d | |||
| 13 | a > d, a = b, b = c, c > d | |||
| 14 | a > d, a = b, b < c, c > d | |||
| Micro Identical Potential (MIP, 15–19) | 15 | a > d, a < b, b > c, c > d | 0.7 | |
| 16 | a > d, a < b, b > c, c = d | |||
| 17 | a > d, a < b, b > c, c < d | |||
| 18 | a > d, a < b, b = c, c > d | |||
| 19 | a > d, a < b, b < c, c > d | |||
| Equalization Potential (EP, 20–30) | Strong Equalization Potential (SEP, 20–22) | 20 | a = d, a > b, b = c, c > d | 0.6 |
| 21 | a = d, a > b, b < c, c = d | |||
| 22 | a = d, a > b, b < c, c < d | |||
| Weak Equalization Potential (WEP, 23–26) | 23 | a = d, a = b, b > c, c < d | 0.5 | |
| 24 | a = d, a = b, b = c, c = d | |||
| 25 | a = d, a = b, b < c, c > d | |||
| 26 | a = d, a < b, b > c, c > d | |||
| Micro Equalization Potential (MEP, 27–30) | 27 | a = d, a < b, b > c, c = d | 0.4 | |
| 28 | a = d, a < b, b > c, c < d | |||
| 29 | a = d, a < b, b = c, c > d | |||
| 30 | a = d, a < b, b < c, c > d | |||
| Contrary Potential (CP, 31–49) | Micro Contrary Potential (MCP, 31–34) | 31 | a < d, a > b, b > c, c < d | 0.3 |
| 32 | a < d, a > b, b = c, c < d | |||
| 33 | a < d, a > b, b < c, c > d | |||
| 34 | a < d, a > b, b < c, c < d | |||
| Weak Contrary Potential (WCP, 35–40) | 35 | a < d, a = b, b > c, c > d | 0.2 | |
| 36 | a < d, a = b, b = c, c > d | |||
| 37 | a < d, a = b, b = c, c < d | |||
| 38 | a < d, a = b, b < c, c > d | |||
| 39 | a < d, a = b, b < c, c = d | |||
| 40 | a < d, a = b, b < c, c < d | |||
| Strong Contrary Potential (SCP, 41–49) | 41 | a < d, a < b, b > c, c > d | 0.1 | |
| 42 | a < d, a < b, b > c, c = d | |||
| 43 | a < d, a < b, b > c, c < d | |||
| 44 | a < d, a < b, b = c, c > d | |||
| 45 | a < d, a < b, b = c, c = d | |||
| 46 | a < d, a < b, b = c, c < d | |||
| 47 | a < d, a < b, b < c, c > d | |||
| 48 | a < d, a < b, b < c, c = d | |||
| 49 | a < d, a < b, b > c, c < d |
| Year | Social System | Economic System | Ecological System | ||||||||||||
|---|---|---|---|---|---|---|---|---|---|---|---|---|---|---|---|
| μAi-B1 | μAi-B2 | μAi-B3 | μAi-B4 | Grade | μAi-B1 | μAi-B2 | μAi-B3 | μAi-B4 | Grade | μAi-B1 | μAi-B2 | μAi-B3 | μAi-B4 | Grade | |
| 2003 | 0.22 | 0.44 | 0.22 | −0.22 | Second | 0.33 | 0.47 | 0.07 | −0.33 | Second | 0.33 | 0.47 | 0.07 | −0.33 | Second |
| 2004 | 0.11 | 0.56 | 0.33 | −0.11 | Second | 0.47 | 0.60 | 0.20 | −0.22 | Second | −0.07 | 0.33 | 0.47 | 0.07 | Third |
| 2005 | 0.22 | 0.67 | 0.44 | −0.22 | Second | 0.47 | 0.60 | 0.20 | −0.47 | Second | −0.07 | 0.33 | 0.47 | 0.07 | Third |
| 2006 | 0.33 | 0.56 | 0.33 | −0.33 | Second | 0.47 | 0.60 | 0.20 | −0.47 | Second | 0.47 | 0.33 | 0.73 | 0.07 | Third |
| 2007 | 0.22 | 0.67 | 0.44 | −0.22 | Second | 0.22 | 0.89 | 0.44 | −0.22 | Second | 0.11 | 0.33 | 0.33 | −0.11 | Second/Third |
| 2008 | 0.22 | 0.67 | 0.44 | −0.22 | Second | 0.33 | 0.78 | 0.33 | −0.33 | Second | 0.22 | 0.44 | 0.22 | −0.22 | Second |
| 2009 | 0.11 | 0.78 | 0.56 | −0.11 | Second | 0.33 | 0.78 | 0.33 | −0.33 | Second | 0.11 | 0.33 | 0.11 | −0.11 | Second |
| 2010 | 0.11 | 0.78 | 0.56 | −0.11 | Second | 0.33 | 0.78 | 0.33 | −0.33 | Second | 0.11 | 0.11 | 0.11 | −0.11 | First/Second/Third |
| 2011 | 0.11 | 0.78 | 0.56 | −0.11 | Second | 0.44 | 0.67 | 0.22 | −0.44 | Second | −0.11 | 0.33 | 0.33 | 0.11 | Second/Third |
| 2012 | 0.11 | 0.78 | 0.56 | −0.11 | Second | 0.39 | 0.67 | 0.22 | −0.44 | Second | 0.11 | 0.33 | 0.11 | −0.11 | Second |
| 2013 | 0.00 | 0.67 | 0.44 | 0.00 | Second | 0.22 | 0.67 | 0.22 | 0.33 | Second | −0.11 | 0.11 | 0.11 | 0.44 | Fourth |
| 2014 | 0.00 | 0.67 | 0.44 | 0.00 | Second | 0.00 | 0.44 | 0.44 | 0.00 | Second/Third | −0.07 | 0.33 | 0.20 | 0.07 | Second |
| Year | H(Ai, B1) | H(Ai, B2) | H(Ai, B3) | H(Ai, B4) | ||||||||||||||||||||
|---|---|---|---|---|---|---|---|---|---|---|---|---|---|---|---|---|---|---|---|---|---|---|---|---|
| Social System (ds) | Economic System (dg) | Ecological System (K) | Social System (ds) | Economic System (dg) | Ecological System (K) | Social System (ds) | Economic System (dg) | Ecological System (K) | Social System (ds) | Economic System (dg) | Ecological System (K) | |||||||||||||
| Rank | Level | Rank | Level | Rank | Level | Rank | Level | Rank | Level | Rank | Level | Rank | Level | Rank | Level | Rank | Level | Rank | Level | Rank | Level | Rank | Level | |
| 2003 | 11 | WIP | 12 | WIP | 12 | WIP | 15 | MIP | 10 | WIP | 10 | WIP | 15 | MIP | 26 | WEP | 26 | WEP | 39 | WCP | 33 | MCP | 33 | MCP |
| 2004 | 27 | MEP | 12 | WIP | 25 | WEP | 1 | QIP | 15 | MIP | 15 | MIP | 15 | MIP | 18 | MIP | 10 | WIP | 25 | WEP | 44 | SCP | 27 | MEP |
| 2005 | 15 | MIP | 12 | WIP | 25 | WEP | 11 | WIP | 15 | MIP | 15 | MIP | 15 | MIP | 18 | MIP | 10 | WIP | 47 | SCP | 48 | SCP | 27 | MEP |
| 2006 | 13 | WIP | 12 | WIP | 27 | MEP | 16 | MIP | 15 | MIP | 27 | MEP | 13 | WIP | 18 | MIP | 30 | MEP | 45 | SCP | 48 | SCO | 43 | SCP |
| 2007 | 15 | MIP | 26 | WEP | 7 | SIP | 11 | WIP | 1 | QIP | 15 | MIP | 15 | MIP | 16 | MIP | 10 | WIP | 47 | SCP | 30 | MEP | 43 | SCP |
| 2008 | 15 | MIP | 15 | MIP | 11 | WIP | 11 | WIP | 1 | QIP | 15 | MIP | 15 | MIP | 15 | MIP | 15 | MIP | 47 | SCP | 41 | SCP | 39 | WCP |
| 2009 | 26 | MEP | 15 | MIP | 23 | WEP | 2 | QIP | 1 | QIP | 13 | WIP | 16 | MIP | 15 | MIP | 26 | WEP | 30 | MEP | 41 | SCP | 21 | SEP |
| 2010 | 26 | MEP | 15 | MIP | 9 | SIP | 2 | QIP | 1 | QIP | 26 | WEP | 16 | MIP | 15 | MIP | 15 | MIP | 30 | MEP | 41 | SCP | 31 | MCP |
| 2011 | 26 | MEP | 15 | MIP | 41 | SCP | 2 | QIP | 11 | WIP | 13 | WIP | 16 | MIP | 41 | SCP | 15 | MIP | 30 | MEP | 47 | SCP | 7 | SIP |
| 2012 | 26 | MEP | 15 | MIP | 23 | WEP | 2 | QIP | 11 | WIP | 13 | WIP | 16 | MIP | 41 | SCP | 26 | WEP | 30 | MEP | 47 | SCP | 21 | SEP |
| 2013 | 42 | SCP | 28 | MEP | 31 | MCP | 4 | SIP | 4 | SIP | 19 | MIP | 16 | MIP | 26 | WEP | 26 | WEP | 14 | WIP | 15 | MIP | 7 | SIP |
| 2014 | 42 | SCP | 28 | MEP | 41 | SCP | 4 | SIP | 4 | SIP | 7 | SIP | 16 | MIP | 15 | MIP | 26 | WEP | 14 | WIP | 29 | MEP | 7 | SIP |
© 2016 by the authors; licensee MDPI, Basel, Switzerland. This article is an open access article distributed under the terms and conditions of the Creative Commons Attribution (CC-BY) license (http://creativecommons.org/licenses/by/4.0/).
Share and Cite
Wang, Y.; Zhou, L. Assessment of the Coordination Ability of Sustainable Social-Ecological Systems Development Based on a Set Pair Analysis: A Case Study in Yanchi County, China. Sustainability 2016, 8, 733. https://doi.org/10.3390/su8080733
Wang Y, Zhou L. Assessment of the Coordination Ability of Sustainable Social-Ecological Systems Development Based on a Set Pair Analysis: A Case Study in Yanchi County, China. Sustainability. 2016; 8(8):733. https://doi.org/10.3390/su8080733
Chicago/Turabian StyleWang, Ya, and Lihua Zhou. 2016. "Assessment of the Coordination Ability of Sustainable Social-Ecological Systems Development Based on a Set Pair Analysis: A Case Study in Yanchi County, China" Sustainability 8, no. 8: 733. https://doi.org/10.3390/su8080733