
Promotion Potentiality and Optimal Strategies Analysis of Provincial Energy Efficiency in China

Abstract
:1. Introduction
2. Literature Review
- (1)
- Measuring methods of energy efficiency. Various methods are adopted to measure energy efficiency. Take China as a whole, a parallel slacks-based measure was used to examine the energy efficiency based on the data of the economic system [1]. The energy saving potentials for the whole system were defined and the institutional influential factors were also examined. From the perspective of industrial structure, they concluded that the inefficiency of the economic system in China is mainly sourced from the lower energy efficiency performance of the secondary industries. In order to explore the driving factor of energy efficiency, a non-parametric frontier model and a multilevel explanatory analysis were combined to test the energy efficiency in European countries [2]. The result showed that technological improvement was the main driver to industrial energy efficiency performance. From the relationship between economy, environment, and energy efficiency, some papers found that the uncertainty of CO2 emissions had significant impacts on regional efficiencies [3]. To address this issue, a radial stochastic DEA (Data Development Analysis) model was proposed based on the chance constrained programming. Then, the radial stochastic model was extended to a non-radial model for measuring pure energy use and CO2 emissions efficiencies. The proposed approach has been applied to evaluate regional efficiencies of energy use and CO2 emissions in China [4]. Meanwhile, the level of energy efficiency was sketched out and explained from an economic perspective via the theoretical framework [5]. The empirical methods for measuring were tested as well. Some of the empirical studies were summarized and discussed, which had attempted to measure energy efficiency using an economics approach. Additionally, a CGE (Computable General Equilibrium) model was also adopted to investigate the relationship between energy efficiency and economy-wide impacts in the economy-wide energy rebound effects [6]. The result found that with economy-wide energy efficiency improvement on the production side, economy-wide rebound was moderate. Energy efficiency improvements in particular sectors induced quite different economy-wide impacts. This CGE method offered valuable insights for policy-makers aiming to achieve energy conservation through increasing energy efficiency. Relative economic methods were also used to study the energy efficiency, such as shadow price [7].
- (2)
- Empirical studies for energy efficiency improvement. Different empirical studies were also widely discussed aiming to improve energy efficiency. In order to increase the promotion of the energy efficiency level from the energy supply side, the production and end-use energy efficiency was brought into the regional level sustainability targets [8]. They established a solid framework to gather the required data for energy efficiency analysis and its development evaluation. The small Finnish town of Lohja was introduced to show the possible actions linked to the regional energy targets. From the aspect of industrial structure modeling, the contribution of UK industry to the long-term energy policy targets was analyzed [9]. They found that the industry sector was essential for achieving the overall efficiency commitments and it made a moderate contribution to the expansion of renewable energies mostly through the use of biomass for low-temperature heating services. From the improvement strategies in specific industries, the energy efficiency and its influencing factors were analyzed based on the overall Chinese textile industry [10]. The results showed that the energy efficiency of Fujian’s chemical fiber industry had continued to improve yearly, and was currently above the national average in 2014. The low proportion of state-owned and state holding enterprises value, low proportion of coal consumption in the energy structure, industrial scale with a majority of medium-sized and large-sized enterprises, and advanced technology level were the main reasons for the success of energy efficiency promotion of Fujian’s chemical fiber industry. Similar analyses were also studied in the automotive industry, manufacturing industry, cement industry, etc. [11,12,13].
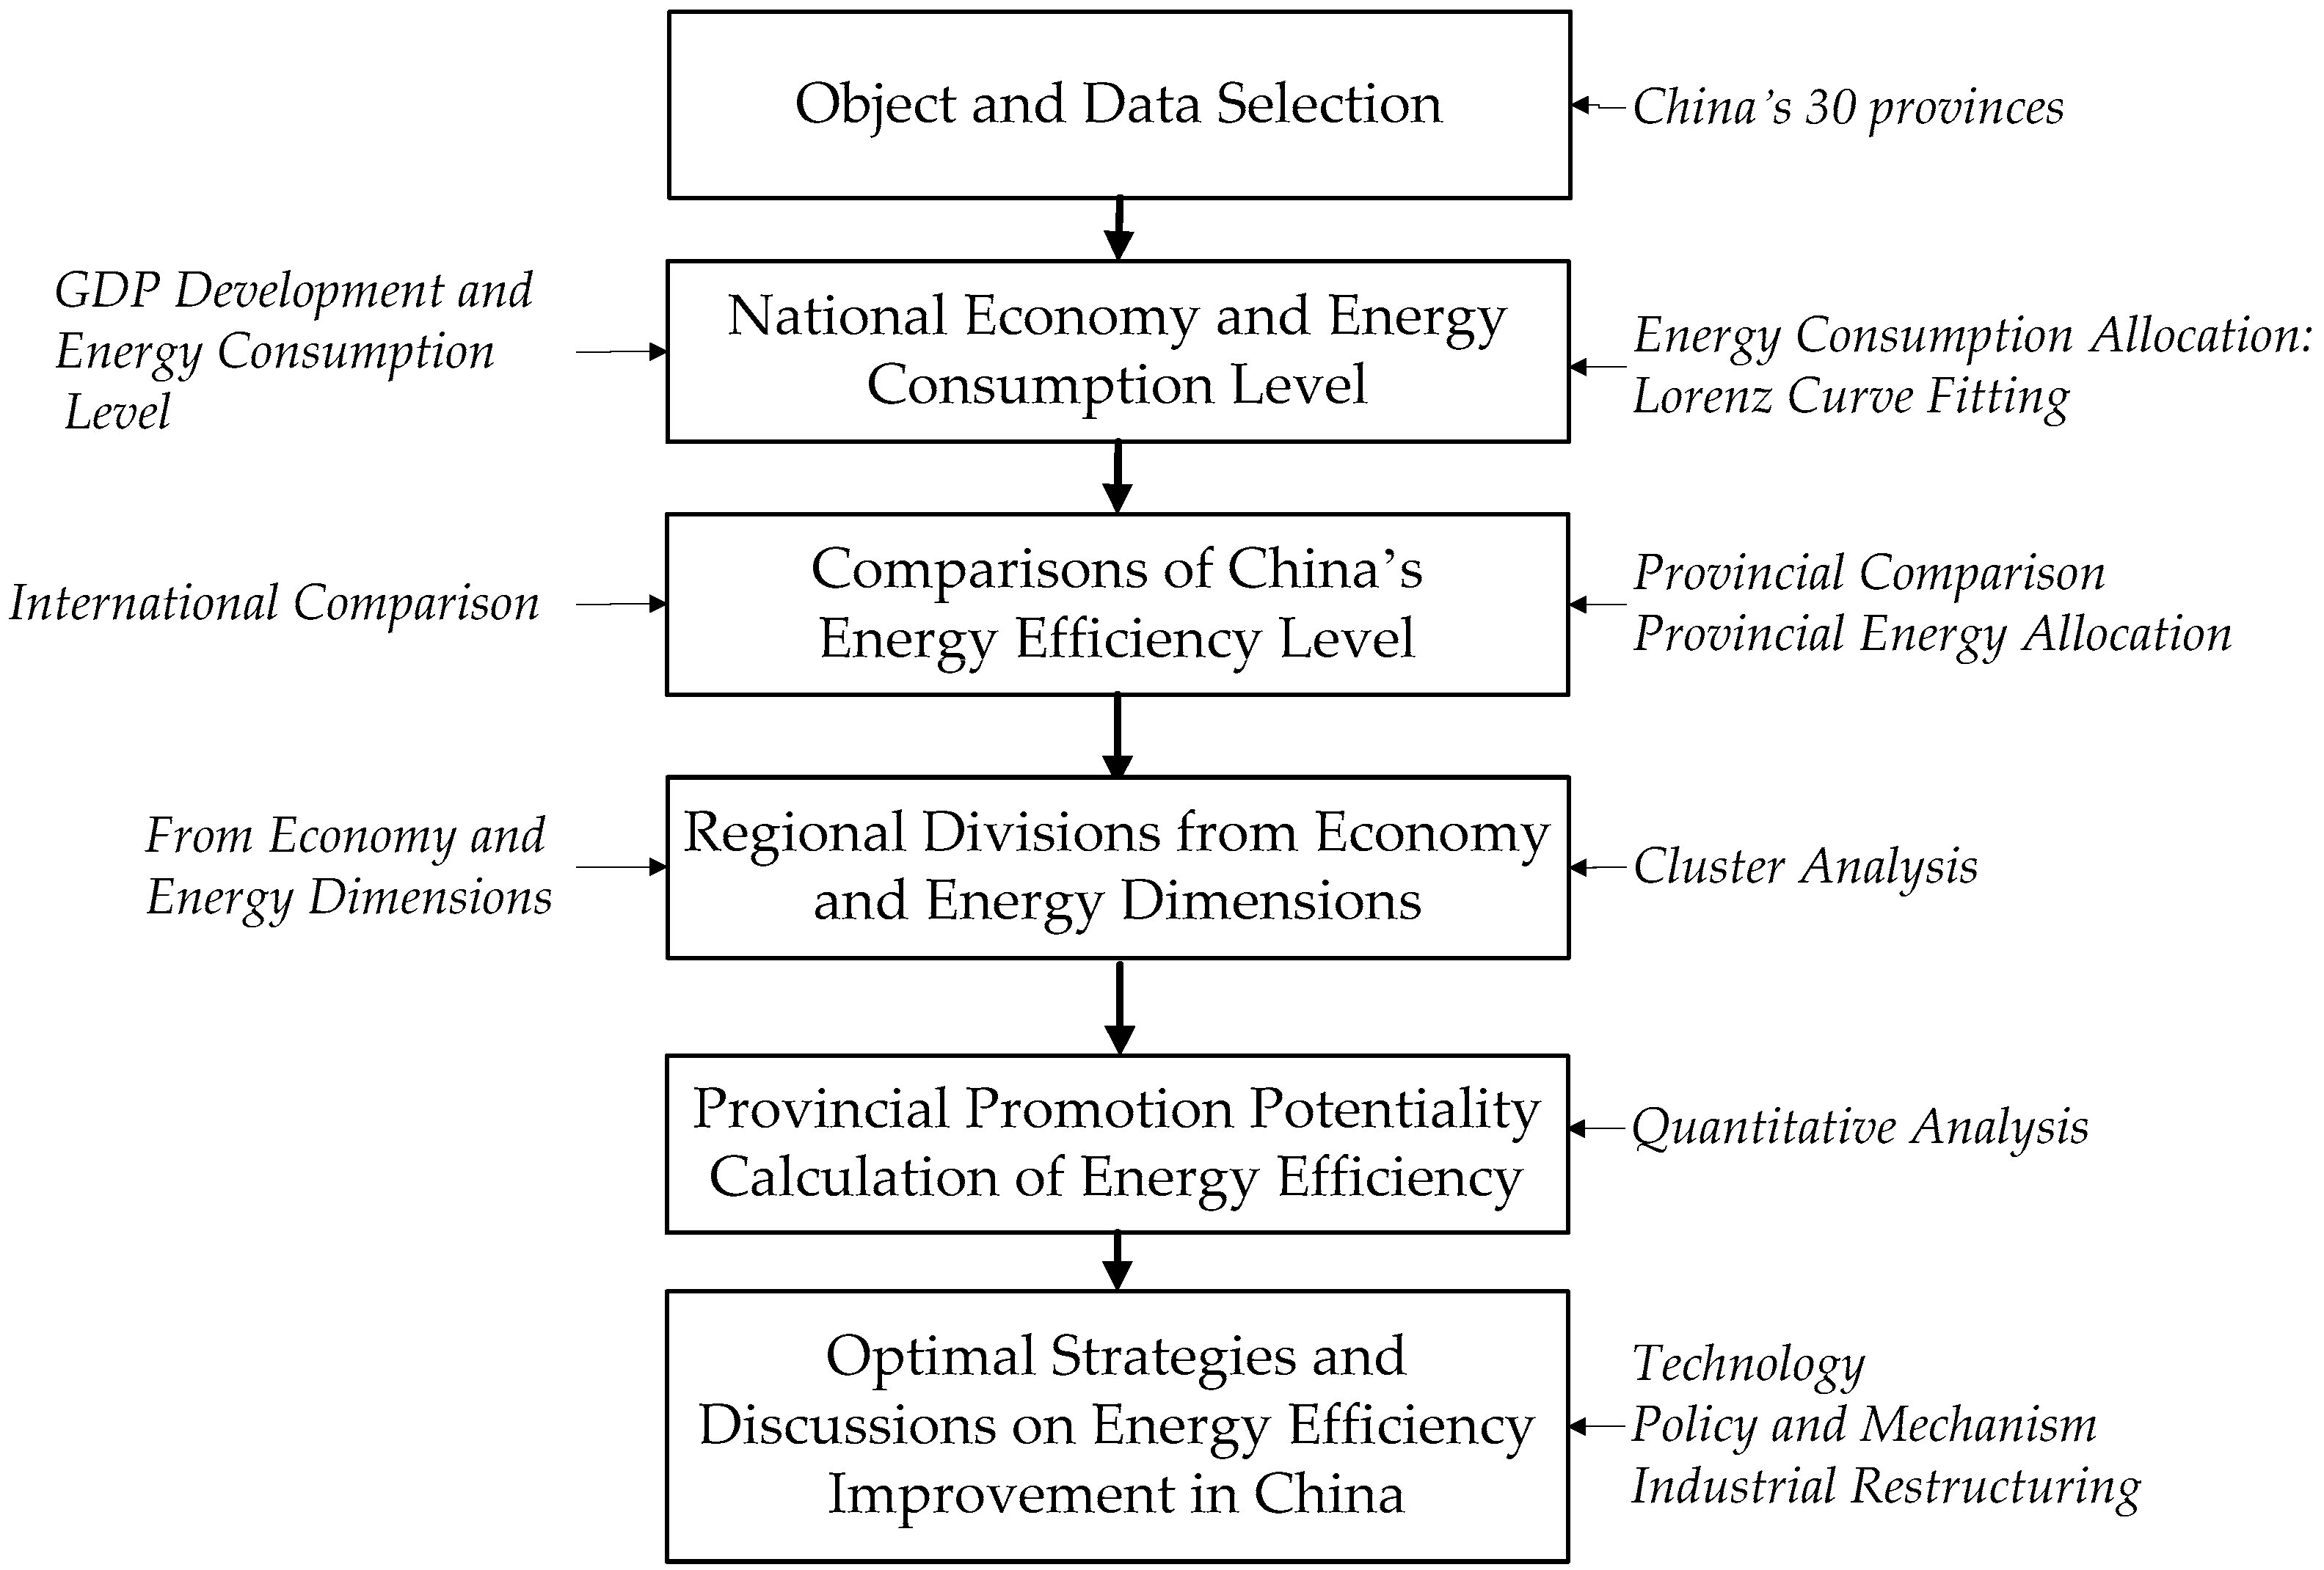
3. Methodology
4. Energy Efficiency Development Level Analysis
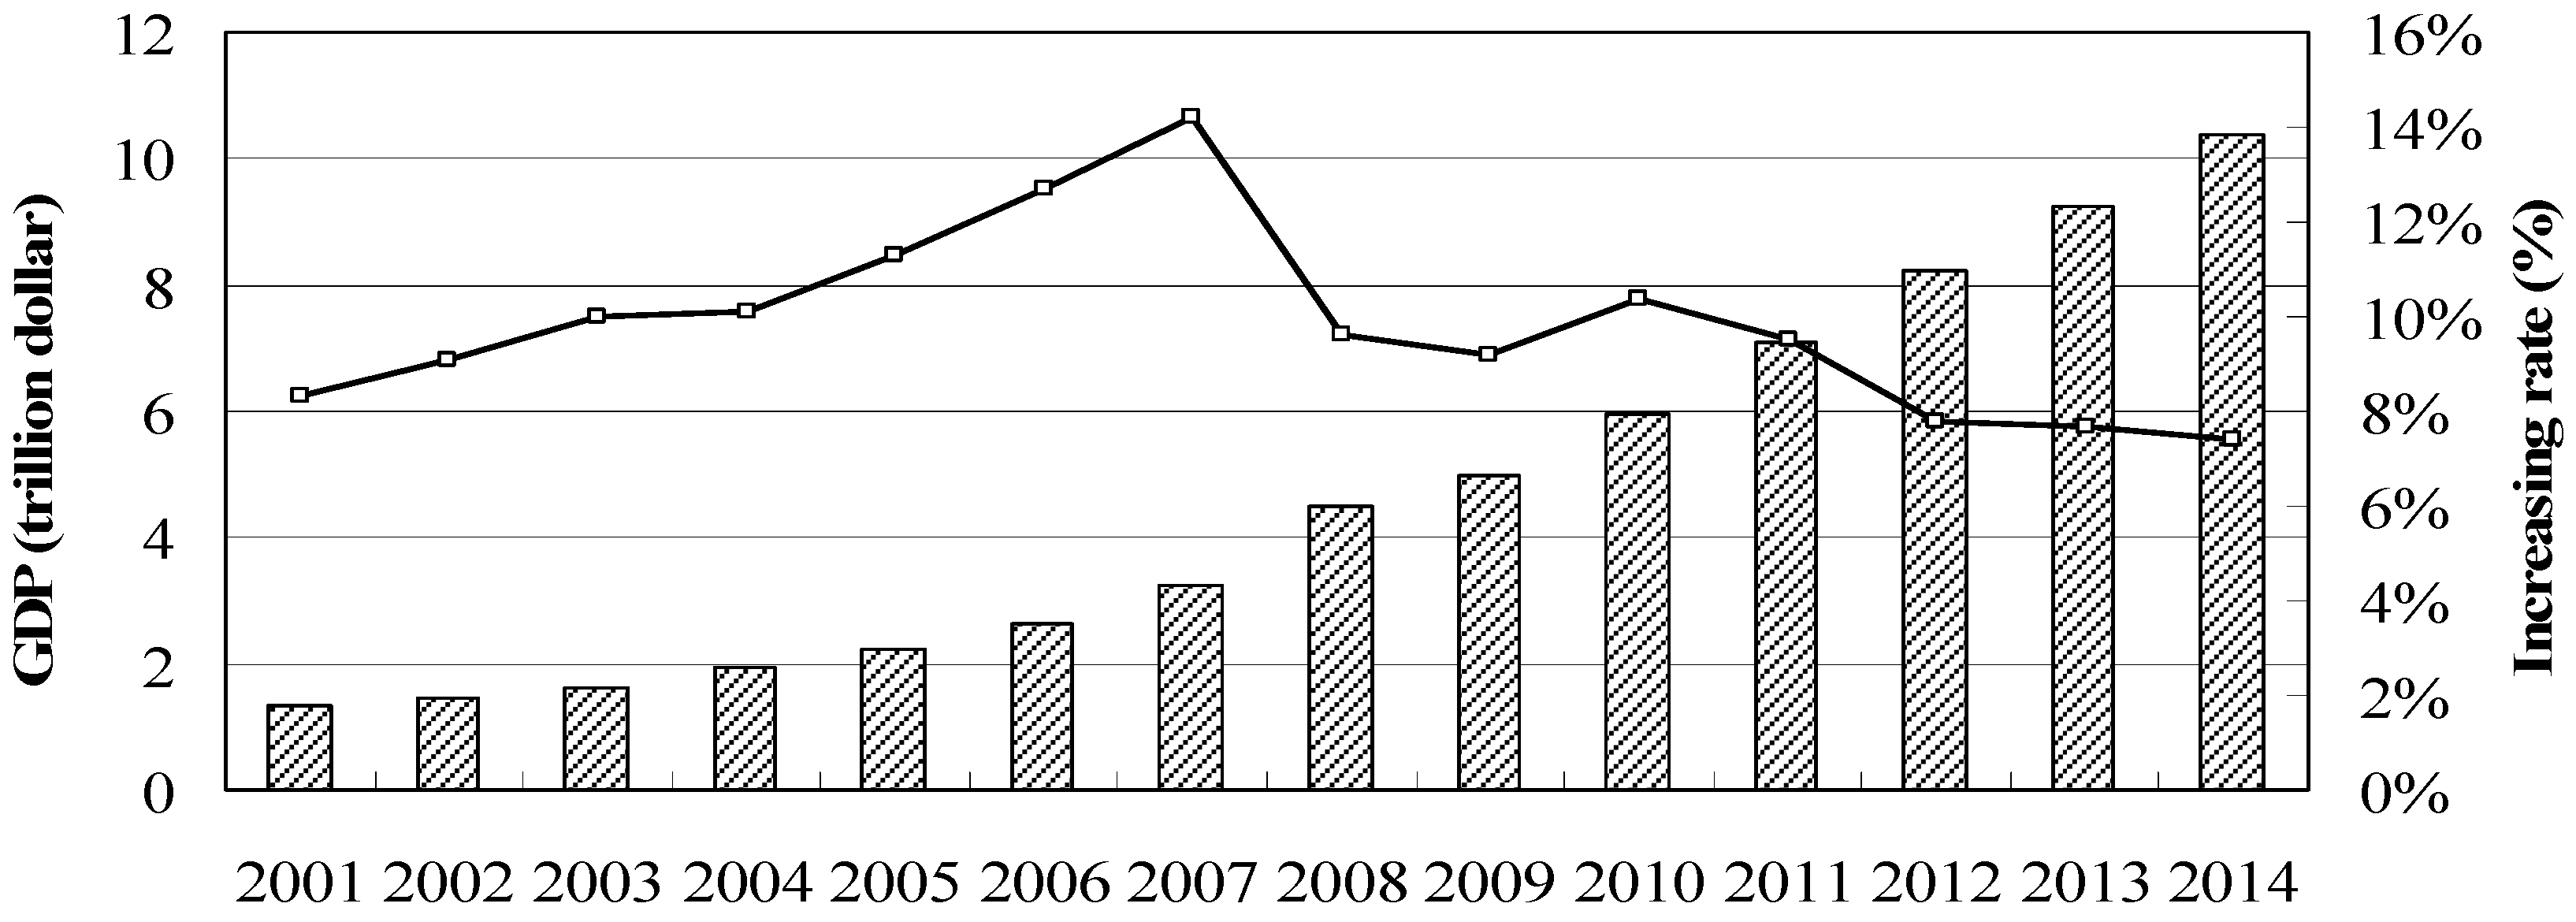
4.1. National Economic Development and Energy Consumption
- (1)
- Economic development level
- (2)
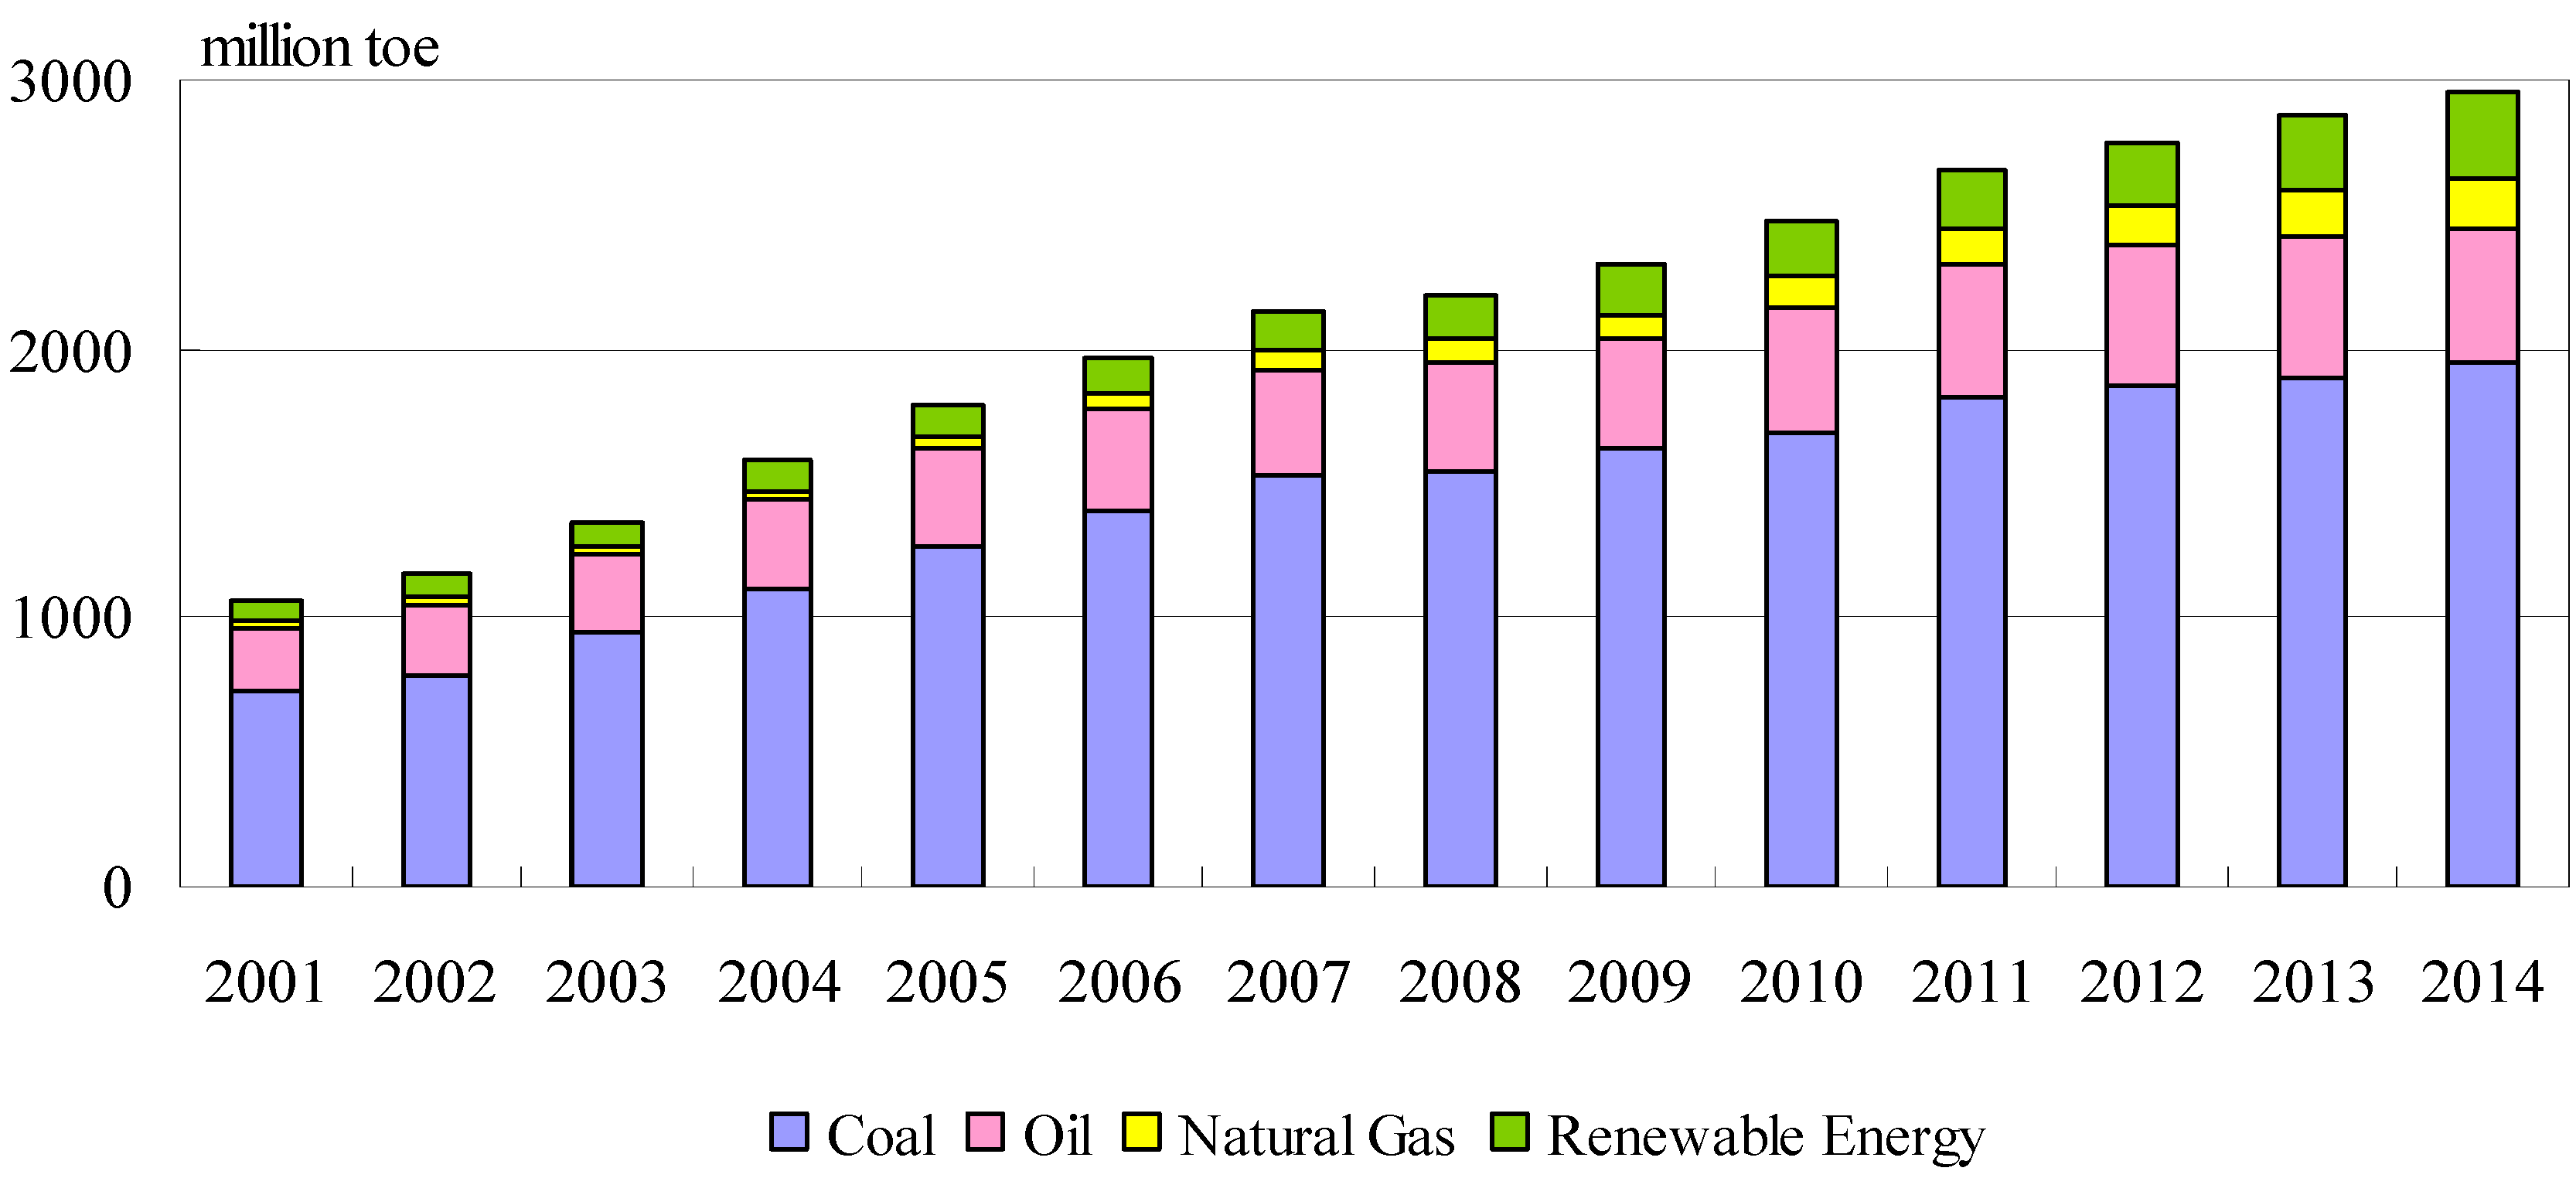
- Energy consumption level
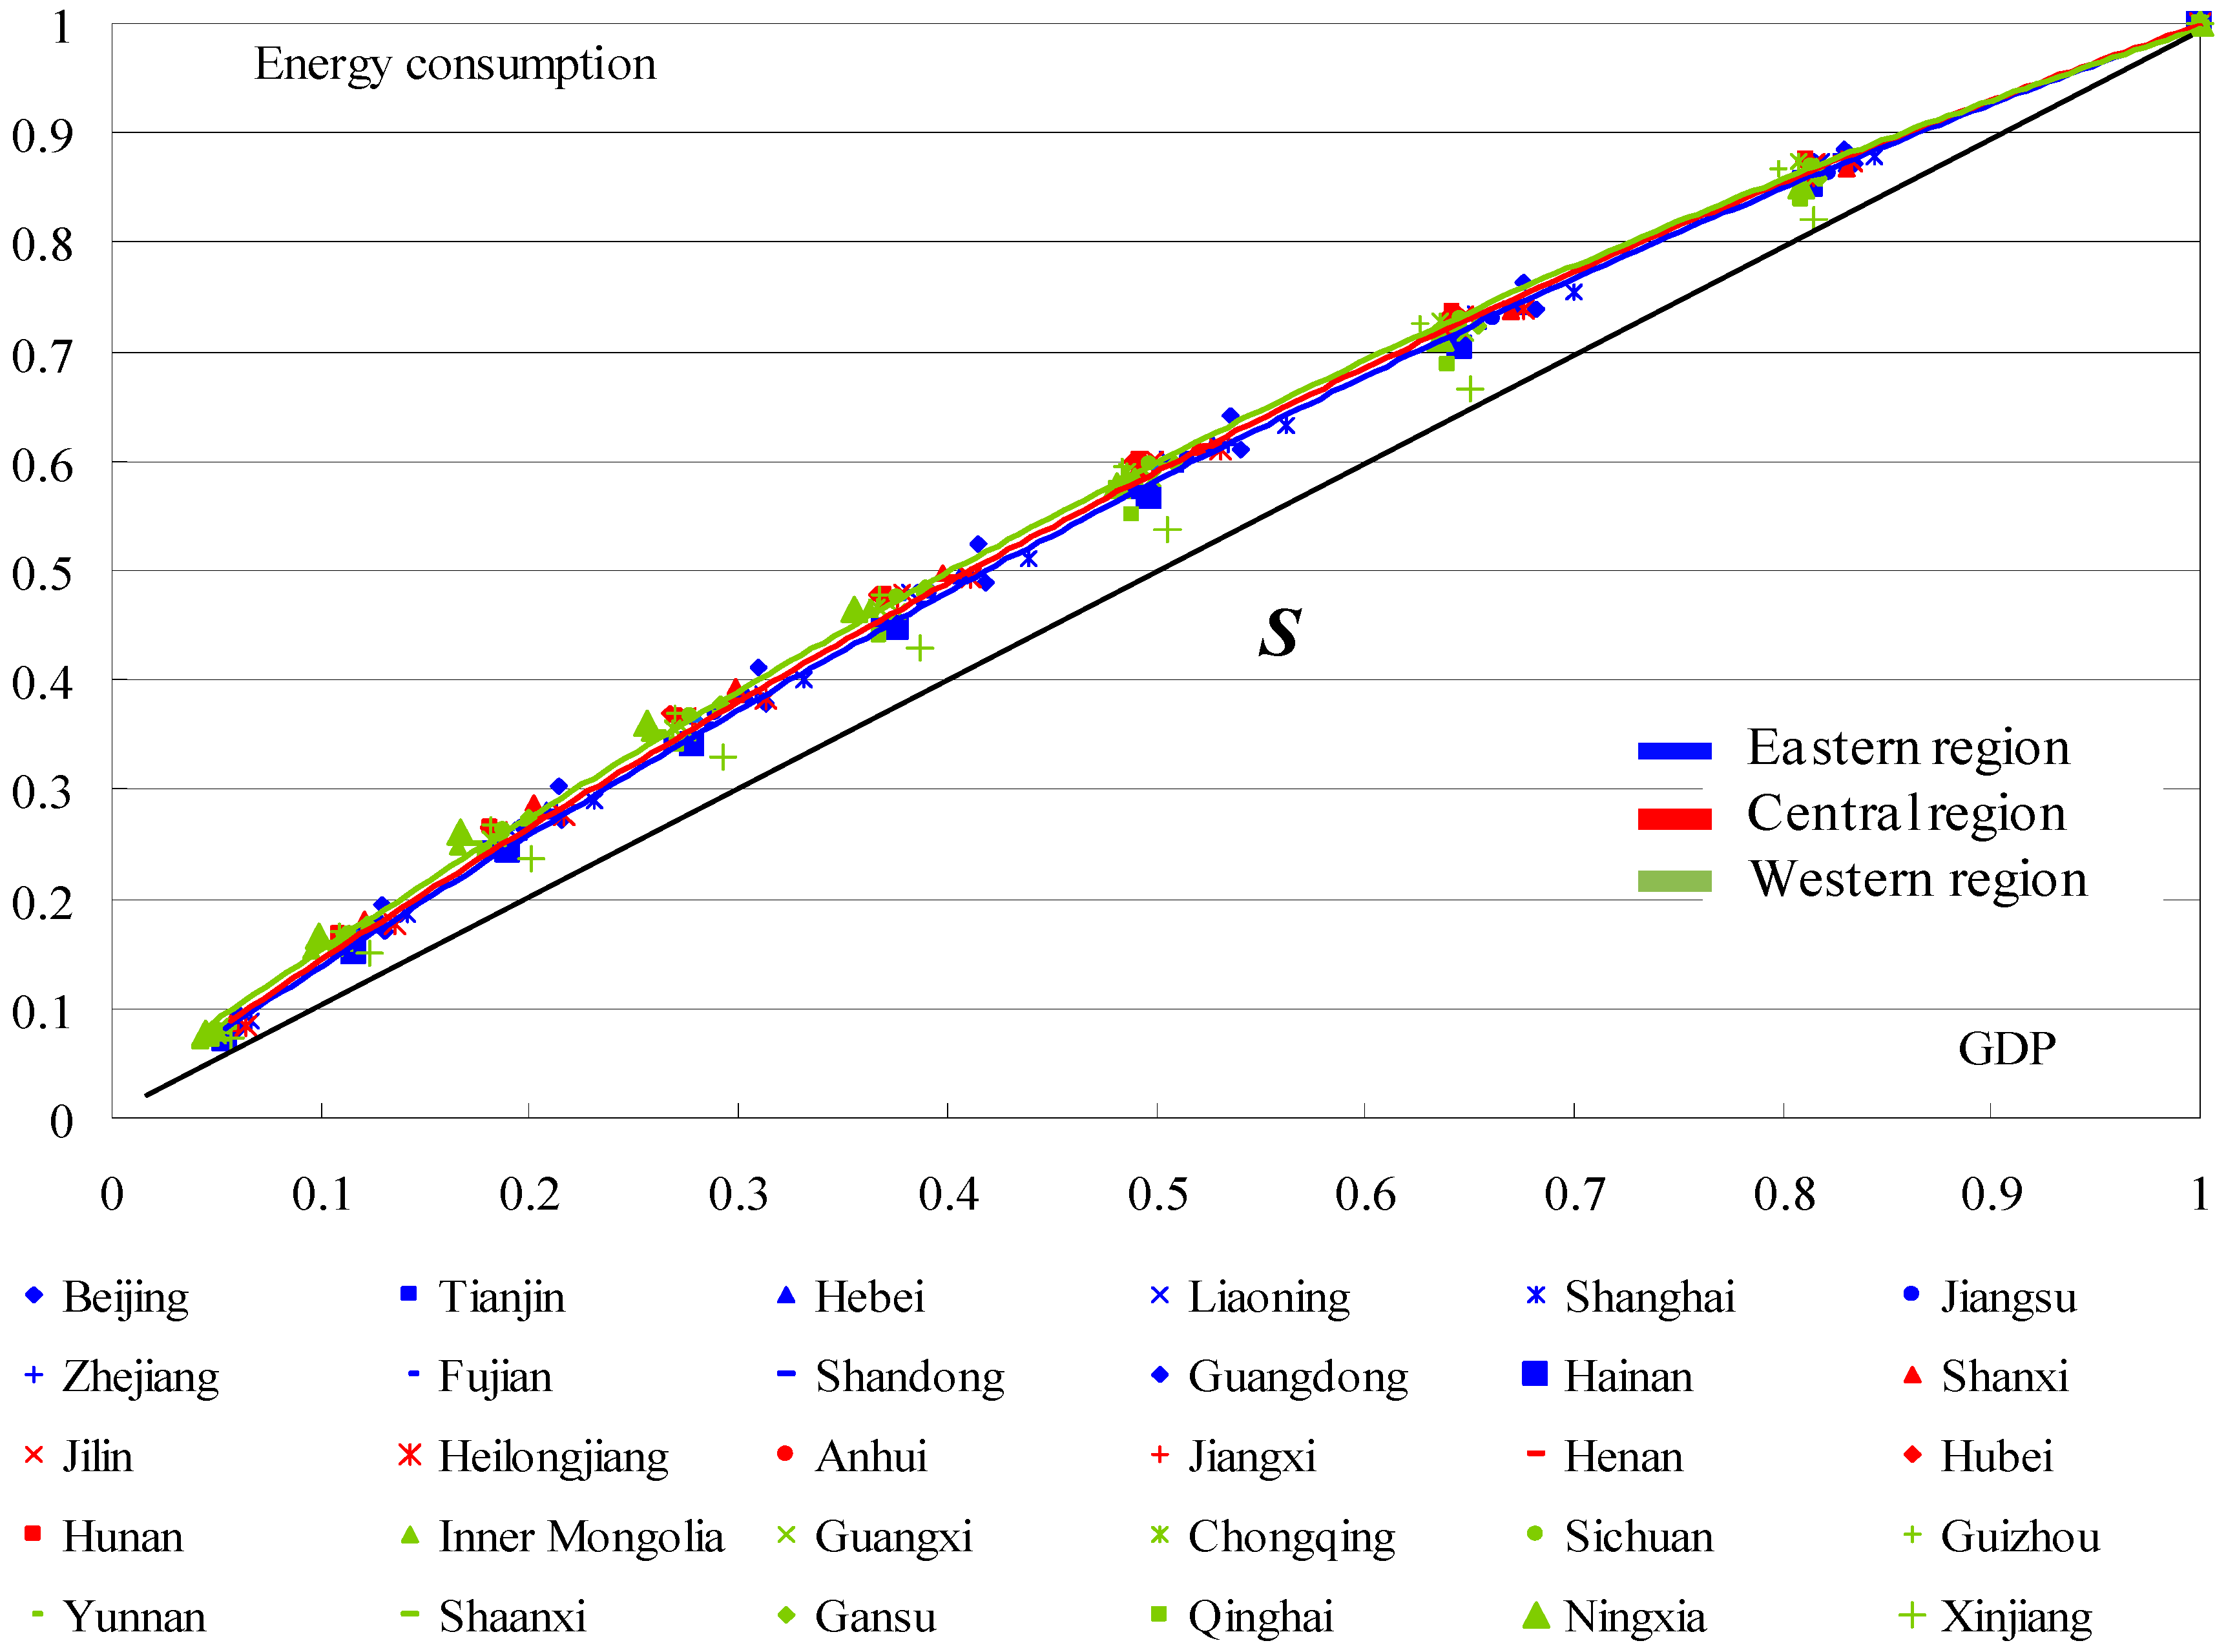
- (3)
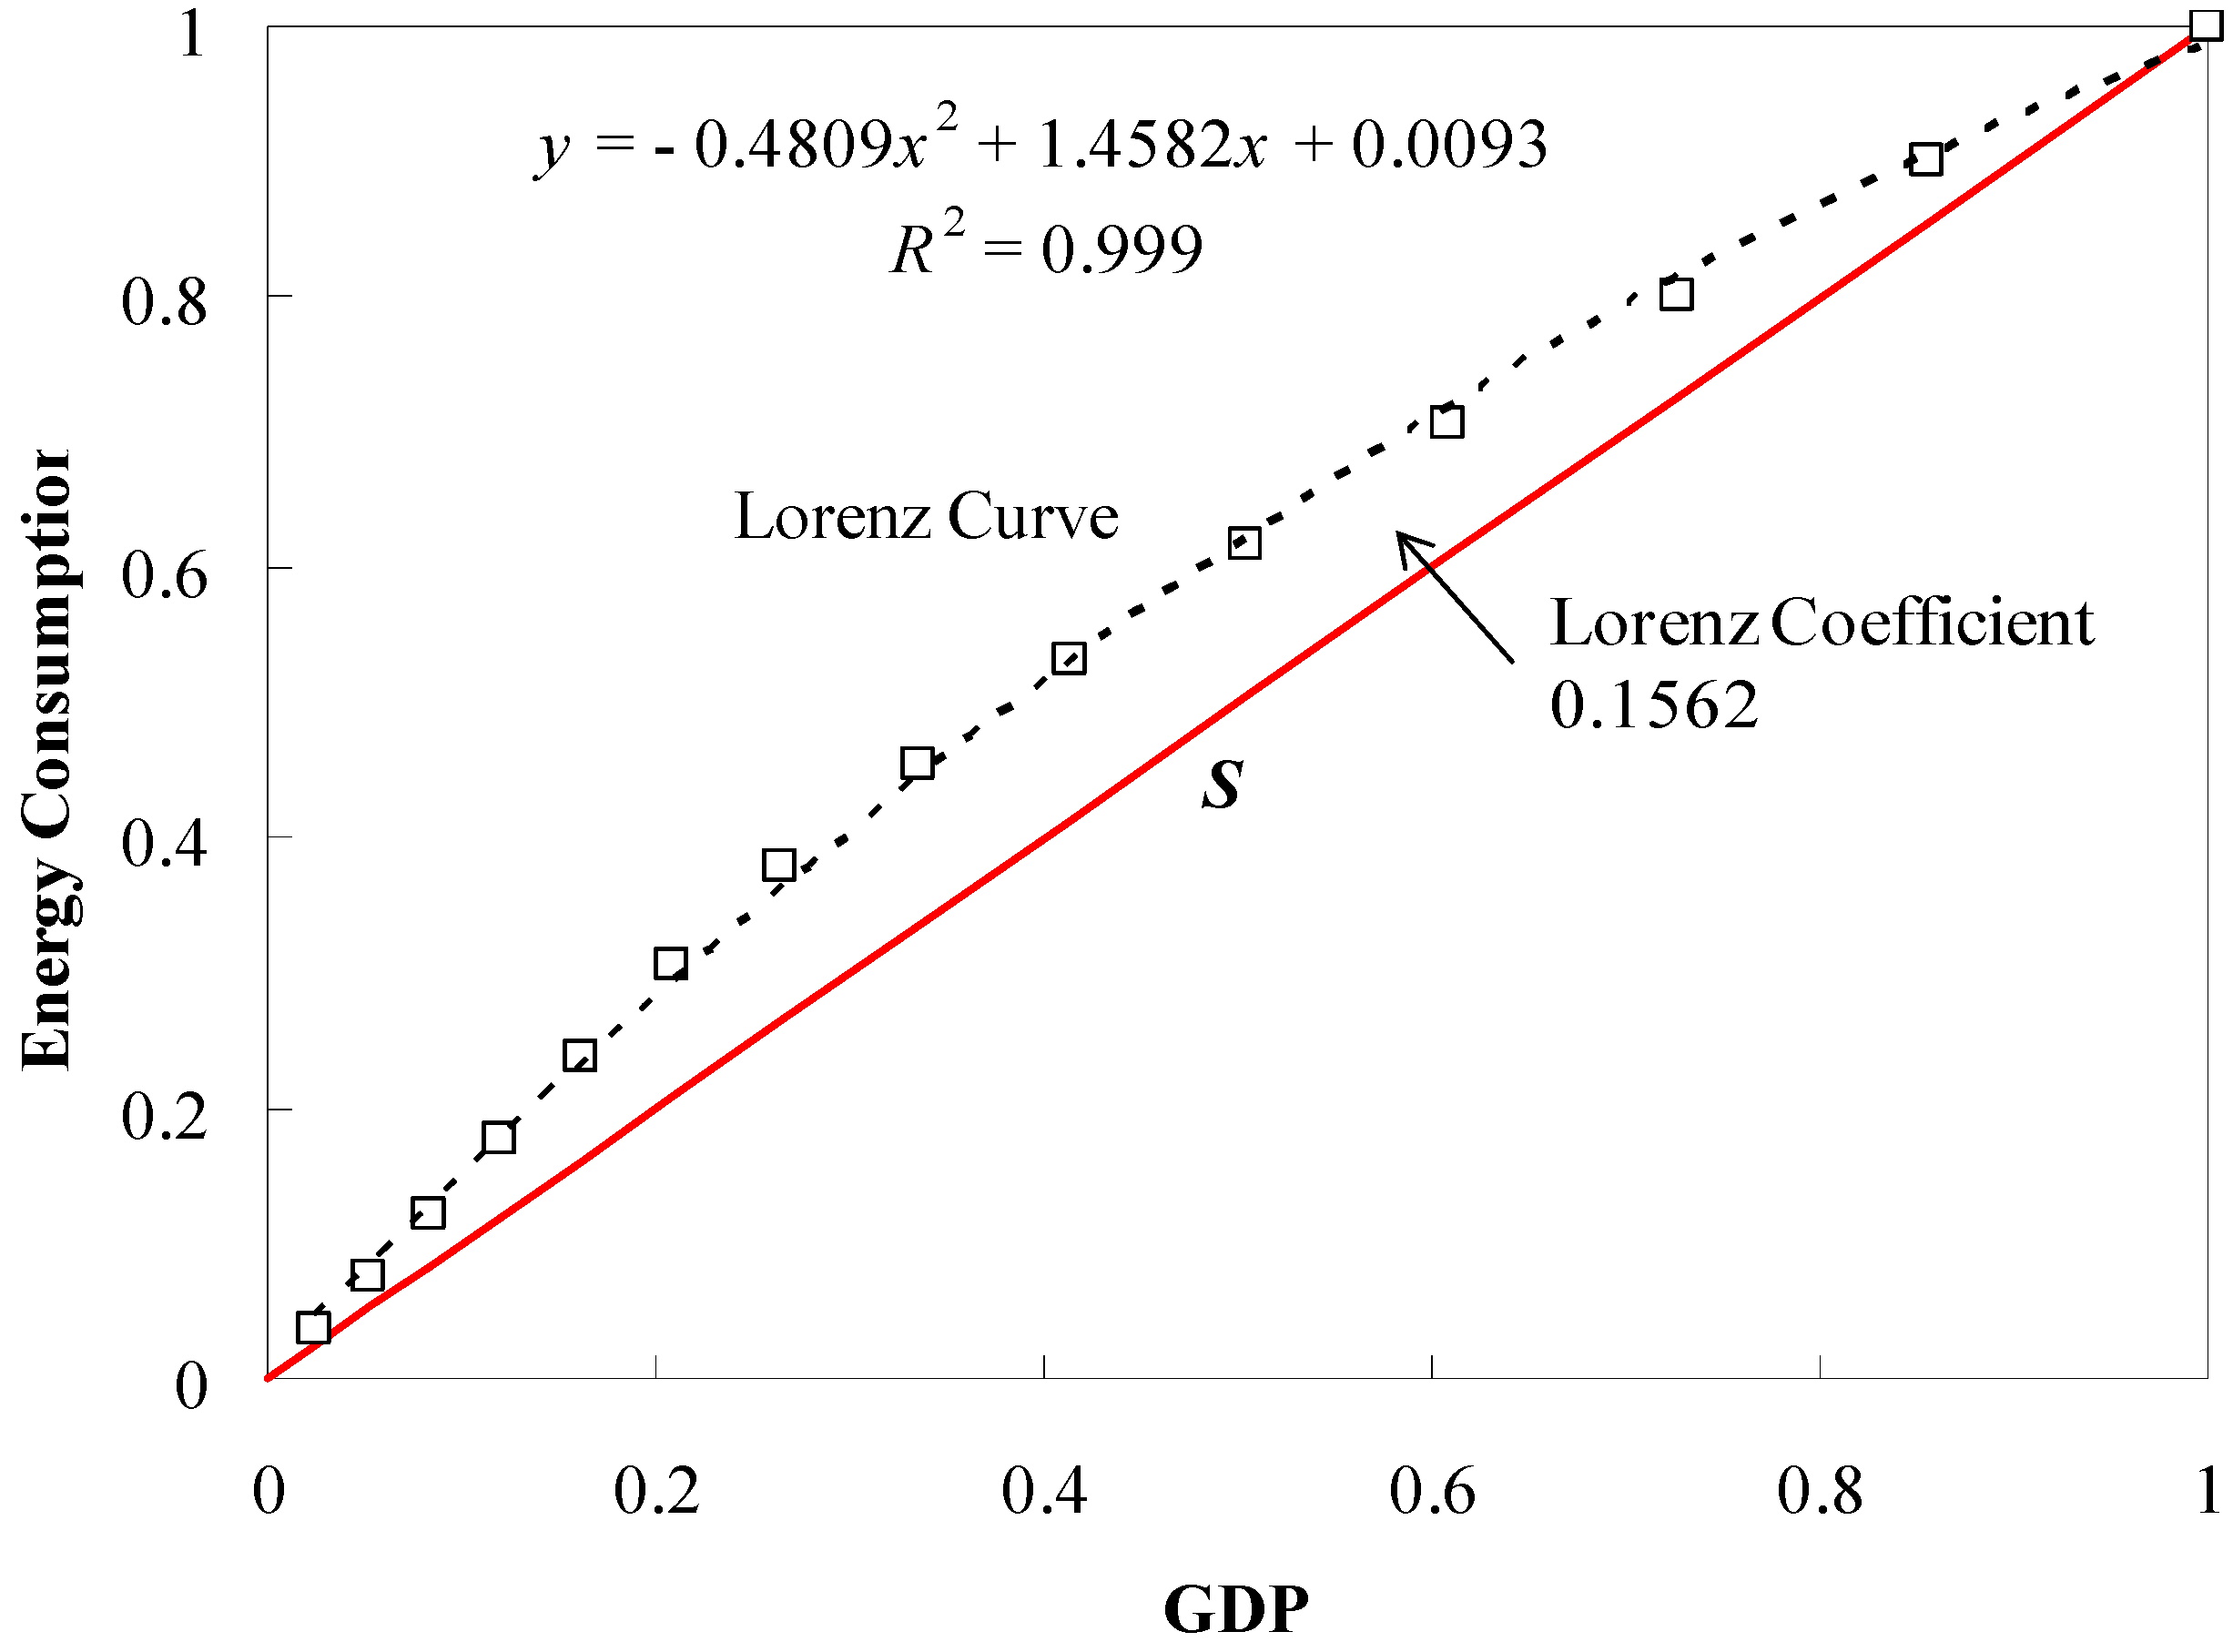
- Energy consumption and energy allocation level
4.2. Chinese Energy Efficiency Level
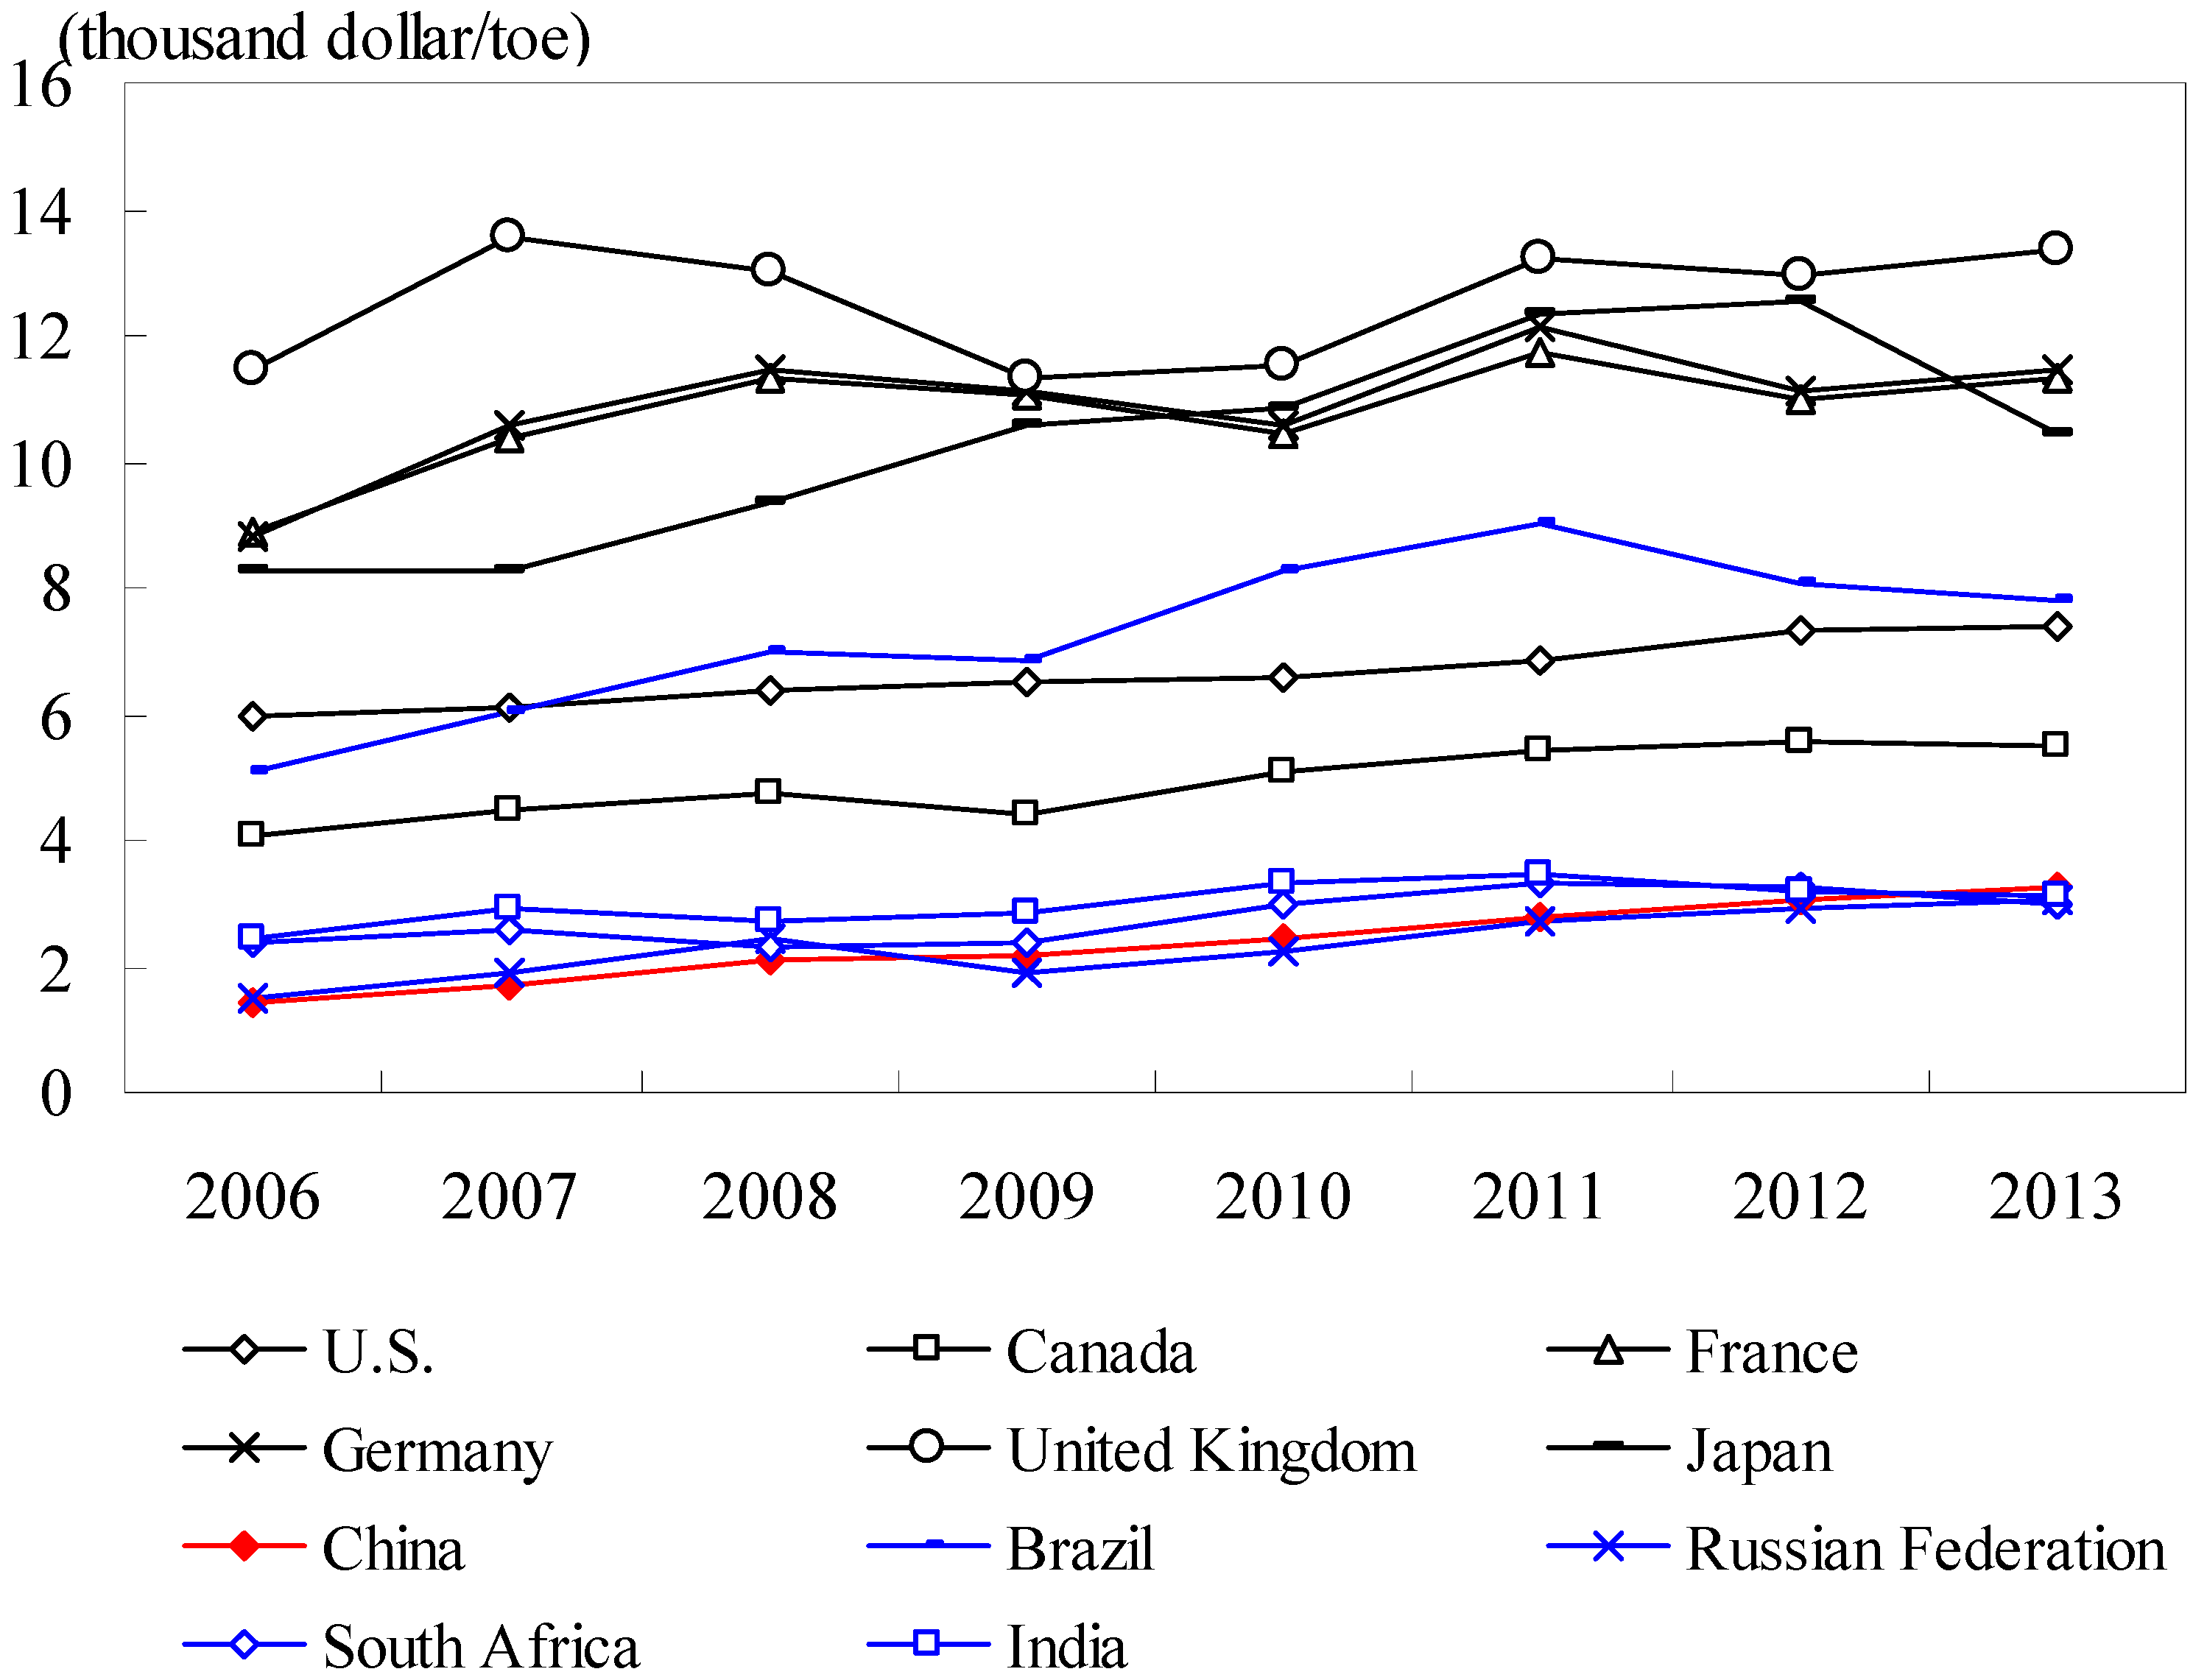
- (1)
- National energy efficiency level
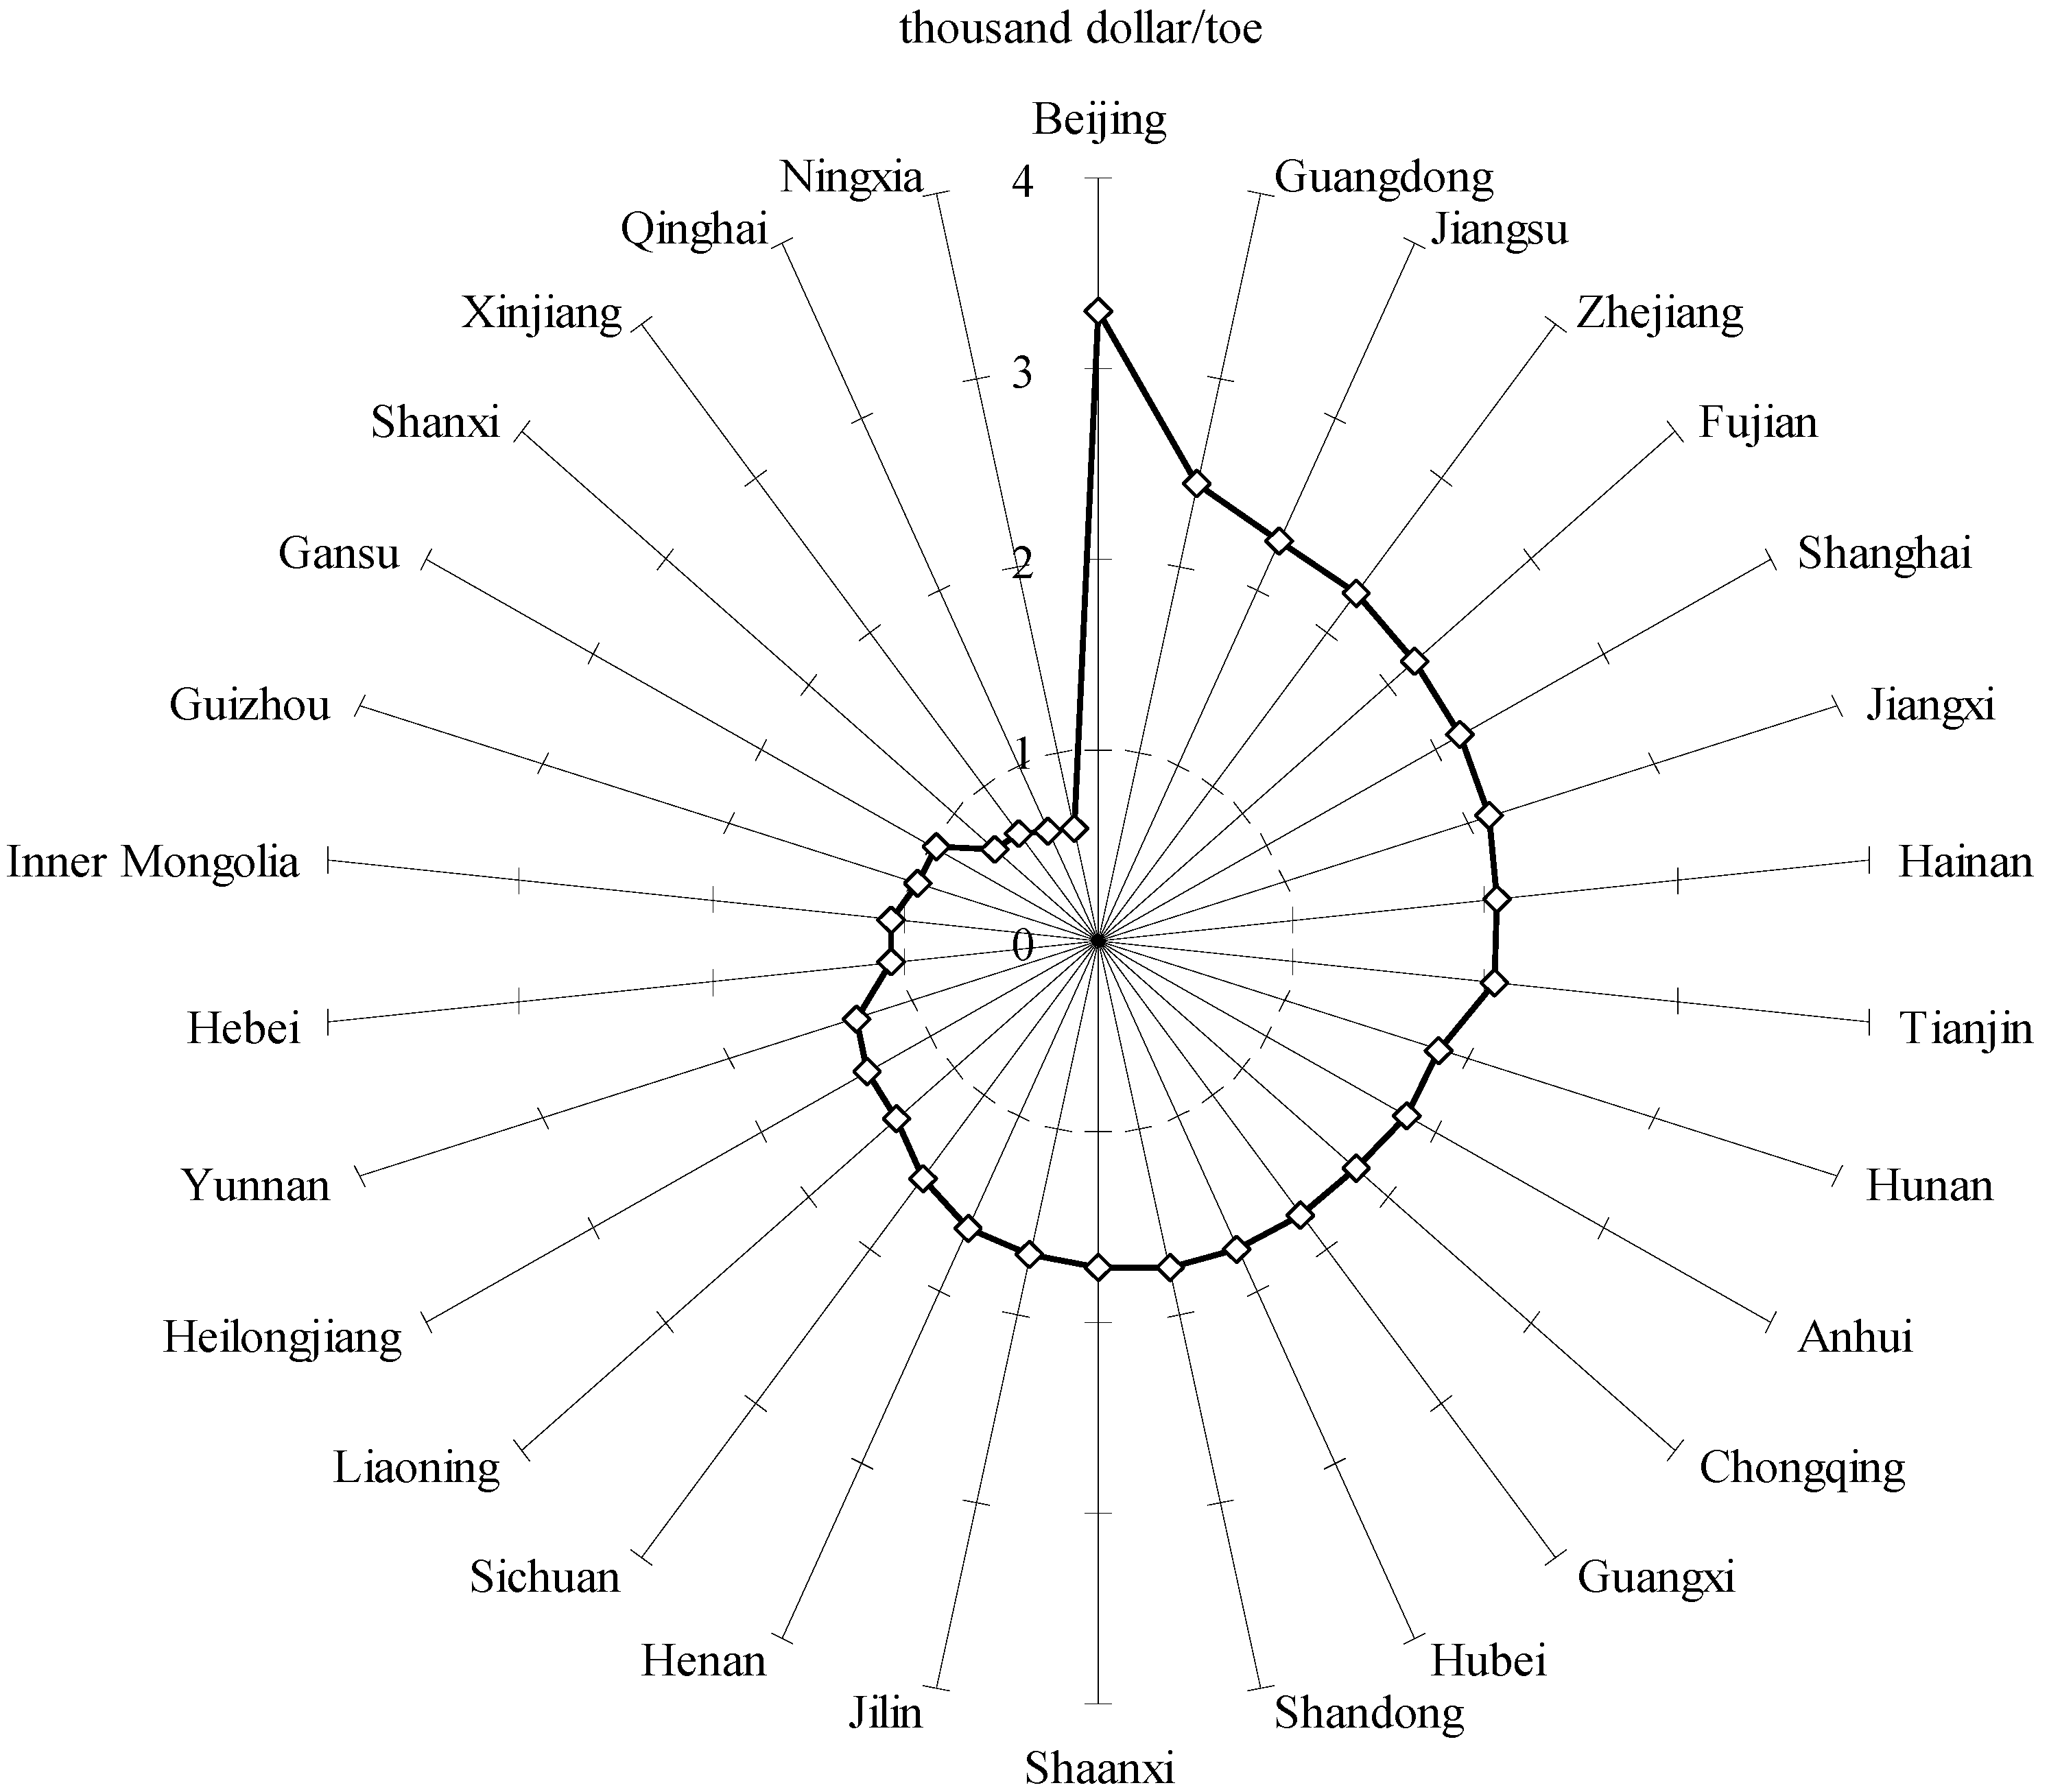
- (2)
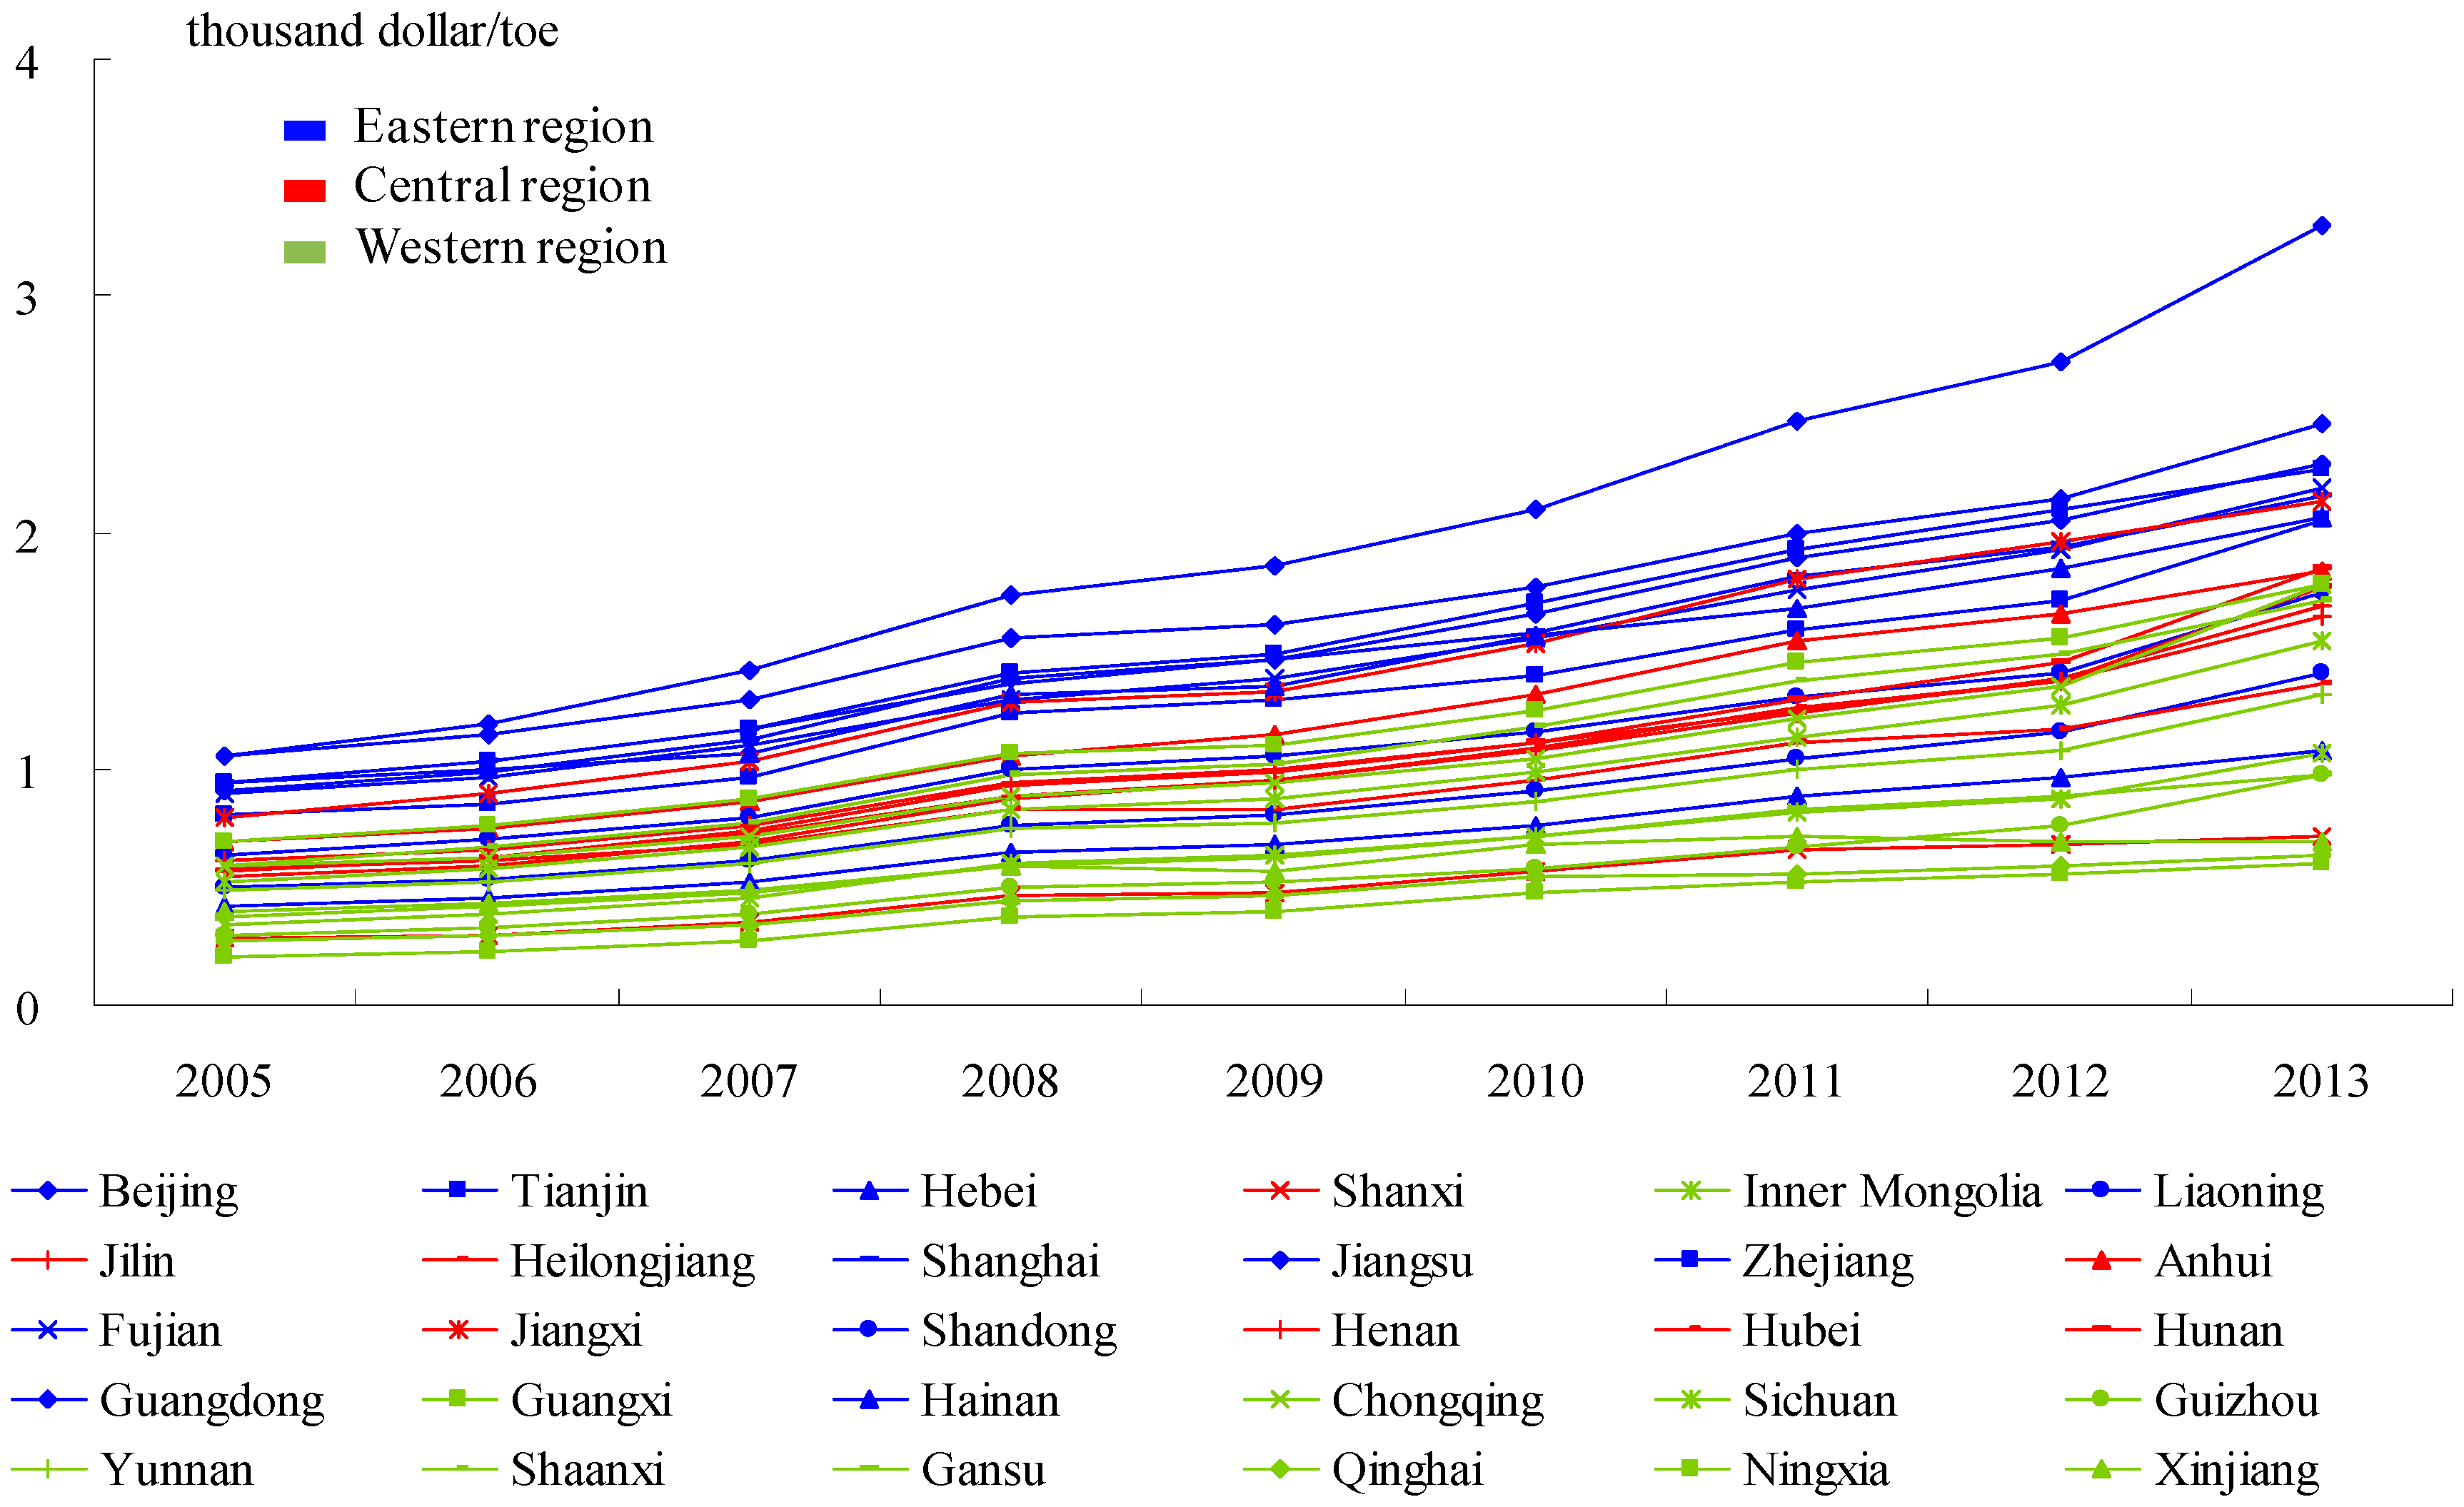
- Provincial energy efficiency level
5. Regionalization and Promotion Potentiality of Provincial Energy Efficiency
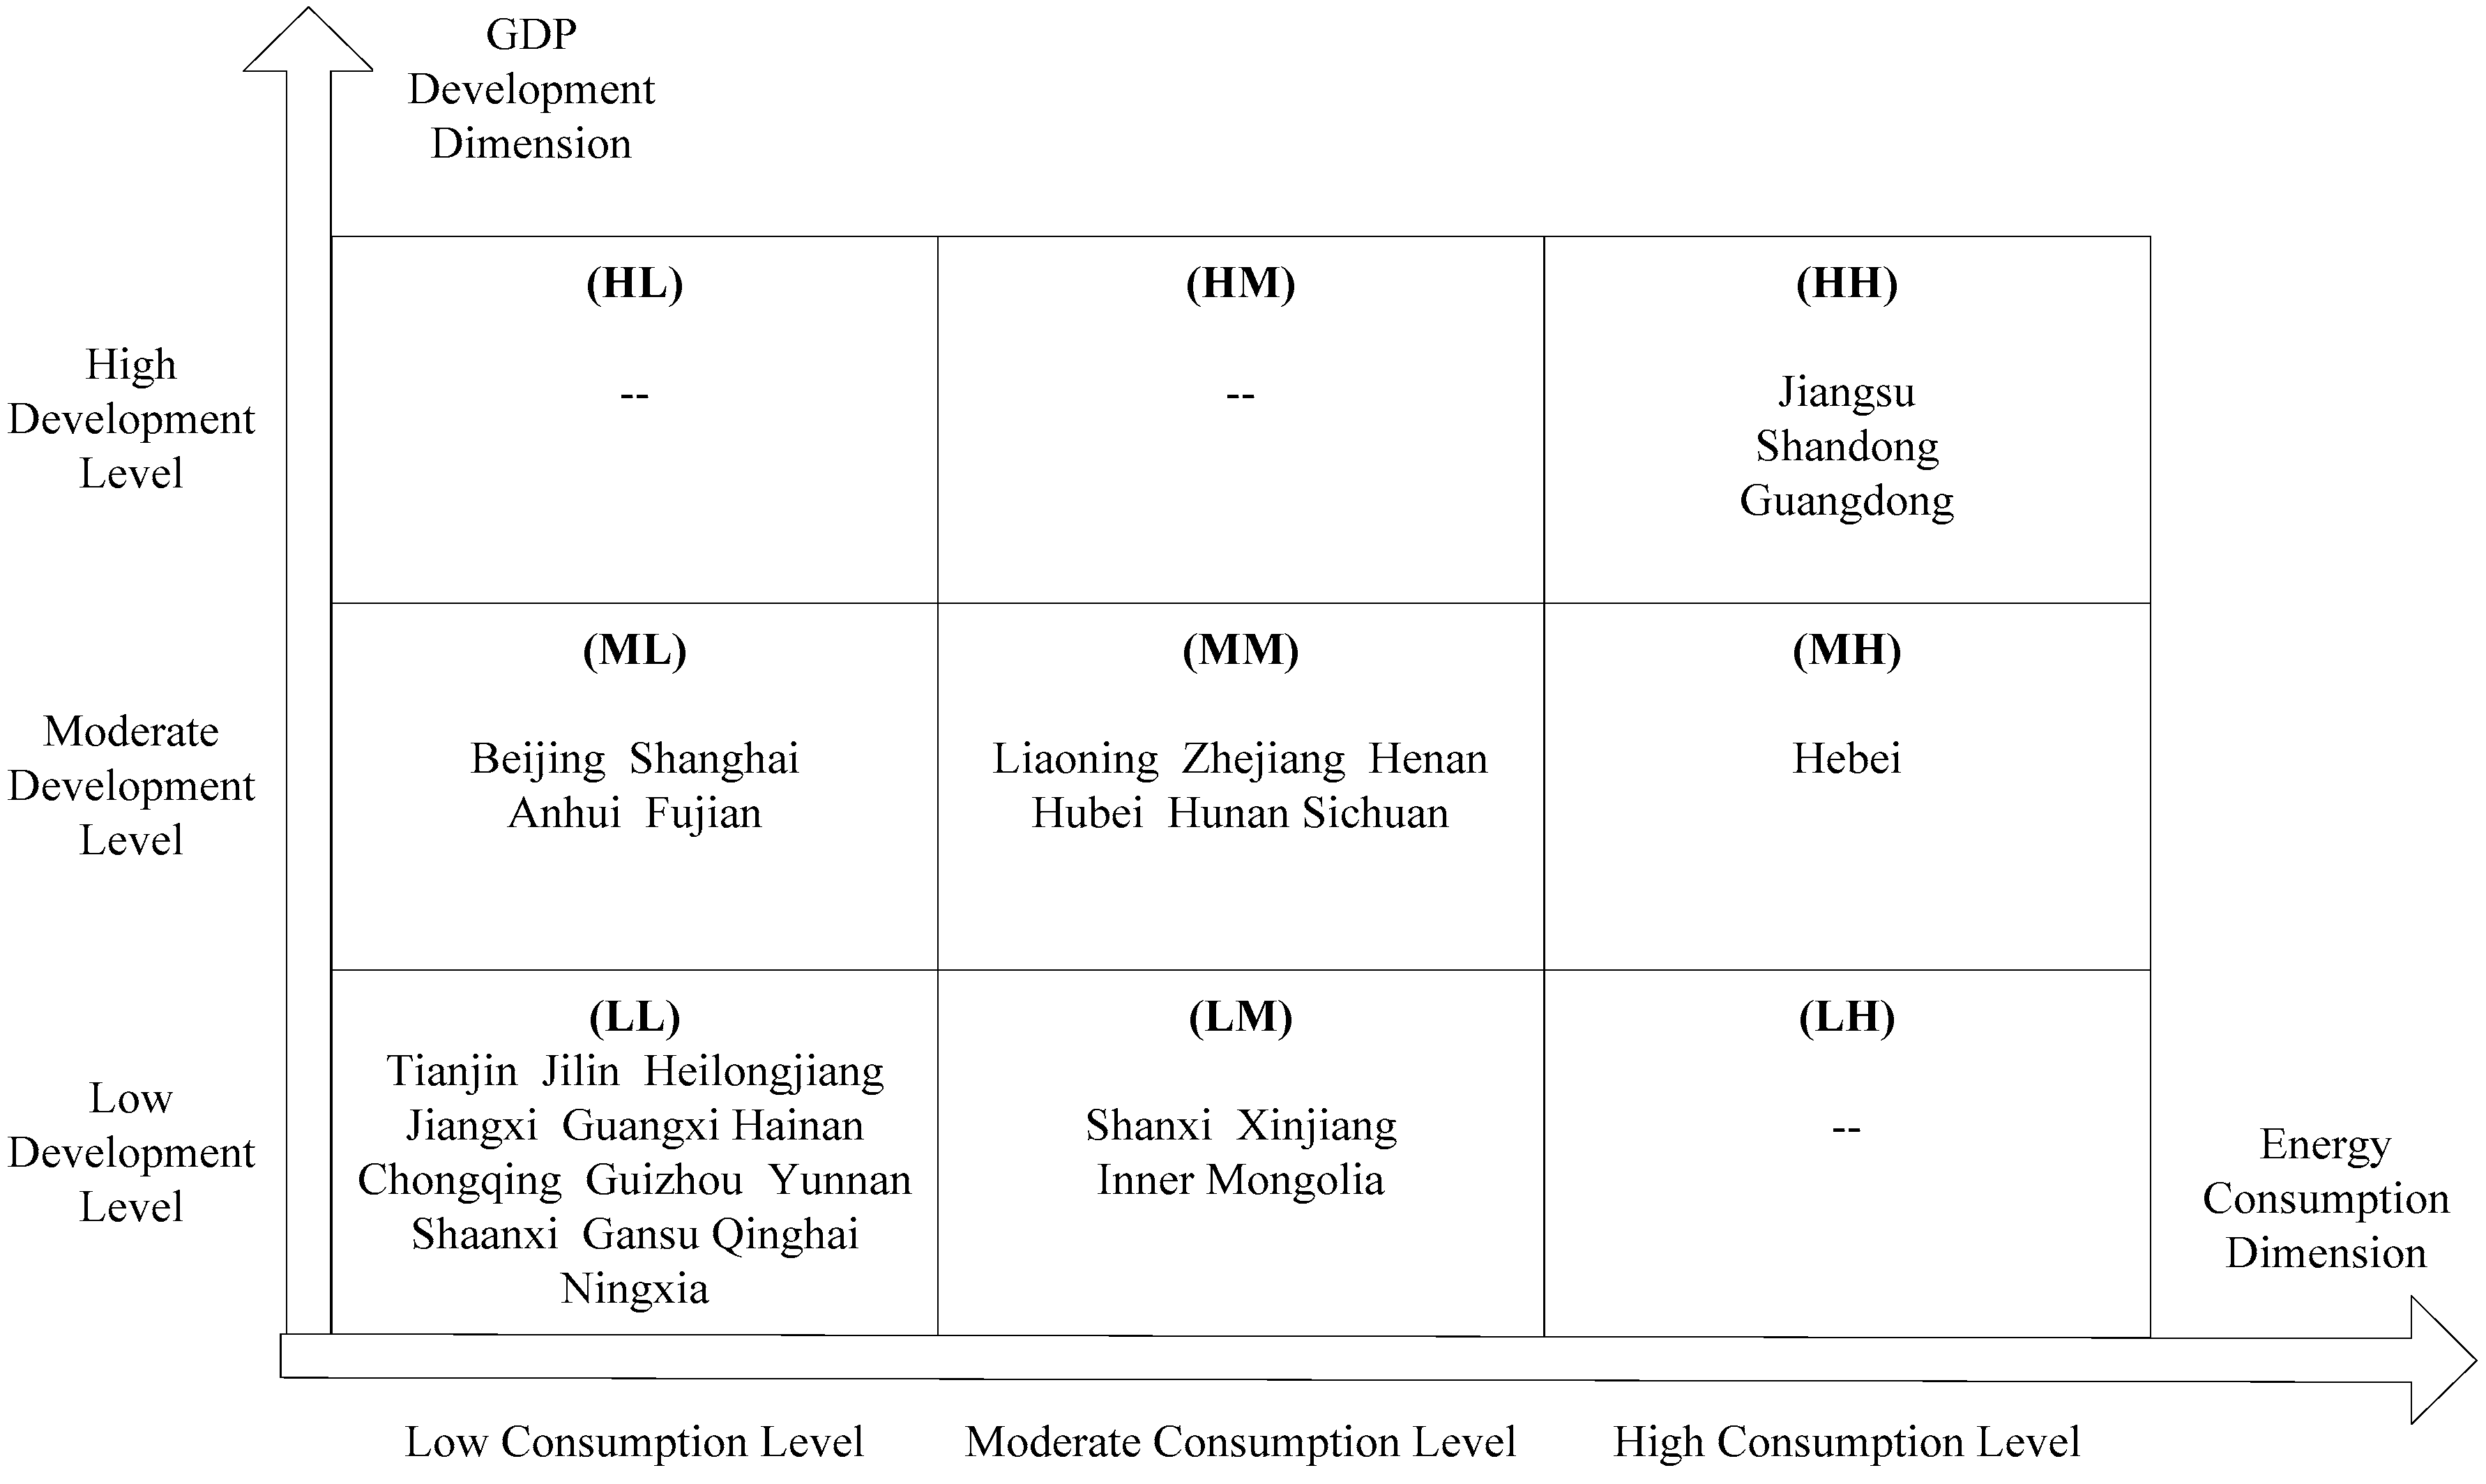
5.1. Regional Divisions Based on Cluster Analysis
5.2. Promotion Potentiality of Energy Efficiency in Different Regions
- (1)
- In the division (HH), the provinces in this division had high GDP development and energy consumption levels. Guangdong obtained the highest value of energy efficiency. Relative to Guangdong, the promotion potentialities of energy efficiency in Shandong and Hebei are, respectively, 28.79% and 56.29%. The promotion potentiality of Hebei is huge due to there being many energy-intensive industries in it, such as the chemical industry, cement industry, and steel industry. Reducing the energy intensity is a problem to be solved immediately. On the background of Beijing-Tianjin-Hebei integration, Hebei’s local government tries to control the overcapacity of these high energy intensive industries and decrease the proportion of the second industry [19].
- (2)
- In the division (MM), the provinces had moderate GDP development and energy consumption levels compared with the ones in division (HH). In this region, Zhejiang had a better energy efficiency level. The promotion potentialities of other provinces are almost from 20% to 30%. Most of the provinces are in central China. These provinces have relatively abundant energy, but they do not create enough economics benefits. Shifting the main energy consumption to the high-tech and service industries may be the effective measures to promote the energy efficiency levels in this division. For example in Henan, Zhengzhou National Hi-tech Industrial Development Zone was constructed in 2004. The zone is aiming at supporting the developments of hi-tech industries with low energy consumption, e.g., the software and information industry, biological medicine industry, optic-mechanical integration industry, and new materials industry [20]. These strategies provide possibilities for reducing the energy intensity.
- (3)
- In the division (ML), these provinces input lower energy and obrained larger economic output. Take Beijing as an example: many high value-added industries and enterprises are brought together in this city. Meanwhile, the city has a developed tertiary industries; the more prominent characteristics they have, the higher energy efficiency levels they receive. This rule also applies to Shanghai, Fujian, and Anhui. They provide references for the provinces in other divisions to explore suitable development methods. Improving the economic output and adjusting the economic development structure may be good choices for other provinces.
- (4)
- In the division (LL), these provinces had low GDP levels with low energy consumption. Their geographical locations are widely distributed. Jiangxi received a relatively better energy efficiency level. The provinces in the northwest and southwest region have more promotion potentiality. For example, Gansu, Qinghai, and Ningxia have 54.28%, 70.36%, and 71.63% promotion potentiality, respectively. Far inland, most provinces in this division do not have convenient traffic conditions, which is not conducive for trading. Mining new economic growth points are very crucial.
- (5)
- In the division (LM), the provinces received the worst energy efficiency levels. Compared with Inner Mongolia, the energy efficiency promotion potentiality in Xinjiang is 35.26%, similar to the 33.01% in Shanxi. For example, according to the official bulletin from National Bureau of Statistics, National Development and Reform Commission, and National Energy Administration in 2011, the energy intensity in Xinjiang had increased by 6.96% [21]. Xinjiang has abundant energy, such as crude oil, wind power, and solar energy, but sufficient energy production did not bring high benefits. A significant amount of energy was consumed by high energy intensity industries, such as the electrolytic aluminum industry [22]. This is the main reason for the low energy efficiency levels in these provinces. Transferring more energy consumption to high-value added industries is a better way to reduce the energy intensity, e.g., the non-metallic products manufacturing industry [23].
5.3. Limitations of the Calculation Method
6. Optimal Strategies and Discussions
- (1)
- Technical driving
- (2)
- The guidance of policy and mechanism
- (3)
- Industrial restructuring
7. Conclusions
Acknowledgments
Conflicts of Interest
References
- Bian, Y.; Hu, M.; Wang, Y.; Xu, H. Energy efficiency analysis of the economic system in China during 1986–2012: A parallel slacks-based measure approach. Renew. Sustain. Energy Rev. 2016, 55, 990–998. [Google Scholar] [CrossRef]
- Makridou, G.; Andriosopoulos, K.; Doumpos, M.; Zopounidis, C. Measuring the efficiency of energy-intensive industries across European countries. Energy Policy 2016, 88, 573–583. [Google Scholar] [CrossRef]
- Zha, Y.; Zhao, L.; Bian, Y. Measuring regional efficiency of energy and carbon dioxide emissions in China: A chance constrained DEA approach. Comput. Oper. Res. 2016, 66, 351–361. [Google Scholar] [CrossRef]
- Liu, Z.; Qin, C.; Zhang, Y. The energy-environment efficiency of road and railway sectors in China: Evidence from the provincial level. Ecol. Indic. 2016, 69, 559–570. [Google Scholar] [CrossRef]
- Filippini, M.; Hunt, L.C. Measurement of energy efficiency based on economic foundations. Energy Econ. 2015, 52, S5–S16. [Google Scholar] [CrossRef]
- Yu, X.; Moreno-Cruz, J.; Crittenden, J.C. Regional energy rebound effect: The impact of economy-wide and sector level energy efficiency improvement in Georgia, USA. Energy Policy 2015, 87, 250–259. [Google Scholar] [CrossRef]
- Lai, P.; Du, M.; Wang, B.; Chen, Z. Assessment and decomposition of total factor energy efficiency: An evidence based on energy shadow price in China. Sustainability 2016, 8, 408. [Google Scholar] [CrossRef]
- Viholainena, J.; Luoranenb, M.; Väisänenb, S.; Niskanenc, A.; Horttanainen, M.; Soukka, R. Regional level approach for increasing energy efficiency. Appl. Energy 2016, 163, 295–303. [Google Scholar] [CrossRef]
- Fais, B.; Sabio, N.; Strachan, N. The critical role of the industrial sector in reaching long-term emission reduction, energy efficiency and renewable targets. Appl. Energy 2016, 162, 699–712. [Google Scholar] [CrossRef]
- Peng, L.; Zhang, Y.; Wang, Y.; Zeng, X.; Peng, N.; Yu, A. Energy efficiency and influencing factor analysis in the overall Chinese textile industry. Energy 2015, 93, 1222–1229. [Google Scholar] [CrossRef]
- Oh, S.-C.; Hidreth, A.J. Estimating the technical improvement of energy efficiency in the automotive industry—Stochastic and deterministic frontier benchmarking approaches. Sustainability 2014, 7, 6196–6222. [Google Scholar] [CrossRef]
- Özkara, Y.; Atak, M. Regional total-factor energy efficiency and electricity saving potential of manufacturing industry in Turkey. Energy 2015, 93, 495–510. [Google Scholar] [CrossRef]
- Huang, Y.-H.; Chang, Y.-L.; Fleiter, T. A critical analysis of energy efficiency improvement potentials in Taiwan’s cement industry. Energy Policy 2016, 96, 14–26. [Google Scholar] [CrossRef]
- National Bureau of Statistics of China. China Statistical Yearbook in 2014; China Statistics Press: Beijing, China, 2015.
- Department of Energy Statistics, National Bureau of Statistics of China. China Energy Statistical Yearbook in 2014; China Statistics Press: Beijing, China, 2015.
- International Monetary Fund. World Economic Outlook. Available online: http://www.imf.org/external/pubs/ft/weo/2015/02/index.htm (accessed on 4 October 2015).
- BP Amoco. BP Statistical Review of World Energy 2015. Available online: http://www.bp.com/content/dam /bp/pdf/Energy-economics/statistical-review-2015/bp-statistical-review-of-world-energy-2015-full-report.pdf (accessed on 10 June 2015).
- Shi, D. Chinese regional differences in energy efficiency and energy saving potential analysis. China Ind. Econ. 2006, 1, 49–58. [Google Scholar]
- Chen, Y.; Chen, Z.; Hou, X. Remodeling industrial structure under the background of Beijing-Tianjin-Hebei integration. J. Tianjin Norm. Univ. Soc. Sci. 2014, 6, 1–6. (In Chinese) [Google Scholar]
- Zhengzhou National Hi-Tech Industrial Development Zone. Available online: http://baike.so.com/doc/5603924-5816533.html#5603924-5816533-8 (accessed on 20 May 2003).
- National Bureau of Statistics, National Development and Reform Commission and National Energy Administration. Bulletin of Provincial Energy Consumption Indicators in 2011. Available online: http://www.gov.cn/gzdt/2012-08/16/content_2205174.htm (accessed on 18 August 2012).
- Xiao, C. Upgrading and transformation of resources-based industry cluster in Xinjiang under the constraints of resources and environment. Ecol. Econ. 2010, 8, 103–107. (In Chinese) [Google Scholar]
- Lin, B.; Tan, R. Ecological total-factor energy efficiency of China’s energy intensive industries. Ecol. Indic. 2016, 70, 480–497. [Google Scholar] [CrossRef]
- Cao, X.; Wen, Z.; Chen, J.; Li, H. Contributing to differentiated technology policy-making on the promotion of energy efficiency technologies in heavy industrial sector: A case study of China. J. Clean. Prod. 2016, 112, 1486–1497. [Google Scholar] [CrossRef]
- Cheng, J.; Li, S. The influences of structural change, technological progress and price fluctuation on the energy efficiency. China Popul. Resour. Environ. 2010, 20, 35–42. [Google Scholar]
- Thoyre, A. Energy efficiency as a resource in state portfolio standards: Lessons for more expansive policies. Energy Policy 2015, 86, 625–634. [Google Scholar] [CrossRef]
- Jiang, L.; Ji, H. The influence of technical innovation on the energy efficiency from the spatial heterogeneity perspective. Technol. Econ. 2011, 30, 73–78. [Google Scholar]
- Luong, N.D. A critical review on energy efficiency and conservation policies and programs in Vietnam. Renew. Sustain. Energy Rev. 2015, 52, 623–634. [Google Scholar] [CrossRef]
- Valenzuela, J.M.; Qi, Y. Framing energy efficiency and renewable energy policies: An international comparison between Mexico and China. Energy Policy 2012, 51, 128–137. [Google Scholar] [CrossRef]
- Li, J.; Shui, B. A comprehensive analysis of building energy efficiency policiesin China: Status quo and development perspective. J. Clean. Prod. 2015, 90, 326–344. [Google Scholar] [CrossRef]
- Yu, Y.; Wang, X.; Li, H.; Qi, Y.; Tamura, K. Ex-post assessment of China’s industrial energy efficiency policies during the 11th Five-Year Plan. Energy Policy 2015, 76, 132–145. [Google Scholar] [CrossRef]
- Peng, Y.; Chi, M. The influence of energy saving policies on energy efficiency improvement: A provincial panel data empirical analysis. Ecol. Economy 2015, 31, 14–18. [Google Scholar]
- Bukarica, V.; Robić, S. Implementing energy efficiency policy in Croatia: Stakeholder interactions for closing the gap. Energy Policy 2013, 61, 414–422. [Google Scholar] [CrossRef]
- Song, C.; Oh, W. Determinants of innovation in energy intensive industry and implications for energy policy. Energy Policy 2015, 81, 122–130. [Google Scholar] [CrossRef]
- Guo, X. A Study on China’s Energy Efficiency Based on Industrial Framework. Ph.D. Thesis, Chongqing University, Chongqing, China, 2012. [Google Scholar]


| Divisions | Maximum Value (Thousand Dollar/Toe) | Promotion Potentiality (%) | ||
|---|---|---|---|---|
| (HH) | Guangdong | 2.46 | Jiangsu | 6.73% |
| Shandong | 28.79% | |||
| Hebei 1 | 56.29% | |||
| (MM) | Zhejiang | 2.27 | Hunan | 18.52% |
| Hubei | 22.06% | |||
| Henan | 27.46% | |||
| Sichuan | 32.18% | |||
| Liaoning | 38.15% | |||
| (ML) | Beijing | 3.30 | Fujian | 33.64% |
| Shanghai | 34.70% | |||
| Anhui | 44.17% | |||
| (LL) | Jiangxi | 2.13 | Hainan | 2.78% |
| Tianjin | 3.58% | |||
| Chongqing | 16.43% | |||
| Guangxi | 16.44% | |||
| Shaanxi | 19.63% | |||
| Jilin | 20.59% | |||
| Heilongjiang | 35.83% | |||
| Yunnan | 38.18% | |||
| Guizhou | 54.24% | |||
| Gansu | 54.28% | |||
| Qinghai | 70.36% | |||
| Ningxia | 71.63% | |||
| (LM) | Inner Mongolia | 1.07 | Shanxi | 33.01% |
| Xinjiang | 35.26% | |||
© 2016 by the authors; licensee MDPI, Basel, Switzerland. This article is an open access article distributed under the terms and conditions of the Creative Commons Attribution (CC-BY) license (http://creativecommons.org/licenses/by/4.0/).
Share and Cite
Liu, J.; Wang, L.; Qiu, M.; Zhu, J. Promotion Potentiality and Optimal Strategies Analysis of Provincial Energy Efficiency in China. Sustainability 2016, 8, 741. https://doi.org/10.3390/su8080741
Liu J, Wang L, Qiu M, Zhu J. Promotion Potentiality and Optimal Strategies Analysis of Provincial Energy Efficiency in China. Sustainability. 2016; 8(8):741. https://doi.org/10.3390/su8080741
Chicago/Turabian StyleLiu, Jinpeng, Li Wang, Mohan Qiu, and Jiang Zhu. 2016. "Promotion Potentiality and Optimal Strategies Analysis of Provincial Energy Efficiency in China" Sustainability 8, no. 8: 741. https://doi.org/10.3390/su8080741
APA StyleLiu, J., Wang, L., Qiu, M., & Zhu, J. (2016). Promotion Potentiality and Optimal Strategies Analysis of Provincial Energy Efficiency in China. Sustainability, 8(8), 741. https://doi.org/10.3390/su8080741