Article

Investigations on the Energy Efficiency of Stratified Air Distribution Systems with Different Diffuser Layouts

1
College of Environmental Science and Engineering, Taiyuan University of Technology, Taiyuan 030024, China
2
College of Civil Engineering, Hunan University, Changsha 410082, China
*
Authors to whom correspondence should be addressed.
Sustainability 2016, 8(8), 732; https://doi.org/10.3390/su8080732
Submission received: 27 May 2016 / Revised: 25 July 2016 / Accepted: 27 July 2016 / Published: 30 July 2016
(This article belongs to the Special Issue Renewable Energy Applications and Energy Saving in Buildings)

Abstract

:
This paper investigated the influence of diffuser layouts on the energy performance of stratified air distribution systems (STRAD). The energy saving potentials of STRAD systems are theoretically analyzed. The cooling coil load of a STRAD system is proportion to the return air temperature, while inversely proportional to the exhaust air temperature. Based on that, numerical studies are conducted for the applications of STRAD systems in three typical building space types. Two evaluation indices are developed to assess the energy performance of STRAD systems. The simulation results demonstrated that further energy saving could be achieved by keeping the exhaust grille at ceiling level and decreasing the height of return grille. Therefore, in order to optimize the energy saving capacity of STRAD systems, the return grille is recommended to be located as low as possible, whilst paying special attention on the “short-circuit” of cold supply air. Furthermore, when the STRAD system is applied in large space buildings with a big horizontal span, supply diffusers should be distributed surrounding the occupied zone as uniformly as possible, while avoiding installing return diffusers at exterior walls.

1. Introduction

In recent years, the stratified air distribution (STRAD) system has been widely developed, due to its better ventilation efficiency and energy saving capacity, in comparison with traditional mixing ventilation systems [1,2,3]. In a STRAD system, the cold fresh air is supplied directly to the occupied zone and flows up due to thermal buoyancy, which resulted in a large vertical temperature stratification in the room air [4]. As a result of that, convective heat sources at or above the stratification height will rise up and exit the space without mixing into the lower zone, which is beneficial to the energy savings of air conditioning systems. Based on CFD simulations, Awbi [5] pointed out that when cooling a room, the ventilation effectiveness for heat distribution in a displacement ventilation system is almost twice of the value in a mixing ventilation system. A number of studies [6,7] identified that the significant energy benefit of STRAD systems is mainly generated by high cooling air temperature, which extended the economizer or free-cooling capabilities of HVAC systems. With extensive studies, Xu and Niu [8] concluded that the energy saving potentials for an STRAD system derived from three factors: an extended free cooling time, a reduced ventilation load, and increased coefficients of performance (COP) for chillers.
Because of the large indoor thermal stratification, the layout of exhaust/return grilles plays an important role in the energy performance of STRAD systems, which is different with that in a well-mixed ventilation system [9,10]. Lam and Chan investigated the temperature distribution and air movement in a gymnasium with a stratified air-conditioning system [11]. The numerical results revealed that the exhaust position greatly affected the thermal stratification of indoor air, and then significantly influenced the annual cooling load of the STRAD system. Experimental studies conducted by Awad et al. in a chamber with a stratified ventilation system also indicated that the exhaust location directly influenced the stratification height, which consequently affected the cooling load of air conditioning units [12]. Filler [13] pointed out as well if return-air grilles were placed close to building’s perimeter walls, convective heat gain occurring there could be removed directly by the return air before it entered into the occupied zone, which was benefit to save energy for the systems. These studies certified the great influence of exhaust/return grilles on the energy saving performance of STRAD systems. However, such limited research offers little insight in the diffuser layout designs of STRAD systems. In addition, in most previous research of STRAD systems, the exhaust and return grilles were combined together and installed at ceiling level. It was proposed that, with separated locations of return and exhaust grilles, additional energy savings was able to be achieved for STRAD systems, which would be much more pronounced for large spaces with high ceilings [14].
Therefore, the influence of diffuser layout on energy saving performance of STRAD systems, especially for STRAD systems with separated locations of return and exhaust grilles, are required to be further investigated. In this paper, energy saving potentials of STRAD systems obtained by splitting locations of return and exhaust grilles are theoretically studied and clearly clarified first. Based on that, the effect of diffuser layout on the energy saving capacity of STRAD systems are numerically investigated. Since space type is one of the most important parameters that affecting the performance of STRAD systems [15,16], three typical buildings with different ceiling heights are studied in this paper, namely a small office, terraced classroom, and terminal building of an airport. With extensive simulation results, the effects of diffuser layouts on the energy performance of STRAD systems are illustrated and corresponding design principles are proposed for the application of STRAD systems in different building spaces.

2. Energy Saving Principle for STRAD Systems

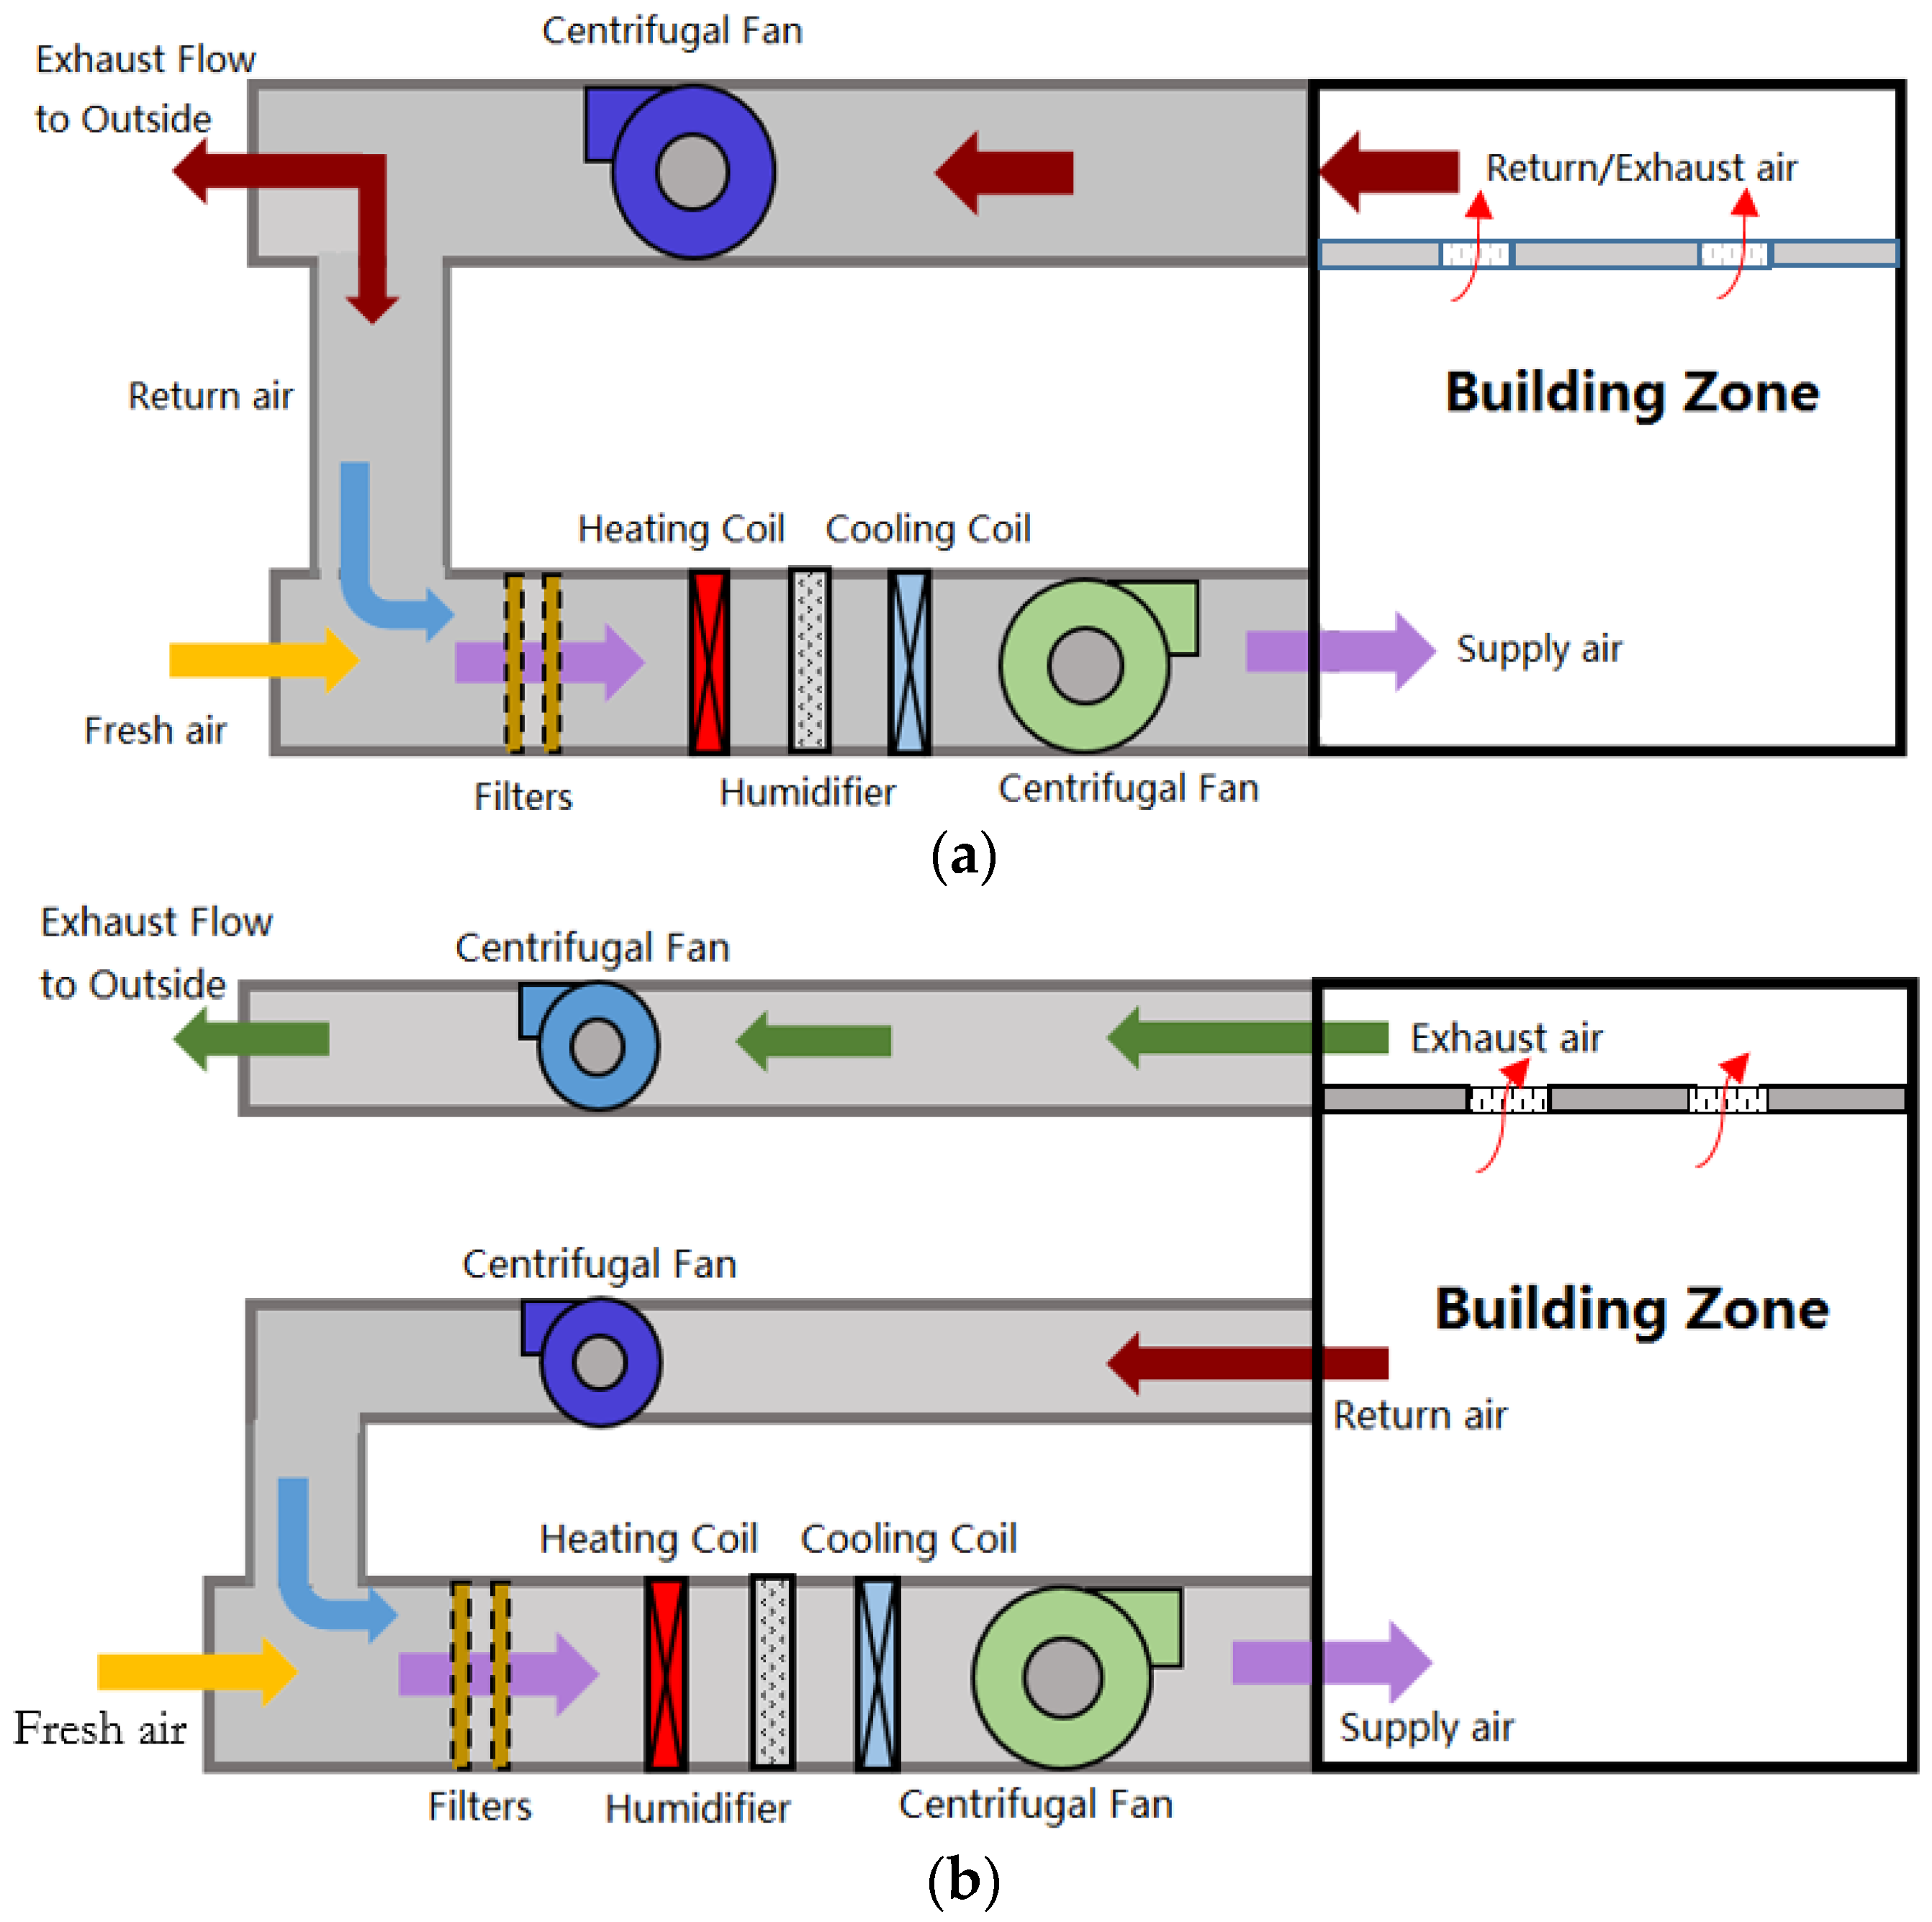
In a well-designed mixing ventilation system, locations of return and exhaust inlets have no significant influence on the cooling coil load, since the room temperature is uniform. Different with that, due to the obvious thermal stratification of indoor air, locations of return and exhaust grilles in a STRAD system will have great effect on the cooling coil load. As shown in Figure 1, the cooling coil load in a STRAD system can be expressed as following equation, which is suitable for STRAD systems with different configurations:
Q c o i l - S T R A D = C p × m ˙ r × ( t r t s ) + C p × m ˙ o × ( t o t s )
where, m ˙ r (kg/s) is the return air flow rate and m ˙ o (kg/s) is the outdoor air flow rate. t r is the return air temperature (°C), t o is the outdoor air temperature (°C), and t s is the supply air temperature (°C). Equation (1) indicates that the cooling coil load in a STRAD system is directly dependent on the return air temperature. The lower the return air temperature, the smaller the cooling coil load. This is consistent with the findings of a series experimental studies presented by Olivieri and Singh [5]. They found that as the return air temperature decreased, less capacity of the cooling unit is required by the system.
On the other hand, once the space heat source arrangement is fixed, the space cooling load Q S p a c e is a constant. According to the space energy balance analysis, the space cooling load can be calculated as:
Q S p a c e = C p × m ˙ r × ( t r t s ) + C p × m ˙ e × ( t e t s )
where, t e is the exhaust air temperature (°C) and m ˙ e (kg/s) is the exhaust air flow rate. Equation (2) indicates that an inversely proportional relationship exists between the return air temperature and the exhaust air temperature. Furthermore, with some further algebra operations, Equation (2) can be written as:
C p × m ˙ r × ( t r t s ) = Q S p a c e C p × m ˙ e × ( t e t s )
Substitute Equation (3) into Equation (1), the cooling coil load of STRAD systems could also be expressed as:
Q c o i l - S T R A D = Q S p a c e C p × m ˙ e × ( t e t o )
Equation (4) reveals obviously that in order to decrease the return air temperature and improve the energy saving capacity of the cooling unit, the exhaust air temperature should be increased as high as possible. Since the vertically thermal stratification is remarkable in a well-designed STRAD system, it is possible to obtain higher exhaust air temperature and lower return air temperature by splitting the locations of return and exhaust grilles. As shown in Figure 1b, by keeping the exhaust grilles at ceiling level, while installing the return grilles at the lower cool zone, much more heat can be discharged by exhaust air directly, compared with that in Figure 1a. Consequently, the exhaust air temperature is increased and the cooling coil load would be further reduced. This is partially in agreement with the viewpoints of Gorton and Bagheri [6]. They supposed that when the height of return grilles varied from upper zone to lower zone, the cooling load decreased and the decrement was dependent on building construction characteristics, load characteristics, and the upper zone temperature.

3. Numerical Study on the Effect of Diffuser Layout

3.1. Physical Models

Geometrical models for three typical space types, namely the small office, terraced classroom, and terminal building, were built up separately. As shown in Figure 2, the space heat sources in the small office room include two detailed thermal manikins, two computers, and a miniature printer, with a total heat load of 1020 W. The room is conditioned by stratified air distribution system with floor-mounted supply diffusers. The supply and return air parameters, including the air flow rate, the supply air temperature, and diffuser locations in different simulation cases are listed in Table 1. What should be noted is that the height of return grille is decreased from ceiling level in Case 1-1 to floor level in Case 1-7.
Figure 3a presents the geometrical information of a large terraced classroom, which refers to an existing classroom in a university campus. The height from ceiling to floor of the classroom varies from 5 m at 1st row to 3 m at 10th row. For the purpose of a more comfortable thermal environment, a hypothetical STRAD system with air simultaneously supplied from diffusers located at floor-level, terrace, and desk edge was designed, as indicated in Figure 3b [17]. Its notable that part of the air is exhausted from three grilles located at ceiling-level, while the rest four return grilles are distributed on surrounding walls at middle-level. To simply the geometry model and improve the computational efficient, simple human model is adopted to represent most of occupants, as shown in Figure 3b. There are 130 seats arranged in the classroom and the total space thermal load, including the occupants and lamps, is 10.6 KW. Simulation cases with different diffuser layouts are presented in Table 2.
Figure 4 is the geometry model of the terminal building. Considering the computational resource limitations, only a middle section of an elongated waiting hall with a dimension of 24.9 m (W) × 11.2 m (L) × 8 m (H) in a terminal building is investigated. There are 128 seats provided for occupants waiting for departure. Typical under floor air distribution system for large spaces is adopted. As indicated in Figure 4, the air is supplied from diffuser 1, which is located at the bottom of the air-conditioning unit, and returned from middle height grilles of diffuser 2. To investigate the impact of diffuser locations on ventilation performance, Diffuser 3 and Diffuser 4 are assumed to be located on side walls, and used as additional return inlets and supply outlets, separately. The diffuser layouts in different simulation cases are listed in Table 3. The total heat gain of the space is 85.4 W/m2 of floor area and the supply air temperature is constant at 18 °C in different cases.

3.2. Grid Generation and Numerical Models

The correctness and accuracy of simulation results depend highly on grid quality. Grid generation takes up most of the time and human labor during the whole simulation process, especially for buildings with complex configurations. According to the geometrical characteristics, computational domains of the three typical building spaces are respectively divided into several parts with non-conformal grids. Cuboids enclosing a detailed human body are meshed with unstructured grids and regions close to body surface are refined, as presented in Figure 5. While, the remaining building spaces are discretized with structured grids to achieve better grid quality.
Meshes of the three typical building models are all generated by Gambit 2.4 (Fluent, Inc., New York, NY, USA). The total mesh number of the small office, the terraced classroom and the terminal building are respectively about 2.1 million, 2.3 million, and 1.4 million. The grid sensitivity of each model is analyzed in detail. For instance, two mesh generation schemes with different mesh space, namely grid space 1 and grid space 2, were adopted for the small office model. The total cell number of these two schemes are 2,504,433 and 2,119,414, respectively. As shown in Figure 6, heat flux of each body segments in the two cases with different grid spaces are almost the same. Thus, it is considered that gird space 2 is reasonable and practicable to be used in the simulations.
Correct simulation of airflow in a space depends on proper specifications of boundary conditions and selection of turbulence model. However, an ideal turbulence model, which is suitable for the not fully developed turbulent flow around a human body sitting in almost stagnant ambient air, is difficult to select. Therefore, in this study, the standard k ε model is adopted as a compromise, because it is capable of reproducing the thermal plume structure and the associated thermal stratification [18]. The y+ of detailed human body surface was about 1 and an enhanced wall function was used to calculate the heat transfer between human body and the environment. While for all wall surfaces in the terminal building model, an average y+ of 45 was achieved and the standard wall function was adopted.
All thermophysical properties are assumed to be constant except for density, which is treated with the Boussinesq model. The Navier-Stokes equations were solved with a commercial coded Fluent 15.0 based on a finite-volume method. The convection terms are discretized by second order upwind scheme and the diffusion term by central differences and with second-order accuracy. The SIMPLE algorithm is adopted as pressure-velocity coupling method. The convergence criteria are such that the residuals are set to 10−4 for the continuity and momentum equations and 10−7 for the energy equation, which are rigorous qualitative measurements for convergence [19]. It is worthwhile to note that the radiant heat transfer is calculated by the discrete ordinates (Do) radiation model. This model solves the radiative transfer equation (RTE) for a finite number of discrete solid angles, each associated with a vector direction fixed in the global Cartesian system. The numerical model was validated by an experimental study, the agreement between the measured and modeled temperature profiles in a climate chamber with small space was acceptable [20].

3.3. Boundary Conditions

In this study, the supply air inlets and the return air outlets are set as velocity inlets, while the exhaust air outlets are set as pressure-outlets. The supply and return air velocities in different cases are calculated as following:
ν i = V i 1000 A i
where, ν i is the supply or return air velocity (m/s); V i is the total supply or return air flowrate (L/s), and A i is the corresponding area of grille openings (m2). Heat gains in the three typical spaces are different. Detailed boundary settings of heat sources in different simulation cases are listed in Table 4. What should be noted is that the clothing resistance is considered as 0.5 clo, when fixed surface temperature is set for the detailed human body. All of building enclosures are set as adiabatic wall boundaries, expect those specially listed in Table 4.

4. Simulation Results

4.1. Evaluation Indices

Currently, there is still a lack of generally recognized assessment indices for the energy saving potential of STRAD systems. In this paper, two indices, namely the absolute energy saving potential Δ Q c o i l and the relative energy saving potential Δ Q c o i l - R are defined, to evaluate the energy performance of STRAD systems in different cases. The absolute energy saving potential refers to the amount of energy saved directly for the cooling coil of STRAD systems compared with the cooling coil load of mixing ventilation system for the same conditions. It can be calculated as following:
Δ Q c o i l = Q c o i l M V Q c o i l S T R A D
where, Q c o i l M V and Q c o i l S T R A D are respectively the cooling coil load of mixing ventilation systems and stratified air distribution systems for the same building space. For a well-designed mixing ventilation system, Q c o i l M V is comprised by two sections, the space cooling load and the ventilation cooling load. While the relative energy saving potential Δ Q c o i l - R indicates the proportion of energy saved for the cooling coil to the total space cooling load, which is expressed as:
Δ Q c o i l - R = Δ Q c o i l Q S p a c e

4.2. Simulation Results

4.2.1. Small Office

Energy savings for STRAD systems with different diffuser locations in the small office are presented in Table 5. It can be found that as the height of return grille decreased from ceiling level to floor level, the return air temperature decreased while the exhaust air temperature increased. The main reason is that as the height of return grille decreased, more convective heat flow with thermal plumes from occupied zone to upper zone of the room and then expelled directly by exhaust air. Correspondingly, space heat removed by return air and then contributed to the cooling coil was reduced. Hence, the energy saving capacity is most prominent in Case 1-7, in which up to 17.3% of the space cooling load was saved for the cooling coil. However, special attention should be paid on the “short-circuit” of cold supply air. As indicated in Figure 7, when the return grille is located at lower level and close to the supply diffusers in Case 1-7, part of the cold supply air was returned directly before mixed with the indoor air. As a result of that, less cold air was entrained by thermal plumes and an overheated thermal problem was caused by warm air temperature at the upper zone, as revealed in Figure 7.
The energy saving performance of the STRAD system in Case 1-1 was worst and the absolute energy saving potential Δ Q c o i l was even negative, which means the cooling coil load of the STRAD system was even larger than that in a mixing ventilation system. That was because in Case 1-1, partial warm air in the upper zone was discharged from the return grille installed at ceiling level to the cooling coil, and greatly increased the cooling coil load. As obviously shown in Figure 8, due to the induced function of return grille, most warm air of the thermal plume generated from human body was mixed with return air and then discharged to the cooling coil.

4.2.2. Terraced Classroom

The space height of terraced classroom is higher than that in the small office, which is beneficial to the full development of thermal plumes. Therefore, much more convective heat is able to be extracted by thermal plume from the occupied zone to the upper zone, and then discharged to outdoors with exhaust air. Corresponding to that, the energy saving capacity of STRAD system in terraced classroom is generally better than that in the small office, as presented in Table 6. From Table 6, it also can be found that as the height of return grill decreased, the return air temperature decreased while the exhaust air temperature increased. Consequently, the absolute energy saving potential and the relative energy saving potential are both obviously improved.
Figure 9 presents the thermal comfort for the numerical thermal manikin located at the ninth row in different cases, evaluated by using the UC Berkeley thermal comfort model [21]. It indicates that thermal comfort for the thermal manikin was greatly affected by the height of return grille, which was especially obvious at head level. As the height of return grille located at the back wall decreased from ceiling level to floor level, the induced function of the return grille led a portion of the cold supply air return to the AHU directly, and thus the head experienced less cold airstreams. Meanwhile, the head level was always exposed to the thermal plumes flowing from front rows of occupants which moved to the warmer side as the height of return grille decreased. Therefore, the local thermal environment for the head level was deteriorative in Case 2-4.

4.2.3. Terminal Building

Table 7 is the energy savings of STRAD system with different diffuser layouts, when applied in the terminal building. The results reveal that the energy saving capacity of STRAD system was greatly enhanced by installing additional supply diffusers at side walls. The relative energy saving potential was increased from 16.8% in Case 3-1 to 20.8% in Case 3-3. The main reason is that in Case 3-3, heat transfer between the cold supply air and heat sources in the occupied zone was much more full than that in Case 3-1, because of the reversed air flow formed by the collision of the two supply airstreams with opposite directions, as shown in Figure 10. In consequence, much more convective heat was contained by thermal plume and flow to upper zone in Case 3-3, in comparison with that in Case 3-1, and thus the energy saving capacity in Case 3-3 was greatly improved.
In addition, Figure 10 also reveals that in Case 3-3 a smaller thermal stratification in the occupied zone was achieved, due to the enhanced turbulence intensity, which is beneficial to promoting the thermal environment. However, it is notable that the local draft risk for the collision region of supply airstreams was also increased. As shown in Figure 11, the draft risk values in Case 3-3 was larger than those in Case 3-1 for the collision region of supply airstreams as marked for the collision region of supply airstreams, and approached the limit. The thermal environment for this region is verified to be poorer in Case 3-3 than in Case 3-1. As shown in Figure 12, the PPD values in this region in Case 3-3 are greater than 10, which is the maximum value allowed in ASHRAE Standard [1].
Different from that, the energy saving capacity of STRAD systems is slightly weaker by installing an additional return diffuser at side walls. As shown in Table 7, the relative energy saving potential in Case 3-4 is reduced by 3.6%, in comparison with that in Case 3-3. The main reason is that thermal plumes along with exterior walls are impeded due to the induced function of return grilles located at side walls. Thus, partial warm air flows back to the occupied zone which then increases the cooling coil load.

5. Discussion and Conclusions

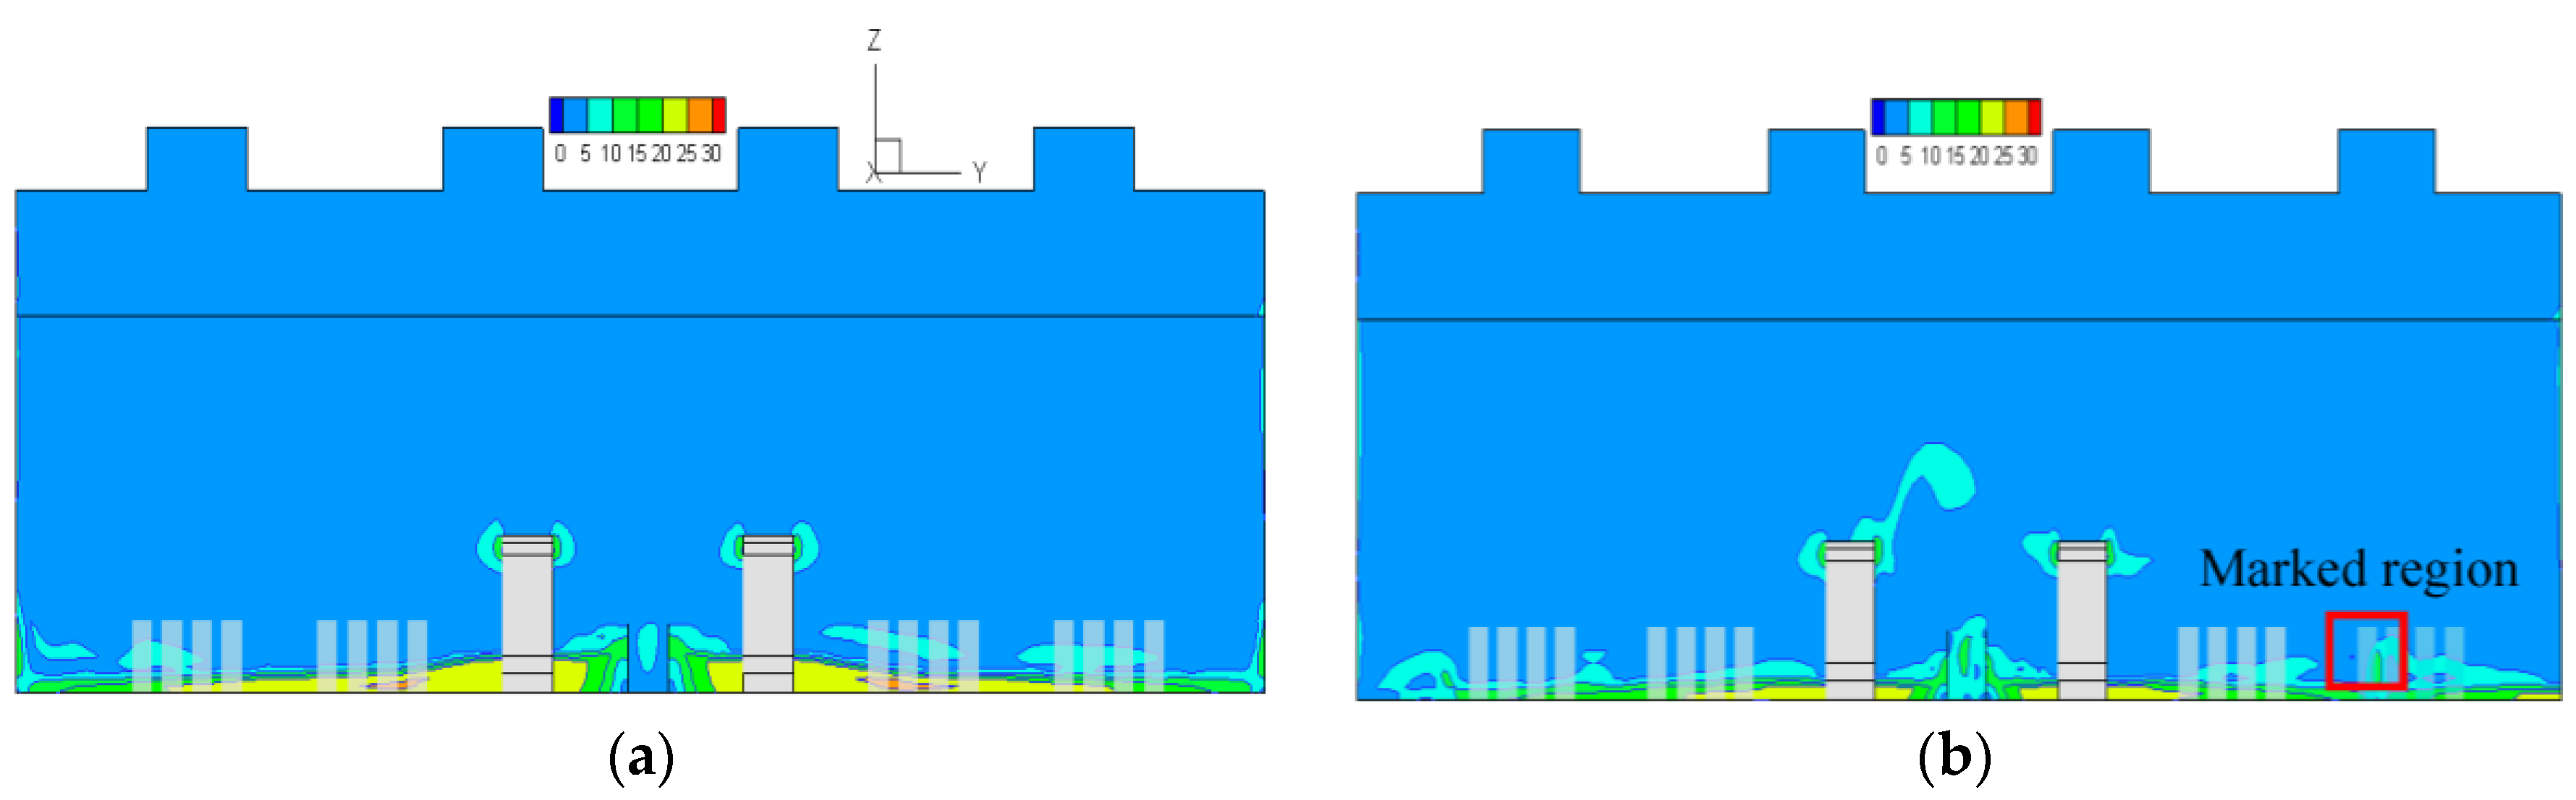
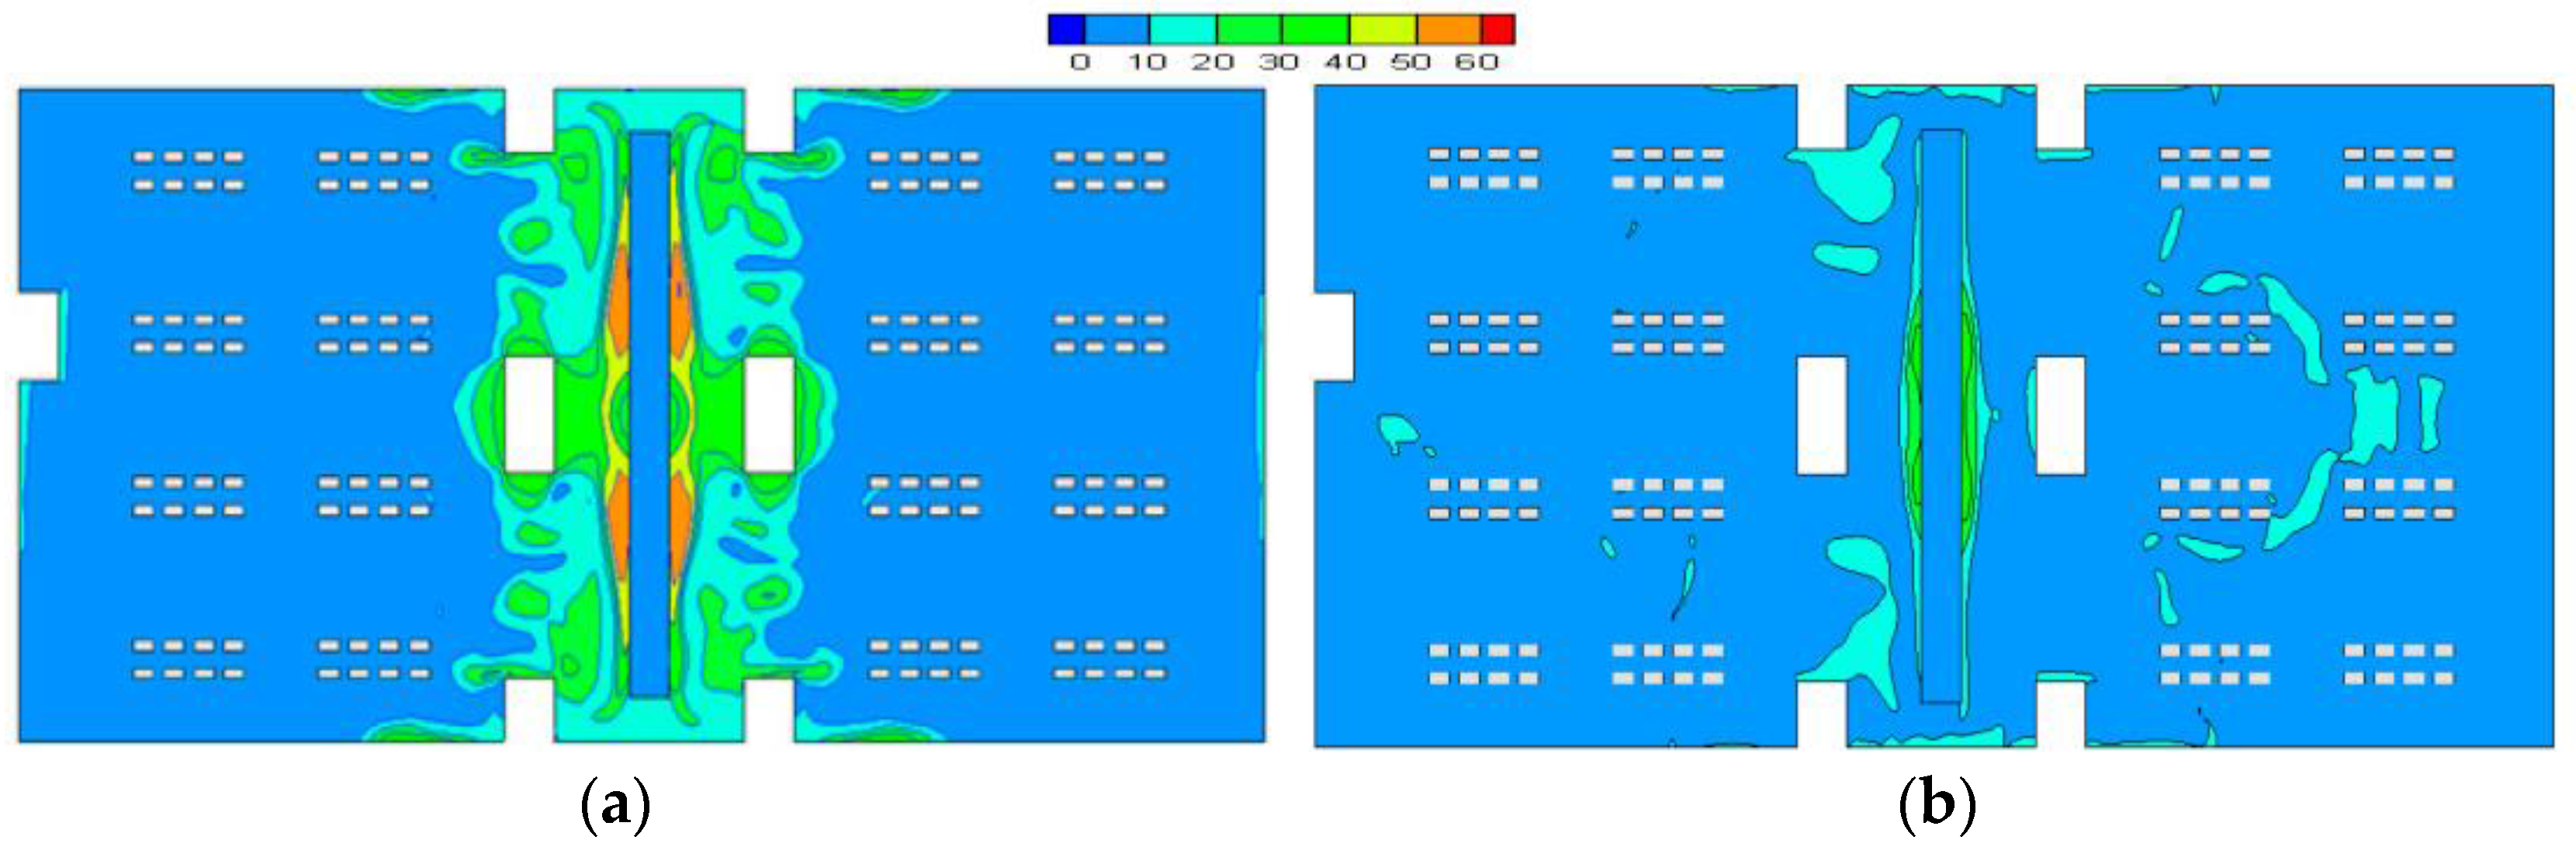
This paper investigated the effect of diffuser layouts on the energy performance of STRAD systems. The theoretical analysis indicates that the cooling coil load of STRAD systems is associated with, but not totally dependent on, the space cooling load. The cooling coil load is directly proportional to the return air temperature, while inversely proportional to the exhaust air temperature. The higher the exhaust air temperature, the lower the return air temperature and the smaller the cooling coil load. Two evaluation indices, namely the absolute energy saving potential and the relative energy saving potential, are developed in this paper, which could be used to assess the energy performance of STRAD systems with different designs. The numerical study demonstrated that by decreasing the return grille height while keeping the exhaust grille at ceiling level, the exhaust air temperature increased and the return air temperature decreased. Corresponding to that, the energy efficiency of STRAD systems is able to be further improved, which is much more prominent for building spaces with high space heights. Based on the simulation results, it is recommended that, for buildings with small spaces, the return grille should be located at a low occupied zone, in to obtain further energy saving for the cooling coil. Special attention should be paid on the “short-circuit” of cold supply air to avoid an overheating phenomenon of the space. For spaces with large horizontal span, the supply diffuser is suggested to be installed uniformly surrounding the occupied zone to improve the energy performance of STRAD systems. Whereas, installing the return diffuser at exterior walls should be avoided, since the development of thermal plumes along with exterior walls would be deteriorated by the induced function of return diffuser. What is notable in this paper is that only the energy efficiency of STRAD systems was discussed. For a well-designed STRAD system, satisfying performance in thermal comfort and indoor air quality should also be achieved simultaneously.

Acknowledgments

The authors appreciated the financial support from the National Natural Science Foundation of China (No. 51408391).

Author Contributions

Yuanda Cheng is responsible for most of the work, including the numerical simulations and the analysis based on results, Yuanda Cheng and Jinming Yang designed the study and revised the manuscript, and Zhenyu Du and Jinqing Peng provided valuable academic suggestions.

Conflicts of Interest

The authors declare no conflict of interest.

References

  1. ASHRAE Standard 62.1. Ventilation for Acceptable Indoor Air Quality; American Society of Heating Refrigerating and Air-Conditioning Engineers: Atlanta, GA, USA, 2010. [Google Scholar]
  2. Lin, Z.; Lee, C.K.; Fong, S.; Chow, T.T.; Yao, T.; Chan, A.L.S. Comparison of annual energy performances with different ventilation methods for cooling. Energy Build. 2011, 43, 130–136. [Google Scholar] [CrossRef]
  3. Tian, L.; Lin, Z.; Wang, Q.W. Comparison of gaseous contaminant diffusion under stratum ventilation and under displacement ventilation. Build. Environ. 2010, 45, 2035–2046. [Google Scholar] [CrossRef]
  4. Bauman, F. Underfloor Air Distribution (UFAD) Design Guide; ASHRAE: Atlanta, GA, USA, 2003. [Google Scholar]
  5. Awbi, H.B. Energy efficient room air distribution. Renew. Energy 1998, 15, 293–299. [Google Scholar] [CrossRef]
  6. Hu, S.P.; Chen, Q.Y.; Glicksman, L. Comparison of energy consumption between displacement and mixing ventilation systems for different U.S. buildings and climates. ASHRAE Trans. 1999, 105, 453–464. [Google Scholar]
  7. Int-Hout, D. Pressurized Plenum Access Floor—Design Manual; Carrier: Farmington, CT, USA, 2001. [Google Scholar]
  8. Xu, H.T.; Niu, J.L. Numerical procedure for predicting annual energy consumption of the under-floor air distribution system. Energy Build. 2006, 38, 641–647. [Google Scholar] [CrossRef]
  9. Olivieri, J.B.; Singh, T. Effect of supply and return air outlets on stratification/energy consumption. ASHRAE Trans. 1982, 88, 188. [Google Scholar]
  10. Gordon, R.L.; Bagheri, H.M. Verification of Stratified Air Condition Design; ASHRAE Report D-RP-388; ASHRAE: Nashville, TN, USA, 1987. [Google Scholar]
  11. Lam, J.C.; Chan, A.L.S. CFD analysis and energy simulation of a gymnasium. Build. Environ. 2001, 36, 351–358. [Google Scholar] [CrossRef]
  12. Awad, A.S.; Calay, R.K.; Bardran, O.O.; Holdo, A.E. An experimental study of stratified flow in enclosures. Appl. Therm. Eng. 2008, 28, 2150–2158. [Google Scholar] [CrossRef]
  13. Filler, M. Best practices for underfloor air systems. ASHRAE J. 2004, 46, 39–46. [Google Scholar]
  14. Lau, J.; Niu, J.L. Measurements and CFD simulation of the temperature stratification in an atrium using a floor level air supply method. Indoor Built Environ. 2003, 12, 265–280. [Google Scholar] [CrossRef]
  15. Alajmi, A.; EI-Amer, W. Saving energy by using under-floor-air-distribution (UFAD) system in commercial buildings. Energy Convers. Manag. 2010, 51, 1637–1642. [Google Scholar] [CrossRef]
  16. Hashimoto, Y.; Yoneda, H. Numerical study on the influence of a ceiling height for displacement ventilation. In Proceedings of the 11th International IBPSA Conference, Glasgow, Scotland, UK, 27–30 July 2009; pp. 1045–1052.
  17. Cheng, Y.D.; Niu, J.L.; Gao, N.P. Stratified air distribution systems in a large lecture theatre: A numerical method to optimize thermal comfort and maximize energy saving. Build. Environ. 2012, 55, 515–525. [Google Scholar] [CrossRef]
  18. Gilani, S.; Montazeri, H.; Blocken, B. CFD simulation of stratified indoor environment in displacement ventilation: Validation and sensitivity analysis. Build. Environ. 2016, 95, 299–313. [Google Scholar] [CrossRef]
  19. Gilani, S.; Montazeri, H.; Blocken, B. CFD simulation of temperature stratification for a building space: Validation and sensitivity analysis. In Proceedings of the 13th Conference of the International Building Performance Simulation Association, BS2013, Chambéry, France, 26–28 August 2013; pp. 511–540.
  20. Cheng, Y.D.; Niu, J.L.; Liu, X.P.; Gao, N.P. Experimental and Numerical investigations on stratified air distribution systems with special configuration: Thermal comfort and energy saving. Energy Build. 2013, 64, 154–161. [Google Scholar] [CrossRef]
  21. Zhang, H.; Arens, E.; Huizenga, C. Thermal sensation and comfort models for non-uniform and transient environments: Part II: Local comfort of individual body parts. Build. Environ. 2010, 45, 389–398. [Google Scholar] [CrossRef]
Figure 1. Schematic diagrams of (a) STRAD system with combined exhaust/return grilles; (b) STRAD system with separate locations of exhaust/return grilles.
Sustainability 08 00732 g001
Figure 2. Geometrical model for typical small office room. 1—Computer; 2—Printer; 3—Thermal manikin; 4—Supply diffuser; 5—Lighting; 6—Exhaust grille; 7—Exterior wall; 8—Exterior window; 9—Return grille.
Sustainability 08 00732 g002
Figure 3. (a) Schematic diagram of the classroom model in the simulation cases; (b) Side view of different air supply locations.
Sustainability 08 00732 g003
Figure 4. Geometry model of the terminal building. 1—Diffuser grilles; 2—Diffuser grilles; 3—Diffuser grilles; 4—Diffuser grilles; 5—Air conditioning units; 6—Moving sidewalk; 7—Information desk; 8—Entrance; 9—Occupants; 10—Lighting panels; 11—Skylights; 12—Exhaust grilles; 13—Facilities; 14—Facades.
Sustainability 08 00732 g004
Figure 5. (a) Grids distribution around the head; (b) Mesh generation of the small office.
Sustainability 08 00732 g005
Figure 6. Heat flux of body segments in cases with different mesh spaces.
Sustainability 08 00732 g006
Figure 7. Temperature and velocity distributions at Plane X = 1.5 m in Case 1-7.
Sustainability 08 00732 g007
Figure 8. Temperature and velocity distributions at Plane X = 1.5 m in Case 1-1.
Sustainability 08 00732 g008
Figure 9. Thermal comfort for local body parts and whole body with different heights of return grilles.
Sustainability 08 00732 g009
Figure 10. The temperature and velocity distributions at Plane X = 5.6 m in (a) Case 3-1 and (b) Case 3-3.
Sustainability 08 00732 g010
Figure 11. The draft risk values at Plane X = 5.6 m in Case 1 and Case 3. (a) Case 3-1 and (b) Case 3-3.
Sustainability 08 00732 g011
Figure 12. PPD values at Plane Z = 0.6 m in Case 1 and Case 3. (a) Case 3-1 and (b) Case 3-3.
Sustainability 08 00732 g012
Table 1. Different simulation cases for the small office.
Simulation CasesHr 1/mVs 2/L·s−1Ts 3/°CVr 4/L·s−1
Case 1-12.612018100
Case 1-22.3
Case 1-32.0
Case 1-41.7
Case 1-51.3
Case 1-60.8
Case 1-70.3
1 Hr—Height of return inlet (the height is from floor level to the bottom edge of the return grille), m; 2 Vs—The supply air flow rate of the stratified air distribution system, L/s; 3 Ts—The supply air temperature of the stratified air distribution system, °C; 4 Vr—The return air flow rate of the stratified air distribution system, L/s.
Table 2. Simulation cases with different return grille height.
Simulation CasesHr/mVs/L·s−1Ts/°CVr/L·s−1
Case 2-12.856518206
Case 2-22.0
Case 2-31.1
Case 2-40.3
Note: Meanings of parameters listed in this table are same as that in Table 1.
Table 3. The diffuser layouts in different simulation cases.
Simulation CaseSupply GrilleReturn GrilleVs/L·s−1Vr/L·s−1
Case 3-11221301555
Case 3-214
Case 3-31 & 32
Case 3-41 & 34
Case 3-51 & 32 & 4
Note: Meanings of parameters listed in this table are same as that in Table 1.
Table 4. Boundary settings of heat sources in different simulation cases.
Simulation ModelBoundary Settings of Heat Sources
Small officeFixed heat flux:Computers 113.6 W/m2; Lightings 100 W/m2; Printer 151.5 W/m2; Exterior wall/windows 38.9 W/m2
Fixed temperature:Detailed human body 307 K
Terraced classroomFixed heat flux: Lightings 70.8 W/m2; Simple human body 40.3 W/m2
Fixed temperature:Detailed human body 307 K
Terminal buildingFixed heat fluxMoving sidewalk 103 W/m2; Facilities 33.9 W/m2; Lighting 76.2 W/m2; Exterior walls 29 W/m2; Skylights 19 W/m2; Simple human body 40.3 W/m2
Table 5. Energy saving for STRAD systems with different diffuser locations in the small office.
Simulation CasesHr/mTr 1/°CTe 2/°C Δ Q c o i l /W Δ Q c o i l / Q S p a c e /%
1-12.625.124.8−4.8−0.5%
1-22.324.925.12.40.2%
1-32.024.826.1272.6%
1-41.724.627.0484.7%
1-51.324.228.8928.9%
1-60.823.630.914214.0%
1-70.322.532.317617.3%
1 Tr—The return air temperature, °C; 2 Te—The exhaust air temperature, °C.
Table 6. Energy saving for STRAD systems with different return grille heights in the lecture theatre.
Simulation CasesHr/mTr/°CTe/°C Δ Q c o i l /W Δ Q c o i l / Q S p a c e /%
2-14.825.925.878614.8%
2-242525.983015.6%
2-33.124.626.296118.1%
2-42.323.926.6113621.4%
Note: Meanings of variables are the same as that in Table 5.
Table 7. Energy saving for STRAD systems with different diffuser locations in the terminal building.
Simulation CasesTr/°CTe/°C Δ Q c o i l /W Δ Q c o i l / Q S p a c e /%
3-124.930.5409416.8%
3-22530.4402016.5%
3-324.731.8504720.8%
3-424.930.6417617.2%
3-524.930.7427317.6%
Note: Meanings of variables are the same as that in Table 5.

